Article

Design and Validation of a Deep Learning Model for Renal Stone Detection and Segmentation on Kidney–Ureter–Bladder Images

1
Department of Electrical Engineering, National Kaohsiung University of Science and Technology, Kaohsiung City 807618, Taiwan
2
Department of Urology, Kaohsiung Chang Gung Memorial Hospital and Chang Gung University College of Medicine, Kaohsiung City 83301, Taiwan
*
Author to whom correspondence should be addressed.
Bioengineering 2023, 10(8), 970; https://doi.org/10.3390/bioengineering10080970
Submission received: 27 June 2023 / Revised: 11 August 2023 / Accepted: 13 August 2023 / Published: 16 August 2023
(This article belongs to the Special Issue Recent Progress in Biomedical Image Processing)

Abstract

:
Kidney–ureter–bladder (KUB) imaging is used as a frontline investigation for patients with suspected renal stones. In this study, we designed a computer-aided diagnostic system for KUB imaging to assist clinicians in accurately diagnosing urinary tract stones. The image dataset used for training and testing the model comprised 485 images provided by Kaohsiung Chang Gung Memorial Hospital. The proposed system was divided into two subsystems, 1 and 2. Subsystem 1 used Inception-ResNetV2 to train a deep learning model on preprocessed KUB images to verify the improvement in diagnostic accuracy with image preprocessing. Subsystem 2 trained an image segmentation model using the ResNet hybrid, U-net, to accurately identify the contours of renal stones. The performance was evaluated using a confusion matrix for the classification model. We conclude that the model can assist clinicians in accurately diagnosing renal stones via KUB imaging. Therefore, the proposed system can assist doctors in diagnosis, reduce patients’ waiting time for CT scans, and minimize the radiation dose absorbed by the body.

1. Introduction

Current research indicates a global increase in the incidence of renal stones, as observed in various studies conducted worldwide (including Italy, Germany, Scotland, Spain, Sweden, Japan, and the United States) [1,2,3]. Several diagnostic and treatment approaches have been proposed to address the growing prevalence of renal stones.
X-rays are low-cost and low-radiation imaging modalities that are widely used in various stutabledies for computer-aided diagnosis (CAD) development, including chest X-rays for COVID-19 detection with DL models [4], breast X-rays for detecting breast cancer [5], and abdominal X-rays for assisting in the diagnosis of muscle coordination disorders [6]. In this study, X-ray kidney–ureter–bladder (KUB) images were used (Figure 1). In this figure, the white area inside the red frame is a urinary tract stone, as a specialist would diagnose. KUB imaging has a few limitations, including its two-dimensional nature, which may lead to false positives and make it difficult to distinguish between abnormalities in high-density tissues [7]. The sensitivity of KUB imaging in detecting renal stones ranges from 44 to 77%, with a specificity of 80–87% [8], whereas computed tomography (CT) has a sensitivity of 94–100% and a specificity of 92–94.2% [9,10]. Noncontrast CT is the most accurate imaging modality for kidney stones owing to high sensitivity, specificity, accurate stone sizing, and the ability to evaluate non-stone-related pathologies [11].
CT is commonly used for whole-body screening to detect tumors or inflammation in organs and is highly reliable for diagnosing diseases such as liver, lung, and brain cancers [9,10]. Several studies have focused on various CT examinations, including deep learning (DL)-based detection of hemorrhagic lesions on brain CT images and segmentation [12], and distinguishing COVID-19 severity by analyzing the lung opacity on chest CT images [13]. Abdominal CT exhibits higher sensitivity than conventional radiography in detecting calcifications and promptly diagnosing urinary tract stones, while also being able to detect uric acid or cystine stones unaffected by obstruction [14]. Furthermore, CT imaging can assist clinicians in accurately diagnosing patients with symptoms arising from factors such as inflammation in the abdominal cavity, vascular abnormalities, or urinary system tumors [4]. CT imaging provides a three-dimensional (3D) visualization of the urinary system, including the kidneys, ureters, and bladder, enabling clinicians to promptly understand the patient’s condition. In most cases, noncontrast computerized tomography (CT) is recommended for diagnosing ureteral stones; a low-energy protocol is suggested if the patient’s body habitus is favorable. Conventional radiography and ultrasound are utilized to monitor the passage of the majority of radiopaque stones, as well as for most patients undergoing stone removal. [15]
However, CT is more expensive and produces higher radiation doses than X-ray imaging. For adult abdominal X-ray examinations, the radiation dose of CT in the same area ranges from 8 to 34 mGy [16,17], whereas that of X-rays is approximately 2.47 mGy [18]. Additionally, in other areas, such as the stomach, the radiation dose of CT is approximately 50 times higher than that of X-rays [19]. These factors pose a risk to human health. In recent years, several clinical techniques were developed to address these issues, including low-dose CT, which reduces the radiation dose produced during a routine CT scan. For example, the radiation dose of abdominal CT scans has been reduced from 25 to 17 mGy. However, even with low-dose CT, the radiation dose is still approximately seven times higher than that of X-rays [20]. Considering these challenges, X-ray imaging has emerged as a low-cost and low-radiation examination method with minimal impact on human health. Nevertheless, compared with CT, X-rays have lower sensitivity and are less effective in detecting smaller renal stones. Therefore, improving the sensitivity of radiography for diagnosing renal stones could lead to wider application and effectively reduce medical costs.
Recently, the rapid development of machine learning and artificial intelligence has facilitated the application of CAD in medical image processing. The exceptional performance of convolutional neural networks (CNNs) in learning and computation across various domains [21,22,23,24] has led to their widespread adoption in CAD. The accuracy of CAD models incorporating CNNs has gradually improved over time [25,26]. Recent studies have applied neural networks to diagnose urinary system diseases using CT imaging [27,28,29]. CNN models have exhibited a sensitivity of 89.6% and a positive predictive value of 56.9% in detecting urinary stones during X-ray examinations [30]. Liu et al. [31] combined image preprocessing and data augmentation techniques with the ResNet model to detect renal stones on KUB images, and achieved an accuracy, sensitivity, specificity, and F1-measure of 0.982, 0.964, 1.000, and 0.982, respectively.
KUB imaging remains the primary examination method for detecting urinary stones in emergency rooms owing to its convenience, affordability, and low radiation dose. However, only experienced urologists and radiologists can accurately diagnose urinary stones from KUB images. Inexperienced physicians may make errors or further prescribe CT scanning, thus increasing the medical costs and radiation exposure. Compared to deep learning, traditional image processing algorithms do not demonstrate robust generalization capabilities, mainly because of the large size of KUB images and the small dimensions of kidney stones. Furthermore, conventional approaches face challenges when effectively detecting irregular features. To address this issue, we developed a CAD system based on a DL model to assist emergency physicians in accurately diagnosing urinary stones based on KUB imaging. The system was validated through experimental data and specialist evaluations.

2. Materials and Methods

2.1. Molecular Structure of Renal Stones

Renal stones consist of urinary solutes (such as calcium oxalate and uric acid) in an unstable supersaturation state (including hypercalciuria, hyperoxaluria, and hyperuricosuria) due to imbalances between the promoters and inhibitors of stone formation. Renal stone formation occurs in four phases: nucleation, crystal growth, aggregation, and retention [32]. Finally, these stones remain in the collecting system of the kidneys and migrate to the urinary tract. Larger renal stones that cannot pass through the body may cause various health problems, including hematuria, renal colic pain, urinary tract infection, hydronephrosis, and renal function impairment.
The primary classifications of renal stones with their molecular formula and occurrence are listed as follows [32]:
  • Calcium (Ca)-containing stones:
Calcium oxalate, CaC2O4 (H2O)2 or CaC2O4H2O (60%)
Hydroxyapatite, Ca10(PO4)6(OH)2 (20%)
Brushite, CaHPO4·(H2O)2 (2%)
  • Non-calcium-containing stones:
Uric acid, C5H4N4O3 (7%)
Struvite, NH4MgPO4·(H2O)6 (7%)
Cystine, C6H12N2O4S2 (1–3%)
Ca-containing stones represent the majority of renal stones, making it theoretically possible to detect most renal stones using X-ray imaging. KUB imaging, a rapid and cost-effective X-ray imaging technique, is an ideal first-line examination for renal stone detection.

2.2. Datasets

We collected 485 abdominal radiographs of patients diagnosed with upper urinary tract stones by urologists at Kaohsiung Chang Gung Memorial Hospital. Owing to the varying lengths of the follow-up, each patient had KUB images taken at different times, and some KUB images contained multiple urinary tract stones; therefore, they were divided into single or multiple training images with urinary tract stones (Figure 2).

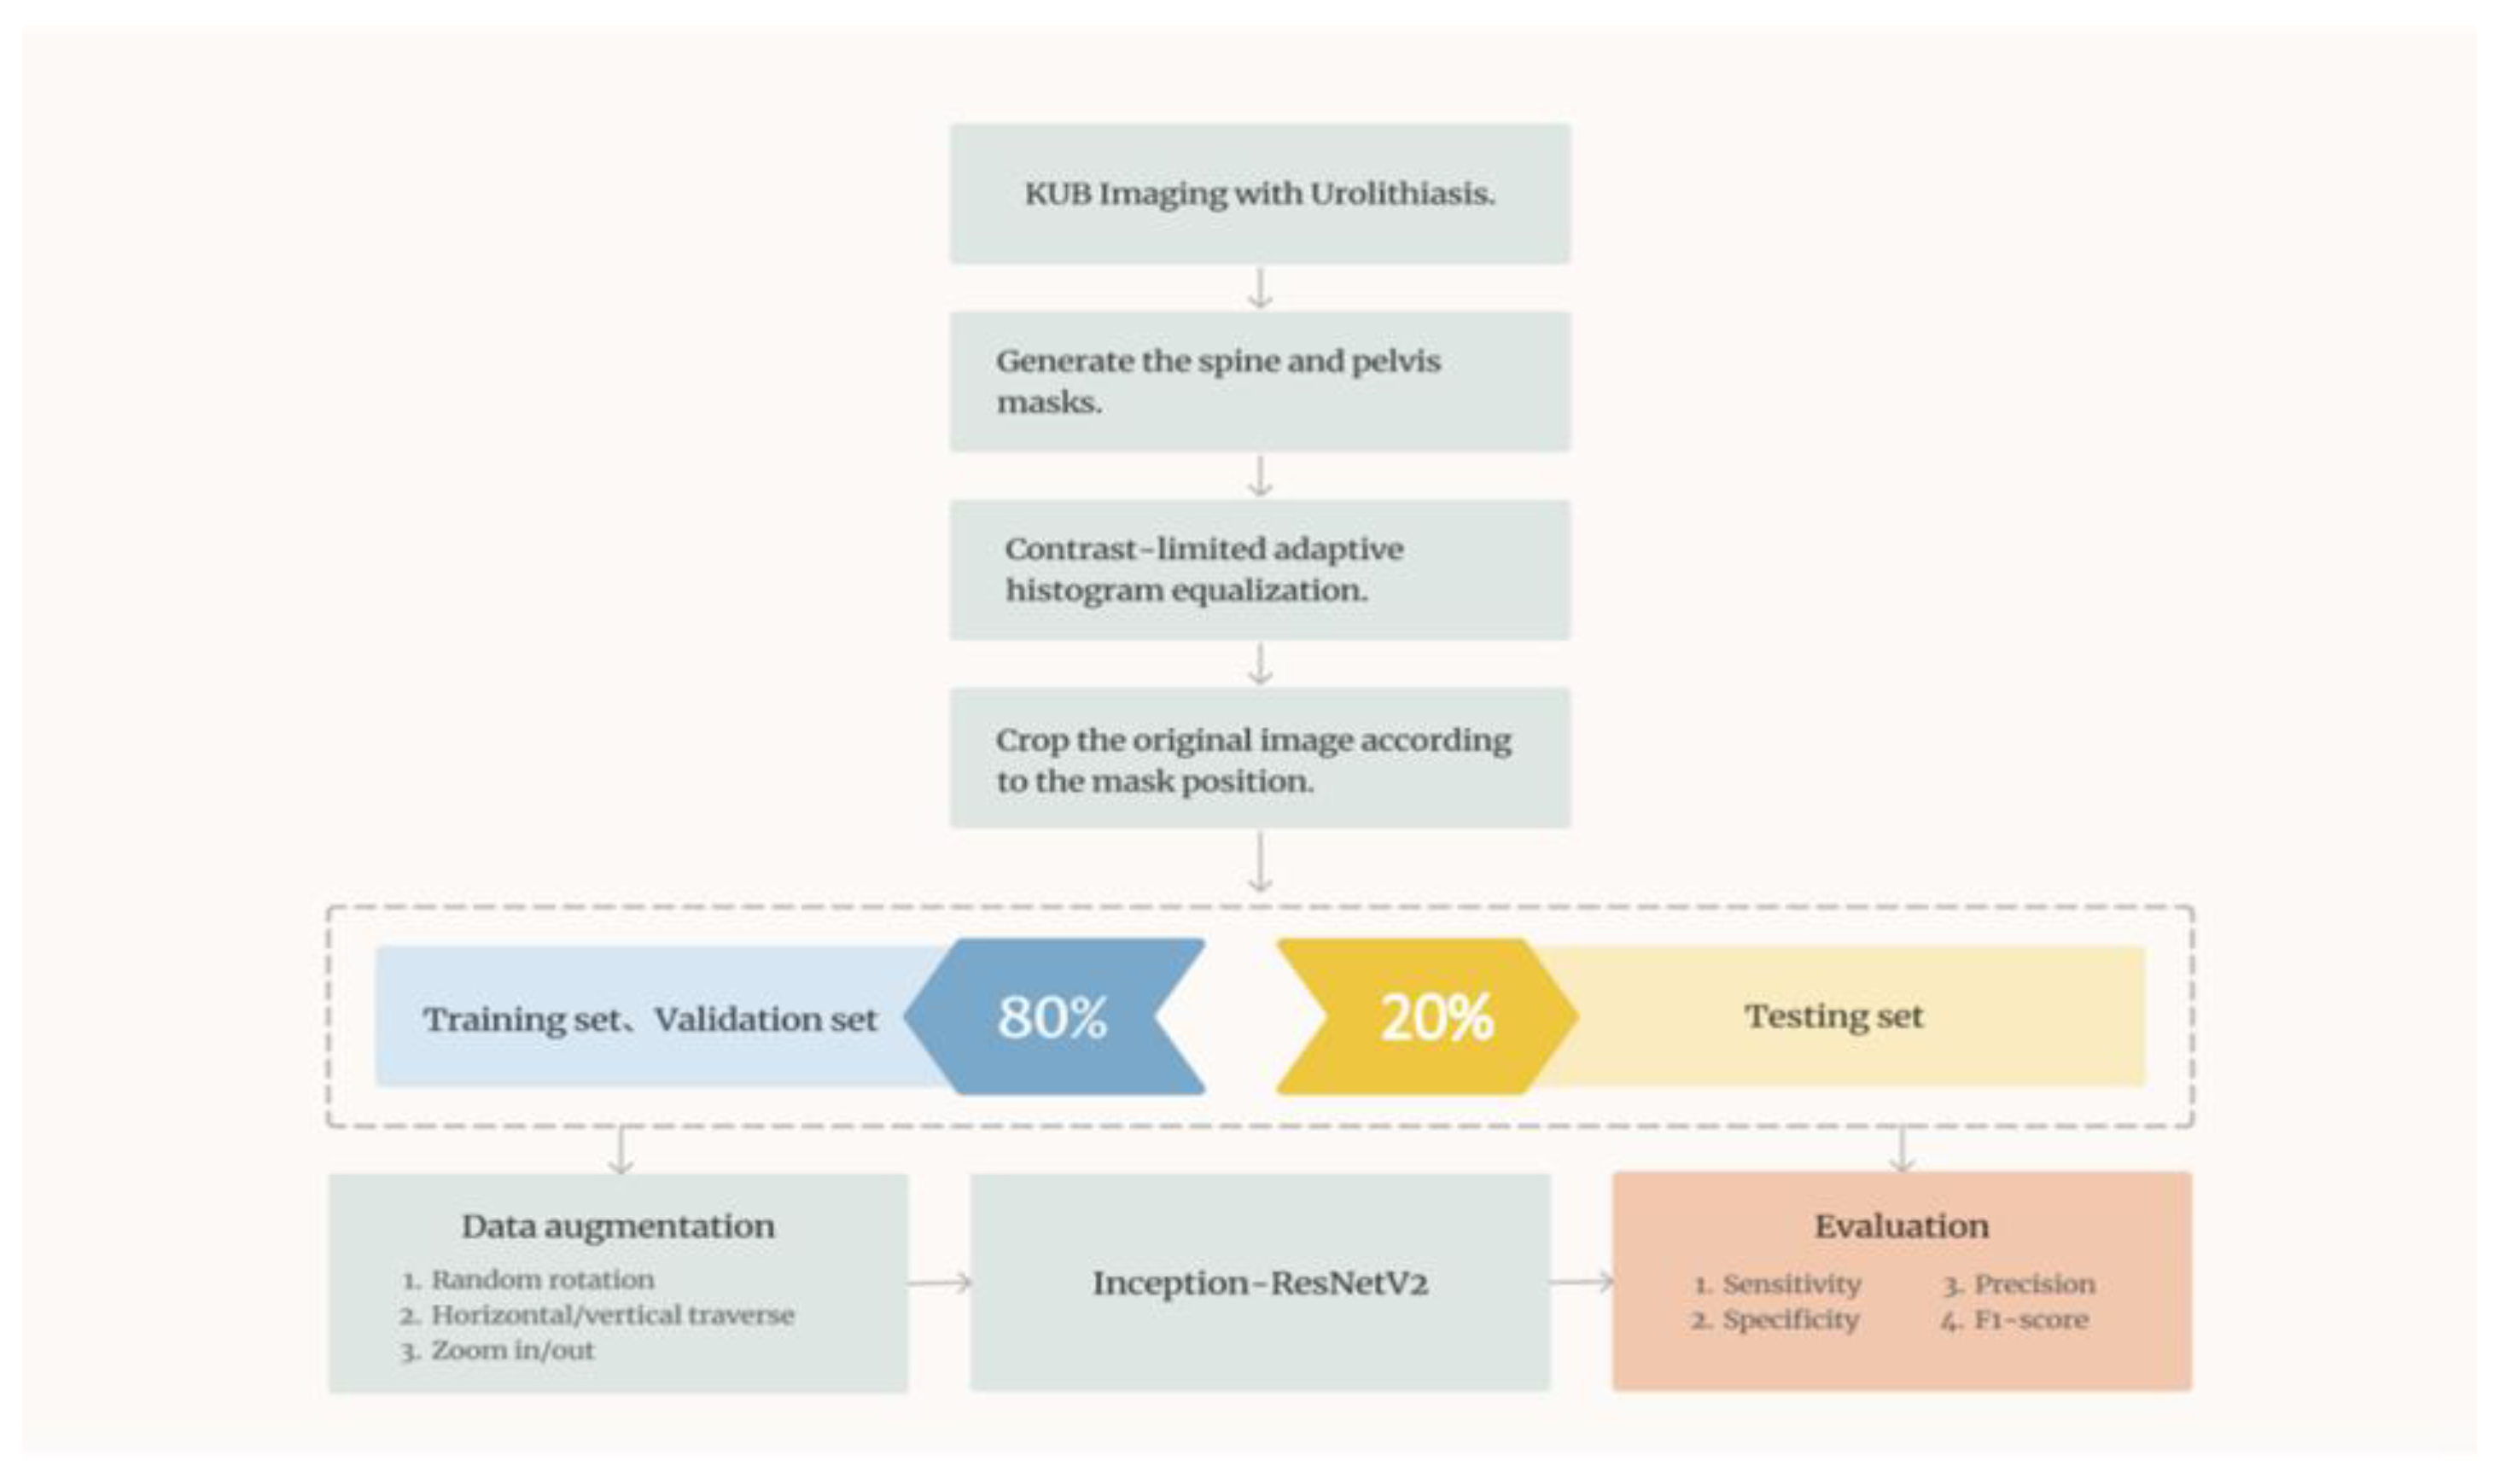
2.3. Image Preprocessing

2.3.1. Contrast-Limited Adaptive Histogram Equalization

Histogram equalization (HE) [33] enhances image contrast and suppresses noise. Adaptive histogram equalization (AHE) [34] further enhances local contrast by dividing the image into multiple regions and applying HE to each region. However, AHE can cause image distortion due to excessive enhancement of local contrast and does not address noise amplification in dark areas. Contrast-limited AHE (CLAHE) [35] avoids discontinuities and excessive local contrast caused by AHE by controlling the slope of the cumulative density function (CDF). An abrupt increase in the slope of the CDF indicates a high grey value in the region, whereas a decrease indicates a low grey value. CLAHE limits gray values that exceed a certain threshold and redistributes them to various gray levels, resulting in a smoother CDF that can be efficiently calculated using linear interpolation. This method effectively suppresses noise and enhances the contrast between the urinary stone and the background, making it particularly useful for images with very dark or bright backgrounds. CLAHE is widely used in medical imaging [36,37,38].
Figure 3 illustrates several areas in the histogram-equalized image that are already overexposed, particularly high-density areas such as bones, which are prominent. Figure 4 shows AHE with an 8 × 8 mask, which increases the local details; however, inconsistency between the blocks causes pixel discontinuity in the entire image. Figure 5 depicts AHE with a 16 × 16 mask, where the pixel discontinuity is even more obvious. Contrast-limited AHE reduces overexposure in the histogram-equalized image and does not cause pixel discontinuity, resulting in a square-like appearance of the image and enabling observation of urinary stones on the image (Figure 6). Therefore, we applied this method to KUB images in this study.

2.3.2. Image Mask

Figure 7 illustrates the original KUB image. First, all KUB images were processed using an image segmentation network model, Mask R-CNN [39], which was trained to detect the spine and pelvis [40] to generate masks that block most of the bright areas in the KUB images (Figure 8). The images were then segmented about the central point of the spine and upper pelvis on both sides (Figure 9, Figure 10 and Figure 11), respectively. Masks were used for segmentation because abnormalities are difficult to detect in high-density tissues on X-ray images; the higher the density of the tissue, the brighter it appears on the image [7].

2.3.3. Image Cropping

A 100 × 100-pixel image was cropped from the KUB image. An image with urinary tract stones was positioned at the center of the image. Cropped images without urinary tract stones were randomly selected from the KUB images, as illustrated in Figure 12. Based on a 100 × 100-pixel image, we introduced the concept of a sliding window for real-world applications. A sliding window is used to capture the presence of stones in the image. If stones were detected in the cropped image, we would map them back to the original KUB image and obtained their location. Once the full-image scan was complete, we extracted the image based on these specific locations and performed mask detection using the segmentation model. After mask detection was complete, we merged it back with the original image via mapping and positioning, thereby obtaining a complete KUB stone mask image.

2.4. Data Augmentation

Studies have shown that data augmentation can effectively prevent overfitting of the model, with the probability of overfitting in small datasets during training being higher than in large datasets [41,42,43,44]. However, there are multiple fields in which large amounts of data are not available for research, such as medical image analysis. Studies on medical image analysis have used more than 4000–5000 images for training [45,46,47,48]; however, in the field of DL, this is still considered a small dataset. Therefore, data augmentation can be used to increase the variation in images, which not only avoids the problem of low accuracy due to insufficient data but also increases the diversity of samples and improves the generalization ability of the model [49,50,51].
To increase the amount and diversity of data, random angle rotation, horizontal and vertical displacements, and flipping were applied to the original images (Figure 13) [52]. In this study, random data augmentation was applied to the training dataset during each iteration. When the augmented images were generated first and then used for model training, all data were written into the memory before training. However, by dynamically generating augmented image data during the iteration, only the original image data were read, which reduced memory consumption.

2.5. Deep Learning Model

2.5.1. Residual Network

Previous studies have shown that the deeper the CNN, the finer the features it can extract [53]. However, in 2016, Kaiming discovered that the model’s performance decreased and experienced degradation when the network layer became excessively deep [54]. To solve this problem, they proposed a network structure called ResNet, which introduced the concept of a residual block. The residual block copies the output of the source layer directly to the shortcut connection and adds it to the output of the main framework, as illustrated in Figure 14. If the layers in the residual block do not learn any features, the output of the block is the same as the input; this is called identity mapping. Residual blocks address the problem of model degradation caused by overly deep networks, allowing the number of network layers to increase.

2.5.2. Inception-ResNetV2

In 2016, Google proposed Inception-ResNetV2 as an improved version of Inception-ResNetV1 [55], which achieved the best performance in the ILSVRC image classification benchmark test [56]. The core concept of Inception-ResNetV2 is to combine inception modules and residual direct connections using residual connection shortcuts to successfully train deeper neural networks while significantly simplifying inception modules. As indicated in Figure 15, the structure of Inception-ResNetV2 is divided into several parts: Stem, Inception-Resnet-A, Reduction-A, Inception-Resnet-B, Reduction-B, and Inception-Resnet-C. The A, B, and C modules use asymmetric convolutional layers and 1 × 1 convolutional layers to reduce or unify dimensions, and modules A and B are designed to gradually reduce the size of the feature map to avoid the loss of related information. By combining the above modules, Inception-ResNetV2 can achieve a deep network architecture without encountering the problems of gradient disappearance and can converge better. Recently, Inception-ResNetV2 has been increasingly used for medical image recognition. For example, a previous study [57] explored the application of Inception-ResNetV2 for brain tumor detection. Other studies have also implemented Inception-ResNetV2 in various applications, such as skin lesion classification methods [58,59] and benchmark testing for aortic pathology analysis [60].

2.5.3. U-Net

Proposed in 2015, U-Net is widely used in medical image segmentation owing to its unique structure [61] (Figure 16). The structure of U-Net can be conceptualized as an encoder–decoder structure. The encoder comprises four sub-modules, each containing two convolutional layers, followed by a max pooling layer for downsampling. These modules gradually decrease the resolution of the image. The decoder is comprised of four sub-modules that progressively upsample the image resolution until it matches the input image resolution. U-Net also adopts the technique of skip connections, which connects the upsampled results of the decoder with the outputs of the encoder submodules of the same resolution as the input to the next submodule. The feature concatenation is unique as it concatenates the features in the channel dimension to form thicker features, thus avoiding information loss during feature propagation. Several improved versions based on U-Net are available, such as 3D U-Net [62], which is used for the segmentation of 3D images; Res-UNet [63], which combines the concept of ResNet using residual blocks instead of convolutional layers; and ResUnet++ [64], which introduces attention modules [65] and ASPP modules [66].

2.6. System Architecture

In this study, we proposed a computer-aided diagnostic system consisting of two subsystems. The overall system architecture is illustrated in Figure 17. Subsystem 1 is a urinary stone classification model based on Inception-ResNetV2, which is shown in Figure 18. Subsystem 2 is a urinary-stone segmentation model based on U-Net, which is illustrated in Figure 19. The system first generated a mask to remove the spine and pelvis from the KUB images and then performed limited-contrast AHE on the images. The kidney area was approximately segmented according to the mask, and 100 × 100-pixel stone images were cropped. The dataset was divided into training and testing sets in the ratio of 8:2, and data augmentation was employed by the classification model to simulate the diversity of stone images. After training the Inception-ResNetV2 classification model, the system was evaluated using several metrics, including sensitivity, specificity, precision, and F1-measure. The architecture of the semantic segmentation model was similar to that of the classification model, except for the data augmentation component and inclusion of three additional evaluation metrics for the mask: IoU, MIoU, and FWIoU. The complete system flow for visualizing KUB images is shown in Figure 20. The flowchart of the computer-aided diagnostic system is depicted in Figure 21.

3. Results

Windows 10 was used as the operating system for testing the model; the hardware information is listed in Table 1. A Python 3.7 environment on Anaconda 3 with a Tensorflow-GPU version was used to train the neural network, which was built and trained using Keras.

3.1. Evaluation Metrics

In this study, all images were divided into three datasets, with a total of 1340 images. Among these, 970 images were used for training (80%) and validating (20%) the model; the training set contained 776 images, and the validation set 194 images. The remaining 370 images were used as the test set to evaluate the performance of the model and its generalization ability. Both subsystems used Ranger as the optimizer [67], which is an integration of two optimizers: RAdam [68] and LookAhead [69]. The loss function used in subsystem 1 was binary cross-entropy. For the semantic segmentation model, ResNet50 was used as the primary feature extractor network, and U-net utilized the features for prediction and mask generation. Ranger was used as the optimizer, and the loss function was composed of binary cross-entropy and Jaccard distance.
We generated a confusion matrix from the prediction results, which had four categories of correct and incorrect predictions. The categories for correct predictions were true positive (TP) and true negative (TN), whereas those for incorrect predictions were FP and FN. The confusion matrix is depicted in Figure 22. We used these four categories to generate seven metrics for evaluating the performance of the model. The formula for the accuracy is as follows:
A c c u r a c y = T P + T N T P + T N + F P + F N
In addition to determining the model’s accuracy, we used seven other metrics, four of which were used to evaluate the classification and semantic segmentation models: sensitivity, specificity, precision, and F1-measure. The other three metrics, IoU, MIoU, and FWIoU, were used to evaluate the quality of the predicted masks of the semantic segmentation model. The formula for sensitivity is as follows:
S e n s i t i v i t y = T P T P + F N
The formula for specificity is as follows:
S p e c i f i c i t y = T N F P + T N
The formula for precision is as follows:
P r e c i s i o n = T P T P + F P
We used the F-measure to comprehensively evaluate the performance of the model. The higher the F1-measure value, the better the performance of the model. The formula for the F1-measure is as follows:
F β m e a s u r e = ( 1 + β 2 ) P r e c i s i o n × R e c a l l ( β 2 × P r e c i s i o n ) + R e c a l l
The formula for the IoU is as follows:
I o U = T P T P + F P + F N
The formula for the MIoU is as follows:
M I o U = ( T P T P + F P + F N + T N T N + F N + F P ) / 2
The FWIoU is a modification of the MIoU in which weights are assigned based on the frequency of occurrence of each class. The formula for the FWIoU is as follows:
F W I o U = T P + F N T P + F P + T N + F N × T P T P + F P + F N

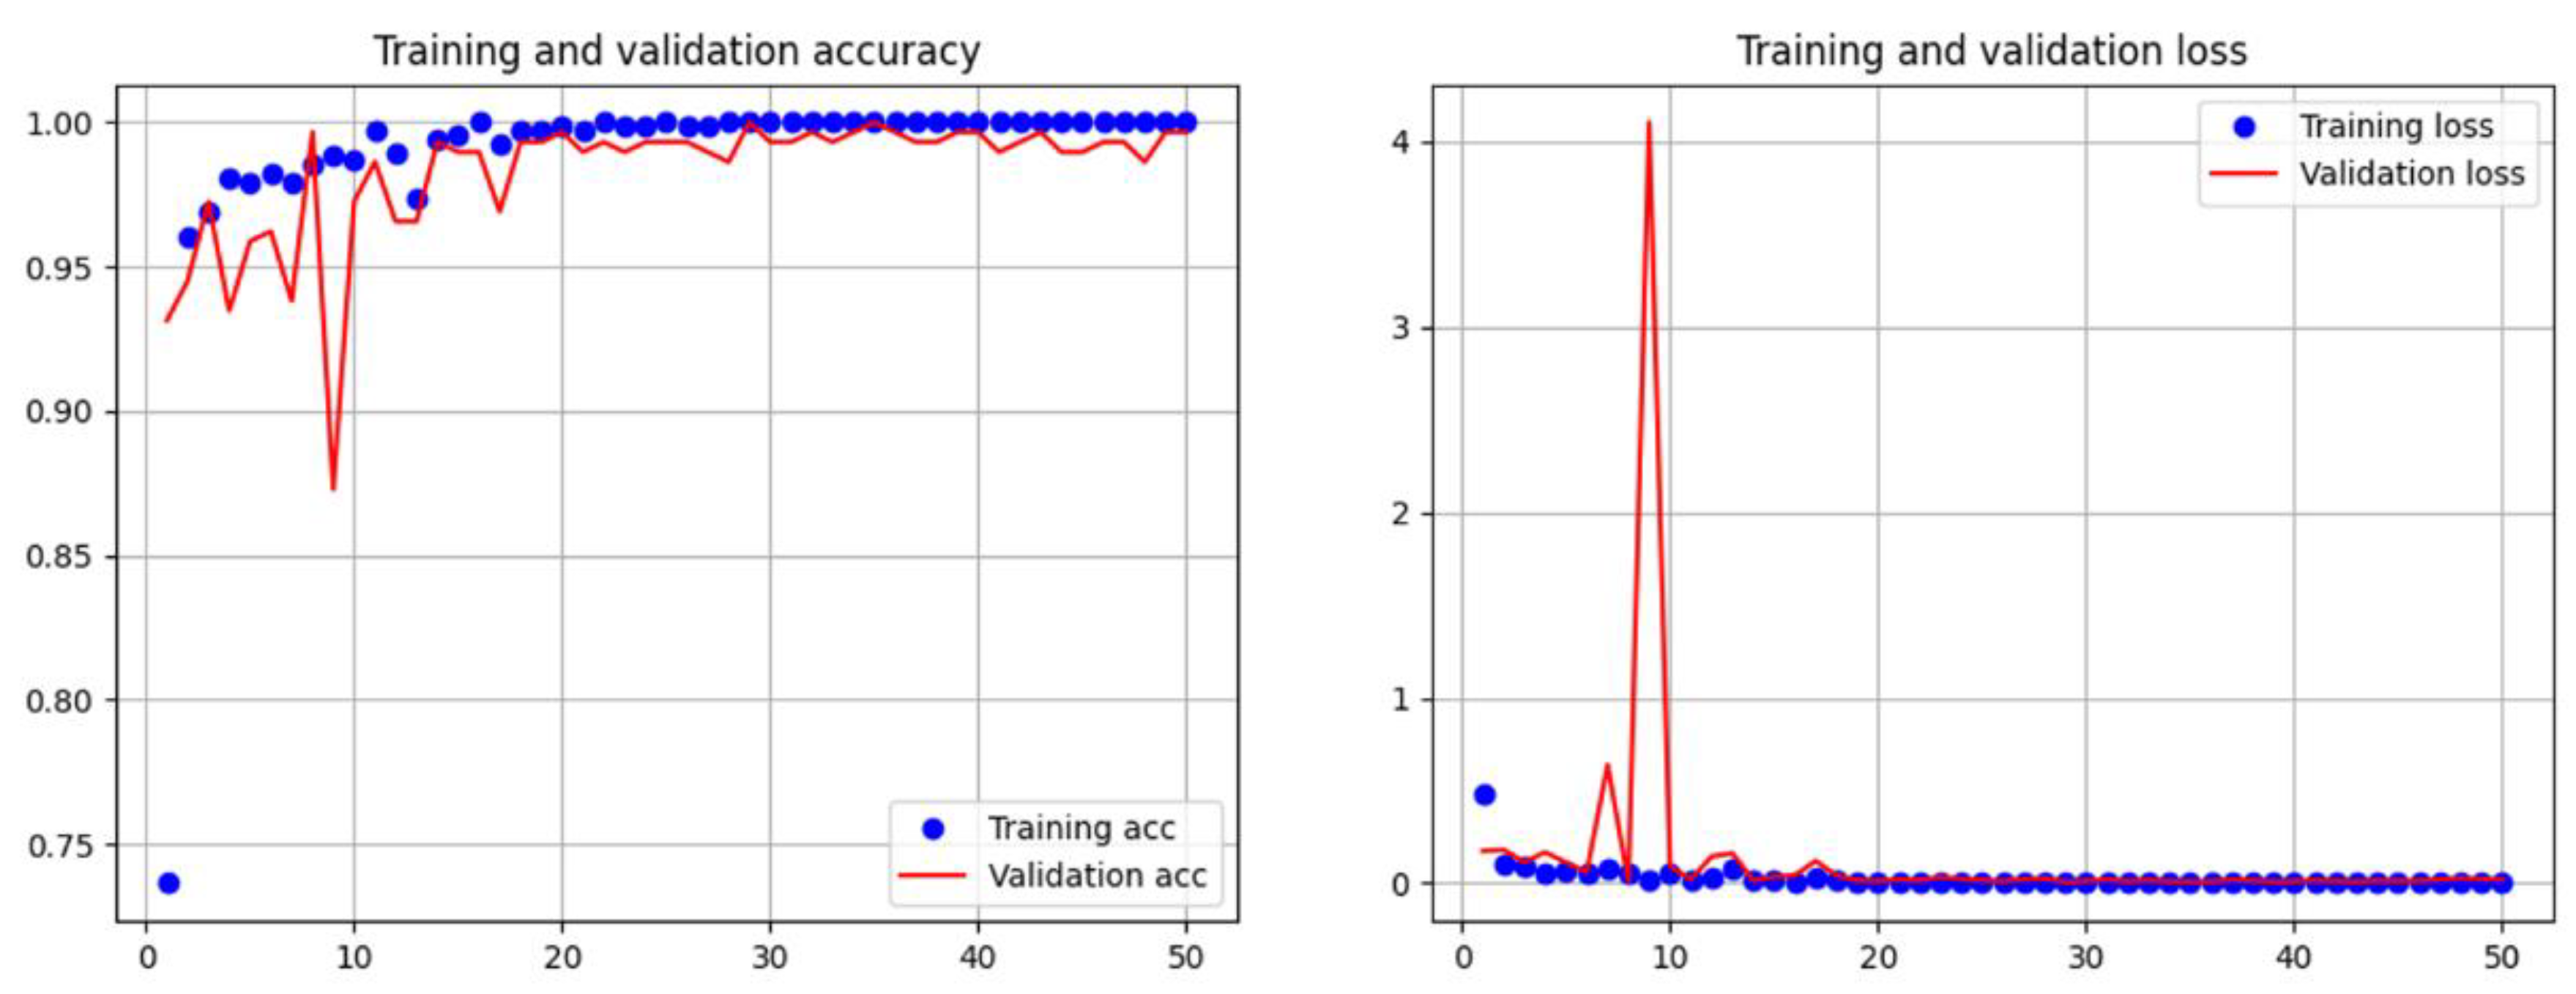
3.2. Effect of Data Augmentation on the Training of the Classification Model

In this study, ResNet50 models were trained using both augmented and nonaugmented datasets. Data augmentation was performed by rotating, horizontally and vertically shifting, and magnifying and demagnifying of the original images. The difference between the effects of using and not using data augmentation was compared based on the accuracy and loss during the training process of the ResNet50 model. Figure 23 shows the updates of accuracy and loss during the training process of the model without data augmentation. The accuracy of the model without data augmentation improved faster during training than that during validation. In contrast, Figure 24 shows the updates of accuracy and loss during the training process of the model with data augmentation. The accuracies of the training and validation datasets were similar. The X-axes on the left-hand sides of Figure 22 and Figure 23 represent the training steps, whereas the Y-axes represent the accuracy. In Step 10, the accuracy of the training dataset in Figure 23 is approximately 0.9, but the accuracy of the validation dataset is only approximately 0.55. However, in the same step shown in Figure 24, the accuracy of the training dataset is approximately 0.9, and the accuracy of the validation dataset is also improved to approximately 0.9. We observed that data augmentation resulted in a certain degree of improvement in the training and generalization ability of the model.

3.3. Subsystem 1—Classification Model for Medical Images

In this study, we trained two models, ResNet50 and Inception-ResNetV2, for 50 epochs with an initial learning rate of 0.001. The specific model initialization parameters are listed in Table 2. An excessively small learning rate could slow the convergence and increase the training time, whereas an excessively large one can cause parametric oscillations. Therefore, choosing an appropriate initial learning rate and appropriately reducing it after multiple epochs can improve the model’s performance. If the validation loss function did not continue to decrease after five consecutive epochs, the learning rate was multiplied by 0.5. Figure 25 illustrates the accuracy and loss updates during training. Table 3 lists the confusion matrix of the model’s predictions on the test set, and Table 4 shows the calculated accuracy, sensitivity, specificity, precision, and F1-measure based on the confusion matrix, which were 0.989, 0.995, 0.984, 0.984, and 0.989, respectively. The Inception-ResNetV2 model used the same parameter settings as those of ResNet50. Figure 26 depicts the accuracy and loss updates during training. The confusion matrix of the test set is shown in Table 5. As summarized in Table 6, the accuracy, sensitivity, specificity, precision, and F1-measure calculated based on the confusion matrix were 0.997, 1.000, 0.995, 0.995, and 0.997, respectively. Table 7 presents the comparison of the test results of ResNet50 [31] with those of Inception-ResNetV2. The results of all indicators were higher for Inception-ResNetV2.

3.4. Subsystem 2—Segmentation Model for Medical Images

This study employed two different backbone networks, ResNet34 and ResNet50, to implement four U-net models using different loss functions, including bce_dice_loss, bce_jaccard_loss, binary_focal_dice_loss, and binary_focal_jaccard_loss, as shown in Equations (9)–(12), respectively. The specific U-net model initialization parameters are listed in Table 8. Table 9 and Table 10 show the confusion matrices for each model and loss function. According to Table 9, a higher false negative (FN) value indicates that the model failed to detect a portion of the actual mask, resulting in a larger area of the actual stone being missed. A false positive (FP) value indicates misjudgment by the model, resulting in a mask area that does not contain stones. As the segmentation model in this study primarily divides the image into foreground (urinary stone image or positive) and background (negative), the evaluation scores were calculated separately for the foreground and background based on the confusion matrix, with the scores presented in Table 11, Table 12 and Table 13. Table 9 and Table 10 reveal a vast difference in the number of samples between the foreground and background. Focal loss is primarily introduced as a loss function to resolve the imbalance between positive and negative samples. Therefore, Table 11 and Table 12 indicate a subtle improvement in the model’s performance when using focal loss compared to binary cross-entropy. Based on the evaluation metrics, both ResNet34 and ResNet50 effectively predict the urinary stone masks. The frequency-weighted intersection over union (FWIoU) index, which assigns different IoU weights to each label based on the test set data, is a valuable indicator for comprehensively evaluating the model’s performance. Therefore, based on the mean IoU (MIoU) and FWIoU, the best performance was achieved by combining ResNet34 as the backbone network with U-net and using binary cross-entropy plus Jaccard distance as the loss function, with sensitivity, precision, F1-score, IoU, MIoU, and FWIoU of 0.952, 0.984, 0.968, 0.937, 0.834, and 0.905, respectively. Figure 27 illustrates the original image, ground truth mask, and predicted mask.
b c e d i c e l o s s = 1 N i = 1 n y i · l o g y i ^ + ( 1 y i ) · l o g ( 1 y i ^ ) + ( 1 2 i = 1 n y i y i ^ + ε y i 2 + y i 2 ^ + ε )
b c e j a c c a r d l o s s = 1 N i = 1 n y i · l o g y i ^ + ( 1 y i ) · l o g ( 1 y i ^ ) + ( 1 T P T P + F P + T N )
b c e _ f o c a l d i c e l o s s = i = 0 n α t · ( 1 y i ^ ) γ · l o g ( y i ^ ) + ( 1 2 i = 1 n y i y i ^ + ε y i 2 + y i 2 ^ + ε ) , α = 0.25 γ = 2
b c e _ f o c a l j a c c a r d l o s s = 1 N i = 1 n y i · l o g y i ^ + ( 1 y i ) · l o g ( 1 y i ^ ) + ( 1 T P T P + F P + T N )

4. Discussion

In this study, two CNN models, Inception-ResNetV2 and U-Net, were utilized for training the network. The core concept of Inception-ResNetV2 is to combine inception modules and residual direct connections using residual connection shortcuts to successfully train deeper neural networks, while significantly simplifying inception modules. As indicated in Figure 15, the structure of Inception-ResNetV2 is divided into several parts: Stem, Inception-resnet-A, Reduction-A, Inception-resnet-B, Reduction-B, and Inception-resnet-C. By combining these modules, Inception-ResNetV2 can achieve a deep network architecture without encountering the problems of gradient disappearance and can converge better. Recently, Inception-ResNetV2 has been increasingly used for medical image recognition. For example, a previous study [57] explored the use of Inception-ResNetV2 for brain tumor detection. Other studies have also applied Inception-ResNetV2 in various applications, such as skin lesion classification methods [58,59] and benchmark testing for aortic pathology analysis [60].
Proposed in 2015, U-Net is widely used in medical image segmentation owing to its unique structure [61], as shown in Figure 16. Its structure can be considered as an encoder–decoder structure. The encoder consists of four sub-modules, each containing two convolutional layers, followed by a max pooling layer for down-sampling, which gradually decrease the resolution of the image. The decoder consists of four submodules that gradually increase the resolution of the image by up-sampling until it is consistent with the input image resolution. Several improved versions based on U-Net are available, such as 3D U-Net [62], which is used for the segmentation of 3D images; Res-UNet [63], which combines the concept of ResNet using residual blocks instead of convolutional layers; and ResUnet++ [64], which introduces attention modules [65] and ASPP modules [66].
In this study, KUB images were used to train the model. According to a systematic review of the latest advancements in the use of artificial intelligence in urology conducted by Dai et al. [70], only one study used KUB images [30]. However, recent research [22] has demonstrated that image preprocessing techniques coupled with model classification could enhance the accuracy of renal stone detection. In this aspect, our results surpassed those of ref. [22]. Other studies, such as that by Parakh et al. [71], had primarily considered machine learning and DL models based on CT images. The advantages of plain film X-ray images include their low dosage and cost, which enable their use across a wide range of medical institutions. However, DL models struggle to accurately detect small objects or features, and renal stones in a KUB image typically occupy only a small number of pixels [72]. To resolve this issue, we cropped the images to magnify the renal stones, thereby facilitating model training.
First, we classified the KUB images based on the presence or absence of renal stones and masked the images with renal stones after classification. The preprocessed and classified renal stone images have reduced misjudgments during segmentation. The segmented stone positions will further assist physicians in diagnosis. Our CAD system has demonstrated that X-ray images can be effective in detecting renal stones, offering a promising research direction and providing an alternative system in renal stone diagnosis using KUB imaging, in addition to CT imaging. While research on the use of plain film X-ray images to detect renal stones is sparse, the results of this study are promising and indicate bright prospects for future research.

5. Conclusions

In this study, we proposed a computer-aided diagnostic system, which was divided into two subsystems. Both subsystems used CNN models to train the DL models. Subsystem 1 classifies and subsystem 2 segments the urinary stones on KUB images. First, subsystem 1 adopts the image preprocessing procedure designed in this study, for which we proposed a method based on subsystem 1 for image cropping. Images of the entire renal stone can be obtained to the greatest extent possible using a sliding window combined with the classification model, avoiding the division of stones into multiple images for recognition owing to average cropping. Experimental data showed that preprocessing, which included image masking, contrast-limited AHE, and image cropping, helped the model to effectively classify the stones and non-stones. Moreover, the Inception-ResNetV2 model was validated to further improve its accuracy over the ResNet50 model. Based on the experimental data, U-Net can accurately generate a urinary stone mask; however, the MIoU data showed that the accuracy of the background was low, and a few erroneous masks were misidentified as urinary stones. In clinical medicine, conventional radiography for detecting stones may exhibit unique characteristics that are less frequently encountered. Due to the scarcity of such images, it is difficult to train the model effectively. Therefore, most training images used in this study were of stones that could be observed with the naked eye. In the future, if several difficult-to-judge KUB images can be collected and trained using the proposed image preprocessing architecture, the generalization ability of the model can be further improved. This will render the diagnostic tool more reliable and enhance its potential. In this study, although the U-Net model in subsystem 2 achieved good performance, misjudgment of feature masks is a problem that needs to be addressed in future research. Some ribs, gas, or fecal matter commonly present in KUB images can cause dense white areas in the images, which are uncontrollable factors that cannot be removed by image masking, such as in the spine and pelvis. Solving these problems is a direction for future research.

Author Contributions

Conceptualization, Z.-H.H., Y.-Y.L. and K.-W.H.; methodology, Z.-H.H. and K.-W.H.; software, Z.-H.H., W.-J.W. and K.-W.H.; validation, Y.-Y.L. and K.-W.H.; formal analysis, Z.-H.H., Y.-Y.L., W.-J.W. and K.-W.H.; investigation, Z.-H.H., Y.-Y.L., W.-J.W. and K.-W.H.; resources, Y.-Y.L.; writing—original draft preparation, Z.-H.H., Y.-Y.L. and K.-W.H.; writing—review and editing, Y.-Y.L. and K.-W.H.; visualization, Z.-H.H.; supervision, K.-W.H. All authors have read and agreed to the published version of the manuscript.

Funding

This research received no external funding.

Institutional Review Board Statement

IRB No.: 202201730B0, Chang Gung Medical Foundation Institutional Review Board, Taiwan.

Informed Consent Statement

Not applicable.

Data Availability Statement

The data presented in this study are available on request from the corresponding author.

Conflicts of Interest

The authors declare no conflict of interest.

References

  1. Romero, V.; Akpinar, H.; Assimos, D.G. Kidney stones: A global picture of prevalence, incidence, and associated risk factors. Rev. Urol. 2010, 12, e86–e96. [Google Scholar] [PubMed]
  2. Chewcharat, A.; Curhan, G. Trends in the prevalence of kidney stones in the United States from 2007 to 2016. Urolithiasis 2020, 49, 27–39. [Google Scholar] [CrossRef] [PubMed]
  3. Tundo, G.; Vollstedt, A.; Meeks, W.; Pais, V. Beyond Prevalence: Annual Cumulative Incidence of Kidney Stones in the United States. J. Urol. 2021, 205, 1704–1709. [Google Scholar] [CrossRef]
  4. Alghamdi, H.S.; Amoudi, G.; Elhag, S.; Saeedi, K.; Nasser, J. Deep Learning Approaches for Detecting COVID-19 From Chest X-Ray Images: A Survey. IEEE Access 2021, 9, 20235–20254. [Google Scholar] [CrossRef] [PubMed]
  5. Islam, S.; Kaabouch, N.; Hu, W.C. A survey of medical imaging techniques used for breast cancer detection. In Proceedings of the IEEE International Conference on Electro-Information Technology, Rapid City, SD, USA, 9–11 May 2013; pp. 1–5. [Google Scholar] [CrossRef]
  6. Poovongsaroj, S.; Rattanachaisit, P.; Patcharatrakul, T.; Gonlachanvit, S.; Vateekul, P. AI-assisted diagnosis of DYSSYNER-GIC defecation using deep learning approach on abdominal radiography and symptom questionnaire. In Proceedings of the 2022 19th International Joint Conference on Computer Science and Software Engineering (JCSSE), Bangkok, Thailand, 8–10 June 2022. [Google Scholar]
  7. Ashour, A.S.; Dey, N.; Mohamed, W.S. Abdominal imaging in clinical applications: Computer aided diagnosis approaches. Med. Imaging Clin. Appl. 2016, 651, 3–17. [Google Scholar]
  8. Heidenreich, A.; Desgrandschamps, F.; Terrier, F. Modern Approach of Diagnosis and Management of Acute Flank Pain: Review of All Imaging Modalities. Eur. Urol. 2002, 41, 351–362. [Google Scholar] [CrossRef]
  9. Niall, O.; Russell, J.; MacGregor, R.; Duncan, H.; Mullins, J. A Comparison of Noncontrast Computerized Tomography with Excretory Urography in the Assessment of Acute Flank Pain. J. Urol. 1999, 161, 534–537. [Google Scholar] [CrossRef]
  10. Wang, J.-H.; Shen, S.-H.; Huang, S.-S.; Chang, C.-Y. Prospective Comparison of Unenhanced Spiral Computed Tomography and Intravenous Urography in the Evaluation of Acute Renal Colic. J. Chin. Med. Assoc. 2008, 71, 30–36. [Google Scholar] [CrossRef]
  11. Brisbane, W.; Bailey, M.R.; Sorensen, M.D. An overview of kidney stone imaging techniques. Nat. Rev. Urol. 2016, 13, 654–662. [Google Scholar] [CrossRef]
  12. Li, L.; Wei, M.; Liu, B.; Atchaneeyasakul, K.; Zhou, F.; Pan, Z.; Kumar, S.A.; Zhang, J.Y.; Pu, Y.; Liebeskind, D.S.; et al. Deep Learning for Hemorrhagic Lesion Detection and Segmentation on Brain CT Images. IEEE J. Biomed. Health Inform. 2020, 25, 1646–1659. [Google Scholar] [CrossRef]
  13. Huang, L.; Han, R.; Ai, T.; Yu, P.; Kang, H.; Tao, Q.; Xia, L. Serial Quantitative Chest CT Assessment of COVID-19: A Deep Learning Approach. Radiol. Cardiothorac. Imaging 2020, 2, e200075. [Google Scholar] [CrossRef] [PubMed]
  14. Mandeville, J.A.; Gnessin, E.; Lingeman, J.E. Imaging evaluation in the patient with kidney stone disease. Semin. Nephrol. 2011, 31, 254–258. [Google Scholar] [CrossRef]
  15. Fulgham, P.F.; Assimos, D.G.; Pearle, M.S.; Preminger, G.M. Clinical Effectiveness Protocols for Imaging in the Management of Ureteral Calculous Disease: AUA Technology Assessment. J. Urol. 2013, 189, 1203–1213. [Google Scholar] [CrossRef] [PubMed]
  16. Fujii, K.; Aoyama, T.; Koyama, S.; Kawaura, C. Comparative evaluation of organ and effective doses for paediatric patients with those for adults in chest and abdominal CT Examinations. Br. J. Radiol. 2007, 80, 657–667. [Google Scholar] [CrossRef] [PubMed]
  17. Smith-Bindman, R.; Moghadassi, M.; Wilson, N.; Nelson, T.R.; Boone, J.M.; Cagnon, C.H.; Gould, R.; Hall, D.J.; Krishnam, M.; Lamba, R.; et al. Radiation doses in consecutive CT examinations from five University of California Medical Centers. Radiology 2015, 277, 134–141. [Google Scholar] [CrossRef]
  18. Metaxas, V.I.; Messaris, G.A.; Lekatou, A.N.; Petsas, T.G.; Panayiotakis, G.S. Patient doses in common diagnostic X-ray examinations. Radiat. Prot. Dosim. 2018, 184, 12–27. [Google Scholar] [CrossRef]
  19. Brenner, D.J.; Hall, E.J. Computed Tomography—An Increasing Source of Radiation Exposure. N. Engl. J. Med. 2007, 357, 2277–2284. [Google Scholar] [CrossRef]
  20. Sagara, Y.; Hara, A.K.; Pavlicek, W.; Silva, A.C.; Paden, R.G.; Wu, Q. Abdominal CT: Comparison of Low-Dose CT With Adaptive Statistical Iterative Reconstruction and Routine-Dose CT With Filtered Back Projection in 53 Patients. Am. J. Roentgenol. 2010, 195, 713–719. [Google Scholar] [CrossRef]
  21. Litjens, G.; Kooi, T.; Bejnordi, B.E.; Setio, A.A.A.; Ciompi, F.; Ghafoorian, M.; van der Laak, J.A.W.M.; van Ginneken, B.; Sánchez, C.I. A survey on deep learning in medical image analysis. Med. Image Anal. 2017, 42, 60–88. [Google Scholar] [CrossRef]
  22. Sarvamangala, D.R.; Kulkarni, R.V. Convolutional neural networks in medical image understanding: A survey. Evol. Intell. 2021, 15, 1–22. [Google Scholar] [CrossRef]
  23. Fu, Y.; Lei, Y.; Wang, T.; Curran, W.J.; Liu, T.; Yang, X. Deep learning in medical image registration: A review. Phys. Med. Biol. 2020, 65, 20TR01. [Google Scholar] [CrossRef] [PubMed]
  24. Chan, H.-P.; Samala, R.K.; Hadjiiski, L.M.; Zhou, C. Deep learning in medical image analysis. Adv. Exp. Med. Biol. 2020, 1213, 3–21. [Google Scholar] [PubMed]
  25. Doi, K. Computer-aided diagnosis in medical imaging: Historical Review, current status and future potential. Comput. Med. Imaging Graph. 2007, 31, 198–211. [Google Scholar] [CrossRef] [PubMed]
  26. Chan, H.P.; Hadjiiski, L.M.; Samala, R.K. Computer-aided diagnosis in the era of deep learning. Med. Phys. 2020, 47, e218–e227. [Google Scholar] [CrossRef] [PubMed]
  27. Cha, K.H.; Hadjiiski, L.; Samala, R.K.; Chan, H.-P.; Caoili, E.M.; Cohan, R.H. Urinary bladder segmentation in CT urography using deep-learning convolutional neural network and level sets. Med. Phys. 2016, 43, 1882–1896. [Google Scholar] [CrossRef]
  28. Längkvist, M.; Jendeberg, J.; Thunberg, P.; Loutfi, A.; Lidén, M. Computer aided detection of ureteral stones in thin slice computed tomography volumes using Convolutional Neural Networks. Comput. Biol. Med. 2018, 97, 153–160. [Google Scholar] [CrossRef]
  29. Fitri, L.A.; Haryanto, F.; Arimura, H.; YunHao, C.; Ninomiya, K.; Nakano, R.; Haekal, M.; Warty, Y.; Fauzi, U. Automated classification of urinary stones based on microcomputed tomography images using convolutional neural network. Phys. Medica 2020, 78, 201–208. [Google Scholar] [CrossRef]
  30. Kobayashi, M.; Ishioka, J.; Matsuoka, Y.; Fukuda, Y.; Kohno, Y.; Kawano, K.; Morimoto, S.; Muta, R.; Fujiwara, M.; Kawamura, N.; et al. Computer-aided diagnosis with a convolutional neural network algorithm for automated detection of urinary tract stones on plain X-ray. BMC Urol. 2021, 21, 102. [Google Scholar] [CrossRef]
  31. Liu, Y.-Y.; Huang, Z.-H.; Huang, K.-W. Deep Learning Model for Computer-Aided Diagnosis of Urolithiasis Detection from Kidney–Ureter–Bladder Images. Bioengineering 2022, 9, 811. [Google Scholar] [CrossRef]
  32. Pearle, M.S.; Lotan, Y. Urinary lithiasis. In Campbell-Walsh Urology; Elsevier: Amsterdam, The Netherlands, 2012. [Google Scholar]
  33. Zimmerman, J.; Pizer, S.; Staab, E.; Perry, J.; McCartney, W.; Brenton, B. An evaluation of the effectiveness of adaptive histogram equalization for contrast enhancement. IEEE Trans. Med. Imaging 1988, 7, 304–312. [Google Scholar] [CrossRef]
  34. Pizer, S.M.; Amburn, E.P.; Austin, J.D.; Cromartie, R.; Geselowitz, A.; Greer, T.; ter Haar Romeny, B.; Zimmerman, J.B.; Zuiderveld, K. Adaptive histogram equalization and its variations. Comput. Vis. Graph. Image Process. 1987, 39, 355–368. [Google Scholar] [CrossRef]
  35. Zuiderveld, K. Contrast limited adaptive histogram equalization. Graph. Gems 1994, 474–485. [Google Scholar]
  36. Lucknavalai, K.; Schulze, J.P. Real-Time Contrast Enhancement for 3D Medical Images Using Histogram Equalization. In Proceedings of the Advances in Visual Computing: 15th International Symposium, ISVC 2020, San Diego, CA, USA, 5–7 October 2020; Volume 12509, pp. 224–235. [Google Scholar] [CrossRef]
  37. Hayati, M.; Muchtar, K.; Roslidar; Maulina, N.; Syamsuddin, I.; Elwirehardja, G.N.; Pardamean, B. Impact of CLAHE-based image enhancement for diabetic retinopathy classification through deep learning. Procedia Comput. Sci. 2023, 216, 57–66. [Google Scholar] [CrossRef]
  38. Dinh, P.; Giang, N.L. A new medical image enhancement algorithm using adaptive parameters. Int. J. Imaging Syst. Technol. 2022, 32, 2198–2218. [Google Scholar] [CrossRef]
  39. He, K.; Gkioxari, G.; Dollar, P.; Girshick, R. Mask R-CNN. In Proceedings of the 2017 IEEE International Conference on Computer Vision (ICCV), Venice, Italy, 22–29 October 2017. [Google Scholar]
  40. Shen, W.; Xu, W.; Zhang, H.; Sun, Z.; Ma, J.; Ma, X.; Zhou, S.; Guo, S.; Wang, Y. Automatic segmentation of the femur and tibia bones from X-ray images based on pure dilated residual U-Net. Inverse Probl. Imaging 2021, 15, 1333. [Google Scholar] [CrossRef]
  41. Fawzi, A.; Samulowitz, H.; Turaga, D.; Frossard, P. Adaptive data augmentation for Image Classification. In Proceedings of the 2016 IEEE International Conference on Image Processing (ICIP), Phoenix, AZ, USA, 25–28 September 2016. [Google Scholar]
  42. Perez, L.; Wang, J. The effectiveness of data augmentation in image classification using deep learning. Convolutional Neural Netw. Vis. Recognit. 2017, 11, 1–8. [Google Scholar]
  43. Shorten, C.; Khoshgoftaar, T.M. A survey on Image Data Augmentation for Deep Learning. J. Big Data 2019, 6, 60. [Google Scholar] [CrossRef]
  44. Nanni, L.; Paci, M.; Brahnam, S.; Lumini, A. Comparison of Different Image Data Augmentation Approaches. J. Imaging 2021, 7, 254. [Google Scholar] [CrossRef]
  45. Islam, Z.; Islam, M.; Asraf, A. A combined deep CNN-LSTM network for the detection of novel coronavirus (COVID-19) using X-ray images. Inform. Med. Unlocked 2020, 20, 100412. [Google Scholar] [CrossRef]
  46. Pathan, S.; Siddalingaswamy, P.; Ali, T. Automated Detection of Covid-19 from Chest X-ray scans using an optimized CNN architecture. Appl. Soft Comput. 2021, 104, 107238. [Google Scholar] [CrossRef]
  47. Gazda, M.; Plavka, J.; Gazda, J.; Drotar, P. Self-supervised deep convolutional neural network for chest X-ray classification. IEEE Access 2021, 9, 151972–151982. [Google Scholar] [CrossRef]
  48. Feng, Y.; Xu, X.; Wang, Y.; Lei, X.; Teo, S.K.; Sim, J.Z.; Ting, Y.; Zhen, L.; Zhou, J.T.; Liu, Y.; et al. Deep supervised do-main adaptation for pneumonia diagnosis from chest X-ray images. IEEE J. Biomed. Health Inform. 2022, 26, 1080–1090. [Google Scholar] [CrossRef] [PubMed]
  49. Frid-Adar, M.; Diamant, I.; Klang, E.; Amitai, M.; Goldberger, J.; Greenspan, H. Gan-based synthetic medical image augmentation for increased CNN performance in liver lesion classification. Neurocomputing 2018, 321, 321–331. [Google Scholar] [CrossRef]
  50. Ma, Y.; Liu, J.; Liu, Y.; Fu, H.; Hu, Y.; Cheng, J.; Qi, H.; Wu, Y.; Zhang, J.; Zhao, Y. Structure and Illumination Constrained GAN for Medical Image Enhancement. IEEE Trans. Med. Imaging 2021, 40, 3955–3967. [Google Scholar] [CrossRef]
  51. Wright, L. Ranger—A Synergistic Optimizer. 2019. Available online: https://github.com/lessw2020/Ranger-Deep-Learning-Optimizer (accessed on 28 February 2023).
  52. Chlap, P.; Min, H.; Vandenberg, N.; Dowling, J.; Holloway, L.; Haworth, A. A review of medical image data augmentation techniques for deep learning applications. J. Med. Imaging Radiat. Oncol. 2021, 65, 545–563. [Google Scholar] [CrossRef]
  53. Simonyan, K.; Zisserman, A. Very deep convolutional networks for large-scale image recognition. arXiv preprint 2014, arXiv:1409.1556. [Google Scholar]
  54. He, K.; Zhang, X.; Ren, S.; Sun, J. Deep residual learning for image recognition. In Proceedings of the 2016 IEEE Conference on Computer Vision and Pattern Recognition (CVPR), Las Vegas, NV, USA, 27–30 June 2016. [Google Scholar]
  55. Szegedy, C.; Ioffe, S.; Vanhoucke, V.; Alemi, A. Inception-V4, inception-resnet and the impact of residual connections on learning. In Proceedings of the AAAI Conference on Artificial Intelligence, San Francisco, CA, USA, 4–9 February 2017; Volume 31. [Google Scholar]
  56. Russakovsky, O.; Deng, J.; Su, H.; Krause, J.; Satheesh, S.; Ma, S.; Huang, Z.; Karpathy, A.; Khosla, A.; Bernstein, M.; et al. ImageNet Large Scale Visual Recognition Challenge. Int. J. Comput. Vis. 2015, 115, 211–252. [Google Scholar] [CrossRef]
  57. Yu, Z.; Wang, K.; Wan, Z.; Xie, S.; Lv, Z. Popular deep learning algorithms for disease prediction: A review. Clust. Comput. 2022, 26, 1231–1251. [Google Scholar] [CrossRef]
  58. Dakhli, R.; Barhoumi, W. A skin lesion classification method based on expanding the surrounding lesion-shaped border for an end-to-end inception-ResNet-V2 classifier. Signal Image Video Process. 2023, 5, 1–9. [Google Scholar] [CrossRef]
  59. Bozkurt, F. Skin lesion classification on dermatoscopic images using effective data augmentation and pre-trained deep learning approach. Multimed. Tools Appl. 2022, 82, 18985–19003. [Google Scholar] [CrossRef]
  60. Miserlis, D.; Munian, Y.; Cardona, L.M.F.; Teixeira, P.G.; DuBose, J.J.; Davies, M.G.; Alamaniotis, M.; Bohannon, W.; Koutakis, P. Benchmarking efficientnetb7, InceptionResNetV2, inceptionv3, and xception artificial neural networks ap-plications for aortic pathologies analysis. J. Vasc. Surg. 2023, 77, E345. [Google Scholar] [CrossRef]
  61. Ronneberger, O.; Fischer, P.; Brox, T. U-Net: Convolutional networks for biomedical image segmentation. In Medical Image Computing and Computer-Assisted Intervention 2015; Navab, N., Hornegger, J., Wells, W.M., Frangi, A.F., Eds.; Springer International Publishing: Cham, Switzerland, 2015; pp. 234–241. [Google Scholar] [CrossRef]
  62. Çiçek, Ö.; Abdulkadir, A.; Lienkamp, S.S.; Brox, T.; Ronneberger, O. 3D U-Net: Learning dense volumetric segmentation from sparse annotation. In Proceedings of the Medical Image Computing and Computer-Assisted Intervention—MICCAI 2016: 19th International Conference, Athens, Greece, 17–21 October 2016; pp. 424–432. [Google Scholar]
  63. Xiao, X.; Lian, S.; Luo, Z.; Li, S. Weighted Res-UNet for high-quality retina vessel segmentation. In Proceedings of the 2018 9th International Conference on Information Technology in Medicine and Education (ITME), Hangzhou, China, 19–21 October 2018. [Google Scholar]
  64. Jha, D.; Smedsrud, P.H.; Johansen, D.; de Lange, T.; Johansen, H.D.; Halvorsen, P.; Riegler, M.A. A comprehensive study on colorectal polyp segmentation with resunet++, conditional random field and test-time augmentation. IEEE J. Biomed. Health Inform. 2021, 25, 2029–2040. [Google Scholar] [CrossRef] [PubMed]
  65. Chen, L.-C.; Yang, Y.; Wang, J.; Xu, W.; Yuille, A.L. Attention to scale: Scale-aware Semantic Image segmentation. In Proceedings of the 2016 IEEE Conference on Computer Vision and Pattern Recognition (CVPR), Las Vegas, NV, USA, 27–30 June 2016. [Google Scholar]
  66. Chen, L.-C.; Papandreou, G.; Kokkinos, I.; Murphy, K.; Yuille, A.L. DeepLab: Semantic image segmentation with deep convolutional nets, atrous convolution, and fully connected crfs. IEEE Trans. Pattern Anal. Mach. Intell. 2018, 40, 834–848. [Google Scholar] [CrossRef] [PubMed]
  67. Wang, S.-Y.; Wang, O.; Zhang, R.; Owens, A.; Efros, A.A. CNN-generated images are surprisingly easy to spot… for now. In Proceedings of the 2020 IEEE/CVF Conference on Computer Vision and Pattern Recognition (CVPR), Seattle, WA, USA, 13–19 June 2020. [Google Scholar]
  68. Liu, L.; Jiang, H.; He, P.; Chen, W.; Liu, X.; Gao, J.; Han, J. On the variance of the adaptive learning rate and beyond. arXiv preprint 2019, arXiv:1908.03265. [Google Scholar]
  69. Zhang, M.J.; Ba, L.J.; Hinton, G.E. Lookahead optimizer: K steps forward, 1 step back. In Advances in Neural Information Processing Systems; Curran Associates, Inc.: Red Hook, NY, USA, 2019; Volume 32. [Google Scholar]
  70. Dai, J.C.; Johnson, B.A. Artificial intelligence in endourology: Emerging technology for individualized care. Curr. Opin. Urol. 2022, 32, 379–392. [Google Scholar] [CrossRef]
  71. Parakh, A.; Lee, H.; Lee, J.H.; Eisner, B.H.; Sahani, D.V.; Do, S. Urinary stone detection on CT images using deep convolutional neural networks: Evaluation of model performance and generalization. Radiol. Artif. Intell. 2019, 1, e180066. [Google Scholar] [CrossRef]
  72. Chen, C.; Liu, M.-Y.; Tuzel, O.; Xiao, J. R-CNN for small object detection. In Proceedings of the Asian Conference on Computer Vision, Taipei, Taiwan, 20–24 November 2016; pp. 214–230. [Google Scholar]
Figure 1. Urinary tract stones on a kidney–ureter–bladder (KUB) image and red box mean the location of the stone.
Bioengineering 10 00970 g001
Figure 2. KUB image showing urinary stones.
Bioengineering 10 00970 g002
Figure 3. KUB image after histogram equalization.
Bioengineering 10 00970 g003
Figure 4. KUB image after AHE with an 8 × 8 mask.
Bioengineering 10 00970 g004
Figure 5. KUB image after AHE with a 16 × 16 mask.
Bioengineering 10 00970 g005
Figure 6. KUB image after contrast-limited AHE.
Bioengineering 10 00970 g006
Figure 7. Original KUB image.
Bioengineering 10 00970 g007
Figure 8. Masked image generated by Mask R-CNN.
Bioengineering 10 00970 g008
Figure 9. A is the central point of spine, B is the upper point of the right pelvis, and C is the upper point of the left pelvis.
Bioengineering 10 00970 g009
Figure 10. KUB image of the right kidney.
Bioengineering 10 00970 g010
Figure 11. KUB image of the left kidney.
Bioengineering 10 00970 g011
Figure 12. Left-hand-side image shows the stone image cropped from the KUB image with a size of 100 × 100 pixels, while the right-hand-side image shows the randomly cropped image with the same size from the KUB image.
Bioengineering 10 00970 g012
Figure 13. After cropping the KUB image, random angle rotation, horizontal and vertical displacements, and flipping are applied to augment data.
Bioengineering 10 00970 g013
Figure 14. Residual block [52].
Bioengineering 10 00970 g014
Figure 15. Main structure of Inception-ResNetV2 [55].
Bioengineering 10 00970 g015
Figure 16. U-Net architecture [61].
Bioengineering 10 00970 g016
Figure 17. Schematic of the overall system architecture.
Bioengineering 10 00970 g017
Figure 18. Architecture of the image classification model.
Bioengineering 10 00970 g018
Figure 19. Architecture of the semantic segmentation model.
Bioengineering 10 00970 g019
Figure 20. Complete system flow for visualizing KUB images.
Bioengineering 10 00970 g020
Figure 21. System flow chart.
Bioengineering 10 00970 g021
Figure 22. Confusion matrix and evaluation metrics.
Bioengineering 10 00970 g022
Figure 23. Accuracy and loss of the ResNet50 model without data augmentation.
Bioengineering 10 00970 g023
Figure 24. Accuracy and loss of the ResNet50 model with data augmentation.
Bioengineering 10 00970 g024
Figure 25. Accuracy and loss updates during the training process of ResNet50.
Bioengineering 10 00970 g025
Figure 26. Accuracy and loss updates during the training process of Inception-ResNetV2.
Bioengineering 10 00970 g026
Figure 27. Original image, ground truth mask, and predicted mask.
Bioengineering 10 00970 g027
Table 1. Hardware information.
CPUGraphics CardMemory
Intel Core i7-8700 @ 3.19 GHzNvidia GeForce RTX3070 8 G32 G
Table 2. Model initialization parameters.
Epochs50
Batch size16
Learning rate0.001
Loss functionBinary cross-entropy
Optimization algorithmRanger
Table 3. Confusion matrix of the test set for the ResNet50 classification model.
Predicted Label
Have StoneNO Stone
True labelHave stone1823
No stone1184
Table 4. Evaluation metrics performance of ResNet50 classification model on the test set.
AccuracySensitivitySpecificityPrecisionF1-Score
Testing dataset0.9890.9950.9840.9840.989
Table 5. Confusion matrix of the test set for the Inception-ResNetV2 classification model.
Predicted Label
Have StoneNo Stone
True labelHave stone1840
No stone1185
Table 6. Evaluation metrics performance of Inception-ResNetV2 classification model on the test set.
AccuracySensitivitySpecificityPrecisionF1-Score
Testing dataset0.9971.0000.9950.9950.997
Table 7. ResNet50 and Inception-ResNetV2 evaluation results comparison.
ResNet50 [31]Inception-ResNetV2
Accuracy0.9890.997
Sensitivity0.9951.000
Specificity0.9840.995
Precision0.9840.995
F1-score0.9890.997
Table 8. U-net model initialization parameters.
Epochs100
Batch size8
Learning rate0.0001
Loss functionFocal loss + Jaccard loss
Optimization algorithmRanger
Table 9. Confusion matrix of ResNet34 using Bce_dice_loss, Bce_jaccard_loss, binary_focal_dice_loss, and binary_focal_jaccard_loss.
Bce_dice_lossBce_jaccard_lossBinary_focal_dice_lossBinary_focal_jaccard_loss
TP270,382267,678259,717268,203
FP72,81375,51783,47874,992
TN1,480,4751,480,1151,481,8791,482,633
FN26,33026,69024,92627,751
Table 10. Confusion matrix of ResNet50 using Bce_dice_loss, Bce_jaccard_loss, binary_focal_dice_loss, and binary_focal_jaccard_loss.
Bce_dice_lossBce_jaccard_lossBinary_focal_dice_lossBinary_focal_jaccard_loss
TP268,540270,597256,915266,816
FP74,65572,59886,28076,379
TN1,479,0541,472,6881,487,1911,480,639
FN27,75134,11719,61426,166
Table 11. Evaluation metrics calculated based on the confusion matrix for ResNet34.
Bce_dice_lossBce_jaccard_lossBinary_focal_dice_lossBinary_focal_jaccard_loss
PositiveNegativePositiveNegativePositiveNegativePositiveNegative
Accuracy0.9460.9460.9450.9450.9410.9410.9460.946
Sensitivity0.9530.9110.9510.9090.9470.9120.9520.917
Precision0.9830.7880.9820.7800.9830.7570.9840.781
F1-score0.9680.8450.9670.8400.9650.8270.9680.844
IoU0.9370.7320.9350.7240.9320.7060.9370.730
MIoU0.8340.8340.8300.8300.8190.8190.8340.834
FWIoU0.9040.9040.9020.9020.8970.8970.9050.905
Table 12. Evaluation metrics calculated based on the confusion matrix for ResNet50.
Bce_dice_lossBce_jaccard_lossBinary_focal_dice_lossBinary_focal_jaccard_loss
PositiveNegativePositiveNegativePositiveNegativeNegativePositive
Accuracy0.9450.9450.9420.9420.9430.9430.9450.945
Sensitivity0.9520.9060.9530.8880.9450.9290.9510.911
Precision0.9820.7820.9770.7880.9870.7490.9830.777
F1-score0.9670.8400.9650.8360.9660.8290.9670.839
IoU0.9350.7240.9320.7170.9340.7080.9350.722
MIoU0.8300.8300.8250.8250.8210.8210.8290.829
FWIoU0.9010.9010.8970.8970.9000.9000.9020.902
Table 13. Comparison of comprehensive evaluation indicators between ResNet34 and ResNet50.
ResNet34′s Bce_dice_lossResNet34′s Binary_focal_jaccard_lossResNet50′s Bce_dice_lossResNet50′s
Binary_focal_jaccard_loss
Accuracy0.9460.9460.9450.945
Sensitivity0.9530.9520.9520.951
Precision0.9830.9840.9820.983
F1-score0.9680.9680.9670.967
IoU0.9370.9370.9350.935
MIoU0.8340.8340.8300.829
FWIoU0.9040.9050.9010.902
Disclaimer/Publisher’s Note: The statements, opinions and data contained in all publications are solely those of the individual author(s) and contributor(s) and not of MDPI and/or the editor(s). MDPI and/or the editor(s) disclaim responsibility for any injury to people or property resulting from any ideas, methods, instructions or products referred to in the content.

