Article

The Lower Limb Muscle Co-Activation Map during Human Locomotion: From Slow Walking to Running

by
Lorenzo Fiori
1,2,*,
Stefano Filippo Castiglia
3,4,
Giorgia Chini
1,
Francesco Draicchio
1,
Floriana Sacco
1,
Mariano Serrao
3,
Antonella Tatarelli
1,
Tiwana Varrecchia
1 and
Alberto Ranavolo
1
1
Department of Occupational and Environmental Medicine, Epidemiology and Hygiene, INAIL, Via Fontana Candida 1, Monte Porzio Catone, 00078 Rome, Italy
2
Behavioral Neuroscience PhD Program, Department of Physiology and Pharmacology, Sapienza University, Viale dell’Università 30, 00185 Rome, Italy
3
Department of Medical and Surgical Sciences and Biotechnologies, Sapienza University of Rome, Polo Pontino, Via Franco Faggiana 1668, 04100 Latina, Italy
4
Department of Brain and Behavioral Sciences, University of Pavia, Via Bassi 21, 27100 Pavia, Italy
*
Author to whom correspondence should be addressed.
Bioengineering 2024, 11(3), 288; https://doi.org/10.3390/bioengineering11030288
Submission received: 16 January 2024 / Revised: 13 March 2024 / Accepted: 13 March 2024 / Published: 19 March 2024
(This article belongs to the Section Biomechanics and Sports Medicine)

Abstract

:
The central nervous system (CNS) controls movements and regulates joint stiffness with muscle co-activation, but until now, few studies have examined muscle pairs during running. This study aims to investigate differences in lower limb muscle coactivation during gait at different speeds, from walking to running. Nineteen healthy runners walked and ran at speeds ranging from 0.8 km/h to 9.3 km/h. Twelve lower limb muscles’ co-activation was calculated using the time-varying multi-muscle co-activation function (TMCf) with global, flexor–extension, and rostro–caudal approaches. Spatiotemporal and kinematic parameters were also measured. We found that TMCf, spatiotemporal, and kinematic parameters were significantly affected by gait speed for all approaches. Significant differences were observed in the main parameters of each co-activation approach and in the spatiotemporal and kinematic parameters at the transition between walking and running. In particular, significant differences were observed in the global co-activation (CIglob, main effect F(1,17) = 641.04, p < 0.001; at the transition p < 0.001), the stride length (main effect F(1,17) = 253.03, p < 0.001; at the transition p < 0.001), the stride frequency (main effect F(1,17) = 714.22, p < 0.001; at the transition p < 0.001) and the Center of Mass displacement in the vertical (CoMy, main effect F(1,17) = 426.2, p < 0.001; at the transition p < 0.001) and medial–lateral (CoMz, main effect F(1,17) = 120.29 p < 0.001; at the transition p < 0.001) directions. Regarding the correlation analysis, the CoMy was positively correlated with a higher CIglob (r = 0.88, p < 0.001) and negatively correlated with Full Width at Half Maximum (FWHMglob, r = −0.83, p < 0.001), whereas the CoMz was positively correlated with the global Center of Activity (CoAglob, r = 0.97, p < 0.001). Positive and negative strong correlations were found between global co-activation parameters and center of mass displacements, as well as some spatiotemporal parameters, regardless of gait speed. Our findings suggest that walking and running have different co-activation patterns and kinematic characteristics, with the whole-limb stiffness exerted more synchronously and stably during running. The co-activation indexes and kinematic parameters could be the result of global co-activation, which is a sensory-control integration process used by the CNS to deal with more demanding and potentially unstable tasks like running.

1. Introduction

Muscle co-activation is one of the strategies used by the central nervous system (CNS) to simplify movements and ensure adequate joint stiffness by regulating the time and amplitude of simultaneous activity of a pair or group of muscles [1,2,3,4]. Muscle co-activation is thought to maintain effector-level control (low dimensional), removing the need for individual muscle coordination control (high dimensional) [2].
Although muscle co-activation has been extensively studied during gait in both healthy patients and patients with a variety of motor disorders (for a review, see [2]), only a few studies have looked at muscle co-activation during running [5,6,7,8,9]. Walking to running represents a critical transition time that corresponds to a change in CNS activation [10], leg geometry [11,12], joint compliance [13], and a robust mechanical energy transformation [14,15,16]. Indeed, walking and running patterns, despite the similarity, differ in spatiotemporal and kinematic characteristics, such as the lower limb joint angles [17,18].
Most humans will voluntarily switch from walking to running at 6.8 and 7.5 km/h [19,20,21,22]. At these higher speeds, running becomes less expensive than walking by utilizing a mass-spring mechanism that exchanges kinetic and potential energy in very different ways [15,23]. Most studies on muscle activation during running have concentrated on the activity of single muscles [24,25,26]. Running has been linked to the increased activation of all lower limb muscles in general [5,27,28,29], despite the fact that some muscles (e.g., gluteus maximus) appear to play a larger role during running than walking [30]. Only a few studies have looked at the activation of muscle pairs while running [9,31]. When compared to a single-joint muscle solution, these studies discovered that a longer duration of muscle co-activation between the rectus femoris and gastrocnemius during stance provided a better metabolic solution to multiple joint stability, implying that biarticular muscles redistribute mechanical power from proximal joints to distal joints, and ultimately to the ground. Moore et colleagues [9] discovered that co-activation in the distal and leg flexor muscles decreases with speed while running, implying that when both legs are off the ground, muscle co-activation must be reduced to allow for more leg propulsion both upwards and forwards.
A critical missing piece is whether the descending motor commands for running are set up to coactivate the lower limb muscles as a whole entity within a gross motor strategy. Taking previous evidence into account [9,31], it is possible to hypothesize that descending commands for running cause an increase in whole limb stiffness to stabilize the limb during ground contact on the one hand and a decrease in limb stiffness to facilitate forward progression of the leg during air stepping on the other. This basic descending motor control would imply that flexor muscles are activated during air stepping when whole-limb stiffness is reduced and that muscle co-activation occurs via top-down (rostro–caudal) recruitment (from L3 to S2). This strategy would greatly simplify motor control at the low-dimensional effector level during shock absorption, allowing for motor control decentralization while relying on peripheral feedback via muscle reflexes to generate the required muscle co-activations and regulate each muscle’s gain.
Muscle co-activation patterns are determined by the supraspinal processes involved in movement control [2]. Two main circuits, corticocerebellar–thalamo–cortical and corticobasal–thalamo–cortical, appear to be important in defining co-activation patterns [32]. In particular, studies of subjects with cerebellar degeneration [33], spasticity [34], or extrapyramidal rigidity [35] have found that the cerebellum plays a role in modulating muscle co-activation, implying that processing modules distributed within the brain define the patterns of co-activation observed in the extremities [36].
We recently proposed a novel approach to studying time-varying multi-muscle co-activation function (TMCf) [37,38], which is a good indicator of the CNS’s overall strategy for modulating the simultaneous activation of many lower limb muscles during locomotion. This approach provides a new perspective on the spatiotemporal motor control of the lower limbs, emphasizing how all muscles of the lower limb are synchronously coactivated in an attempt to increase whole-limb stiffness, regardless of single-joint antagonist muscles or modular activation of a group of muscles [39].
The objectives of this study were to observe the differences in lower limb muscle co-activation strategies during locomotion across speeds from walking to running. We hypothesized that the behavior of lower limb muscles, in terms of co-activation parameters, may differ across the speeds, particularly between walking and running, and that the co-activation parameters may vary based on the muscular functions (flexion or extensor functions) and across the rostro–caudal recruitment map.
The findings of this study may aid clinicians to better understand the mechanisms of muscular behavior during the transition from walking to running, potentially providing information on control abnormalities that lead to muscle injuries, as well as sport professionals in developing tailored training programs.

2. Materials and Methods

2.1. Subjects

Nineteen healthy runners were recruited (9 men and 10 women; mean age of 40.95 ± 7.96 years; mean weight of 66.47 ± 14.60 kg). Each runner had declared running for at least 5 years, running at least 3 times per week for at least 5 km per training session [40].
None of the runners had any known diseases that might affect their regular gait or running pattern. This study was authorized by the local ethics committee (N. 0078009/2021) after all participants gave written informed consent and the study’s design adhered to the Declaration of Helsinki. The number of the included subjects was in the range of subjects usually enrolled in similar studies [41,42,43]. Moreover, a priori power analysis using the G∗Power computer program [44] indicated that a total sample of 14 participants would be needed to detect a medium effect size (Cohen’s F = 0.25) with 80% power using the repeated measurement ANOVA with gait speed as a within-subjects factor with a = 0.05.

2.2. Experimental Procedure

Each runner was asked to walk at thirteen various speeds, ranging from 0.8 km/h to 6.8 km/h, and run at five different speeds, ranging from 7.3 km/h to 9.3 km/h, with increased steps of 0.5 km/h, on a treadmill. We chose 7.3 km/h as the transition speed because it is consistent with earlier research [19,21,22] in which this transition was determined considering the metabolic energy cost of locomotion, as well as the human capacity for purposeful gait modulation and the importance of physiologic and metabolic demands.
Before the recording session, individual speed performance schedules were arranged for each participant, featuring randomized presentations. Each runner underwent a 10 s adaptation period to familiarize with the given speed, followed by a 30 s recording period. Following each trial, the speed was reset to zero, and the runner was granted a minimum of 1 min of stationary rest to prevent fatigue before commencing the subsequent trial. Each trial was performed for 30 s before moving on to the next speed that was chosen at random.

2.3. Data Acquisition

A bipolar 16-channel wireless acquisition device (Mini Wave System; Cometa, Bareggio, Milan, Italy) was used to record all the surface myoelectric activity at a sampling rate of 2 kHz. Twelve Ag/AgCl pre-gelled electrodes (Kendall ARBO, inter-electrode distance: 2 cm) were placed over each participant’s right side lower limb muscles over the following muscles: gluteus medius (GM), rectus femoris (RF), vastus lateralis (VL), vastus medialis (VM), tensor fascia latae (TFL), semitendinosus (ST), biceps femoris (BF), tibialis anterior (TA), gastrocnemius medialis (GasM), gastrocnemius lateralis (GasL), soleus (SOL), and peroneus longus (P) [45,46], following the European Recommendations for Surface Electromyography [47], the Atlas of Muscle Innervation Zones [48], and best practices [45,46,49]. Before applying the electrodes, the skin was prepared by shaving, if needed, and cleaned with alcohol and dried.
A stereo-photogrammetric motion analysis system with optoelectronic technology (SMART-DX 6000 system: BTS, Bari, Italy) and with a sampling rate of 340 Hz was employed to collect the kinematics data. Eight infrared cameras were used to record five passive spherical markers, covered with aluminum powder, positioned above the sacrum and bilaterally on the anterior superior iliac spines, heel, metatarsal head, and lateral malleoli [50].
A video camera (BTS Vixta; BTS, Milan, Italy) with a frame rate of 25–30 frames per second and a video resolution of 640 × 480 pixels was used to visually monitor the acquired tasks. All the data collected were synchronized.

2.4. Data Analysis

Three-dimensional reconstruction software (SMART Tracker and SMART Analyzer: BTS, Italy) and MATLAB (R2019b 9.7; MathWorks, Portola Valley, CA, USA) were used to process the sEMG and kinematics data.

2.4.1. Cycle Definition and Temporal Normalization

The heel strike (HS) and toe-off (TO) events were determined in this study along the anteroposterior trajectories through the maximum point of the heel and the minimum point of the metatarsal, respectively. The gait and run cycle was defined as the time between two consecutive HSs of the same leg. Then, the electromyographic and kinematic data were time-normalized to the duration of each cycle and reduced to 201 samples using an interpolation procedure to allow a comparison between different cycles that had different durations [31,37,38,39]. Ten cycles for each gait speed level for each runner were analyzed.

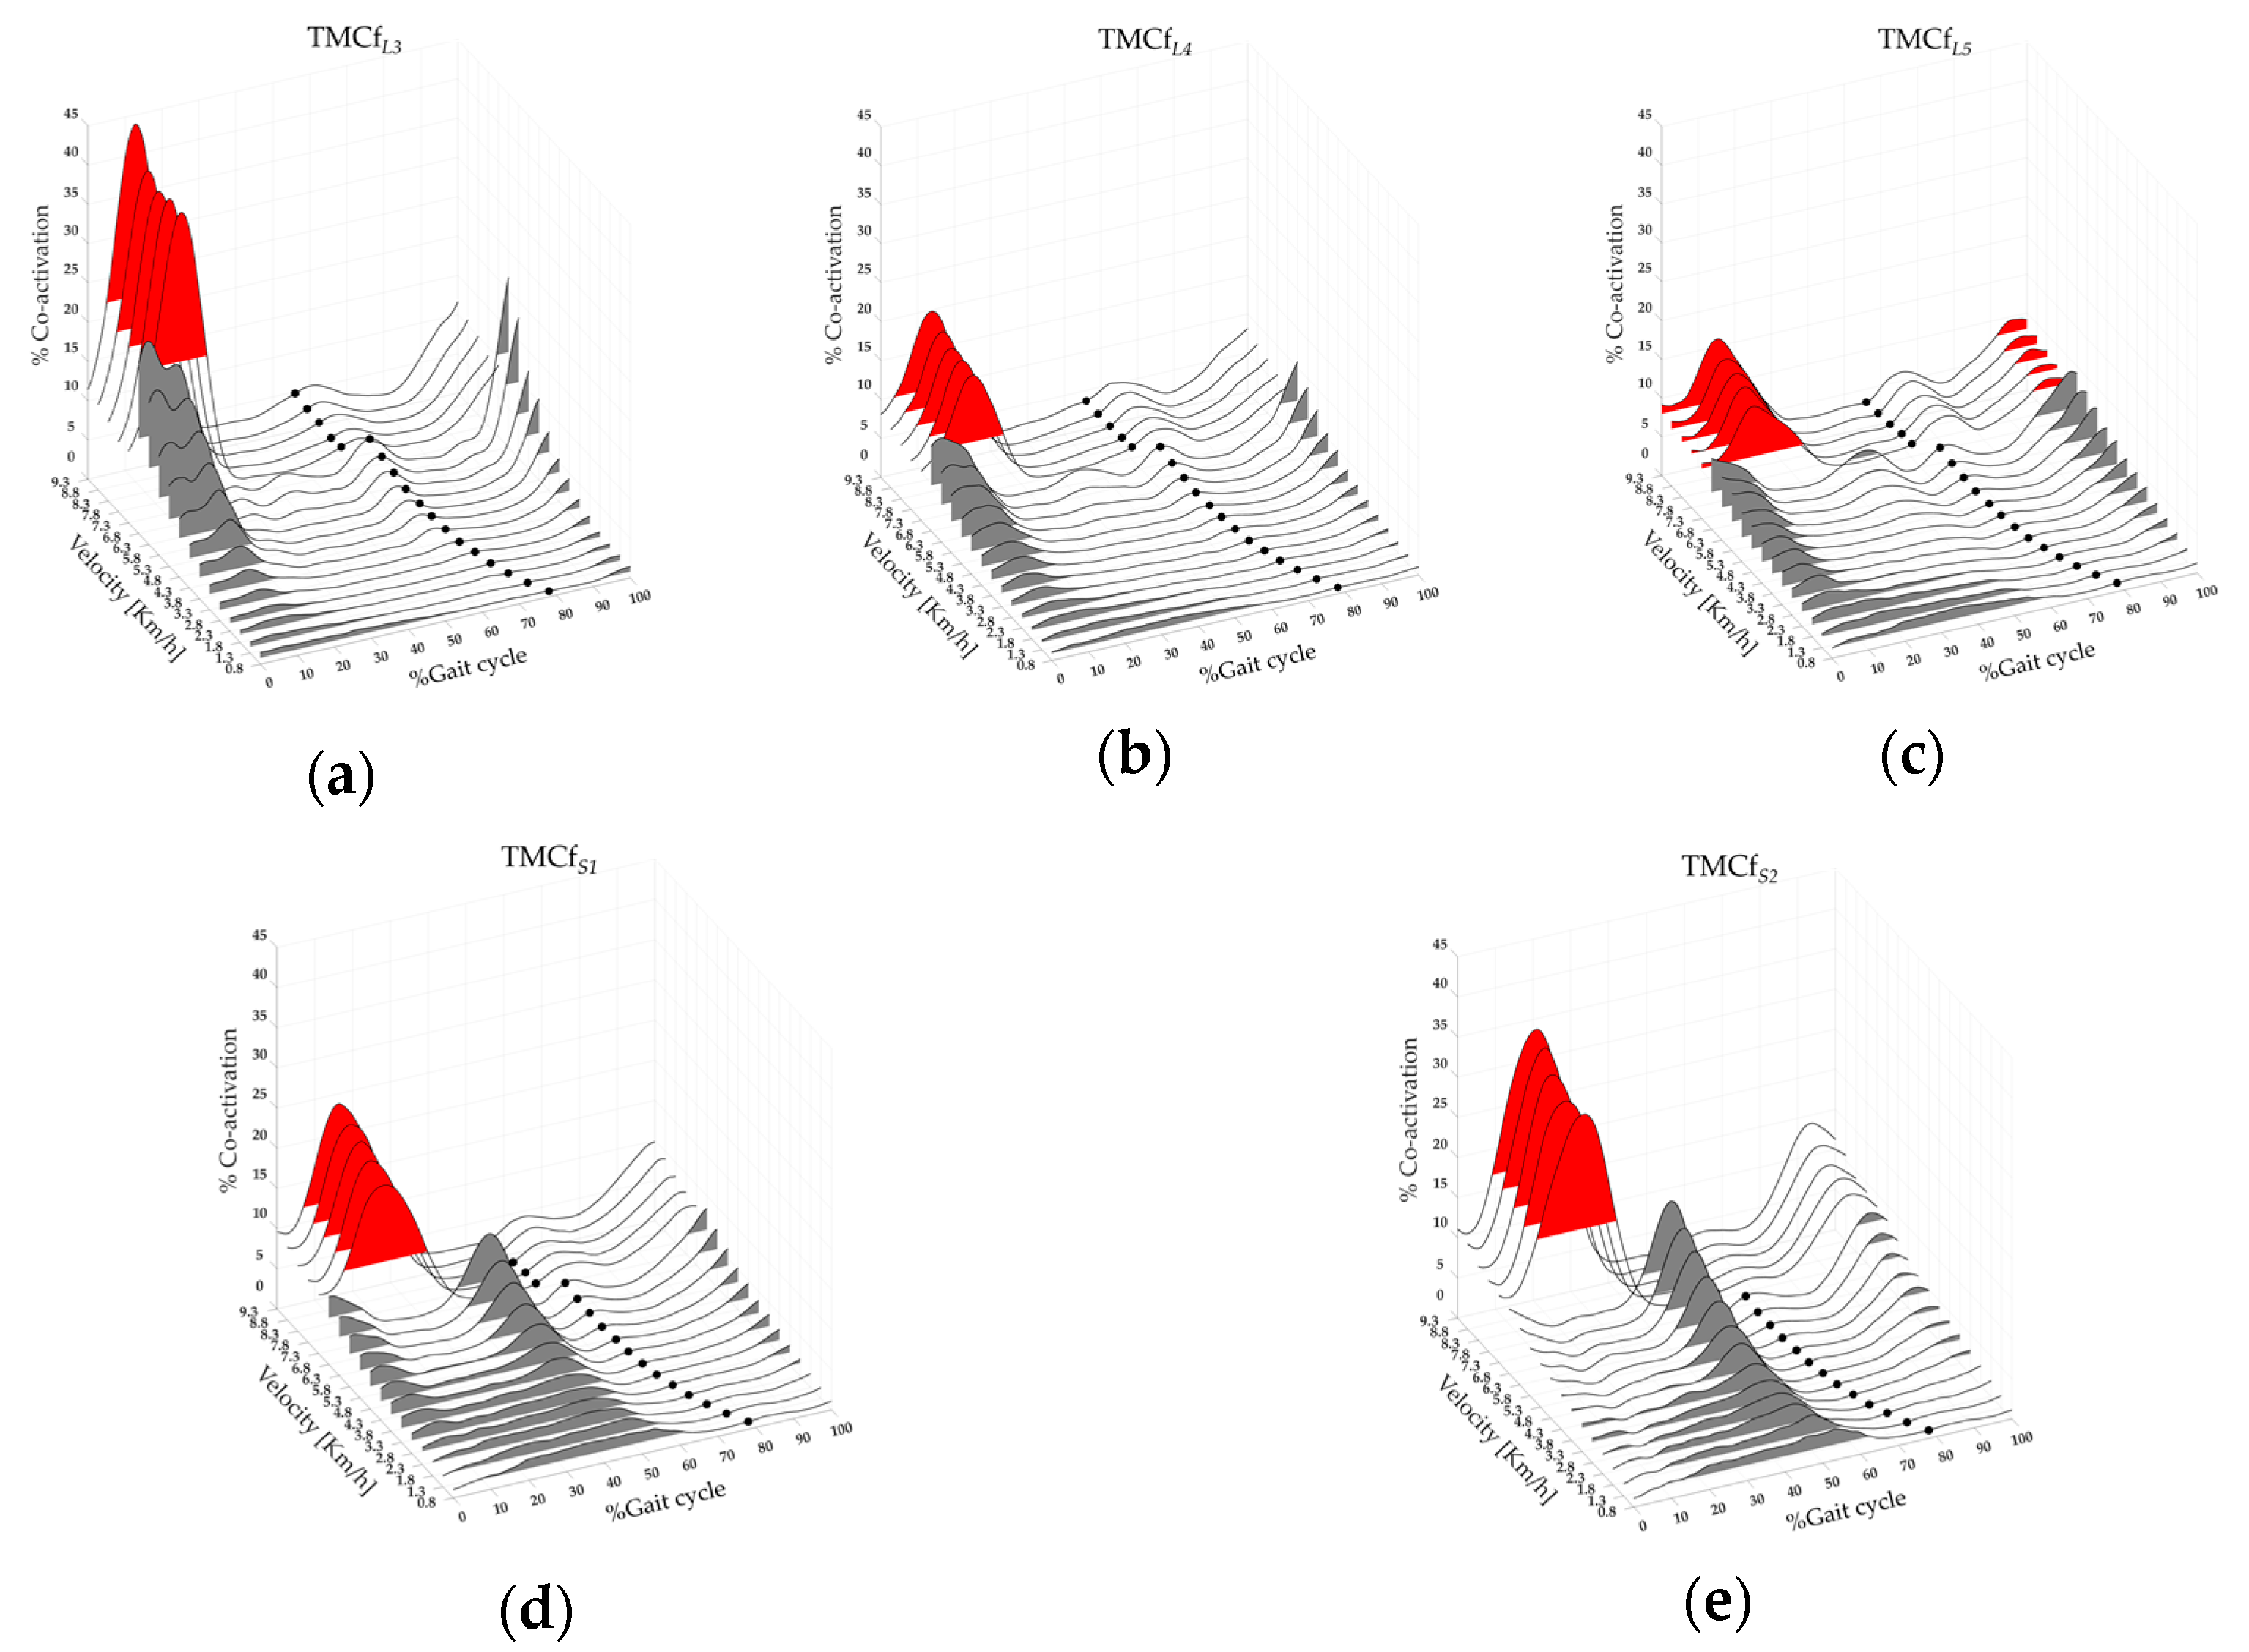
2.4.2. Global, Flexor, Extensor and Rostro–Caudal Co-Activation of Lower Limb Muscles

The raw sEMG signals were visually reviewed to remove any artifact-containing cycles. They were then band-pass filtered with a zero-lag fifth-order Butterworth (20–450 Hz) [51,52] to keep only the signal of interest and then full-wave rectified and low-pass filtered with a zero-lag fifth-order Butterworth (10 Hz) [53]. The elaborated sEMG signals [54,55] of each muscle were amplitude-normalized (0–100%) for each runner in relation to the mean of their three highest peak values detected across all gait cycles and velocities [33,56].
The TMCf was used to calculate the simultaneous activation of the lower-limb muscles based on the processed sEMG signals [3,33,37,38,57,58,59]. The full-wave-rectified, low-pass-filtered, and 0–100% amplitude normalized sEMG signals were used as inputs to this sigmoid-weighted time-dependent co-activation function for the inclusion of multiple muscles during walking and running. This co-activation function’s values ranged from 0 to 100%, and they were calculated as follows:
T M C f ( d ( i ) , i ) = C ( d ( t ) ) · ( m = 1 M E M G m ( i ) / M ) 2 m a x m = 1 M [ E M G m ( i ) ] = ( 1 1 1 + e a ( d ( i ) b ) ) · ( m = 1 M E M G m ( i ) / M ) 2 m a x m = 1 M [ E M G m ( i ) ]
where C ( d ( t ) ) is the sigmoid weight reduction coefficient, M is the number of muscles considered, and E M G m ( i ) is the sEMG sample value of the m - t h muscle at instant i . The function C ( d ( t ) ) , ranging between 0 and 1, takes into account, within the exponential function, the constants a and b equal to 12 and 0.5 respectively [37,57]. d(i) is the mean of the differences between each pair among the 12 muscles ( E M G m ( i ) ) values at instant i :
d ( i ) = ( m = 1 M 1 n = m + 1 M | E M G m ( i ) E M G n ( i ) | L ( M ! / ( 2 ! ( M 2 ) ! ) ) ) = ( m = 1 M 1 n = m + 1 M | E M G m ( i ) E M G n ( i ) | L ( M ( M 1 ) / 2 ) )
where L is the length of the signal and M ! / ( 2 ( M 2 ) ! ) is the total number of possible differences between each pair of EMGm(i).
T M C f ( d ( i ) , i ) has the following properties: an inverse relationship with the mean of the differences d(i), i.e., values close to the mean activation of the m ( i ) muscle sample values considered when d ( i ) is close to 0, and values close to 0 when d ( i ) is close to 1. The smaller the differences in muscle activations are, the closer the d ( i ) values are to 0; the closer the sigmoid-coefficient values are to 1, the closer the T M C f ( d ( i ) , i ) value is to its mean value. In contrast, the greater the differences in muscle activations, and the higher the d ( i ) and the lower the sigmoid coefficient, the lower the T M C f ( d ( i ) , i ) values will be. Data over individual strides was calculated for each runner and speed and then averaged across cycles.
All the acquired muscles were inserted in the calculation of the TMCf to assess global co-activation (TMCfglob). The co-activation of extensor (TMCfext) and flexor (TMCfflex) muscles were computed (Table 1) by considering the extensor and flexor muscle subgroups made up according to the “Concentric function”; it indicates that the flexor and extensor subgroups include those muscles which contract concentrically (shortening) during the flexion and extension of the joint [60]. The biarticular muscles were considered flexors or extensors based on their proximal function [61,62]. Furthermore, we calculated the TMCf by separating the muscles on the basis of their spinal segment of innervation (Table 1): first, all the muscles innervated by L3, then those by L4, then those by L5, then the one by S1, and finally those innervated by S2; thus rostro–caudal organization (TMCfL3; TMCfL4; TMCfL5; TMCfS1; TMCfS2) [41,60,63,64] was assessed using subgroups of muscles (see Table 1). Muscles were considered flexors or extensors based on their concentric function in the sagittal plane [60].

2.4.3. Co-Activation Parameters

Within the gait cycle, the following parameters were calculated for each map, runner, and speed:
(i)
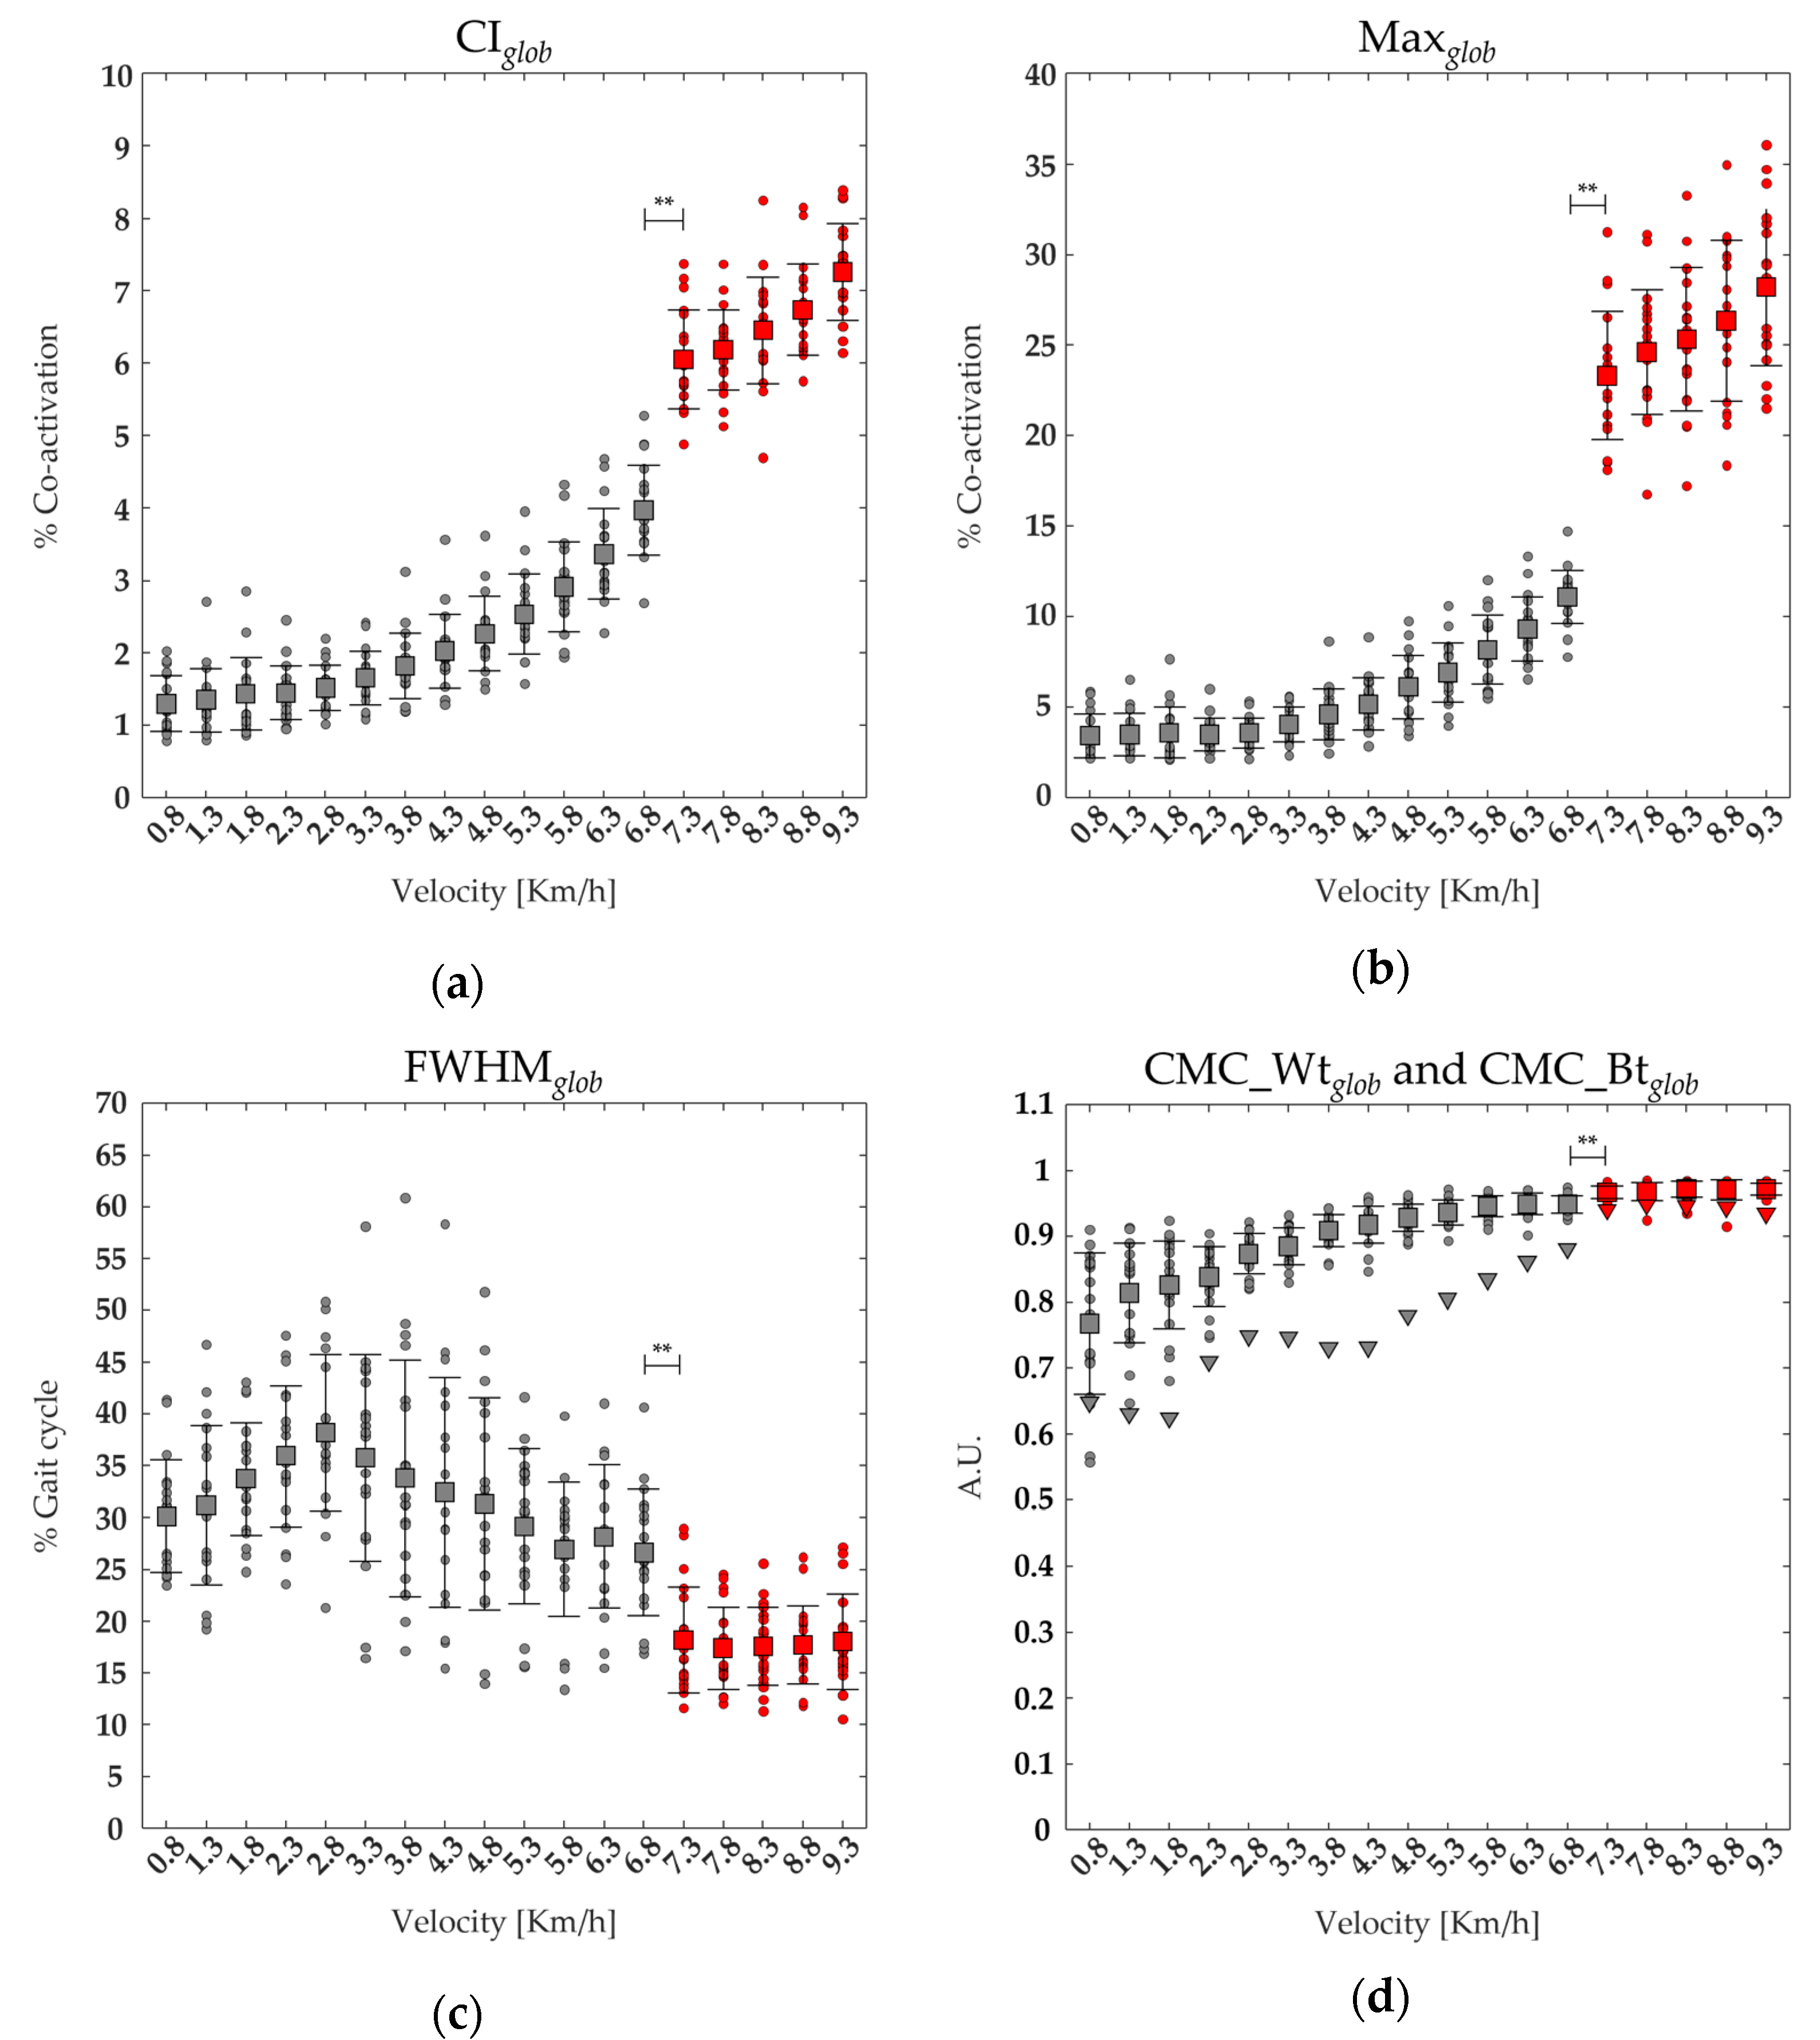
the synthetic co-activation index (CIglob; CIext; CIflex; CIL3; CIL4; CIL5; CIS1; CIS2) which is calculated as the mean value of the TMCf and represents the average of the co-activation level [% co-activation];
(ii)
the maximum value of the TMCf (Maxglob; Maxext; Maxflex; MaxL3; MaxL4; MaxL5; MaxS1; MaxS2) [% co-activation];
(iii)
the full width at half maximum (FWHMglob; FWHMext; FWHMflex; FWHML3; FWHML4; FWHML5; FWHMS1; FWHMS2) of the co-activation, which reflects the sum of the time durations within the gait cycle during which the TMCf curve is higher than its half maximum value [% gait cycle];
(iv)
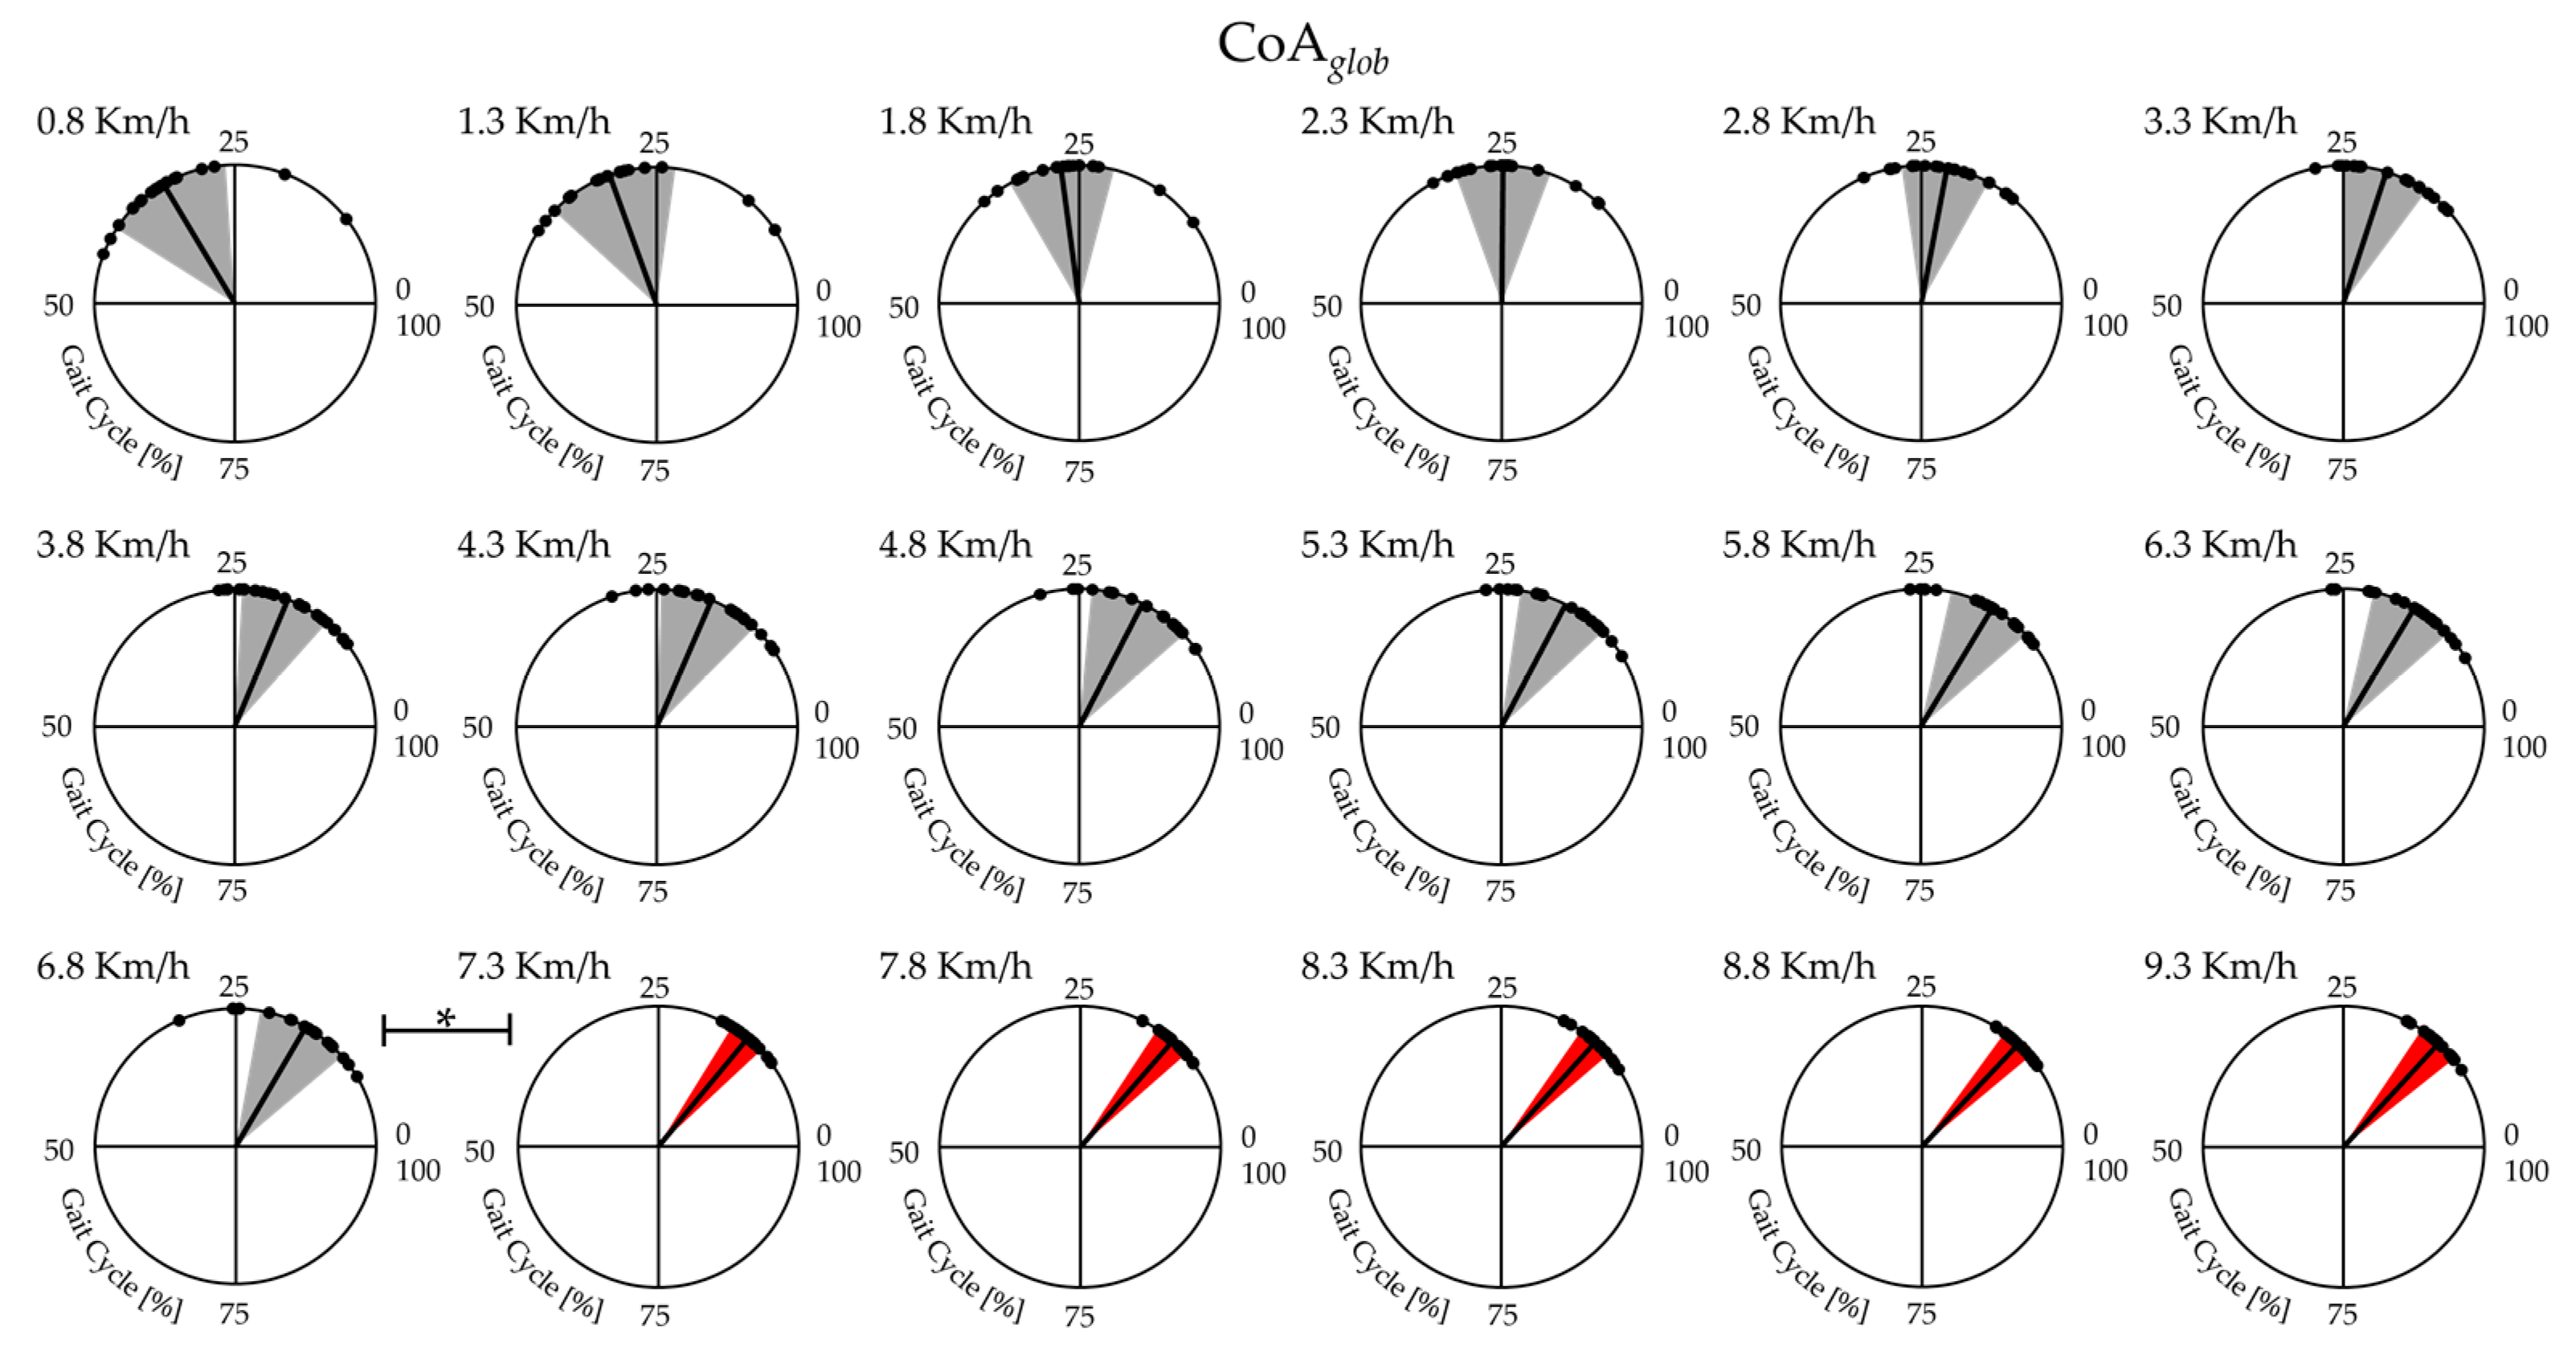
the center of activity (CoAglob; CoAext; CoAflex; CoAL3; CoAL4; CoAL5; CoAS1; CoAS2) which is calculated with circular statistics and plotted in polar coordinates to show where the most co-activation is concentrated within the walk and run cycles, and, in this study, also to show the instant of co-activation onset on the rostro–caudal maps [% gait cycle] [38,65]:
{ A = i = 1 201 ( cos θ t × E M G i ) B = i = 1 201 ( sin θ t × E M G i ) C o A = tan 1 ( B A )
where θ t is the angle in polar coordinates that varies from 0 to 360°.
(v)
is the coefficient of multiple correlation (CMC), which measures the overall waveform similarity of a group of curves (the closer to 1 the CMC is, the more similar the curves are) [66,67,68]. The CMC was calculated according to the following formula:
C M C = 1 ( 1 / ( T ( N 1 ) ) ) 1 N 1 T ( y i t y ¯ t ) 2 ( 1 / ( TN 1 ) ) 1 N 1 T ( y i t y ¯ ) 2
where T = 200 (number of points within the curve), N is the number of curves, y i t is the value at the t - t h point in the i - t h curve, y ¯ t is the average of the two curves at point t , and y ¯ t is the grand mean of all y i t .
Data over individual strides was calculated for each runner and speed and then averaged across cycles. Within (CMC_Wtglob, CMC_Wtext, CMC_Wtflex, CMC_WtL3, CMC_WtL4, CMC_WtL5, CMC_WtS1, CMC_WtS2) and between (CMC_Btglob, CMC_Btext, CMC_Btflex, CMC_BtL3, CMC_BtL4, CMC_BtL5, CMC_BtS1, CMC_BtS2) runners, the CMC was calculated.

2.4.4. Cross-Correlation

The shape similarity overall in the co-activation maps was evaluated using bidimensional normalized cross-correlation [33,38,69]. In detail, the central value of cross-correlation function R ( u , v ) , with an amplitude ranging from 0 to 1, was used to measure shape similarity between the global co-activation map and the extensor (RG-E) and flexor (RG-F) co-activation maps, as well as the shape similarity between the global co-activation map and the rostro–caudal co-activation maps (RG-L3, RG-L4, RG-L5, RG-S1, RG-S2).

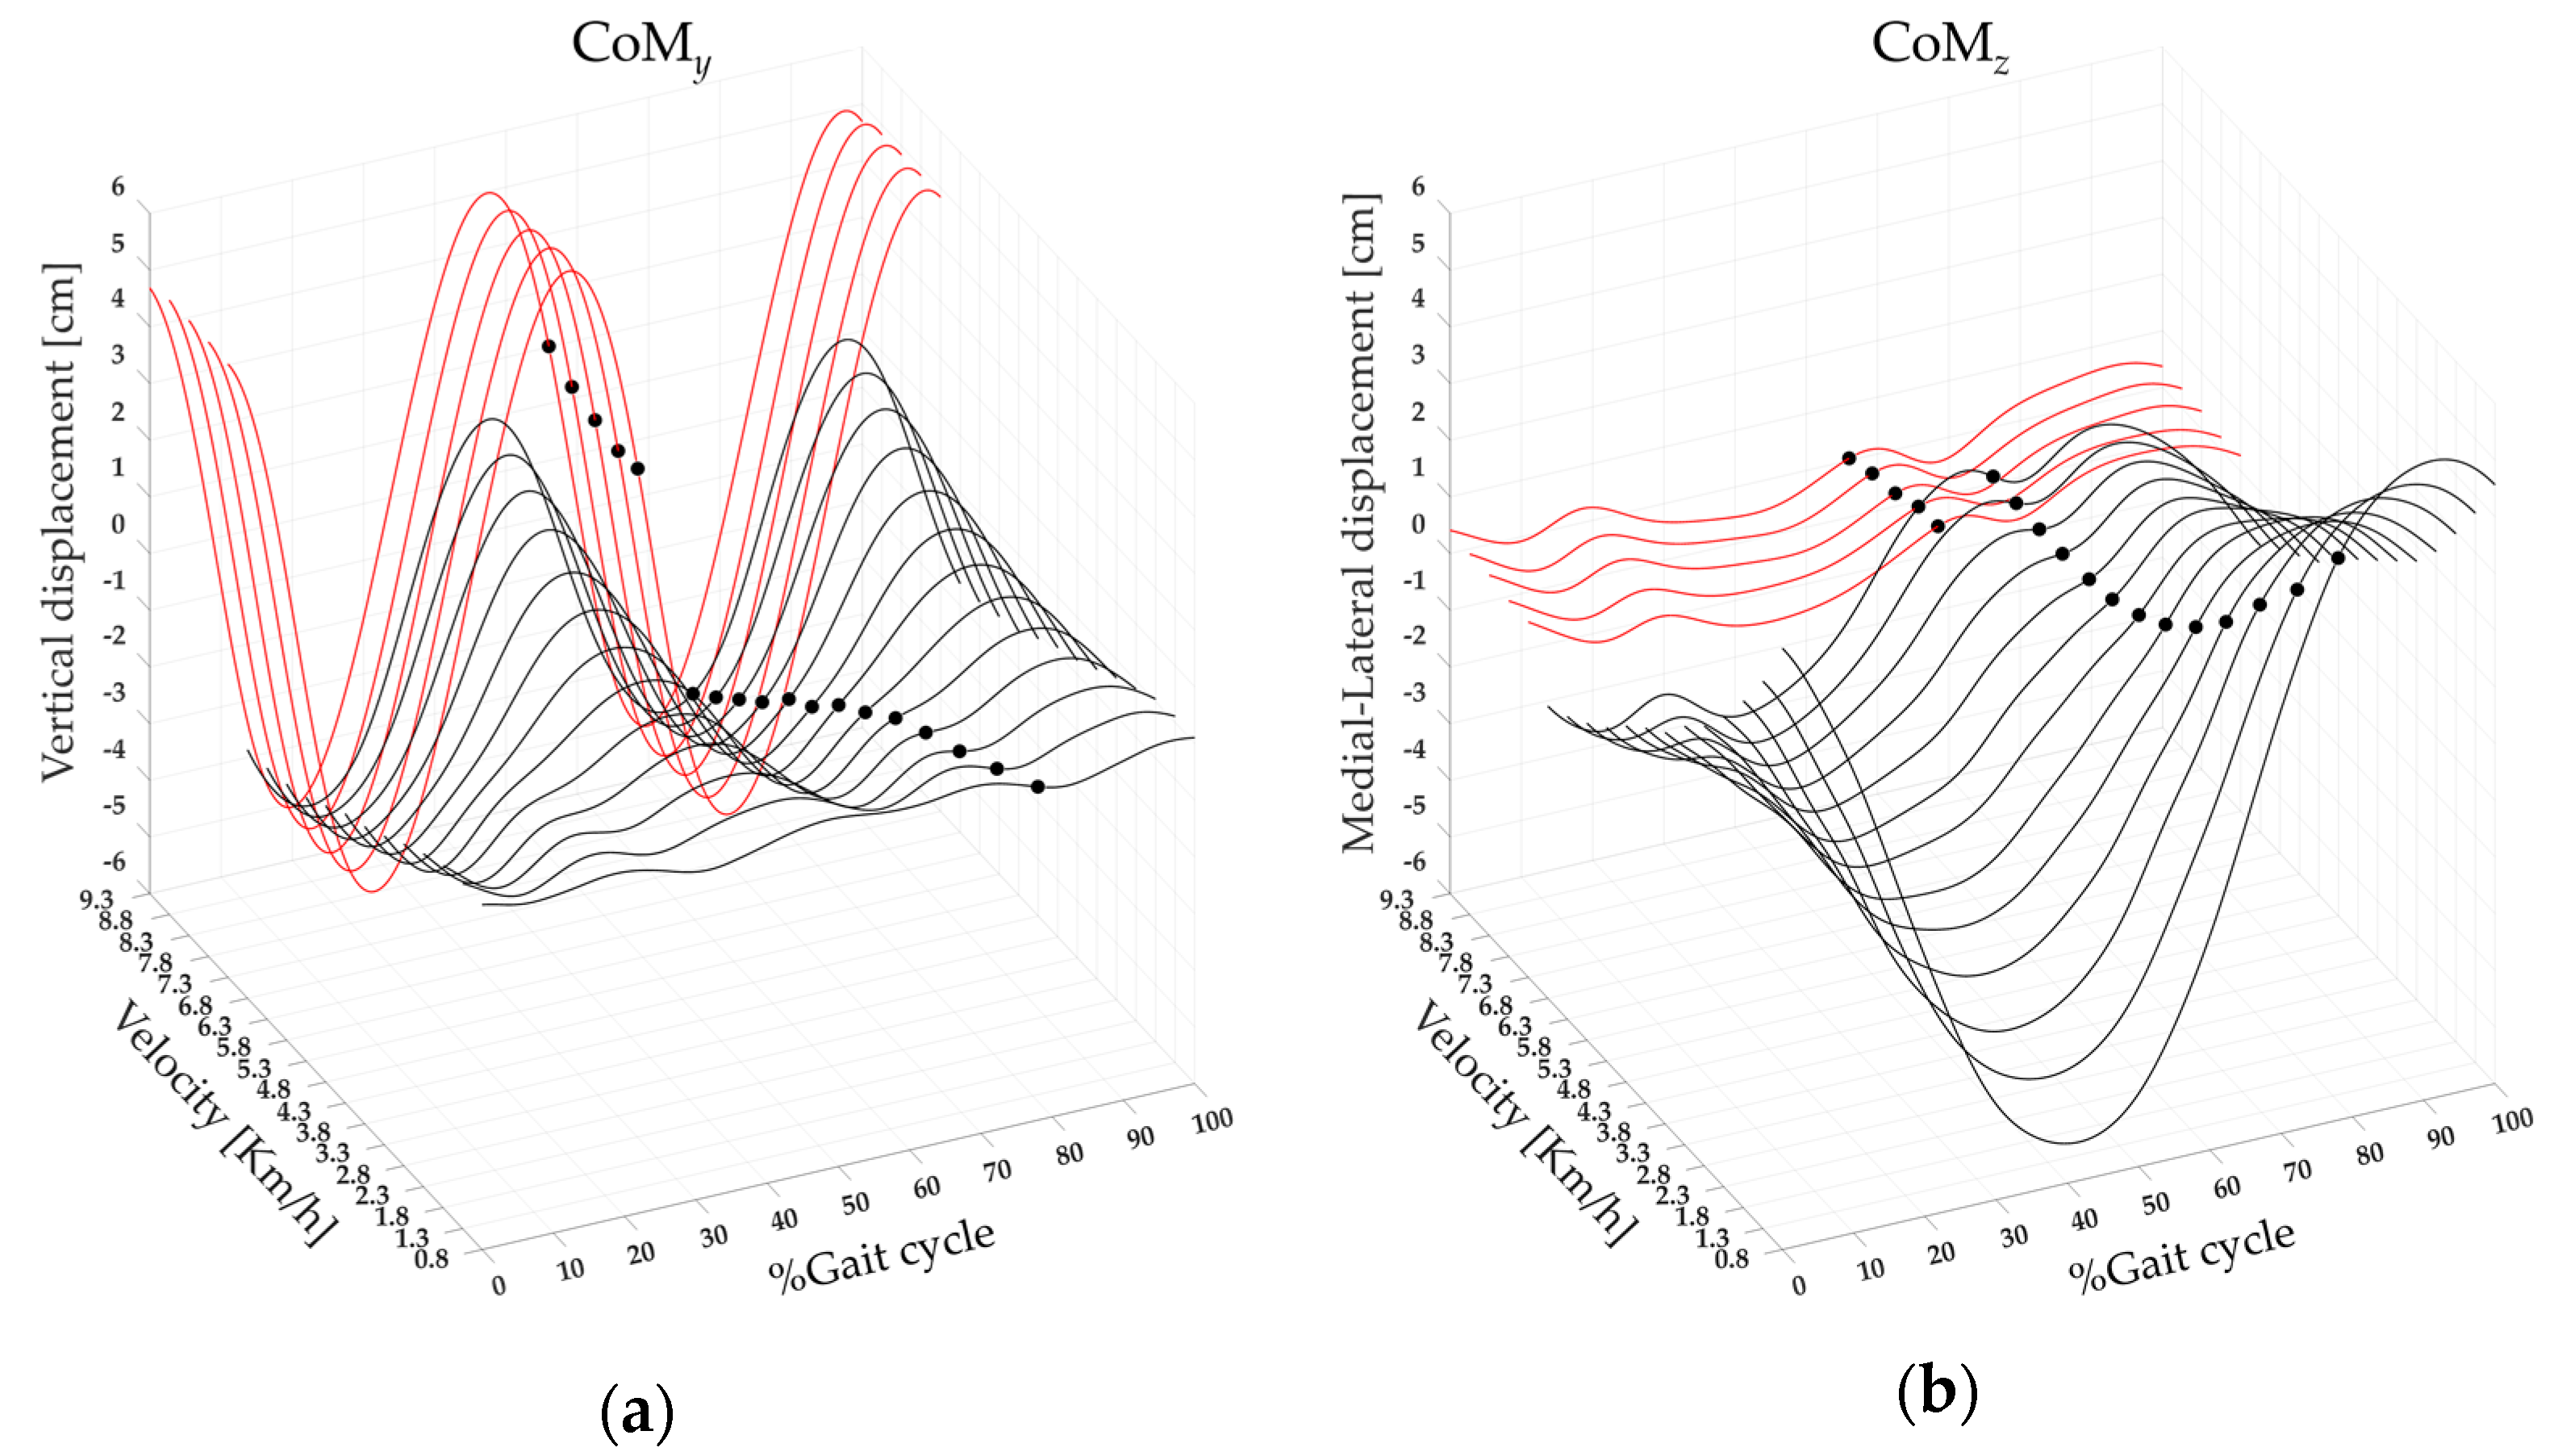
2.4.5. Center of Mass Displacement and Spatiotemporal Parameters

The whole-body CoM for each speed and runner was calculated using the “reconstructed pelvis method” [70,71,72], i.e., the geometric center of the triangle formed by the markers over the two anterior superior iliac spines and the sacrum, which is the pelvic center. The displacement in vertical (CoMy) and mediolateral (CoMz) directions was then calculated from the COM as the difference between the maximum and minimum values in their respective directions.
The following spatiotemporal parameters were determined for each speed and runner: (i) Toe-off event (TOe) [% gait cycle]; (ii) stride length [cm]; (iii) stride frequency [Hz]; (iv) foot lift [cm] [33,38,71,73,74]; with the latter calculated as the maximum elevation along the vertical direction (y coordinate) of the centroid formed by the heel, metatarsal head, and lateral malleoli.

2.4.6. Statistical Analysis

A repeated measures ANOVA was used to determine the significance of differences in co-activation parameters computed from global, flexor, extensor, and rostro–caudal maps, as well as the CoM and spatiotemporal parameters, with gait speed as a within-subjects factor (18 levels: from 0.8 to 9.3 km/h), followed by a Bonferroni’s pot-hoc analysis to determine whether there were significant differences between speeds.
An unpaired two-sample t-test was used to compare the shape similarity of the global vs extensor co-activation maps and the global vs flexor co-activation maps. A univariate ANOVA was performed with co-activation map shape similarity as a between-group factor (5 levels: global vs each rostro–caudal co-activation map), and a Bonferroni’s post-hoc analysis was performed to assess the significant differences between each shape similarity.
The Watson–Williams test for circular data was applied to CoAs calculated from global, flexor, and extensor co-activation maps, with gait speed as the between-group factor, followed by a Bonferroni’s pot-hoc analysis to see if there were any significant differences between the speeds [33,59,65,75]. Meanwhile, the Harrison–Kanji test for circular data was applied to CoAs calculated from rostro–caudal maps, with gait speed and spinal level as between and within-group factors. A Bonferroni’s post-hoc analysis was used to determine whether there were significant differences between spinal levels and speeds [76].
Gender differences were analyzed using a t-test or Mann–Whitney test after verifying the normality of the distributions through a Shapiro–Wilk test.
A partial correlation analysis was performed, excluding the effects of gait speed, between each calculated global, flexor-extensor, and rostro–caudal co-activation map and each CoM and spatiotemporal parameter. Strong correlations were defined as significant correlation coefficients > 0.69 [77].
The significance level was set to 0.05, and all analyses were carried out in MATLAB (8.3.0.532, MathWorks, Natick, MA, USA).

3. Results

For each investigated parameter, no significant differences were found based on gender (p > 0.05).

3.1. Global, Flexor, Extensor, and Rostro–Caudal Co-Activation Maps and Parameters

Figure 1 shows the three-dimensional global map of lower limb muscle co-activation from slow walking to running.
Figure 2 shows the average and standard deviation of 19 runners’ co-activation parameters (CIglob, Maxglob, FWHMglob, CMC_Wtglob, and CMC_Btglob) from slow walking to running. A significant main effect of gait speed was found on CIglob, Maxglob, FWHMglob, and CMC_Wtglob (see Table 2). The post-hoc analysis revealed that at the transition between walking (6.8 km/h) and running (7.3 km/h), the values of Ciglob, Maxglob, CMC_Wtglob, and CMC_Btglob were significantly higher, whereas the value of FWHMglob was significantly lower (see Figure 2 and Table 2).
Figure 3 shows the average and the standard deviation of 19 runners’ CoAglob from slow walking to running. A significant effect of gait speed was found on CoAglob (See Table 2). The post-hoc analysis revealed that at the transition between walking (6.8 km/h) and running (7.3 km/h), the values of CoAglob were significantly lower (see Figure 2 and Table 2).
Figure 4 shows the extensor (left side) and flexor (right side) maps of lower limb muscle co-activation from slow walking to running, with the averages of the TMCfext and TMCfflex curves (black lines), TOe (black dots), and FWHMext and FWHMflex (the area underlying the TMCfext and TMCfflex red and grey for run and walk, respectively) for all 19 runners. A significant effect of speed was found on extensor and flexor parameters: CIext and CIflex, on the Maxext and Maxflex, FWHMext and FWHMflex, CMC_Wtext, and CMC_Wtflex (see Table 2). The post-hoc analysis revealed that at the transition between walking (6.8 km/h) and running (7.3 km/h), the values of the CIext, Maxext, and CMC_Btext were significantly higher. In contrast, the value of CMC_Btflex was significantly lower (see Table 2).
A significant effect of gait speed was found on CoAext and CoAflex (see Table 2). The post-hoc analysis revealed that at the transition between walking (6.8 km/h) and running (7.3 km/h), the values of CoAext were significantly higher. In contrast, the value of CoAflex was significantly lower (see Table 2).
Figure 5 shows the rostro–caudal (from L3 to S2 spinal level) maps of lower limb muscle co-activation from slow walking to running with the averages of the TMCfL3, TMCfL4, TMCfL5, TMCfS1, TMCfS2 (black lines), TOe (black dots), and FWHML3, FWHML4, FWHML5, FWHMS1, FWHMS2 (the area underlying the curves, red and grey for run and walk respectively) for all 19 runners.
A significant effect of gait speed was found on CIL3, CIL4, CIL5, CIS1, and CIS2, on the MaxL3, MaxL4, MaxL5, MaxS1, and MaxS2, on the FWHML3, FWHML4, FWHML5, FWHMS1, FWHMS2, and on the CMC_WtL3, CMC_WtL4, CMC_WtL5, CMC_WtS1, CMC_WtS2 (see Table 2). The post-hoc analysis revealed that at the transition between walking (6.8 km/h) and running (7.3 km/h), the values of the CIL4, CIL5, CIS1, CIS2, MaxS1, MaxS2, CMC_WtS1, CMC_BtL3, CMC_BtL4, CMC_BtS1, and CMC_BtS2 were significantly higher. In contrast, the value of the CMC_BtL5 was significantly lower (see Table 2).
A significant effect of gait speed and level was found on CoAL3, CoAL4, CoAL5, CoAS1, and CoAS2 (see Table 2 and Table 3). The post-hoc analysis on speed revealed that at the transition between walking (6.8 km/h) and running (7.3 km/h), the values of the CoAL3, CoAL4, and CoAL5 were significantly higher. In contrast, the values of the CoAS1 and CoAS2 were significantly lower (see Table 2). The post-hoc analysis on the spine levels revealed that at the transition between walking (6.8 km/h) and running (7.3 km/h), the values of the CoAS1 were significantly higher than the CoAL3, CoAL4, and CoAL5. The values of the CoAS2 were significantly higher than the CoAL3, CoAL4, and CoAL5 (see Table 3).

3.2. Cross-Correlation

A significantly higher shape similarity between the global and the extensor co-activation map compared to the global and flexor co-activation map was found (see Table 4).
A significant effect of shape similarity was found between the global and rostro–caudal co-activation maps (see Table 4). The post-hoc analysis revealed that the value of the shape similarity between the global and S1 co-activation maps was significantly higher than the global and L3, L5, and S2 co-activation maps. The shape similarity between the global and L4 co-activation maps was significantly higher than the global, L3, and S2 co-activation maps (see Table 4).

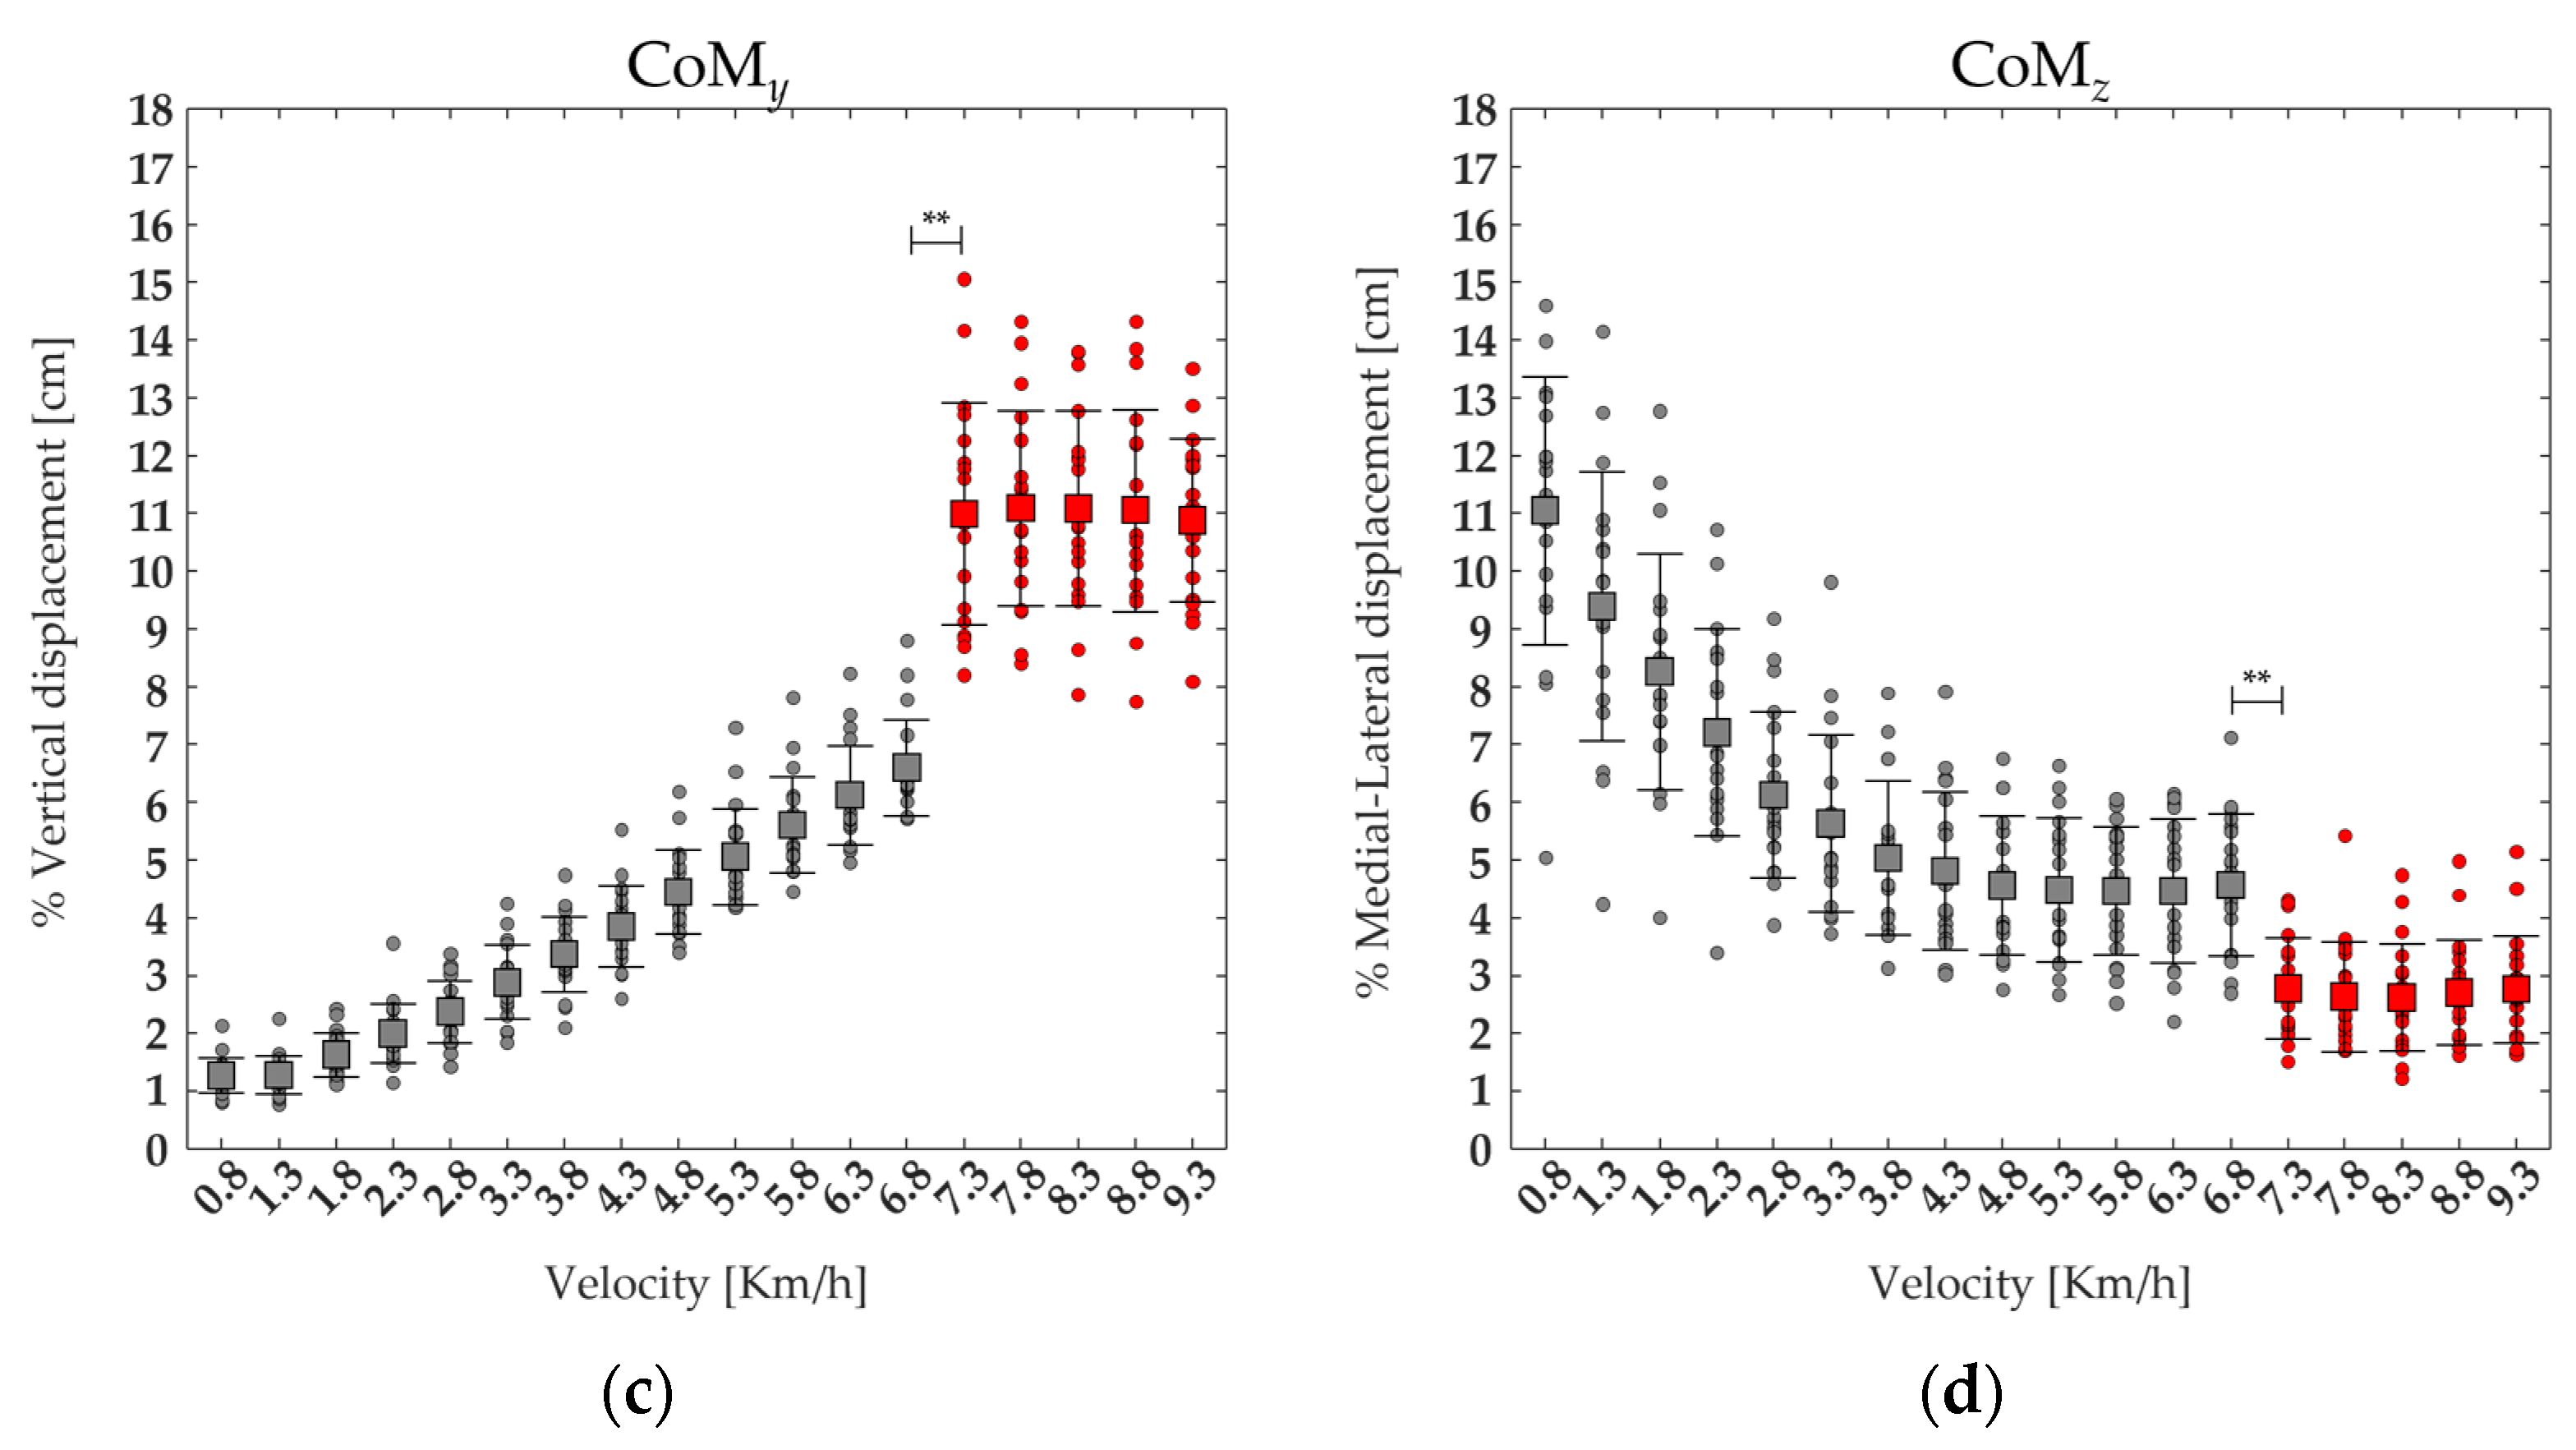
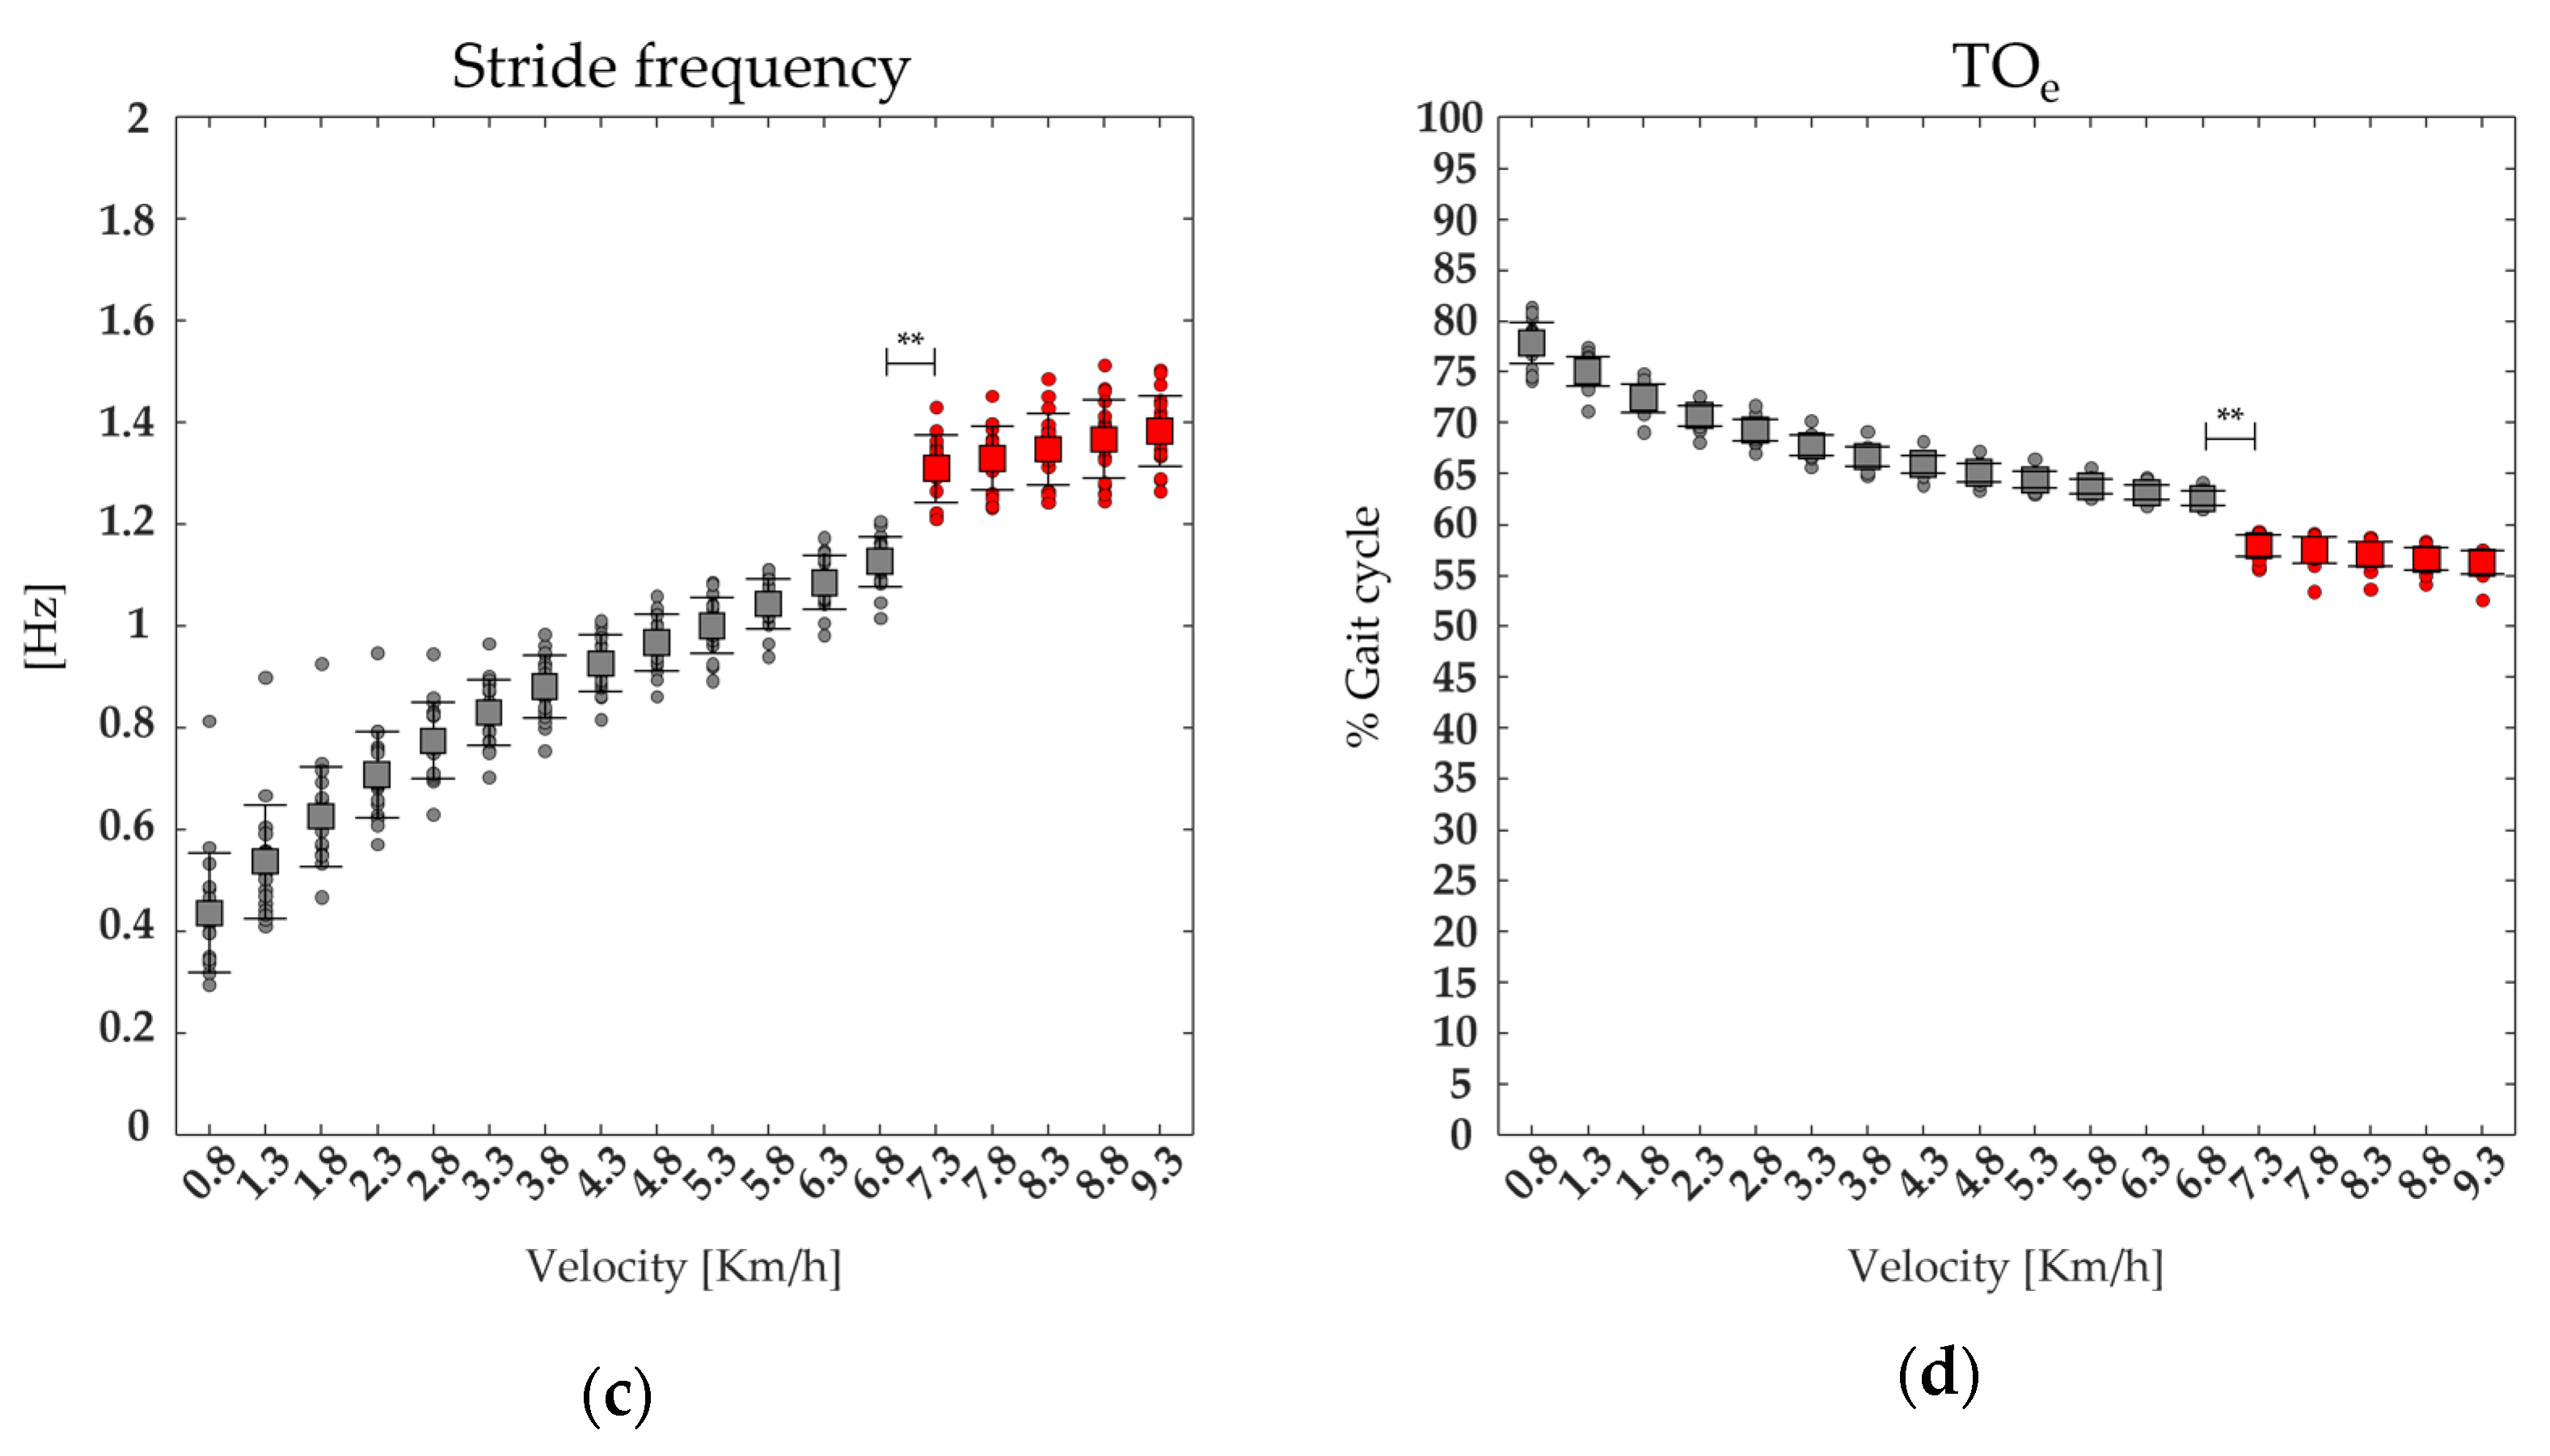
3.3. Center of Mass Displacement and Spatiotemporal Parameters

Figure 6 shows three-dimensional CoM maps in the vertical (CoMy) and mediolateral (CoMz) directions. The maps were created using the CoMy and CoMz displacement average curves of 19 runners calculated on the gait cycle, from 0% to 100% (x-axis), for each speed of walking and running performed, from 0.8 to 9.3 km/h (y-axis), and with a variable amplitude (z-axis). A significant effect of the speed was found on the CoMy and the CoMz. The post-hoc analysis revealed that at the transition between walking (6.8 km/h) and running (7.3 km/h), the values of the CoMy displacement were significantly higher. In contrast, the values of the CoMz displacement were significantly lower (see Figure 6 and Table 2).
A significant effect of the speed was found on the TOe, stride length, stride frequency, and foot lift. The post-hoc analysis revealed that the values of the stride length, foot lift, and stride frequency were significantly higher. In contrast, the values of the TOe were significantly lower at the transition between walking (6.8 km/h) and running (7.3 km/h) (see Figure 7 and Table 2).

3.4. Correlations

Regardless of the gait speed, the CoMy was positively correlated with a higher CIglob (r = 0.88, p < 0.001) and Maxglob (r = 0.89, p < 0.001) and negatively correlated with the FWHMglob (r = −0.83, p < 0.001) values; whereas, the CoMz was positively correlated with the CoAglob values (r = 0.97, p < 0.001). The stride length values were negatively correlated with the CIglob (r = −0.98, p < 0.001) and Maxlob (r = −0.99, p < 0.001) values and positively correlated with the FWHMglob (r = 0.80, p < 0.001). The foot lift values were positively correlated with the Maxglob values (r = 0.72, p = 0.001), and the cadence values were negatively correlated with the CoAglob values (r = −0.72, p < 0.001). In contrast, TOe values were positively correlated with CoAglob values (r = 0.79, p < 0.001).

4. Discussion

The objective of this study was to explore the behavior of the lower limb muscles’ co-activation across several speeds, ranging from walking to running, as an expression of the CNS’s global strategy for controlling the simultaneous activation of several lower limb muscles during locomotion.
We found that at higher speeds, the global co-activation index rises with increasing co-activation function values and that co-activation occurs earlier and for a shorter period than at slower speeds. This is especially evident while transitioning from walking to running, as indicated by higher CIglob and Maxglob values when walking and lower CoAglob and FWHMglob values while running (see Figure 2 and Figure 3). We also found that running resulted in increased vertical displacement, foot lift, stride frequency, and decreased lateral displacement and stride length, compared to walking (see Figure 6 and Figure 7), which is consistent with earlier research on the biomechanics of running [19,20,21,22]. Interestingly, regardless of gait speed, global co-activation occurring earlier and in a confined portion of the gait cycle was positively correlated with higher vertical displacement, stride frequency, and foot lift and negatively correlated with lower lateral displacement and stride length.
From slow walking to running, we found a different set of curve shapes in lower limb muscle co-activation (see Figure 1). The time-varying multi-muscle co-activation function revealed a one-hump configuration during slow walking, a four-hump configuration during fast walking, and a three-hump configuration during running. The lonely hump we found during slow walking, as well as the first hump we discovered during running, paralleled the entire duration of the stance contact phase. In contrast, the first two humps of fast walking distinctly corresponded to the loading (in the range of 10–20% of the gait cycle) and push-off (in the range of 40–60% of the gait cycle) subphases, respectively.
Overall, these humps reflected an increase in whole-limb stiffness in response to ground impact for weight acceptance and pushing on the ground for propulsive purposes, which was consistent with previous findings that the spatiotemporal profile of global co-activation matches that of ground reaction force (GRF) [33,38]. Both gait variability and CoM oscillation are known to increase during slow walking, resulting in less stable walking compared to faster gait [9,78,79]. The longer duration, lower magnitude (see Figure 1), and higher within and between subject variability of lower limb global co-activation observed at slow walking, as expressed by CMC values (See Figure 2), suggest that the increase in whole-limb stiffness is exerted within a long-lasting and variable “safety strategy,” primarily designed to maintain dynamic balance during body progression [78,79].
Conversely, the shorter duration, higher magnitude (see Figure 1), and lower within and between-subject variability of lower limb global co-activation (see Figure 2) observed during running suggest that whole-limb stiffness is exerted by more synchronized and stable muscle activation. It also implies that when transitioning from walking to running, the increased whole-limb muscle co-activation during the foot contact phase is intended to absorb ground impact and generate propulsive forces in a single motor act, most likely within a unique motor strategy. As a result, the CI could be a useful index for reflecting and assessing the efficiency of the “leg-spring” stiffness mechanism, which is correlated with more economical running [80,81].
The findings of the partial correlation analysis support the observed mechanisms of global co-activation. Regardless of gait speed, earlier and shorter values of global co-activation during the gait cycle reduce the stride length while increasing vertical and decreasing lateral CoM displacements. As a result, rather than being the result of changes in gait speed, it is possible to hypothesize that the observed differences in spatiotemporal and kinematic variables between walking and running could be the result of global co-activation, which is a sensory-control integration process used by the CNS to deal with a more demanding and potentially unstable task like running [82,83,84]. This explains why similar results in terms of co-activation indexes and kinematic characteristics were found in subjects with abnormal gait stability control, such as cerebellar ataxia, who attempt to compensate for gait instability by using global co-activation [33,71,73].
When we analyzed the co-activation of either flexor or extensor muscles separately, we found that the function curve of the extensor muscles matched that of the whole limb, whereas that of the flexor muscles clearly differed from it (see Figure 1 and Figure 4). These findings suggest that the main contribution to the whole limb stiffening during walking and running is mainly given by the co-activation of the extensor muscles according to their role in weight acceptance and propulsive function [85]. Such extensor activation clearly corresponds to the first hump of the global co-activation of both running and walking (both slow and fast) curves, as well as to the second hump of fast walking. Conversely, the co-activation curve of the flexor muscles increased during the early step air phase in line with the role of flexor muscles in limb lifting [85]. The co-activation of the flexor muscles, although small, was clearly present during running as the second hump of the global co-activation curve and during fast walking as the third hump (see Figure 4). This last result is of particular interest because it suggests that the flexor muscles are a key factor in transitioning from fast walking to running. It also fits well with the observation of a propagation delay in muscle co-activation from L3 to S2 (see Figure 5). These findings are in line with previous findings on walking [41,86,87] and reinforce the hypothesis that the co-activation of the flexor muscles (e.g., rectus femoris and iliopsoas), whose motoneurons are located more rostrally within the spinal cord, may play a crucial role in the switch from walking to running. Interestingly, although there was a clear progressive increase in the amount of co-activation of either global extensors or flexors from slow to fast walking, we found an increase in flexor co-activation just before the running speed threshold in the late fast walking trials, followed by a mild reduction in co-activation in the early running trials (see Figure 4 and Table 2). One of the key features in the transition from fast walking to running is the optimal exploitation of the mass-spring mechanism to generate kinetic energy during running [15,23]. We might infer that such an advantage, which occurs during ground contact, is related to global co-activation and reduces the need to coactivate the flexor muscles during the step air phase in early running compared to late fast walking. It is important to note that the co-activation of the flexor muscles corresponded to a small peak (second hump) in the “hollow” of the global co-activation curve, possibly suggesting that the flexor muscles need to be coactivated when the limb stiffness is reduced to facilitate the forward progression.
This study has several limitations. First, due to the experimental setup, anteroposterior CoM displacements could not be assessed, and thus, the kinetic energy parameters could not be calculated. We also did not account for oxygenation parameters, so our data cannot provide a complete characterization of global co-activation on running economy. However, because greater neuromuscular activation, vertical stiffness, and the ability to rapidly produce force throughout the lower limb during ground contact have been shown to correlate with more economical running [81,88,89], it is expected that CI values may correlate with the energetic running profile in future studies evaluating running performances. Other limitations are related to the superimposition of gait speeds through the use of a treadmill, which might have affected some gait parameters [38,74], and the lack of re-recording of the participants’ training programs. Therefore, further studies examining global co-activation indices during overground running are needed.

5. Conclusions

The findings of this study revealed a distinct pattern in global lower limb muscle co-activation across gait speeds and between walking and running tasks, with higher speeds resulting in earlier and shorter durations. This mechanism implies that when running, subjects employ a single motor strategy to absorb ground impact and generate propulsive forces, making the CI a potentially useful index to reflect the efficiency of the “leg-spring” stiffness mechanism and, as a result, to assess running efficiency. Focusing on muscle co-activation efficiency may assist sports professionals in tailoring training programs to improve running efficiency, as well as monitoring recovery after injury.

Author Contributions

Conceptualization, L.F., G.C., M.S., A.T., T.V. and A.R.; methodology, L.F., G.C., F.D., A.T., T.V. and A.R.; software, L.F.; validation, L.F., G.C., M.S., A.T., T.V. and A.R.; formal analysis, L.F., A.T. and T.V.; investigation, L.F., S.F.C., G.C., F.D., F.S., M.S., A.T., T.V. and A.R.; resources, L.F., S.F.C., G.C., F.D., F.S., M.S., A.T., T.V. and A.R.; data curation, L.F., A.T. and T.V.; writing—original draft preparation, L.F., S.F.C., G.C., M.S., A.T., T.V. and A.R.; writing—review and editing, L.F., S.F.C., G.C., F.D., F.S., M.S., A.T., T.V. and A.R.; visualization, L.F., S.F.C., G.C., F.D., F.S., M.S., A.T., T.V. and A.R.; supervision, F.D., M.S. and A.R.; project administration, F.D., M.S. and A.R.; funding acquisition, A.R. All authors have read and agreed to the published version of the manuscript.

Funding

The research presented in this article was carried out as part of the SOPHIA project, which has received funding from the European Union’s Horizon 2020 research and innovation program under Grant Agreement No. 871237 and as part of “Bando Ricerche in Collaborazione” 2022 ID 57 funded by INAIL.

Institutional Review Board Statement

The study was conducted in accordance with the Declaration of Helsinki and approved by the local Ethics Committee (N. 0078009/2021).

Informed Consent Statement

Informed consent was obtained from all subjects involved in the study.

Data Availability Statement

The raw data supporting the conclusions of this article will be made available by the authors on request.

Conflicts of Interest

The authors declare no conflict of interest.

References

  1. Hasan, Z. Biological Cybernetics Optimized Movement Trajectories and Joint Stiffness in Unperturbed, Inertially Loaded Movements; Springer: Berlin/Heidelberg, Germany, 1986; Volume 53. [Google Scholar]
  2. Latash, M.L. Muscle Coactivation: Definitions, Mechanisms, and Functions. J. Neurophysiol. 2018, 120, 88–104. [Google Scholar] [CrossRef]
  3. Le, P.; Best, T.M.; Khan, S.N.; Mendel, E.; Marras, W.S. A Review of Methods to Assess Coactivation in the Spine. J. Electromyogr. Kinesiol. 2017, 32, 51–60. [Google Scholar] [CrossRef]
  4. Rosa, M.C.N.; Marques, A.; Demain, S.; Metcalf, C.D.; Rodrigues, J. Methodologies to Assess Muscle Co-Contraction during Gait in People with Neurological Impairment—A Systematic Literature Review. J. Electromyogr. Kinesiol. 2014, 24, 179–191. [Google Scholar] [CrossRef]
  5. Cappellini, G.; Ivanenko, Y.P.; Poppele, R.E.; Lacquaniti, F. Motor Patterns in Human Walking and Running. J. Neurophysiol. 2006, 95, 3426–3437. [Google Scholar] [CrossRef] [PubMed]
  6. Heise, G.D.; Morgan, D.W.; Hough, H.; Craib, M. Relationships between Running Economy and Temporal EMG Characteristics of Bi-Articular Leg Muscles. Int. J. Sports Med. 1996, 17, 128–133. [Google Scholar] [CrossRef]
  7. Ivanenko, Y.P.; Poppele, R.E.; Lacquaniti, F. Five Basic Muscle Activation Patterns Account for Muscle Activity during Human Locomotion. J. Physiol. 2004, 556, 267–282. [Google Scholar] [CrossRef] [PubMed]
  8. Kellis, E.; Zafeiridis, A.; Amiridis, L.G. Muscle Coactivation Before and After the Impact Phase of Running Following Isokinetic Fatigue. J. Athl. Train. 2011, 46, 11–19. [Google Scholar] [CrossRef] [PubMed]
  9. Moore, I.S.; Jones, A.M.; Dixon, S.J. Relationship between Metabolic Cost and Muscular Coactivation across Running Speeds. J. Sci. Med. Sport 2014, 17, 671–676. [Google Scholar] [CrossRef] [PubMed]
  10. Shik, M.L.; Severin, F.V.; Orlovsky, G.N. Control of Walking and Running by Means of Electrical Stimulation of the Mesencephalon. Electroencephalogr. Clin. Neurophysiol. 1969, 26, 549. [Google Scholar] [PubMed]
  11. Blickhan, R. The Spring-Mass Model for Running and Hopping. J. Biomech. 1989, 22, 1217–1227. [Google Scholar] [CrossRef]
  12. McMahon, T.A.; Cheng, G.C. The Mechanics of Running: How Does Stiffness Couple with Speed? J. Biomech. 1990, 23, 65–78. [Google Scholar] [CrossRef]
  13. Sharbafi, M.A.; Seyfarth, A. FMCH: A New Model for Human-like Postural Control in Walking. IEEE Int. Conf. Intell. Robot. Syst. 2015, 2015, 5742–5747. [Google Scholar] [CrossRef]
  14. Alexander, R.M. Energy-Saving Mechanisms in Walking and Running. J. Exp. Biol. 1991, 160, 55–69. [Google Scholar] [CrossRef]
  15. Cavagna, G.A.; Thys, H.; Zamboni, A. The Sources of External Work in Level Walking and Running. J. Physiol. 1976, 262, 639–657. [Google Scholar] [CrossRef] [PubMed]
  16. Farley, C.T.; Glasheen, J.; McMahon, T.A. Running Springs: Speed and Animal Size. J. Exp. Biol. 1993, 185, 71–86. [Google Scholar] [CrossRef] [PubMed]
  17. Xu, D.; Zhou, H.; Quan, W.; Jiang, X.; Liang, M.; Li, S.; Ugbolue, U.C.; Baker, J.S.; Gusztav, F.; Ma, X.; et al. A New Method Proposed for Realizing Human Gait Pattern Recognition: Inspirations for the Application of Sports and Clinical Gait Analysis. Gait Posture 2024, 107, 293–305. [Google Scholar] [CrossRef] [PubMed]
  18. Xu, D.; Quan, W.; Zhou, H.; Sun, D.; Baker, J.S.; Gu, Y. Explaining the Differences of Gait Patterns between High and Low-Mileage Runners with Machine Learning. Sci. Rep. 2022, 12, 2981. [Google Scholar] [CrossRef]
  19. Hreljac, A.; Imamura, R.T.; Escamilla, R.F.; Edwards, W.B. When Does A Gait Transition Occur During Human Locomotion? J. Sports Sci. Med. 2007, 6, 36. [Google Scholar] [PubMed]
  20. Rotstein, A.; Berginsky, T.; Meckel, Y. Preferred Transition Speed between Walking and Running: Effects of Training Status. Med. Sci. Sports Exerc. 2005, 37, 1864–1870. [Google Scholar] [CrossRef] [PubMed]
  21. Segers, V.; Aerts, P.; Lenoir, M.; De Clercq, D. Spatiotemporal Characteristics of the Walk-to-Run and Run-to-Walk Transition When Gradually Changing Speed. Gait Posture 2006, 24, 247–254. [Google Scholar] [CrossRef]
  22. Segers, V.; Aerts, P.; Lenoir, M.; De Clerq, D. Dynamics of the Body Centre of Mass during Actual Acceleration across Transition Speed. J. Exp. Biol. 2007, 210, 578–585. [Google Scholar] [CrossRef]
  23. Ker, R.F. The Design of Soft Collagenous Load-Bearing Tissues. J. Exp. Biol. 1999, 202, 3315–3324. [Google Scholar] [CrossRef]
  24. Hof, A.; Gazendam, M. Averaged EMG Profiles in Running Compared to Walking. Gait Posture 2006, 24, S77–S78. [Google Scholar] [CrossRef]
  25. Howard, R.; Conway, R.; Biomechanics, A.H.-S. Muscle Activity in Sprinting: A Review. Sports Biomech. 2018, 17, 1–17. [Google Scholar] [CrossRef]
  26. Zavorsky, G.S.; Montgomery, D.L.; Pearsall, D.J. Effect of Intense Interval Workouts on Running Economy Using Three Recovery Durations. Eur. J. Appl. Physiol. Occup. Physiol. 1998, 77, 224–230. [Google Scholar] [CrossRef] [PubMed]
  27. Peterson, D.S.; Martin, P.E. Effects of Age and Walking Speed on Coactivation and Cost of Walking in Healthy Adults. Gait Posture 2010, 31, 355–359. [Google Scholar] [CrossRef] [PubMed]
  28. Prilutsky, B.I.; Gregor, R.J. Swing- and Support-Related Muscle Actions Differentially Trigger Human Walk–Run and Run–Walk Transitions. J. Exp. Biol. 2001, 204, 2277–2287. [Google Scholar] [CrossRef] [PubMed]
  29. Winter, D.A.; Yack, H.J. EMG Profiles during Normal Human Walking: Stride-to-Stride and Inter-Subject Variability. Electroencephalogr. Clin. Neurophysiol. 1987, 67, 402–411. [Google Scholar] [CrossRef] [PubMed]
  30. Lieberman, D.E.; Raichlen, D.A.; Pontzer, H.; Bramble, D.M.; Cutright-Smith, E. The Human Gluteus Maximus and Its Role in Running. J. Exp. Biol. 2006, 209, 2143–2155. [Google Scholar] [CrossRef] [PubMed]
  31. Heise, G.; Shinohara, M.; Binks, L. Biarticular Leg Muscles and Links to Running Economy. Int. J. Sports Med. 2008, 29, 688–691. [Google Scholar] [CrossRef]
  32. Mari, S.; Serrao, M.; Casali, C.; Conte, C.; Martino, G.; Ranavolo, A.; Coppola, G.; Draicchio, F.; Padua, L.; Sandrini, G.; et al. Lower Limb Antagonist Muscle Co-Activation and Its Relationship with Gait Parameters in Cerebellar Ataxia. Cerebellum 2014, 13, 226–236. [Google Scholar] [CrossRef] [PubMed]
  33. Fiori, L.; Ranavolo, A.; Varrecchia, T.; Tatarelli, A.; Conte, C.; Draicchio, F.; Castiglia, S.F.; Coppola, G.; Casali, C.; Pierelli, F.; et al. Impairment of Global Lower Limb Muscle Coactivation During Walking in Cerebellar Ataxias. Cerebellum 2020, 19, 583–596. [Google Scholar] [CrossRef]
  34. Penn, R.D.; Gottlieb, G.L.; Agarwal, G.C. Cerebellar Stimulation in Man: Quantitative Changes in Spasticity. J. Neurosurg. 1978, 48, 779–786. [Google Scholar] [CrossRef]
  35. Arias, P.; Espinosa, N.; Robles-García, V.; Cao, R.; Cudeiro, J. Antagonist Muscle Co-Activation during Straight Walking and Its Relation to Kinematics: Insight from Young, Elderly and Parkinson’s Disease. Brain Res. 2012, 1455, 124–131. [Google Scholar] [CrossRef] [PubMed]
  36. Houk, J.C. Agents of the Mind. Biol. Cybern. 2005, 92, 427–437. [Google Scholar] [CrossRef]
  37. Ranavolo, A.; Mari, S.; Conte, C.; Serrao, M.; Silvetti, A.; Iavicoli, S.; Draicchio, F. A New Muscle Co-Activation Index for Biomechanical Load Evaluation in Work Activities. Ergonomics 2015, 58, 966–979. [Google Scholar] [CrossRef] [PubMed]
  38. Varrecchia, T.; Rinaldi, M.; Serrao, M.; Draicchio, F.; Conte, C.; Conforto, S.; Schmid, M.; Ranavolo, A. Global Lower Limb Muscle Coactivation during Walking at Different Speeds: Relationship between Spatio-Temporal, Kinematic, Kinetic, and Energetic Parameters. J. Electromyogr. Kinesiol. 2018, 43, 148–157. [Google Scholar] [CrossRef]
  39. Ivanenko, Y.P.; Cappellini, G.; Dominici, N.; Poppele, R.E.; Lacquaniti, F. Modular Control of Limb Movements during Human Locomotion. J. Neurosci. 2007, 27, 11149–11161. [Google Scholar] [CrossRef]
  40. Mo, S.; Chow, D.H.K. Differences in Lower-Limb Coordination and Coordination Variability between Novice and Experienced Runners during a Prolonged Treadmill Run at Anaerobic Threshold Speed. J. Sports Sci. 2019, 37, 1021–1028. [Google Scholar] [CrossRef]
  41. Ivanenko, Y.P.; Poppele, R.E.; Lacquaniti, F. Spinal Cord Maps of Spatiotemporal Alpha-Motoneuron Activation in Humans Walking at Different Speeds. J. Neurophysiol. 2006, 95, 602–618. [Google Scholar] [CrossRef]
  42. La Scaleia, V.; Ivanenko, Y.P.; Zelik, K.E.; Lacquaniti, F. Spinal Motor Outputs during Step-to-Step Transitions of Diverse Human Gaits. Front. Hum. Neurosci. 2014, 8, 73500. [Google Scholar] [CrossRef] [PubMed]
  43. Martino, G.; Ivanenko, Y.; Serrao, M.; Ranavolo, A.; Draicchio, F.; Rinaldi, M.; Casali, C.; Lacquaniti, F. Differential Changes in the Spinal Segmental Locomotor Output in Hereditary Spastic Paraplegia. Clin. Neurophysiol. 2018, 129, 516–525. [Google Scholar] [CrossRef] [PubMed]
  44. Faul, F.; Erdfelder, E.; Lang, A.G.; Buchner, A. G*Power 3: A Flexible Statistical Power Analysis Program for the Social, Behavioral, and Biomedical Sciences. Behav. Res. Methods 2007, 39, 175–191. [Google Scholar] [CrossRef] [PubMed]
  45. Merletti, R.; Cerone, G.L. Tutorial. Surface EMG Detection, Conditioning and Pre-Processing: Best Practices. J. Electromyogr. Kinesiol. 2020, 54, 102440. [Google Scholar] [CrossRef]
  46. Merletti, R.; Muceli, S. Tutorial. Surface EMG Detection in Space and Time: Best Practices. J. Electromyogr. Kinesiol. 2019, 49, 102363. [Google Scholar] [CrossRef]
  47. Hermens, H.J.; Freriks, B.; Disselhorst-Klug, C.; Rau, G. Development of Recommendations for SEMG Sensors and Sensor Placement Procedures. J. Electromyogr. Kinesiol. 2000, 10, 361–374. [Google Scholar] [CrossRef]
  48. Barbero, M.; Merletti, R.; Rainoldi, A. Atlas of Muscle Innervation Zones: Understanding Surface Electromyography and Its Applications; Springer Science & Business Media: Berlin/Heidelberg, Germany, 2012. [Google Scholar]
  49. Benedetti, M.G.; Beghi, E.; De Tanti, A.; Cappozzo, A.; Basaglia, N.; Cutti, A.G.; Cereatti, A.; Stagni, R.; Verdini, F.; Manca, M.; et al. SIAMOC Position Paper on Gait Analysis in Clinical Practice: General Requirements, Methods and Appropriateness. Results of an Italian Consensus Conference. Gait Posture 2017, 58, 252–260. [Google Scholar] [CrossRef]
  50. Davis, R.B.; Õunpuu, S.; Tyburski, D.; Gage, J.R. A Gait Analysis Data Collection and Reduction Technique. Hum. Mov. Sci. 1991, 10, 575–587. [Google Scholar] [CrossRef]
  51. Butler, H.L.; Newell, R.; Hubley-Kozey, C.L.; Kozey, J.W. The Interpretation of Abdominal Wall Muscle Recruitment Strategies Change When the Electrocardiogram (ECG) Is Removed from the Electromyogram (EMG). J. Electromyogr. Kinesiol. 2009, 19, e102–e113. [Google Scholar] [CrossRef]
  52. Drake, J.D.M.; Callaghan, J.P. Elimination of Electrocardiogram Contamination from Electromyogram Signals: An Evaluation of Currently Used Removal Techniques. J. Electromyogr. Kinesiol. 2006, 16, 175–187. [Google Scholar] [CrossRef]
  53. Winter, D. Biomechanics and Motor Control of Human Movement; John Wiley & Sons: Hoboken, NJ, USA, 2009. [Google Scholar]
  54. Xu, D.; Zhou, H.; Quan, W.; Gusztav, F.; Baker, J.S.; Gu, Y. Adaptive Neuro-Fuzzy Inference System Model Driven by the Non-Negative Matrix Factorization-Extracted Muscle Synergy Patterns to Estimate Lower Limb Joint Movements. Comput. Methods Programs Biomed. 2023, 242, 107848. [Google Scholar] [CrossRef]
  55. Xu, D.; Zhou, H.; Quan, W.; Gusztav, F.; Wang, M.; Baker, J.S.; Gu, Y. Accurately and Effectively Predict the ACL Force: Utilizing Biomechanical Landing Pattern before and after-Fatigue. Comput. Methods Programs Biomed. 2023, 241, 107761. [Google Scholar] [CrossRef]
  56. Burden, A. How Should We Normalize Electromyograms Obtained from Healthy Participants? What We Have Learned from over 25 Years of Research. J. Electromyogr. Kinesiol. 2010, 20, 1023–1035. [Google Scholar] [CrossRef]
  57. Rinaldi, M.; D’Anna, C.; Schmid, M.; Conforto, S. Assessing the Influence of SNR and Pre-Processing Filter Bandwidth on the Extraction of Different Muscle Co-Activation Indexes from Surface EMG Data. J. Electromyogr. Kinesiol. 2018, 43, 184–192. [Google Scholar] [CrossRef]
  58. Serrao, M.; Rinaldi, M.; Ranavolo, A.; Lacquaniti, F.; Martino, G.; Leonardi, L.; Conte, C.; Varrecchia, T.; Draicchio, F.; Coppola, G.; et al. Gait Patterns in Patients with Hereditary Spastic Paraparesis. PLoS ONE 2016, 11, e0164623. [Google Scholar] [CrossRef]
  59. Tatarelli, A.; Serrao, M.; Varrecchia, T.; Fiori, L.; Draicchio, F.; Silvetti, A.; Conforto, S.; Marchis De, C.; Ranavolo, A. Global Muscle Coactivation of the Sound Limb in Gait of People with Transfemoral and Transtibial Amputation. Sensors 2020, 20, 2543. [Google Scholar] [CrossRef]
  60. Kendall, F.; McCreary, E.; Provance, P.; Rodgers, M. Muscles: Testing and Function with Posture and Pain; Lippincott Williams & Wilkins: Baltimore, MD, USA, 2005. [Google Scholar]
  61. Nilsson, J.; Thorstensson, A.; Halbertsma, J. Changes in Leg Movements and Muscle Activity with Speed of Locomotion and Mode of Progression in Humans. Acta Physiol. Scand. 1985, 123, 457–475. [Google Scholar] [CrossRef]
  62. Prilutsky, B.I. Coordination of Two- and One-Joint Muscles: Functional Consequences and Implications for Motor Control. Motor Control 2000, 4, 1–44. [Google Scholar] [CrossRef] [PubMed]
  63. Dewolf, A.H.; Sylos-Labini, F.; Cappellini, G.; Zhvansky, D.; Willems, P.A.; Ivanenko, Y.; Lacquaniti, F. Neuromuscular Age-Related Adjustment of Gait When Moving Upwards and Downwards. Front. Hum. Neurosci. 2021, 15, 621. [Google Scholar] [CrossRef]
  64. Ivanenko, Y.P.; Dominici, N.; Lacquaniti, F. Development of Independent Walking in Toddlers. Exerc. Sport Sci. Rev. 2007, 35, 67–73. [Google Scholar] [CrossRef]
  65. Martino, G.; Ivanenko, Y.P.; Serrao, M.; Ranavolo, A.; d’Avella, A.; Draicchio, F.; Conte, C.; Casali, C.; Lacquaniti, F. Locomotor Patterns in Cerebellar Ataxia. J. Neurophysiol. 2014, 112, 2810–2821. [Google Scholar] [CrossRef]
  66. Kadaba, M.P.; Ramakrishnan, H.K.; Wootten, M.E.; Gainey, J.; Gorton, G.; Cochran, G.V.B. Repeatability of Kinematic, Kinetic, and Electromyographic Data in Normal Adult Gait. J. Orthop. Res. 1989, 7, 849–860. [Google Scholar] [CrossRef]
  67. Ranavolo, A.; Don, R.; Draicchio, F.; Bartolo, M.; Serrao, M.; Padua, L.; Cipolla, G.; Pierelli, F.; Iavicoli, S.; Sandrini, G. Modelling the Spine as a Deformable Body: Feasibility of Reconstruction Using an Optoelectronic System. Appl. Ergon. 2013, 44, 192–199. [Google Scholar] [CrossRef]
  68. Varrecchia, T.; Serrao, M.; Rinaldi, M.; Ranavolo, A.; Conforto, S.; De Marchis, C.; Simonetti, A.; Poni, I.; Castellano, S.; Silvetti, A.; et al. Common and Specific Gait Patterns in People with Varying Anatomical Levels of Lower Limb Amputation and Different Prosthetic Components. Hum. Mov. Sci. 2019, 66, 9–21. [Google Scholar] [CrossRef]
  69. Wren, T.A.L.; Patrick Do, K.; Rethlefsen, S.A.; Healy, B. Cross-Correlation as a Method for Comparing Dynamic Electromyography Signals during Gait. J. Biomech. 2006, 39, 2714–2718. [Google Scholar] [CrossRef]
  70. Ranavolo, A.; Conte, C.; Iavicoli, S.; Serrao, M.; Silvetti, A.; Sandrini, G.; Pierelli, F.; Draicchio, F. Walking Strategies of Visually Impaired People on Trapezoidal- and Sinusoidal-Section Tactile Groundsurface Indicators. Ergonomics 2011, 54, 246–256. [Google Scholar] [CrossRef]
  71. Rinaldi, M.; Ranavolo, A.; Conforto, S.; Martino, G.; Draicchio, F.; Conte, C.; Varrecchia, T.; Bini, F.; Casali, C.; Pierelli, F.; et al. Increased Lower Limb Muscle Coactivation Reduces Gait Performance and Increases Metabolic Cost in Patients with Hereditary Spastic Paraparesis. Clin. Biomech. 2017, 48, 63–72. [Google Scholar] [CrossRef]
  72. Whittle, M.W. Three-Dimensional Motion of the Center of Gravity of the Body during Walking. Hum. Mov. Sci. 1997, 16, 347–355. [Google Scholar] [CrossRef]
  73. Serrao, M.; Ranavolo, A.; Casali, C. Neurophysiology of Gait. Handb. Clin. Neurol. 2018, 154, 299–303. [Google Scholar] [CrossRef]
  74. Don, R.; Serrao, M.; Vinci, P.; Ranavolo, A.; Cacchio, A.; Ioppolo, F.; Paoloni, M.; Procaccianti, R.; Frascarelli, F.; De Santis, F.; et al. Foot Drop and Plantar Flexion Failure Determine Different Gait Strategies in Char-cot-Marie-Tooth Patients. Clin. Biomech. 2007, 22, 905–916. [Google Scholar] [CrossRef]
  75. Watson, G.S.; Williams, E.J. On the Construction of Significance Tests on the Circle and the Sphere. Biometrika 1956, 43, 344. [Google Scholar] [CrossRef]
  76. Harrison, D.; Kanji, G.K. The Development of Analysis of Variance for Circular Data. J. Appl. Stat. 2006, 15, 197–223. [Google Scholar] [CrossRef]
  77. Schober, P.; Schwarte, L.A. Correlation Coefficients: Appropriate Use and Interpretation. Anesth. Analg. 2018, 126, 1763–1768. [Google Scholar] [CrossRef]
  78. Fukuchi, C.A.; Fukuchi, R.K.; Duarte, M. Effects of Walking Speed on Gait Biomechanics in Healthy Participants: A Systematic Review and Meta-Analysis. Syst. Rev. 2019, 8, 153. [Google Scholar] [CrossRef]
  79. Tesio, L.; Rota, V. The Motion of Body Center of Mass During Walking: A Review Oriented to Clinical Applications. Front. Neurol. 2019, 10, 999. [Google Scholar] [CrossRef]
  80. Chen, S.; Wang, D.; Zhang, Q.; Shi, Y.; Ding, H.; Li, F. Relationship Between Isokinetic Lower-Limb Joint Strength, Isometric Time Force Characteristics, and Leg-Spring Stiffness in Recreational Runners. Front. Physiol. 2022, 12, 2421. [Google Scholar] [CrossRef]
  81. Struzik, A.; Karamanidis, K.; Lorimer, A.; Keogh, J.W.L.; Gajewski, J. Application of Leg, Vertical, and Joint Stiffness in Running Performance: A Literature Overview. Appl. Bionics. Biomech. 2021, 2021, 9914278. [Google Scholar] [CrossRef] [PubMed]
  82. Dzeladini, F.; van den Kieboom, J.; Ijspeert, A. The Contribution of a Central Pattern Generator in a Reflex-Based Neuromuscular Model. Front. Hum. Neurosci. 2014, 8, 371. [Google Scholar] [CrossRef]
  83. Feldman, A.G.; Levin, M.F.; Garofolini, A.; Piscitelli, D.; Zhang, L. Central Pattern Generator and Human Locomotion in the Context of Referent Control of Motor Actions. Clin. Neurophysiol. 2021, 132, 2870–2889. [Google Scholar] [CrossRef] [PubMed]
  84. Minassian, K.; Hofstoetter, U.S.; Dzeladini, F.; Guertin, P.A.; Ijspeert, A. The Human Central Pattern Generator for Locomotion: Does It Exist and Contribute to Walking? Neuroscientist 2017, 23, 649–663. [Google Scholar] [CrossRef]
  85. Møller, M.; Sinkjaer, T.; Duysens, J. Contributions to the Understanding of Gait Control; University of Copenhagen: Copenhagen, Denmark, 2014. [Google Scholar]
  86. Dewolf, A.H.; Ivanenko, Y.P.; Zelik, K.E.; Lacquaniti, F.; Willems, P.A. Differential Activation of Lumbar and Sacral Motor Pools during Walking at Different Speeds and Slopes. J. Neurophysiol. 2019, 122, 872–887. [Google Scholar] [CrossRef]
  87. Martino, G.; Ivanenko, Y.P.; d’Avella, A.; Serrao, M.; Ranavolo, A.; Draicchio, F.; Cappellini, G.; Casali, C.; Lacquaniti, F. Neuromuscular Adjustments of Gait Associated with Unstable Conditions. J. Neurophysiol. 2015, 114, 2867–2882. [Google Scholar] [CrossRef] [PubMed]
  88. Tam, N.; Tucker, R.; Santos-Concejero, J.; Prins, D.; Lamberts, R.P. Running Economy: Neuromuscular and Joint-Stiffness Contributions in Trained Runners. Int. J. Sports Physiol. Perform. 2019, 14, 16–22. [Google Scholar] [CrossRef]
  89. Zhang, Q.; Nassis, G.P.; Chen, S.; Shi, Y.; Li, F. Not Lower-Limb Joint Strength and Stiffness but Vertical Stiffness and Isometric Force-Time Characteristics Correlate With Running Economy in Recreational Male Runners. Front. Physiol. 2022, 13, 1321. [Google Scholar] [CrossRef]
Figure 1. Three-dimensional global map of lower limb muscle co-activation from slow walking to running. Each curve represented the average TMCfglob curves (black line) of 19 runners calculated on the whole gait cycle, from 0% to 100% (x-axis), for each speed of walking and running performed, from 0.8 to 9.3 km/h (y-axis), and with amplitudes ranging from 0% to 100% of co-activation (z-axis). The TOe (black dots) and FWHMglob (the area underlying the TMCfglob, grey and red area for walk and run velocity, respectively) for each speed as a mean between all runners are also shown on the map. TMCfglob: global time-varying multi-muscle co-activation function; TOe: Toe-off event; FWHMglob: full width at half maximum of the global co-activation.
Bioengineering 11 00288 g001
Figure 2. The average (squares) and standard deviation (black bars) of 19 runners’ (dot) global co-activation parameters ranging from slow walking (gray) to running (red) are reported: (a) average of the global co-activation level [% co-activation] (CIglob,), (b) maximum value of the global co-activation (Maxglob), (c) the full width at half maximum of global co-activation (FWHMglob), and (d) coefficient of multiple correlation within runners of global co-activation (CMC Wtglob). Triangles turned (d) represent the coefficient of multiple correlation of global co-activation between runners (CMC Btglob). ** statistical significance (p < 0.001).
Bioengineering 11 00288 g002
Figure 3. The center of activity (CoAglob) of the lower limb muscle co-activation curves from slow walking (in gray color area from 0.8 to 6.8 km/h) to running (red color area, from7.3 to 9.3 km/h)with respective velocities in the top left. Each dot in the circumference represents a single subject’s mean CoA value. In contrast, the mean value and SD of the CoA of all subjects are represented by the solid line and the width of the circular sector, respectively. * statistical significance (p < 0.05).
Bioengineering 11 00288 g003
Figure 4. Three-dimensional extensor (a) and flexor (b) maps of the lower limb muscle co-activation from slow walking to running (from 0.8 to 9.3 km/h). Each curve (black line) represents the average co-activation of extensor (TMCfext (a)) and flexor (TMCfflex (b)) muscles of 19 runners. Black dots (a,b) represent the Toe-off event, and the grey and red areas represent the full width at half maximum of extensor (a) and flexor (b) muscle co-activation for walk and run velocity, respectively.
Bioengineering 11 00288 g004
Figure 5. Three-dimensional rostro–caudal (from L3 to S2 spinal level) maps of the lower limb muscle co-activation from slow walking to running (from 0.8 to 9.3 km/h): (a) L3 co-activation (TMCfL3), (b) L4 co-activation (TMCfL4), (c) L5 co-activation (TMCfL5), (d) S1 co-activation (TMCfS1), (e) S2 co-activation (TMCfS2). Each curve represented the average TMCfL3 (a), TMCfL4 (b), TMCfL5 (c), TMCfS1 (d), and TMCfS2 (e) curves (black line) of 19 runners. The black dots represent the Toe-off event, and the grey and red areas represent the full width at half maximum of L3 (a), L4 (b), L5 (c), S1 (d), and S2 (e) co-activations for walk and run velocity respectively.
Bioengineering 11 00288 g005
Figure 6. The three-dimensional CoM maps from slow walking to running in the vertical (CoMy, (a)) and mediolateral (CoMz, (b)) directions. Each curve represented the average CoMy and CoMz (black line) curves of 19 runners, as well as the Toe−off event (black dots). The average (squares) and standard deviation (black bars) of 19 runners’ (dot) CoMy (c) and CoMz (d) displacements, ranging from slow walking (gray) to running (red). ** statistical significance (p < 0.001).
Bioengineering 11 00288 g006aBioengineering 11 00288 g006b
Figure 7. The average (squares) and standard deviation (black bars) of 19 runners’ (dot) spatiotemporal parameters: stride length (a), foot lift (b), stride frequency (c), and Toe−off event (TOe, (d)), ranging from slow walking (gray) to running (red). ** statistical significance (p < 0.001).
Bioengineering 11 00288 g007aBioengineering 11 00288 g007b
Table 1. Each dot in the table indicates muscles included in the time-varying co-activation (TMCf) function for each muscle co-activation investigated: global (all the monitored lower limb muscles), extensor (extensor muscle subgroup), flexor (flexor muscle subgroup), and rostro–caudal organization (muscles on the basis of their spinal segment of innervation, see text for further details). Smallest dots indicate a halved weight (amplitude of muscle activity multiplied by 0.5) for that specific muscle in the TMCf function.
Maps
GlobalExtensorFlexorL3L4L5S1S2
MusclesGM
RF
VL
VM
TFL
ST
BF
TA
GasM
GasL
SOL
P
GM: Gluteus medius, RF: rectus femoris, VL: vastus lateralis, VM: vastus medialis, TFL: tensor fascia latae, ST: semitendinosus, BF: biceps femoris, TA: tibialis anterior, GasM: gastrocnemius medialis, GasL: gastrocnemius lateralis, SOL: soleus, P: peroneus longus.
Table 2. Main effect and post-hoc comparisons at the transition between walking (6.8 km/h) and running (7.3 km/h), with corresponding values, for each co-activation parameters of each for each muscle co-activation studied: global (glob), extensor (ext), flexor (flex), and rostro–caudal organization (L3, L4, L5, S1, S2).
ParametersMain Effect VelocityPost-Hoc Velocity Transition
F(df)pValue at 6.8 km/h
(Mean ± Std)
Value at 7.3 km/h
(Mean ± Std)
p Value
CIglobF(1,17) = 641.04<0.0013.97 ± 0.626.05 ± 0.69<0.001
CIextF(1,17) = 388.04<0.0013.82 ± 0.836.53 ± 0.99<0.001
CIflexF(1,17) = 240.06<0.0019.03 ± 1.7210.3 ± 2.4/
CIL3F(1,17) = 137.28<0.0016.21 ± 2.068.09 ± 2.28/
CIL4F(1,17) = 409.77<0.0013.85 ± 0.715.22 ± 0.72<0.001
CIL5F(1,17) = 351.04<0.0014.22 ± 0.725.87 ± 0.78<0.001
CIS1F(1,17) = 461.13<0.0015.14 ± 0.706.88 ± 0.91<0.001
CIS2F(1,17) = 464.98<0.0015.83 ± 1.269.24 ± 1.5<0.001
MaxglobF(1,17) = 321.71<0.00111.08 ± 1.4823.30 ± 3.54<0.001
MaxextF(1,17) = 152.36<0.00112.32 ± 2.7724.42 ± 5.48<0.001
MaxflexF(1,17) = 104.01<0.00130.16 ± 8.9126.51 ± 7.28/
MaxL3F(1,17) = 76.83<0.00131.5 ± 14.2740.2 ± 14.41/
MaxL4F(1,17) = 156.75<0.00111.93 ± 3.7514.47 ± 4.13/
MaxL5F(1,17) = 93.91<0.00111.7 ± 2.3315.18 ± 3.5/
MaxS1F(1,17) = 192.85<0.00116 ± 3.0724.64 ± 4.39<0.001
MaxS2F(1,17) = 189.34<0.00118.91 ± 4.0434.19 ± 6.3<0.001
FWHMglobF(1,17) = 29.31<0.00126.62 ± 6.0818.17 ± 5.140.01
FWHMextF(1,17) = 9.31<0.00121.15 ± 6.320.07 ± 6.7/
FWHMflexF(1,17) = 11.13<0.00120.74 ± 6.6631.14 ± 8.65/
FWHML3F(1,17) = 11.37<0.00114.45 ± 3.8115.69 ± 3.39/
FWHML4F(1,17) = 20.28<0.00116.86 ± 4.5818.32 ± 4.6/
FWHML5F(1,17) = 8.22<0.00125.45 ± 729.33 ± 7.67/
FWHMS1F(1,17) = 13.48<0.00120.68 ± 6.1720.53 ± 5.81/
FWHMS2F(1,17) = 4.06<0.00120.34 ± 7.920.08 ± 5.65/
CoAglobF(1,17) = 24.96<0.00116.74 ± 5.3814.05 ± 2.12<0.01
CoAextF(1,17) = 22.95<0.0019.1 ± 4.0912.76 ± 2.88<0.001
CoAflexF(1,17) = 8.74<0.00197.18 ± 11.815.63 ± 13.91<0.001
CoAL3F(4,17) = 58.01<0.0017.31 ± 2.5813.2 ± 2.28<0.001
CoAL45.96 ± 2.9311.63 ± 2.31<0.001
CoAL55.72 ± 5.318.89 ± 3.82<0.01
CoAS130.35 ± 4.315.2 ± 2.17<0.001
CoAS228.01 ± 5.115.88 ± 2.98<0.001
CMC_Wtglob
(CMC_Btglob)
F(1,17) = 54.38<0.0010.95 ± 0.01
(0.86)
0.97 ± 0.01
(0.88)
0.02
CMC_Wtext
(CMC_Btext)
F(1,17) = 44.98<0.0010.95 ± 0.02
(0.86)
0.96 ± 0.01
(0.89)
/
CMC_Wtflex
(CMC_Btflex)
F(1,17) = 55.77<0.0010.93 ± 0.04
(0.79)
0.92 ± 0.03
(0.75)
/
CMC_WtL3
(CMC_BtL3)
F(1,17) = 24.31<0.0010.97 ± 0.02
(0.81)
0.96 ± 0.02
(0.90)
/
CMC_WtL4
(CMC_BtL4)
F(1,17) = 42.25<0.0010.96 ± 0.01
(0.87)
0.96 ± 0.01
(0.92)
/
CMC_WtL5
(CMC_Btglob)
F(1,17) = 38.82<0.0010.93 ± 0.02
(0.84)
0.92 ± 0.03
(0.83)
/
CMC_WtS1
(CMC_BtS1)
F(1,17) = 49.56<0.0010.94 ± 0.01
(0.86)
0.96 ± 0.01
(0.91)
0.04
CMC_WtS2
(CMC_BtS2)
F(1,17) = 48.76<0.0010.94 ± 0.02
(0.85)
0.95 ± 0.02
(0.89)
0.02
CoMyF(1,17) = 426.2<0.0016.60 ± 0.8310.99 ± 1.92<0.001
CoMzF(1,17) = 120.29<0.0014.57 ± 1.232.78 ± 0.88<0.001
TOeF(1,17) = 940.64<0.00162.57 ± 0.7057.91 ± 1.06<0.001
stride lengthF(1,17) = 253.03<0.001173.78 ± 7.25131 ± 9.24<0.001
stride frequencyF(1,17) = 714.22<0.0011.13 ± 0.051.31 ± 0.07<0.001
foot liftF(1,17) = 108.03<0.00116.47 ± 1.5721.63 ± 3.69<0.01
CI: synthetic co-activation index; Max: maximum value of the co-activation; FWHM: full width at half maximum of the co-activation; CoA: center of activity of the co-activation; CMC_W and CMC_B: the coefficient of multiple correlations between and within runners; CoMy and CoMz: center of mass displacement in vertical and mediolateral direction; TOe: Toe-off event.
Table 3. Main effect and post-hoc comparisons of each spinal level (from L3 to S2) at walking (6.8 km/h) and running (7.3 km/h), with corresponding values for the lower limb muscle co-activation maps.
Main Effect LevelVelocityPost-Hoc Level
F(df)p CoAL3CoAL4CoAL5CoAS1CoAS2
F(4,17) = 511.50<0.0016.8 km/hCoAL3/
CoAL4<0.01/
CoAL50.010.04/
CoAS1<0.001<0.001<0.001/
CoAS2<0.001<0.001<0.001<0.01/
7.3 km/hCoAL3/
CoAL4<0.01/
CoAL5<0.001<0.001/
CoAS1<0.01<0.001<0.001/
CoAS2<0.001<0.001<0.001<0.001/
CoA: center of activity of the co-activation.
Table 4. Statistical significance (and corresponding mean and standard deviation values) of the shape similarity between the global and the extensor co-activation map (RG-E) as well as the global and flexor (RG-F) co-activation map. Main effect and post-hoc comparisons (and corresponding mean and standard deviation values) of shape similarity between the global and rostro–caudal (from L3 to S2 spinal level: RG-L3, RG-L4, RG-L5, RG-S1, RG-S2) co-activation maps.
Shape Similarity
(Mean ± Std)
t-Test p
RG-E0.97 ± 0.02<0.001
RG-F0.70 ± 0.12
Main effect shape similarityPost-hoc shape similarity
F(df)p RG-L3RG-L4RG-L5RG-S1RG-S2
RG-L30.88 ± 0.08F(1,4) = 11.23<0.001RG-L3/
RG-L40.93 ± 0.03RG-L40.02/
RG-L50.89 ± 0.04RG-L5///
RG-S10.96 ± 0.02RG-S1<0.001/<0.01/
RG-S20.87 ± 0.06RG-S2/<0.01/<0.001/
Disclaimer/Publisher’s Note: The statements, opinions and data contained in all publications are solely those of the individual author(s) and contributor(s) and not of MDPI and/or the editor(s). MDPI and/or the editor(s) disclaim responsibility for any injury to people or property resulting from any ideas, methods, instructions or products referred to in the content.

