
A Novel Metric for Alzheimer’s Disease Detection Based on Brain Complexity Analysis via Multiscale Fuzzy Entropy
 , ,
, ,  , , and
Abstract
:
1. Introduction
2. Background
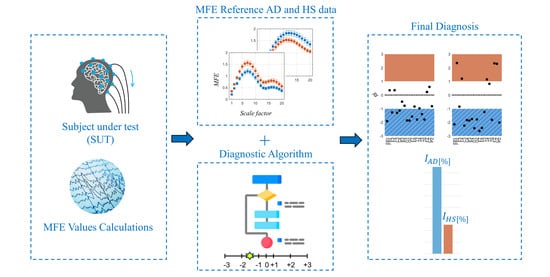
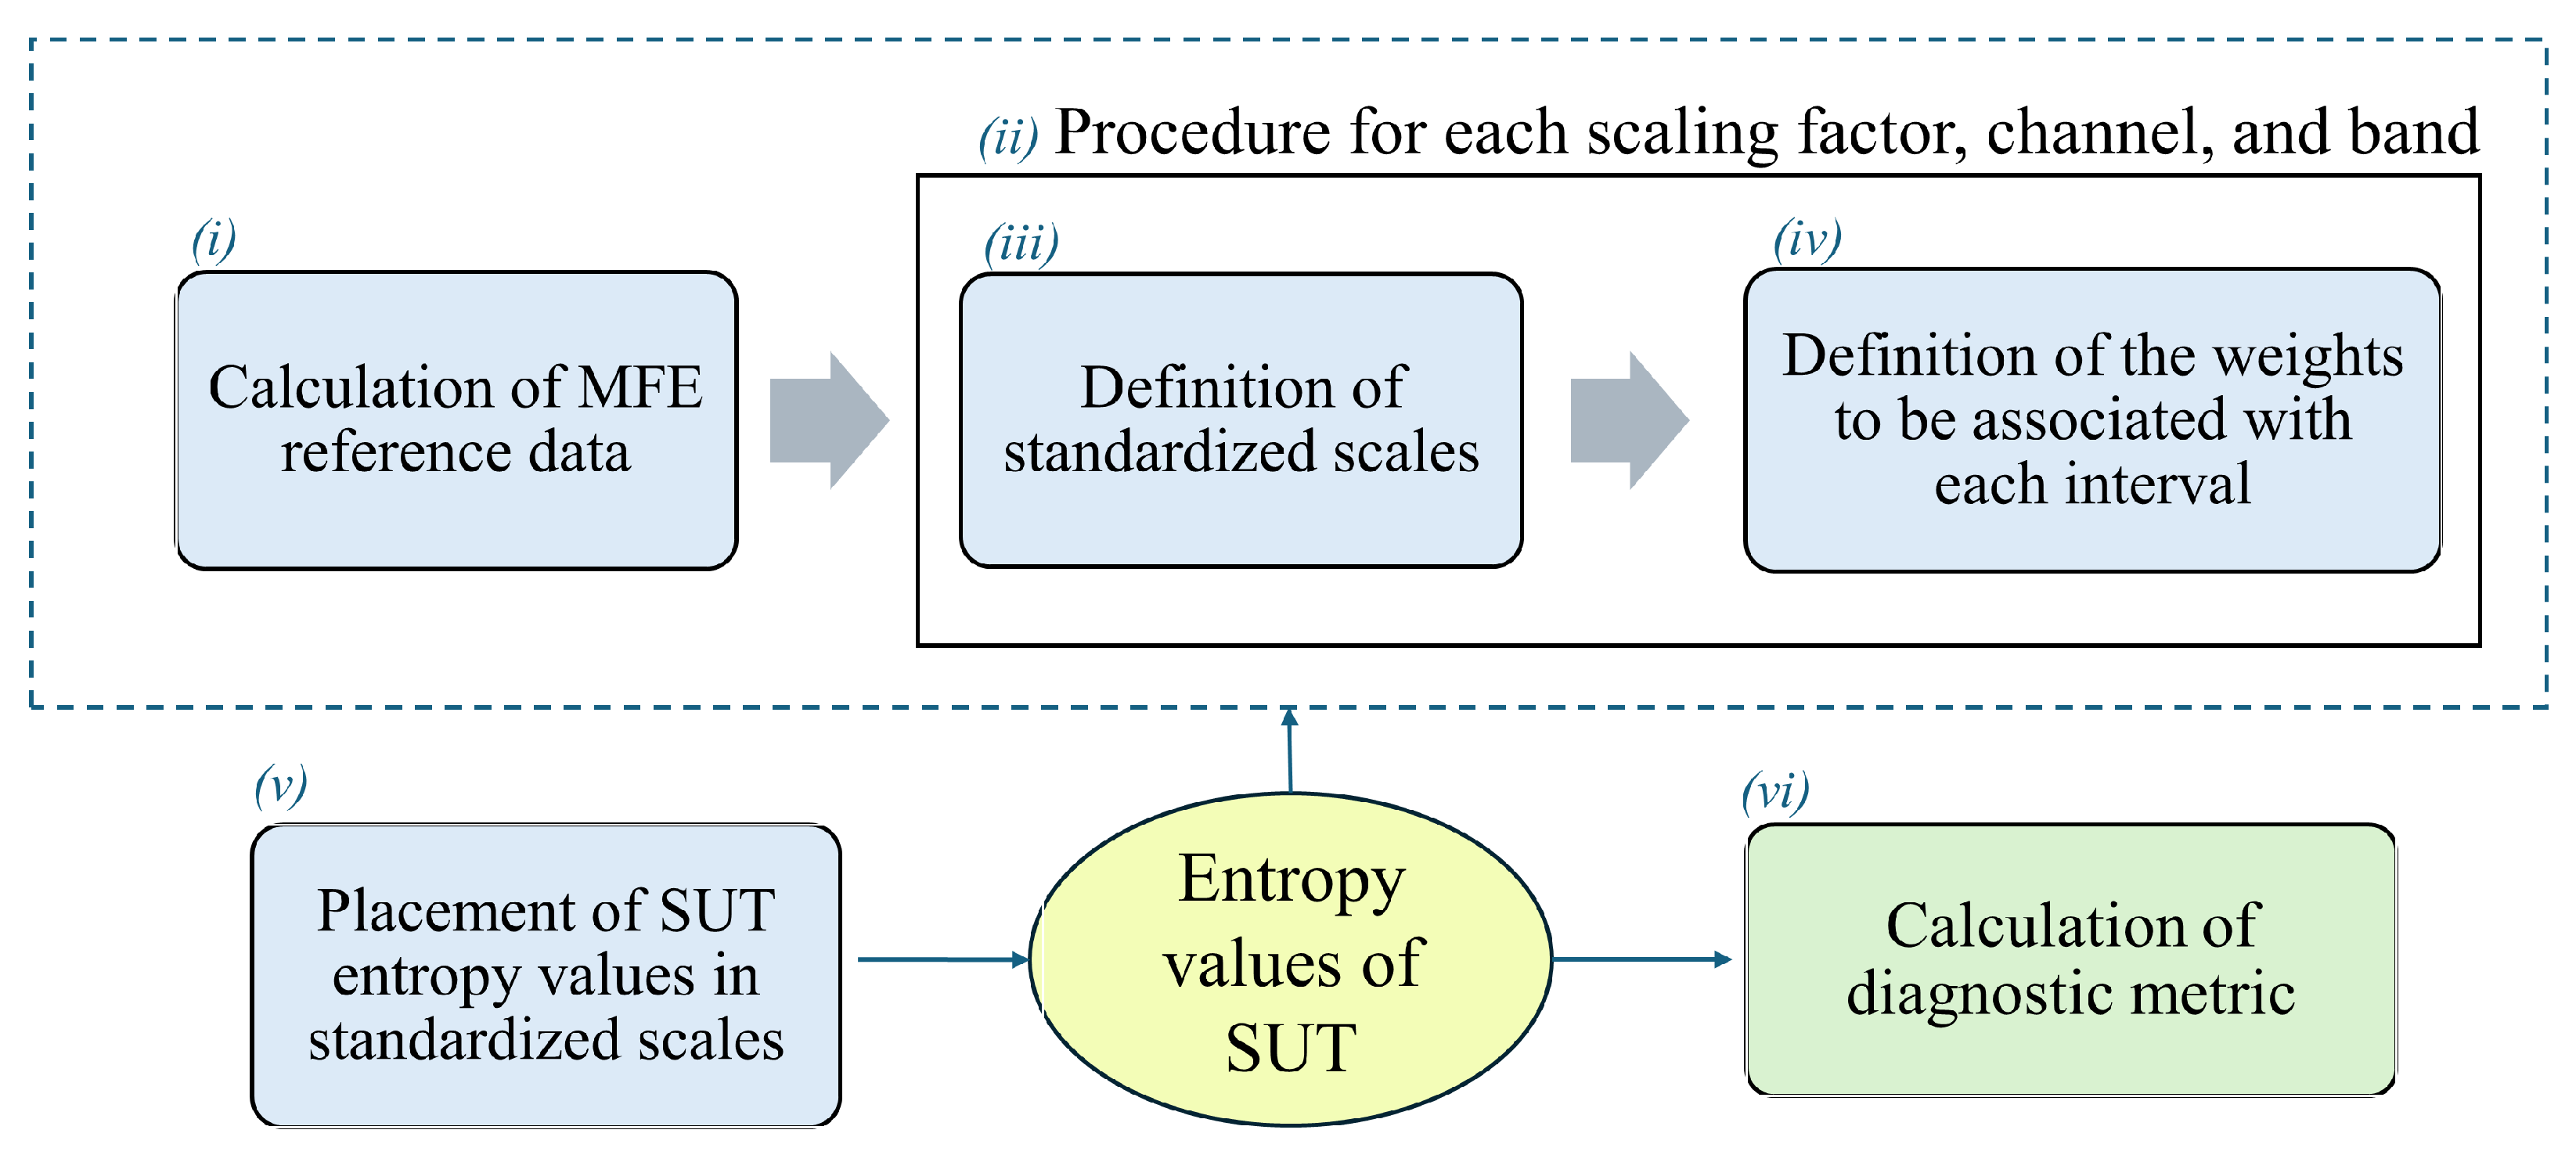
3. Proposed Method
4. Implementation
4.1. Dataset
- CAUEEG dataset: The Chung-Ang University Hospital EEG (CAUEEG) dataset [27] is a collection of EEG signals recorded from 2012 to 2020 including subjects with different AD stages and healthy controls. Each EEG trace contains annotations regarding the subject’s age, event descriptions (closed and opened eyes, visual stimulation), and the diagnosis decided by the medical personnel. The data were acquired with an EEG system at a sampling frequency of 200 Hz, following the International 10–20 system (electrode locations: Fp1, F3, C3, P3, O1, Fp2, F4, C4, P4, O2, F7, T3, T5, F8, T4, T6, FZ, CZ, and PZ) with linked earlobe referencing. For the present study, 35 HS and 35 subjects with AD were selected.
- TUH EEG dataset: The Temple University Hospital (TUH) EEG Corpus is a publicly available collection of EEG signals acquired from 2002 to 2017 [28]. Each EEG trace is accompanied by a report with the diagnosis and the medical history of the subject, including personal details (age and gender). The EEG traces of this dataset were acquired with different EEG systems at different sampling frequencies (250 Hz, 256 Hz, 400 Hz, and 512 Hz), whereas the electrode locations followed the same 19 electrodes as the CAUEEG dataset. In the context of this study, 17 EEG signals of HS subjects and 17 EEG records of AD patients were selected.
- epoching: for each subject, 15 epochs of 3-second clean EEG signals in the eyes-closed condition were selected;
- normalization: to mitigate inter-subject variation and enhance the independence of the outcomes, the normalization of EEG signals was conducted. Following [9], a channel-by-channel scaling technique was employed for each EEG signal:where i refers to channels (from 1 to 19), and are the amplitude range (from −10 to 10), and represent the median values of all maxima and minima values computed for each epoch.
- filtering: EEG data were filtered with a band-pass filter between 0.5 to 30 . Then, (0.5 to 4 ), (4 to 8 ), (8 to 13 ), and (13 to 30 ) bands were considered. A finite impulse response (FIR) filter, with an order corresponding to the number of samples in a single epoch, was employed. Consequently, the initial epoch related to the transient was excluded from each time series, resulting in a total of 14 epochs considered for each subject.
4.2. Algorithm Implementation
- The 80 EEG reference data (40 HS and 40 AD) were analyzed epoch-wise to calculate the MFE values, based on [9]. Specifically, the MFE parameters m and r were set to 2 and 0.20, respectively, and a range of scale factors from 1 to 20 was chosen. For each subject and each EEG channel, the MFE values in the specific frequency range (all, , , , and ) were obtained by averaging across the 14 epochs. Figure 3 shows an example of the MFE values depending on the scale factors of the AD subjects and those of the HS of the reference dataset for channel P4 at the different EEG bands. As expected, the MFE curves exhibit a different behavior between HS and patients with AD, according to results obtained in our previous work [9] summarized in Table 1. Based on these considerations, two ranges of reference were developed, one related to the HS state and one related to the AD state.
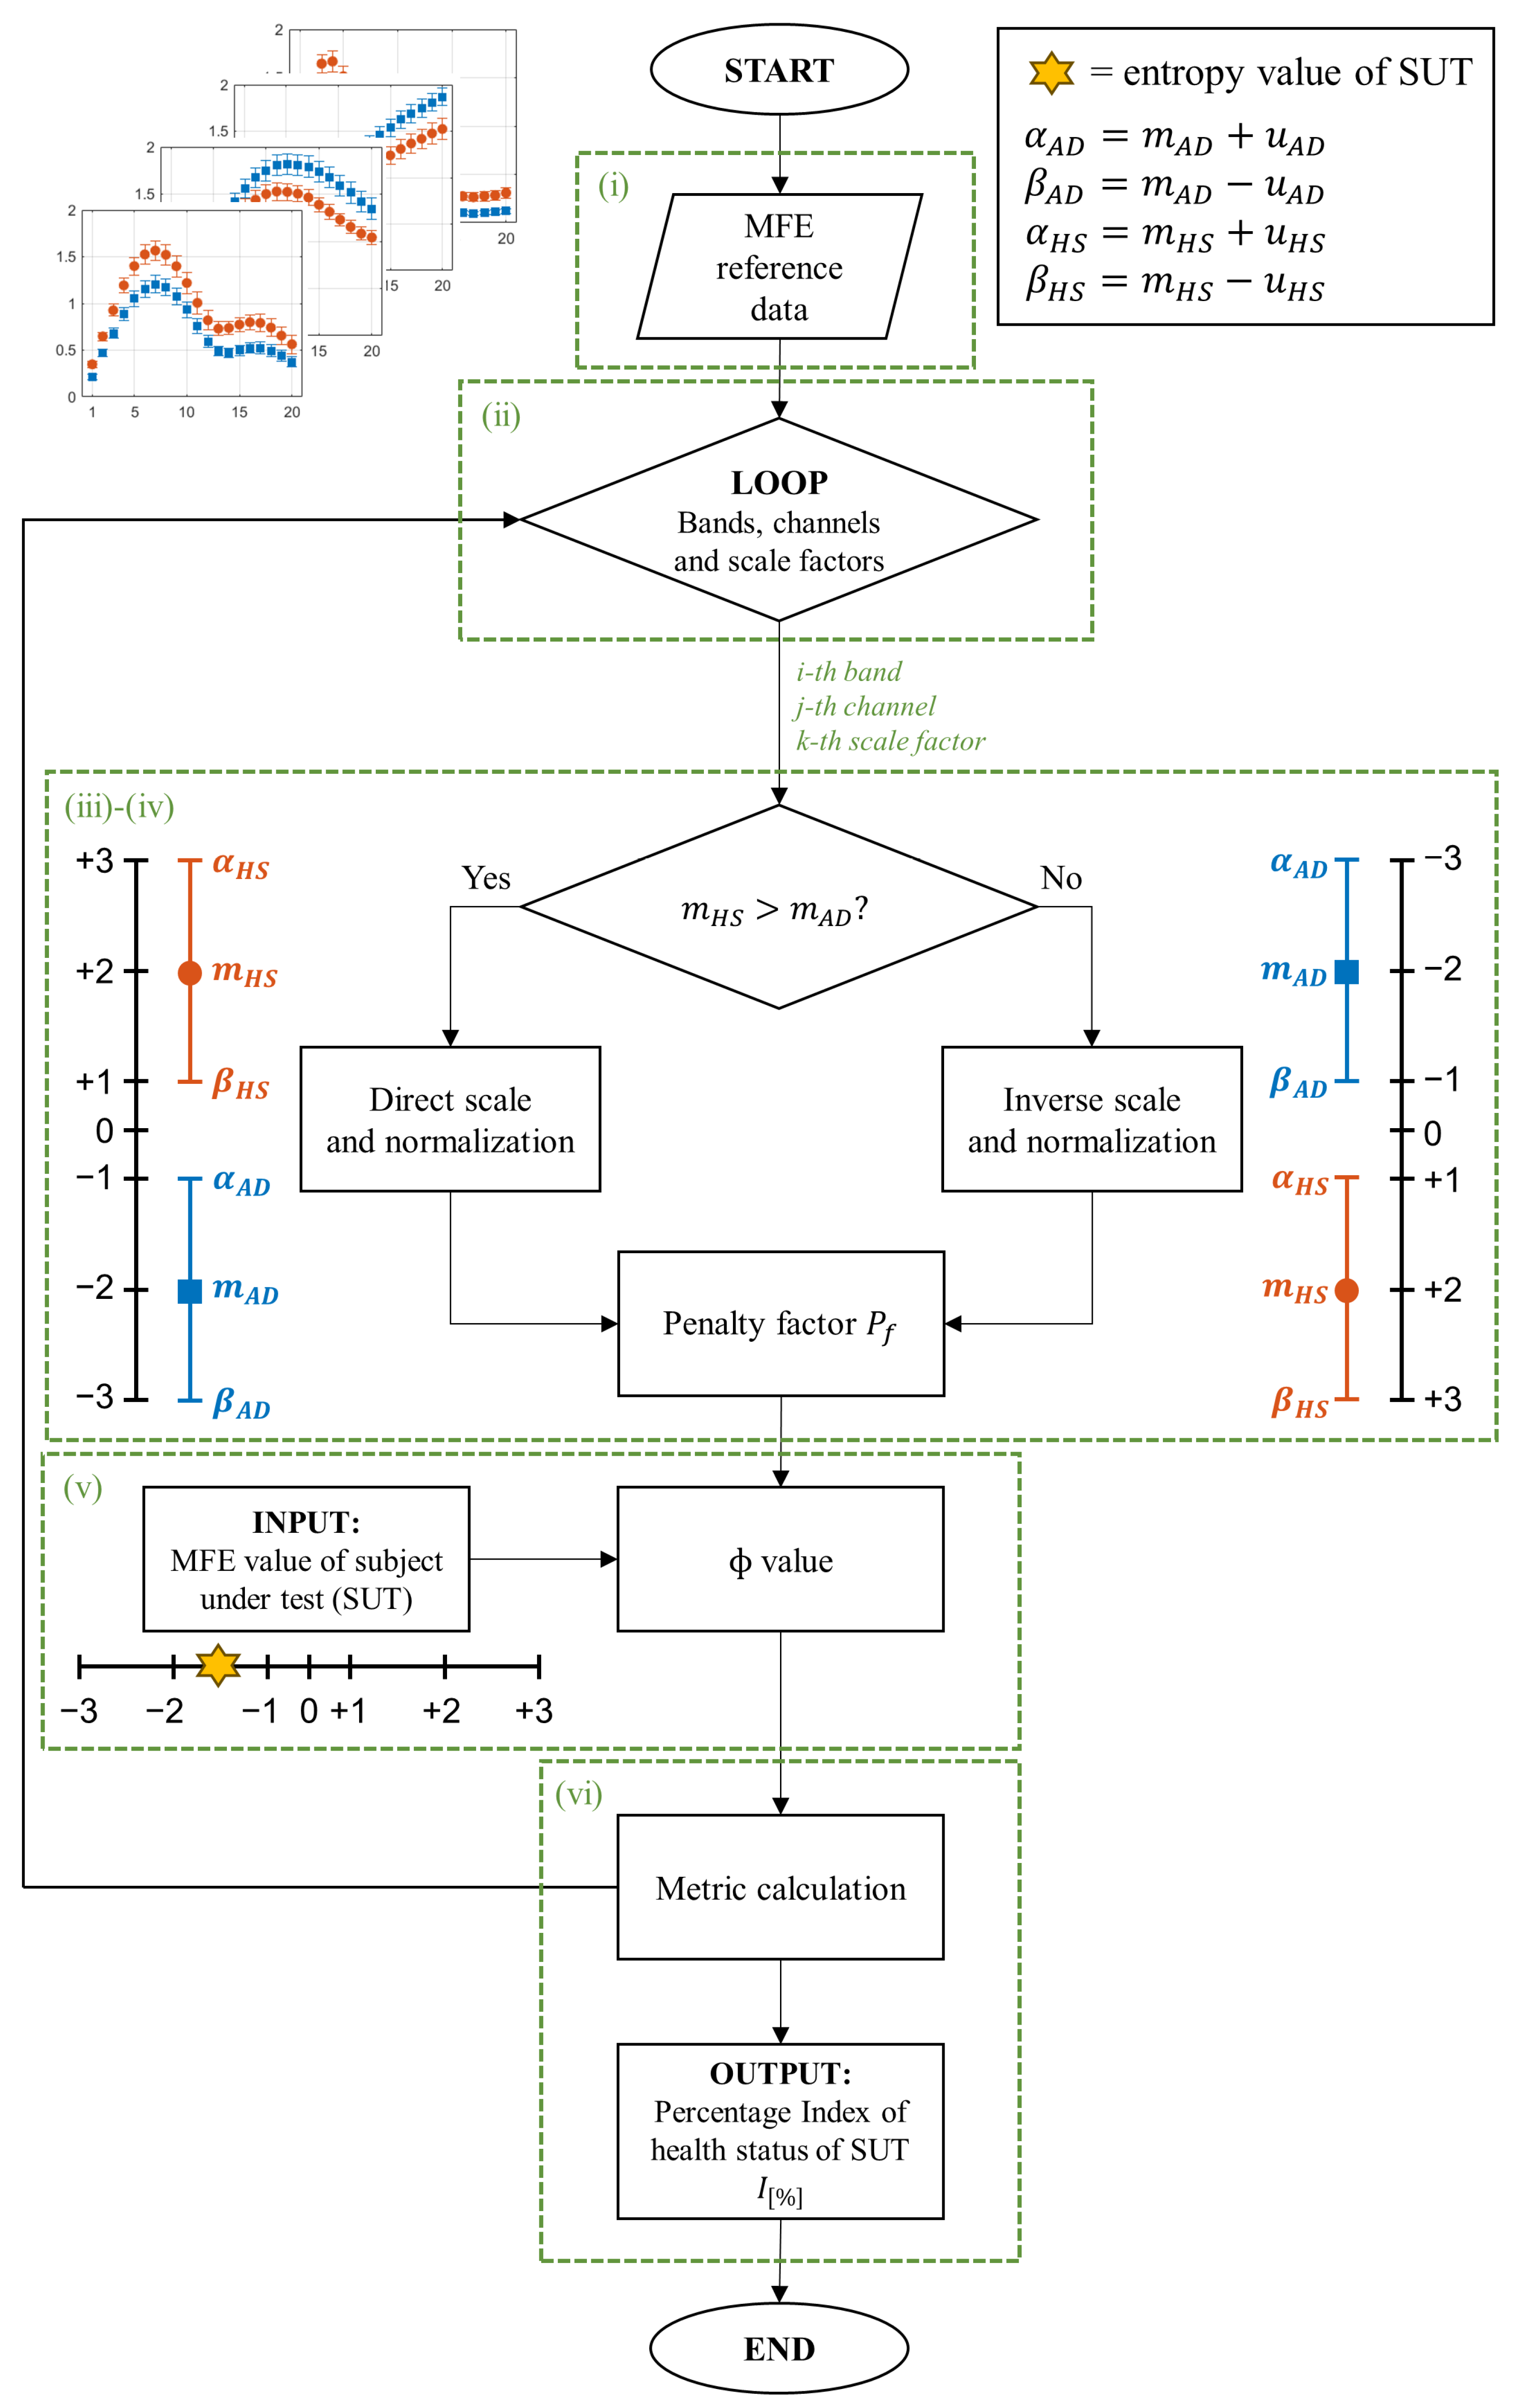
- For each band, channel, and scale factor, the reference range was established by utilizing the mean values of MFE ( and ) and the mean uncertainty ( and ), calculated as follows:where N is the number of subjects in the group, is the MFE value for the ith patient, 1.96 is the coverage factor to establish a 95% confidence interval, and s is the standard deviation of the reference data.
- A linear transformation of the original MFE data was adopted to report the MFE values on a standardized scale. In more detail, the empirical selection of the standardized scale considered the typical amplitude range for MFE values and the separability between HS and AD. As can be observed from Figure 3, the trends of MFE exhibit a maximum excursion of amplitude 2 for all the frequency bands. Consequently, it was deemed reasonable to maintain intervals of amplitude 2 in the standardized scale. A positive-value interval was assigned to depict the MFE range for healthy subjects, with +1 representing the lower bound and +3 representing the upper bound on the standardized scale. Conversely, a negative-value interval was designated for the MFE range in subjects with AD. Moreover, the intermediate zone was consistently selected with a width of 2. Hence, the extremes of the standardized intervals were chosen as follows:
- represents the HS condition (with +2 corresponding to the );
- represents the AD condition (with −2 corresponding to the );
- is the intermediate zone.
On the other hand, it is important to emphasize that the reference entropy trends in the HS and AD cases show opposite trends in some of the EEG bands, as reported in Table 1, and established in [14,29]. This phenomenon requires a distinction between the two cases, as illustrated in Figure 2, and a reorganization of the extreme values of the scale:- If , the scale range follows an ascending order, consistent with MFE values (direct scale);
- If , the inverse scale range is in descending order, in contrast with MFE values (inverse scale).
- In addition to the distinction based on mean values, it is fundamental to take into account the impact of uncertainty. More specifically, intervals characterized by smaller uncertainty are more reliable than intervals with larger uncertainty because the former means that the reference data values are more consistent. In the worst cases, an overlap between the two reference ranges HS and AD may occur. Consequently, reliability and discriminative ability in that condition decrease. These considerations suggest the introduction of a factor that penalizes more significantly the cases in which entropy intervals are poorly separated or overlap. To this end, a so-called penalty factor, , was defined according to the following equation:where u represents the mean uncertainty, indicates the area of overlap between the intervals, and is the natural logarithm. By definition, takes on values greater than or equal to 1. In an ideal scenario with zero uncertainty () and no overlap (), the logarithmic term in Equation (6) is nullified, rendering equal to 1 and having no impact on the final output. In other cases, logarithmically increases in relation to finite uncertainty () and the overlapping area ().
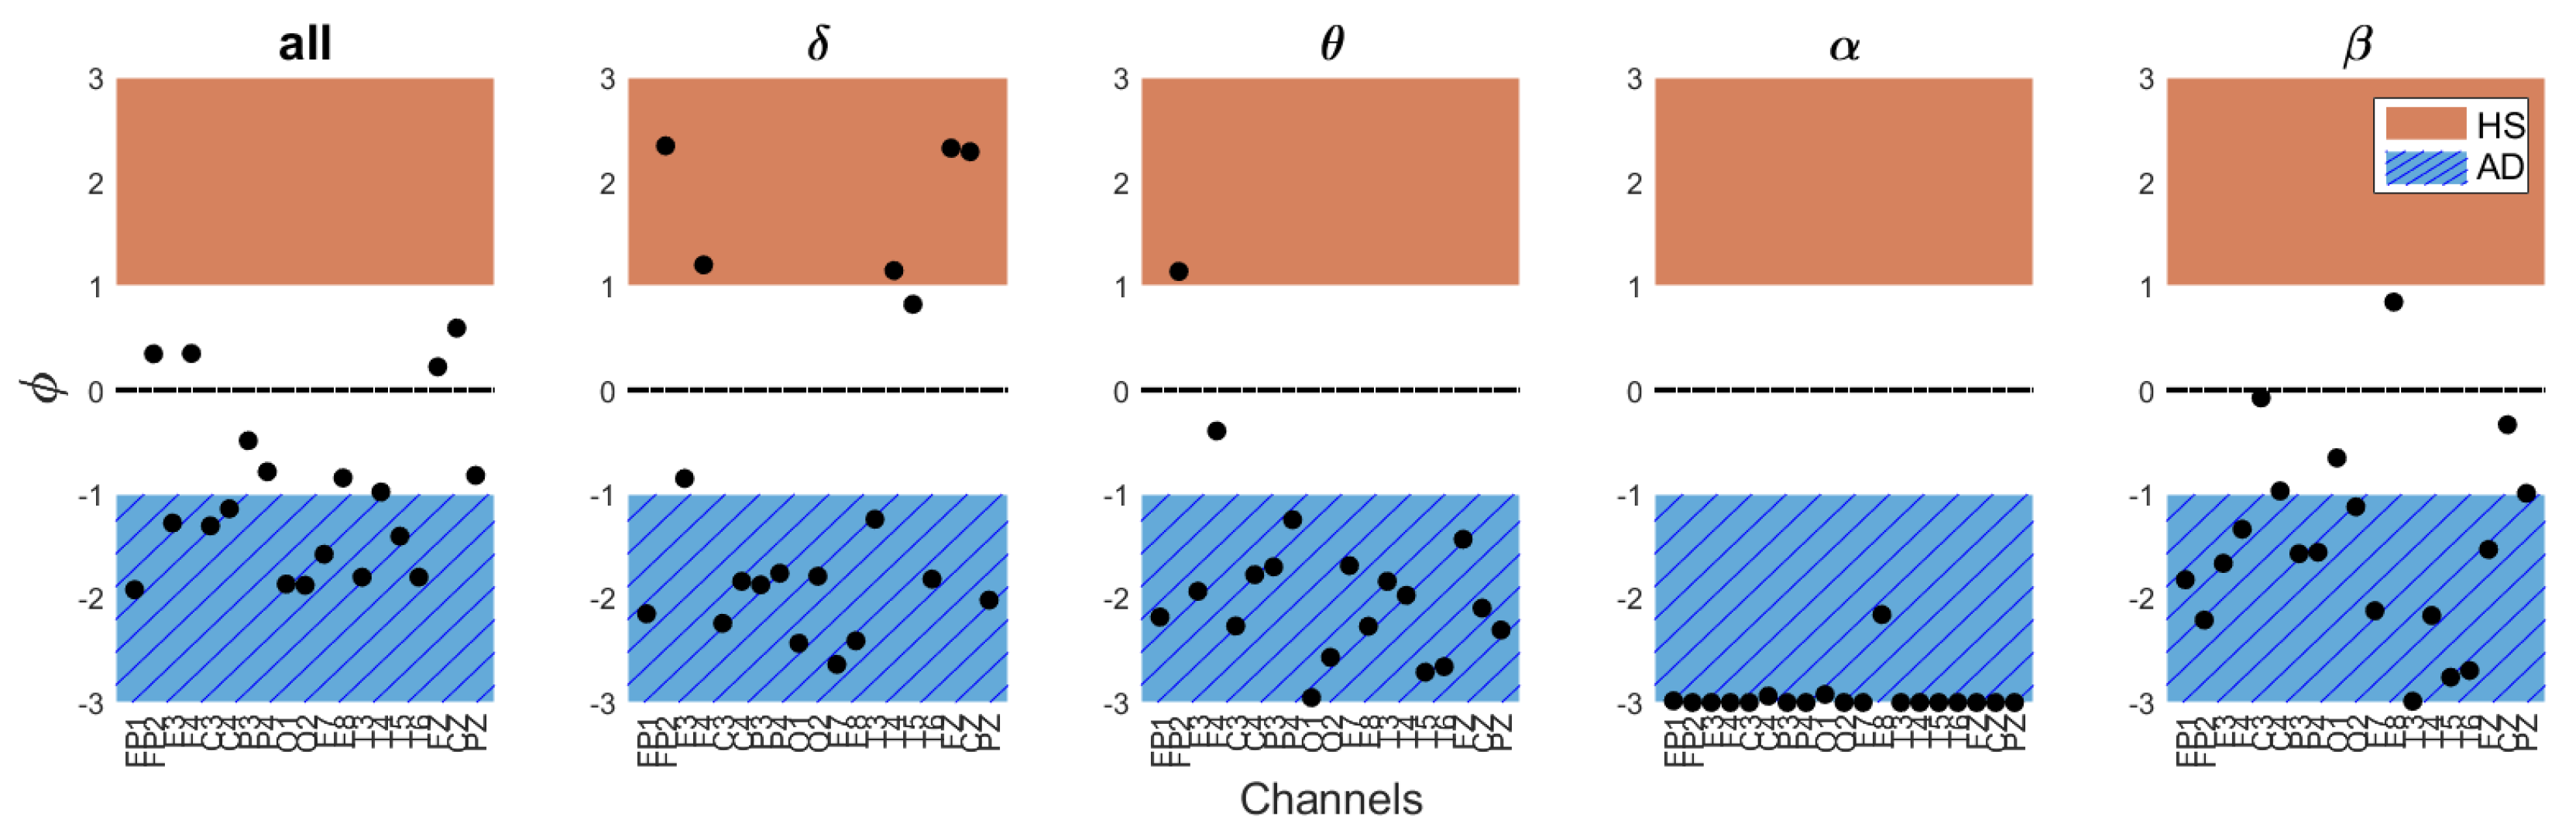
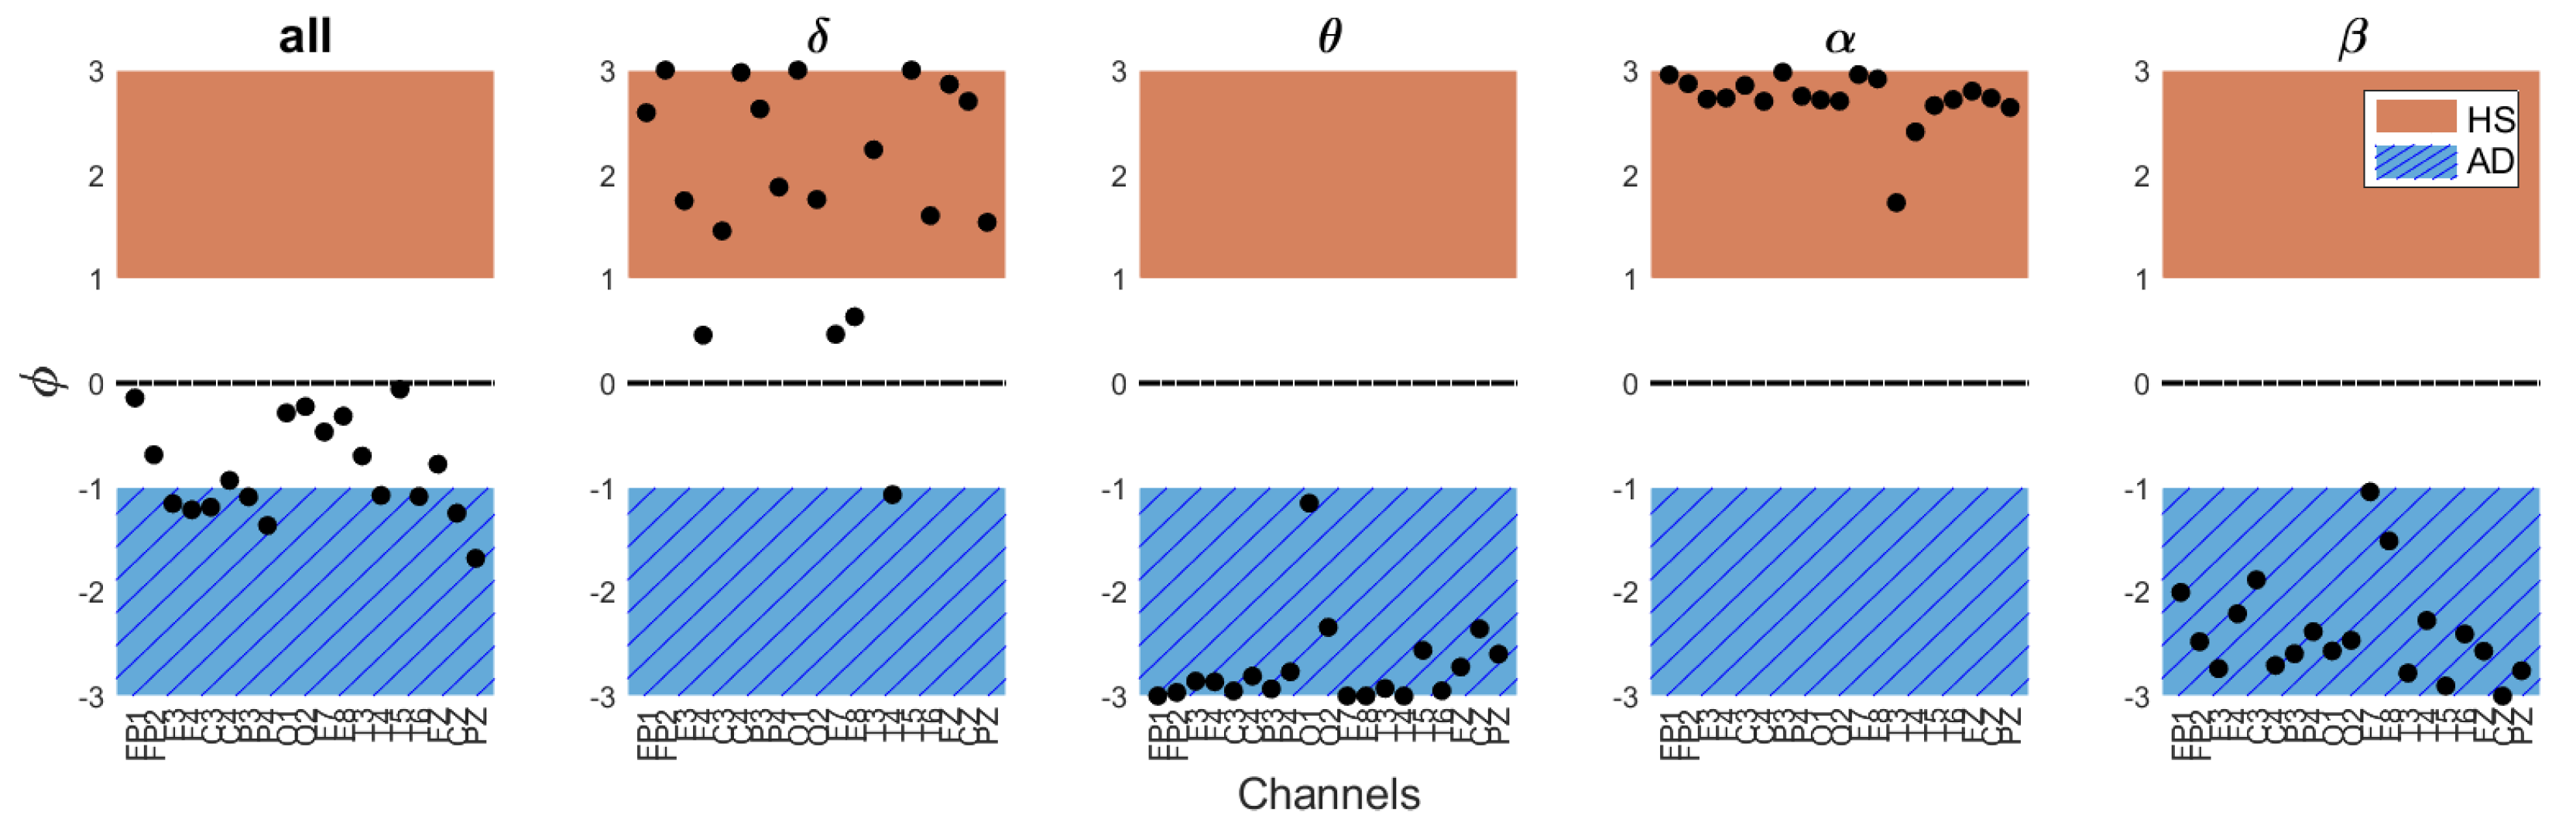
- After defining the two reference ranges for AD and HS, and the , SUTs were considered. Consequently, the MFE values for each band, channel, and scale factor were obtained and used to evaluate the status of the subjects. Then, an analysis is performed to determine the proximity of the test value to one condition over another, considering its placement within the scale.In this regard, a specific parameter, called the value, was introduced to quantify the degree of closeness to a specific condition. In more detail, it is computed for each scaling factor, channel, and band, according to the following formula:where denotes a specific MFE value of the SUT, and are the extremes of the considered interval in which the falls (i.e., ) and and represent the extreme of the corresponding direct or inverse standardized scale (ranging from −3 to +3). Therefore, scores correspond to the MFE values of the SUT translated into the standardized scale defined in phase (iii). Table 2 summarizes all the possible cases with the associated .This value has to be appropriately weighed based on the previously mentioned considerations regarding the uncertainty and overlap of the MFE reference ranges.As anticipated in phase (iv), in the ideal case where u and the values are equal to 0, the value is equal to 1, leaving the calculated value of unchanged. In the opposite case where either value is non-zero, increases logarithmically, reducing the value of the output and thus associating it with less weight in the calculation of the final metric.
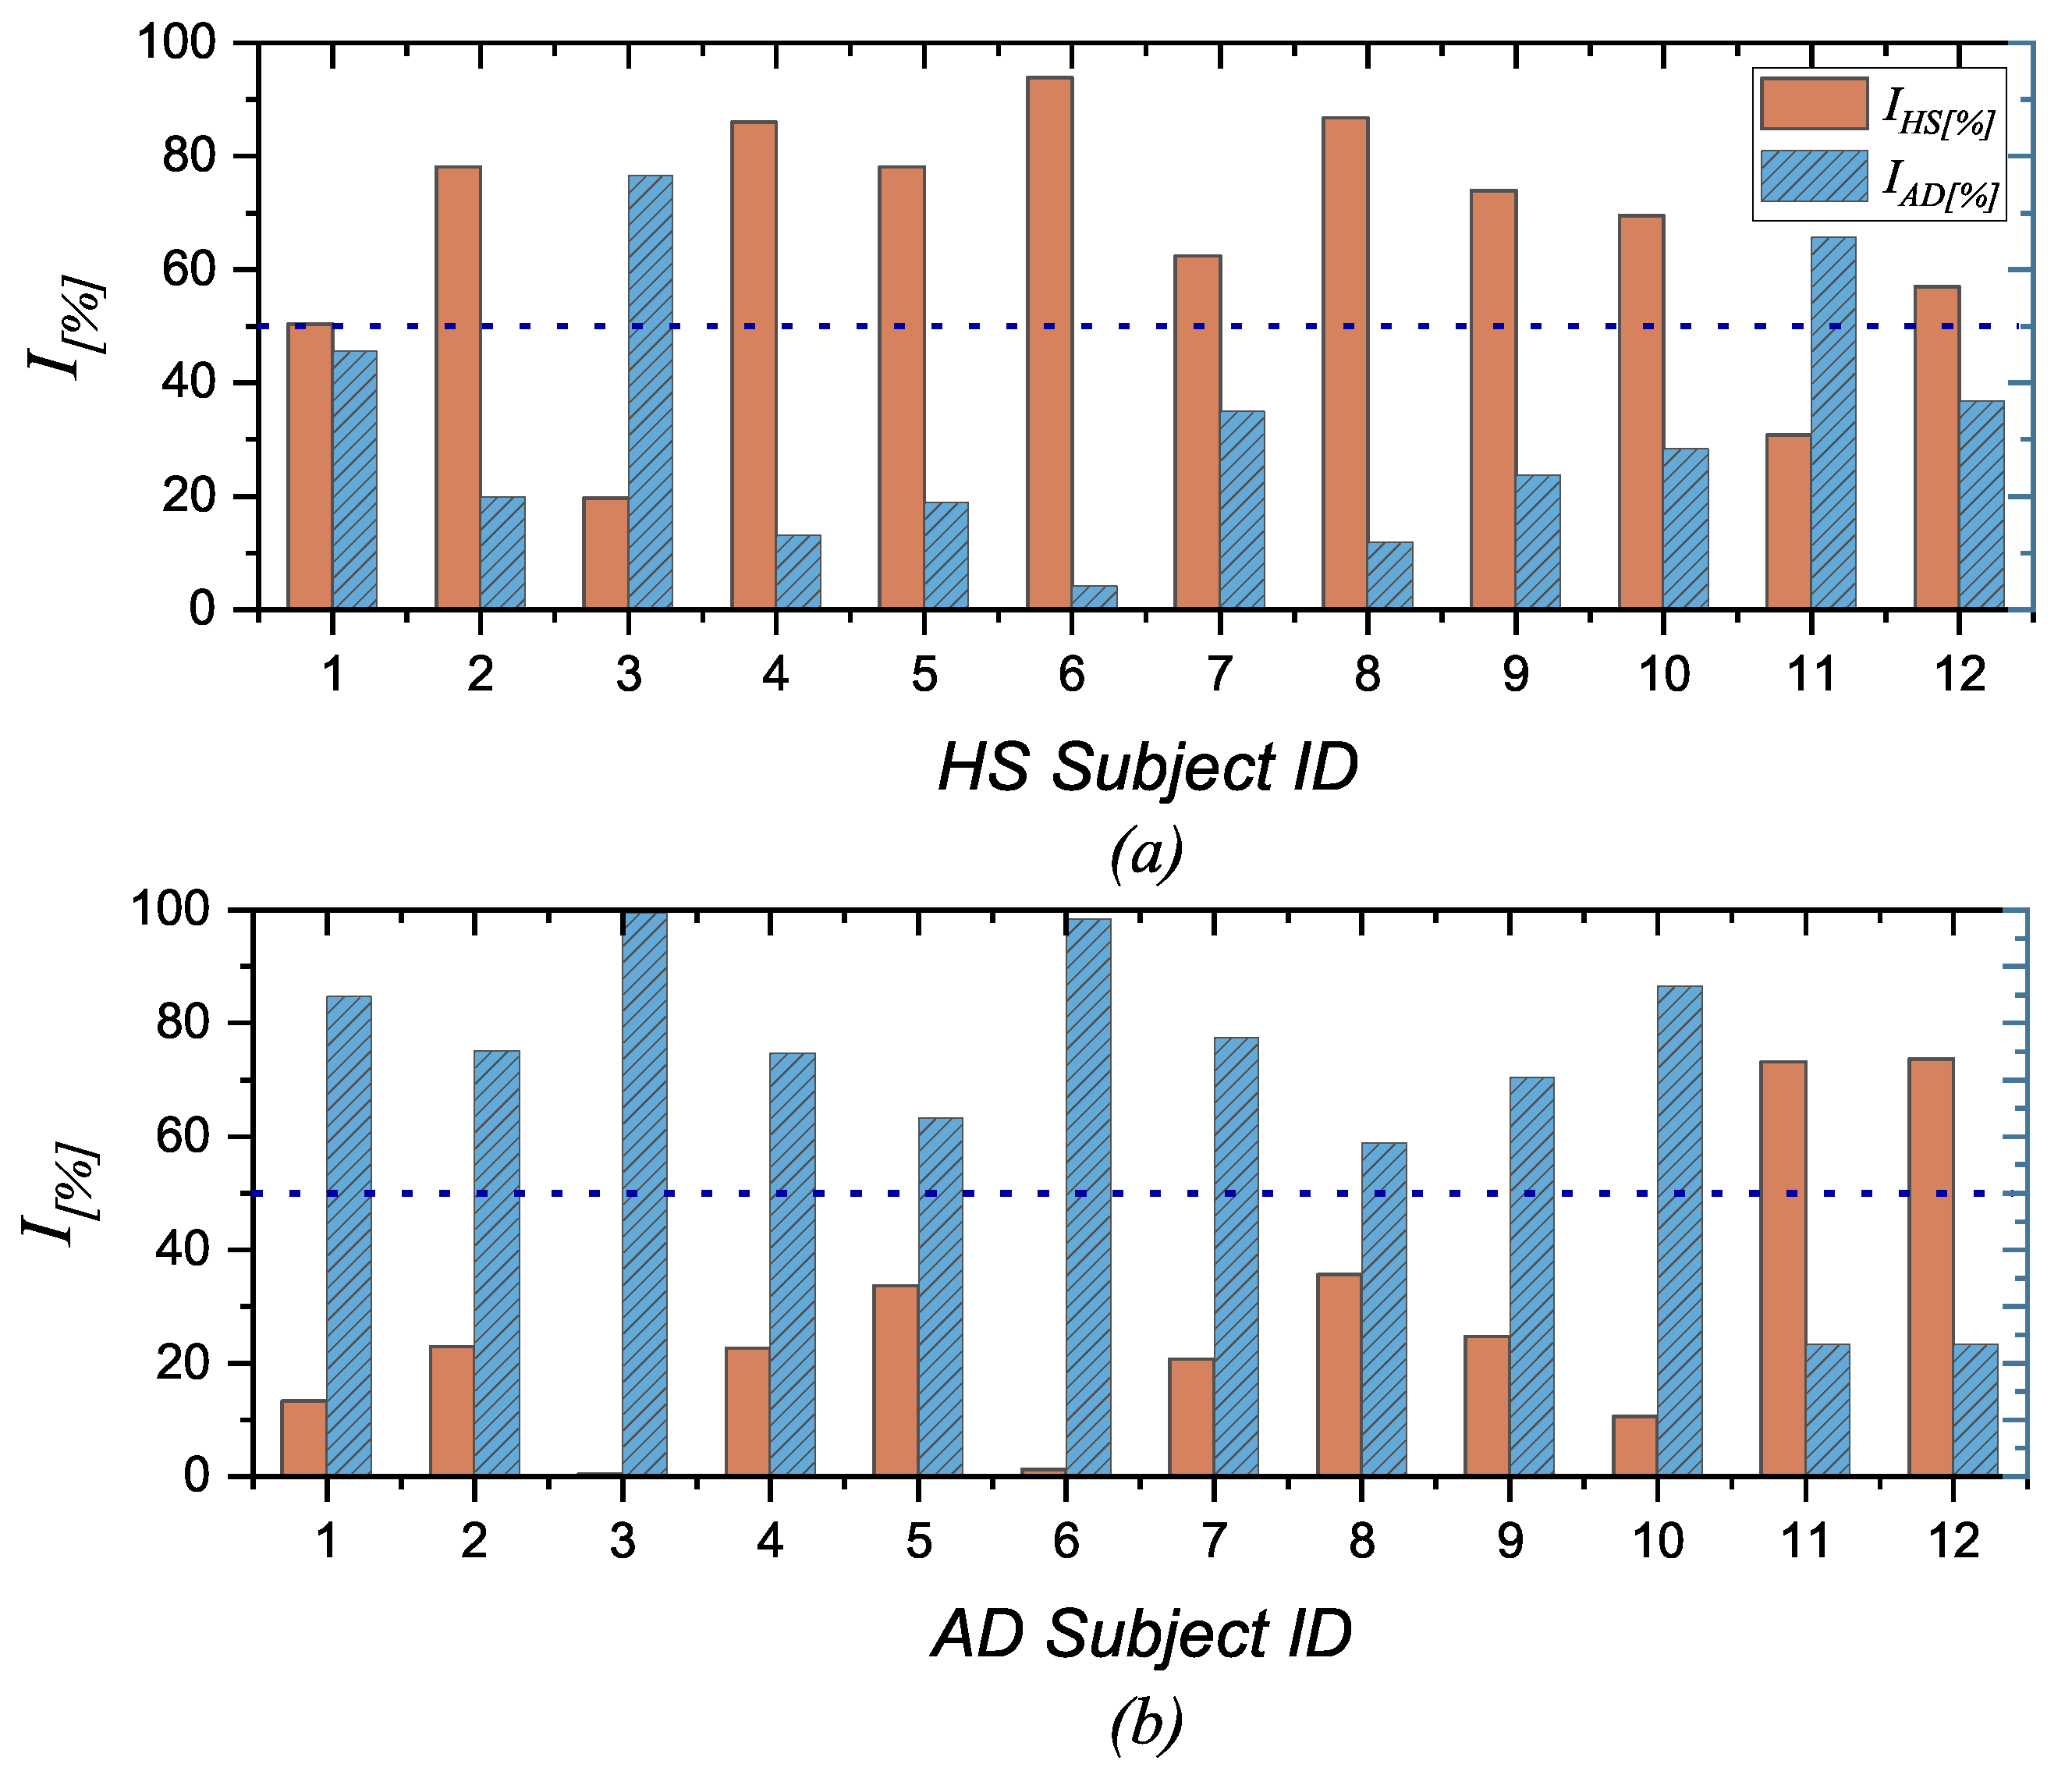
- The final output of the procedure is obtained as the sum along scale factors, channels, and bands of all these weighed entropy values, which represent a comprehensive measure of the signal complexity and so can be used to discriminate between normal and pathological EEG signals. In more detail, a specific percentage index () is calculated, which can be expressed as the probability that a subject has AD (), considering all the negative values to all entropy values, or as the probability that a subject is healthy (), considering all the positive values to all entropy values. The formulas are given below.where is the number of frequency bands (i.e., 5), is the number of channels (i.e., 19), is the number of scale factors (i.e., 20), as i, j, and k change represent all the negative values among the calculated values.as i, j, and k change represent all the positive values among the calculated values. These two indices are not complementary in the sense that their sum does not always equal 100%. This discrepancy arises because the entropy values fall within the middle range. Consequently, considering both indices may prove useful, as will be discussed in Section 5.
5. Results and Discussion
5.1. Preliminary Findings from an MCI Case Study
5.2. Discussion
6. Conclusions
Author Contributions
Funding
Institutional Review Board Statement
Informed Consent Statement
Data Availability Statement
Conflicts of Interest
References
- WHO. Dementia, World Health Organization. 2023. Available online: https://www.who.int/news-room/fact-sheets/detail/dementia (accessed on 13 February 2024).
- Blennow, K.; de Leon, M.J.; Zetterberg, H. Alzheimer’s disease. Lancet 2006, 368, 387–403. [Google Scholar] [CrossRef] [PubMed]
- Huang, L.K.; Kuan, Y.C.; Lin, H.W.; Hu, C.J. Clinical trials of new drugs for Alzheimer disease: A 2020–2023 update. J. Biomed. Sci. 2023, 30, 83. [Google Scholar] [CrossRef] [PubMed]
- Modir, A.; Shamekhi, S.; Ghaderyan, P. A systematic review and methodological analysis of EEG-based biomarkers of Alzheimer’s disease. Measurement 2023, 220, 113274. [Google Scholar] [CrossRef]
- Lois, C.; Sari, H.; Sidwell, A.B.; Price, J.C. PET and PET/MRI Methods. In Neuroimaging in Schizophrenia; Springer: Cham, Switzerland, 2020; pp. 125–143. [Google Scholar]
- Chan, J.Y.; Yau, S.T.; Kwok, T.C.; Tsoi, K.K. Diagnostic performance of digital cognitive tests for the identification of MCI and dementia: A systematic review. Ageing Res. Rev. 2021, 72, 101506. [Google Scholar] [CrossRef] [PubMed]
- Müller-Putz, G.R. Electroencephalography. Handb. Clin. Neurol. 2020, 168, 249–262. [Google Scholar]
- Cataldo, A.; Criscuolo, S.; De Benedetto, E.; Masciullo, A.; Pesola, M.; Schiavoni, R.; Invitto, S. A Method for Optimizing the Artifact Subspace Reconstruction Performance in Low-Density EEG. IEEE Sens. J. 2022, 22, 21257–21265. [Google Scholar] [CrossRef]
- Cataldo, A.; Criscuolo, S.; De Benedetto, E.; Masciullo, A.; Pesola, M.; Picone, J.; Schiavoni, R. EEG complexity-based algorithm using Multiscale Fuzzy Entropy: Towards a detection of Alzheimer’s disease. Measurement 2024, 225, 114040. [Google Scholar] [CrossRef]
- Zhang, H.; Geng, X.; Wang, Y.; Guo, Y.; Gao, Y.; Zhang, S.; Du, W.; Liu, L.; Sun, M.; Jiao, F.; et al. The significance of EEG alpha oscillation spectral power and beta Oscillation phase synchronization for diagnosing probable Alzheimer disease. Front. Aging Neurosci. 2021, 13, 631587. [Google Scholar] [CrossRef] [PubMed]
- Cataldo, A.; Criscuolo, S.; De Benedetto, E.; Masciullo, A.; Pesola, M.; Schiavoni, R. Entropy-Based EEG Measures for Revealing Altered Neural Dynamics in Alzheimer’s Disease: A Preliminary Study. In Proceedings of the 2023 IEEE International Conference on Metrology for eXtended Reality, Artificial Intelligence and Neural Engineering (MetroXRAINE), Milan, Italy, 25–27 October 2023; pp. 682–687. [Google Scholar]
- Cataldo, A.; Criscuolo, S.; De Benedetto, E.; Masciullo, A.; Pesola, M.; Schiavoni, R. Uncovering the Correlation between COVID-19 and Neurodegenerative Processes: Toward a New Approach Based on EEG Entropic Analysis. Bioengineering 2023, 10, 435. [Google Scholar] [CrossRef]
- Tononi, G.; Edelman, G.M.; Sporns, O. Complexity and coherency: Integrating information in the brain. Trends Cogn. Sci. 1998, 2, 474–484. [Google Scholar] [CrossRef]
- Sun, J.; Wang, B.; Niu, Y.; Tan, Y.; Fan, C.; Zhang, N.; Xue, J.; Wei, J.; Xiang, J. Complexity analysis of EEG, MEG, and fMRI in mild cognitive impairment and Alzheimer’s disease: A review. Entropy 2020, 22, 239. [Google Scholar] [CrossRef] [PubMed]
- Humeau-Heurtier, A. Multiscale entropy approaches and their applications. Entropy 2020, 22, 644. [Google Scholar] [CrossRef] [PubMed]
- Gauthier, S.; Reisberg, B.; Zaudig, M.; Petersen, R.C.; Ritchie, K.; Broich, K.; Belleville, S.; Brodaty, H.; Bennett, D.; Chertkow, H.; et al. Mild cognitive impairment. Lancet 2006, 367, 1262–1270. [Google Scholar] [CrossRef] [PubMed]
- Tait, L.; Tamagnini, F.; Stothart, G.; Barvas, E.; Monaldini, C.; Frusciante, R.; Volpini, M.; Guttmann, S.; Coulthard, E.; Brown, J.T.; et al. EEG microstate complexity for aiding early diagnosis of Alzheimer’s disease. Sci. Rep. 2020, 10, 17627. [Google Scholar] [CrossRef] [PubMed]
- Ando, M.; Nobukawa, S.; Kikuchi, M.; Takahashi, T. Identification of electroencephalogram signals in Alzheimer’s disease by multifractal and multiscale entropy analysis. Front. Neurosci. 2021, 15, 667614. [Google Scholar] [CrossRef] [PubMed]
- Lau, Z.J.; Pham, T.; Chen, S.A.; Makowski, D. Brain entropy, fractal dimensions and predictability: A review of complexity measures for EEG in healthy and neuropsychiatric populations. Eur. J. Neurosci. 2022, 56, 5047–5069. [Google Scholar] [CrossRef] [PubMed]
- Nobukawa, S.; Yamanishi, T.; Nishimura, H.; Wada, Y.; Kikuchi, M.; Takahashi, T. Atypical temporal-scale-specific fractal changes in Alzheimer’s disease EEG and their relevance to cognitive decline. Cogn. Neurodyn. 2019, 13, 1–11. [Google Scholar] [CrossRef] [PubMed]
- Liu, J.; Lu, H.; Zhang, X.; Li, X.; Wang, L.; Yin, S.; Cui, D. Which Multivariate Multi-Scale Entropy Algorithm Is More Suitable for Analyzing the EEG Characteristics of Mild Cognitive Impairment? Entropy 2023, 25, 396. [Google Scholar] [CrossRef] [PubMed]
- Su, R.; Li, X.; Li, Z.; Han, Y.; Cui, W.; Xie, P.; Liu, Y. Constructing biomarker for early diagnosis of aMCI based on combination of multiscale fuzzy entropy and functional brain connectivity. Biomed. Signal Process. Control 2021, 70, 103000. [Google Scholar] [CrossRef]
- Niu, Y.; Wang, B.; Zhou, M.; Xue, J.; Shapour, H.; Cao, R.; Cui, X.; Wu, J.; Xiang, J. Dynamic complexity of spontaneous bold activity in Alzheimer’s disease and mild cognitive impairment using multiscale entropy analysis. Front. Neurosci. 2018, 12, 677. [Google Scholar] [CrossRef]
- Mizuno, T.; Takahashi, T.; Cho, R.Y.; Kikuchi, M.; Murata, T.; Takahashi, K.; Wada, Y. Assessment of EEG dynamical complexity in Alzheimer’s disease using multiscale entropy. Clin. Neurophysiol. 2010, 121, 1438–1446. [Google Scholar] [CrossRef] [PubMed]
- Chen, W.; Zhuang, J.; Yu, W.; Wang, Z. Measuring complexity using fuzzyen, apen, and sampen. Med. Eng. Phys. 2009, 31, 61–68. [Google Scholar] [CrossRef] [PubMed]
- Simons, S.; Espino, P.; Abásolo, D. Fuzzy entropy analysis of the electroencephalogram in patients with Alzheimer’s disease: Is the method superior to sample entropy? Entropy 2018, 20, 21. [Google Scholar] [CrossRef] [PubMed]
- Kim, M.J.; Lee, S.H. Chung-Ang University Hospital EEG (CAUEEG) Dataset. 2020. Available online: https://github.com/ipis-mjkim/caueeg-dataset (accessed on 5 February 2024).
- Obeid, I.; Picone, J. The Temple University Hospital EEG Data Corpus. Front. Neurosci. 2016, 10, 195498. [Google Scholar] [CrossRef] [PubMed]
- Yang, A.C.; Wang, S.J.; Lai, K.L.; Tsai, C.F.; Yang, C.H.; Hwang, J.P.; Lo, M.T.; Huang, N.E.; Peng, C.K.; Fuh, J.L. Cognitive and neuropsychiatric correlates of EEG dynamic complexity in patients with Alzheimer’s disease. Prog. Neuro-Psychopharmacol. Biol. Psychiatry 2013, 47, 52–61. [Google Scholar] [CrossRef] [PubMed]
- Šimundić, A.M. Measures of diagnostic accuracy: Basic definitions. eJIFCC 2009, 19, 203. [Google Scholar] [PubMed]
- Chicco, D.; Starovoitov, V.; Jurman, G. The benefits of the Matthews correlation coefficient (MCC) over the diagnostic odds ratio (DOR) in binary classification assessment. IEEE Access 2021, 9, 47112–47124. [Google Scholar] [CrossRef]
- Glas, A.S.; Lijmer, J.G.; Prins, M.H.; Bonsel, G.J.; Bossuyt, P.M. The diagnostic odds ratio: A single indicator of test performance. J. Clin. Epidemiol. 2003, 56, 1129–1135. [Google Scholar] [CrossRef]
- Ospina-Romero, M.; Glymour, M.M.; Hayes-Larson, E.; Mayeda, E.R.; Graff, R.E.; Brenowitz, W.D.; Ackley, S.F.; Witte, J.S.; Kobayashi, L.C. Association between Alzheimer disease and cancer with evaluation of study biases: A systematic review and meta-analysis. JAMA Netw. Open 2020, 3, e2025515. [Google Scholar] [CrossRef]
- Therriault, J.; Pascoal, T.A.; Benedet, A.L.; Tissot, C.; Savard, M.; Chamoun, M.; Lussier, F.; Kang, M.S.; Berzgin, G.; Wang, T.; et al. Frequency of biologically defined Alzheimer disease in relation to age, sex, APOE ε4, and cognitive impairment. Neurology 2021, 96, e975–e985. [Google Scholar] [CrossRef]
- Gutiérrez-de Pablo, V.; Gómez, C.; Poza, J.; Maturana-Candelas, A.; Martins, S.; Gomes, I.; Lopes, A.M.; Pinto, N.; Hornero, R. Relationship between the Presence of the ApoE ε 4 Allele and EEG Complexity along the Alzheimer’s Disease Continuum. Sensors 2020, 20, 3849. [Google Scholar] [CrossRef] [PubMed]
- Arpaia, P.; Cataldo, A.; Criscuolo, S.; De Benedetto, E.; Masciullo, A.; Schiavoni, R. Assessment and Scientific Progresses in the Analysis of Olfactory Evoked Potentials. Bioengineering 2022, 9, 252. [Google Scholar] [CrossRef] [PubMed]


| Band | MFE | Notes |
|---|---|---|
| All | on the short time scales on the long time scales | At short time scales, AD brain activity shifts toward regularity losing physiologic complexity, while it exhibits a more chaotic and nonfunctional behavior at long time scales. |
| Cognitive decline is represented by a shift of brain activities to lower frequencies, implying higher complexity for AD subjects. | ||
| In this case, the shift in AD brain activity from higher to lower frequencies implies a loss of complexity compared to the HS group. |
| HS Interval | Intermediate | AD interval | |
|---|---|---|---|
| Class. Accuracy | DOR | MCC |
|---|---|---|
| 25 |
Disclaimer/Publisher’s Note: The statements, opinions and data contained in all publications are solely those of the individual author(s) and contributor(s) and not of MDPI and/or the editor(s). MDPI and/or the editor(s) disclaim responsibility for any injury to people or property resulting from any ideas, methods, instructions or products referred to in the content. |
© 2024 by the authors. Licensee MDPI, Basel, Switzerland. This article is an open access article distributed under the terms and conditions of the Creative Commons Attribution (CC BY) license (https://creativecommons.org/licenses/by/4.0/).
Share and Cite
Cataldo, A.; Criscuolo, S.; De Benedetto, E.; Masciullo, A.; Pesola, M.; Schiavoni, R. A Novel Metric for Alzheimer’s Disease Detection Based on Brain Complexity Analysis via Multiscale Fuzzy Entropy. Bioengineering 2024, 11, 324. https://doi.org/10.3390/bioengineering11040324
Cataldo A, Criscuolo S, De Benedetto E, Masciullo A, Pesola M, Schiavoni R. A Novel Metric for Alzheimer’s Disease Detection Based on Brain Complexity Analysis via Multiscale Fuzzy Entropy. Bioengineering. 2024; 11(4):324. https://doi.org/10.3390/bioengineering11040324
Chicago/Turabian StyleCataldo, Andrea, Sabatina Criscuolo, Egidio De Benedetto, Antonio Masciullo, Marisa Pesola, and Raissa Schiavoni. 2024. "A Novel Metric for Alzheimer’s Disease Detection Based on Brain Complexity Analysis via Multiscale Fuzzy Entropy" Bioengineering 11, no. 4: 324. https://doi.org/10.3390/bioengineering11040324