


A Novel Bio-Purification Process Employing an Engineered E. coli Strain for Downstream Processing of Lactic Acid Solutions from the Fermentation of Agro-Industrial by-Products

 ,
,  ,
,  , and
, and
Abstract
:
1. Introduction
2. Materials and Methods
2.1. Strain and Media
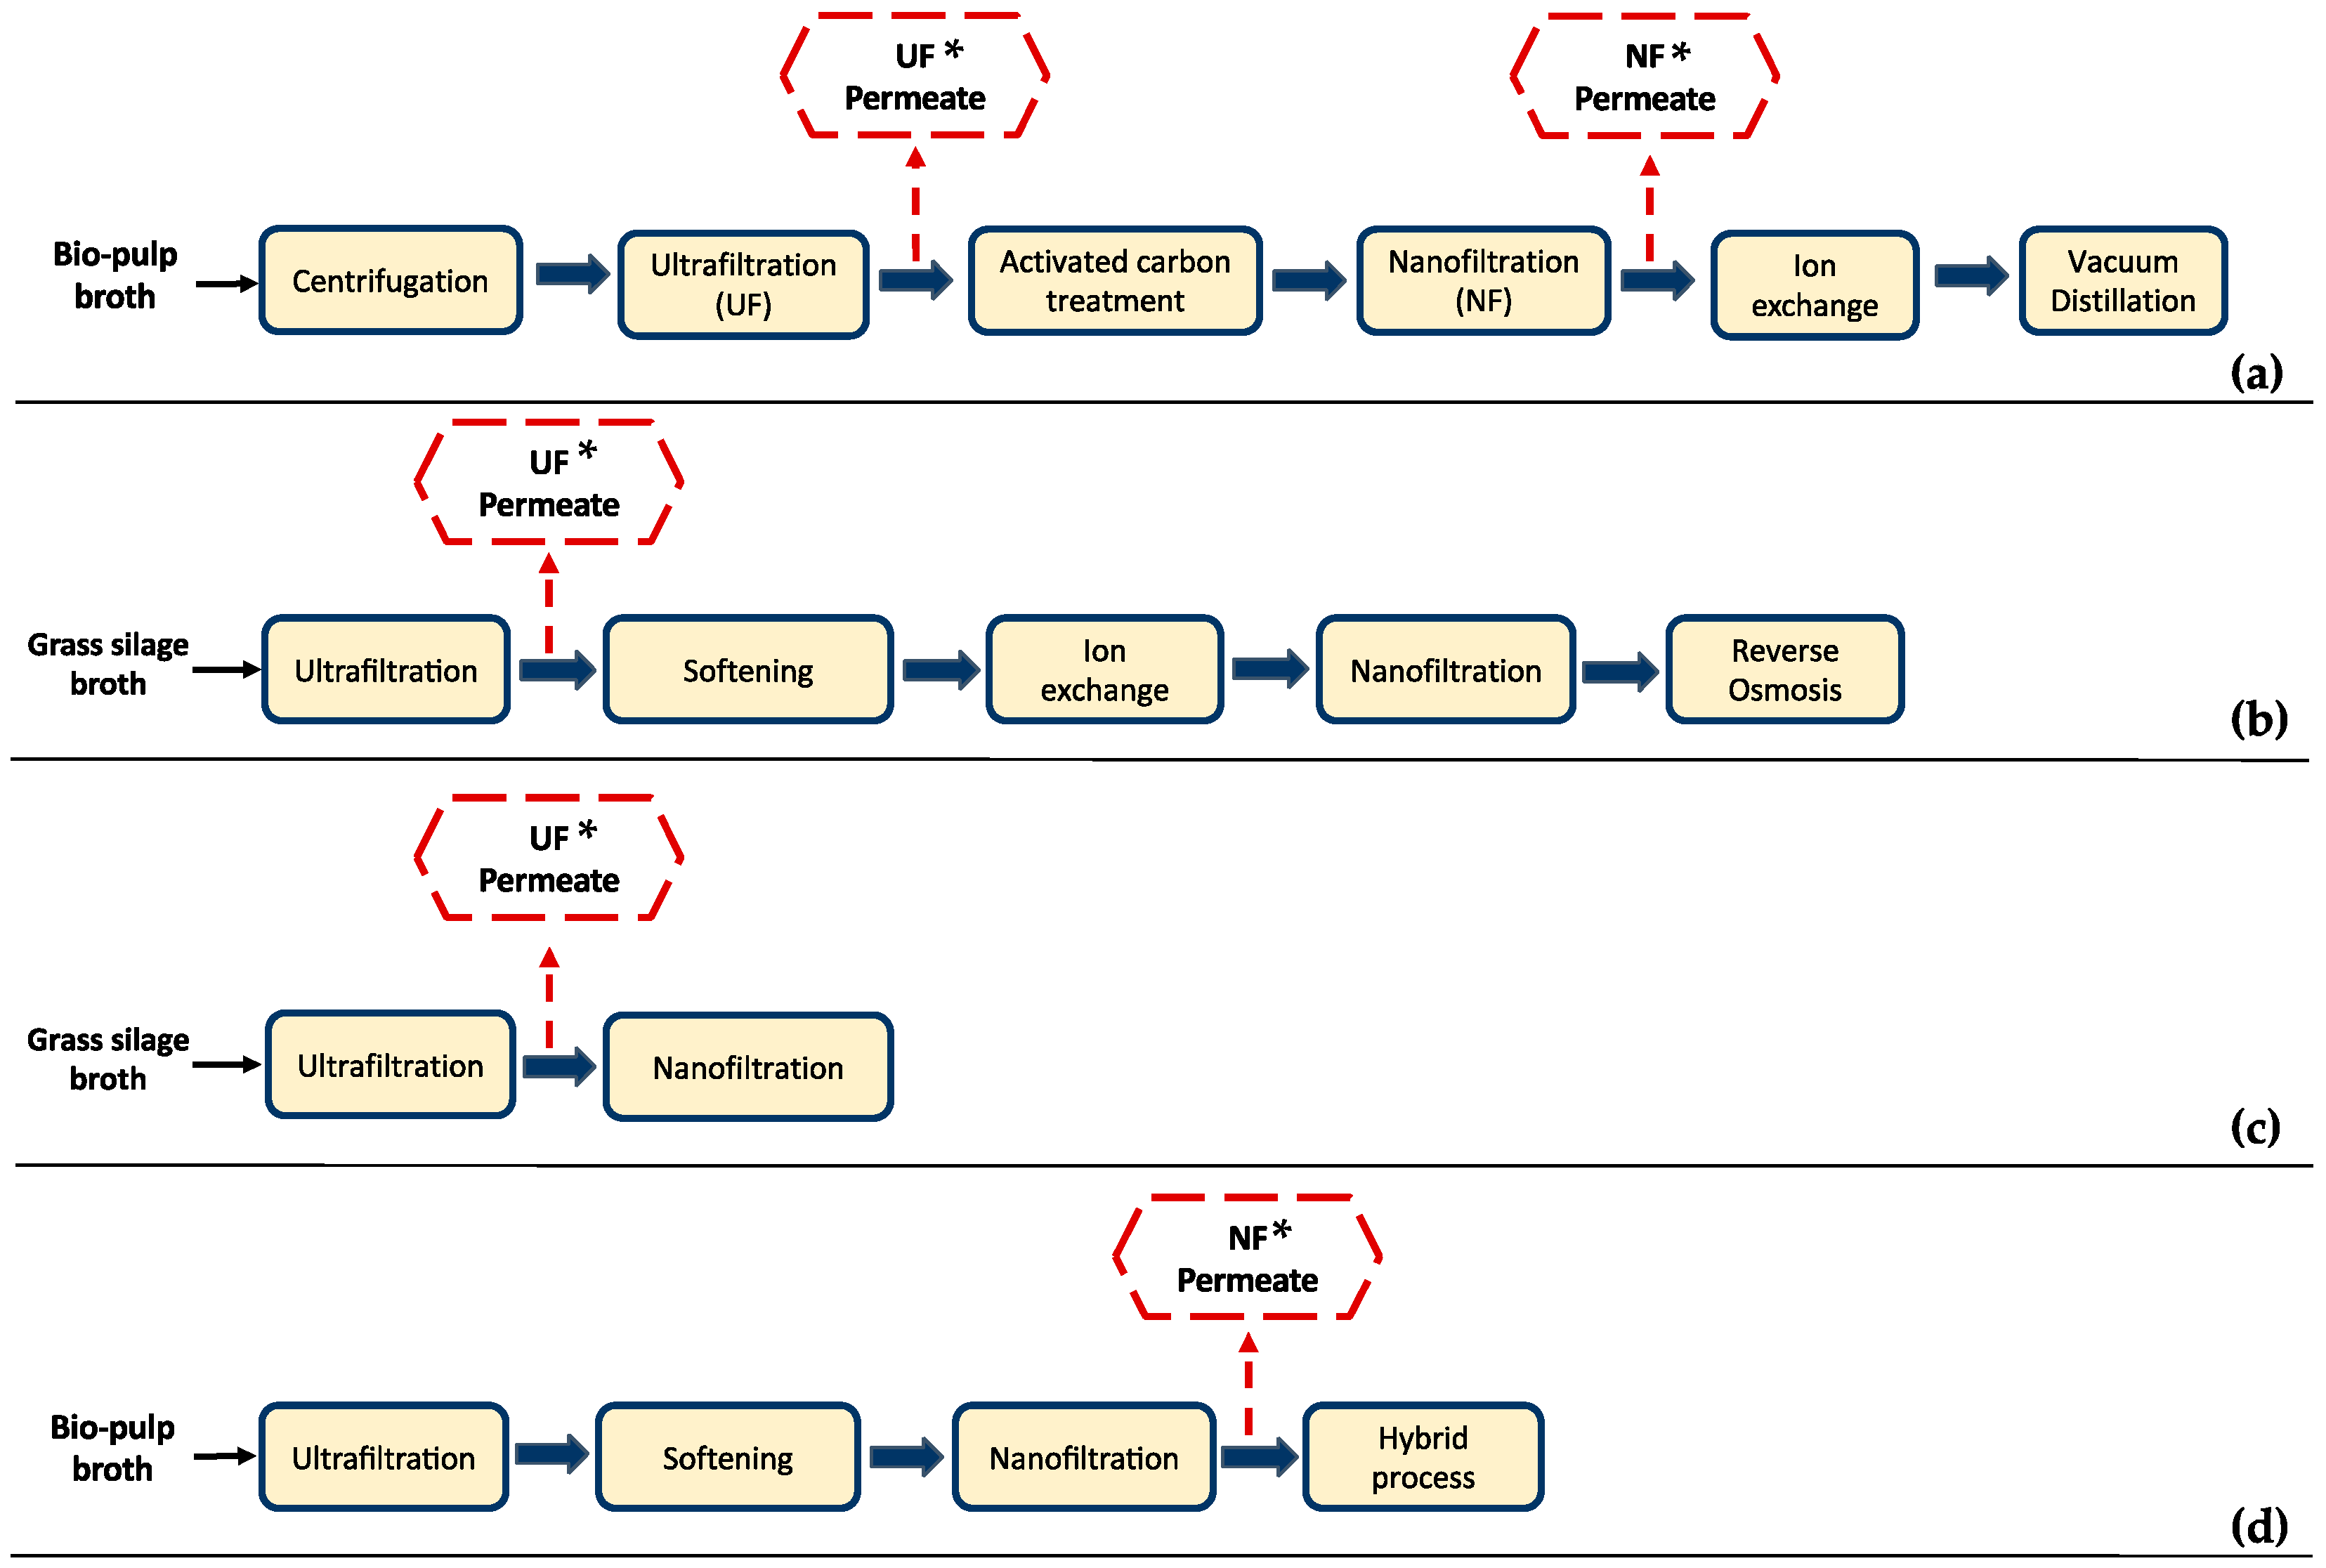
2.2. Biological Feedstocks
2.3. Experimental Design
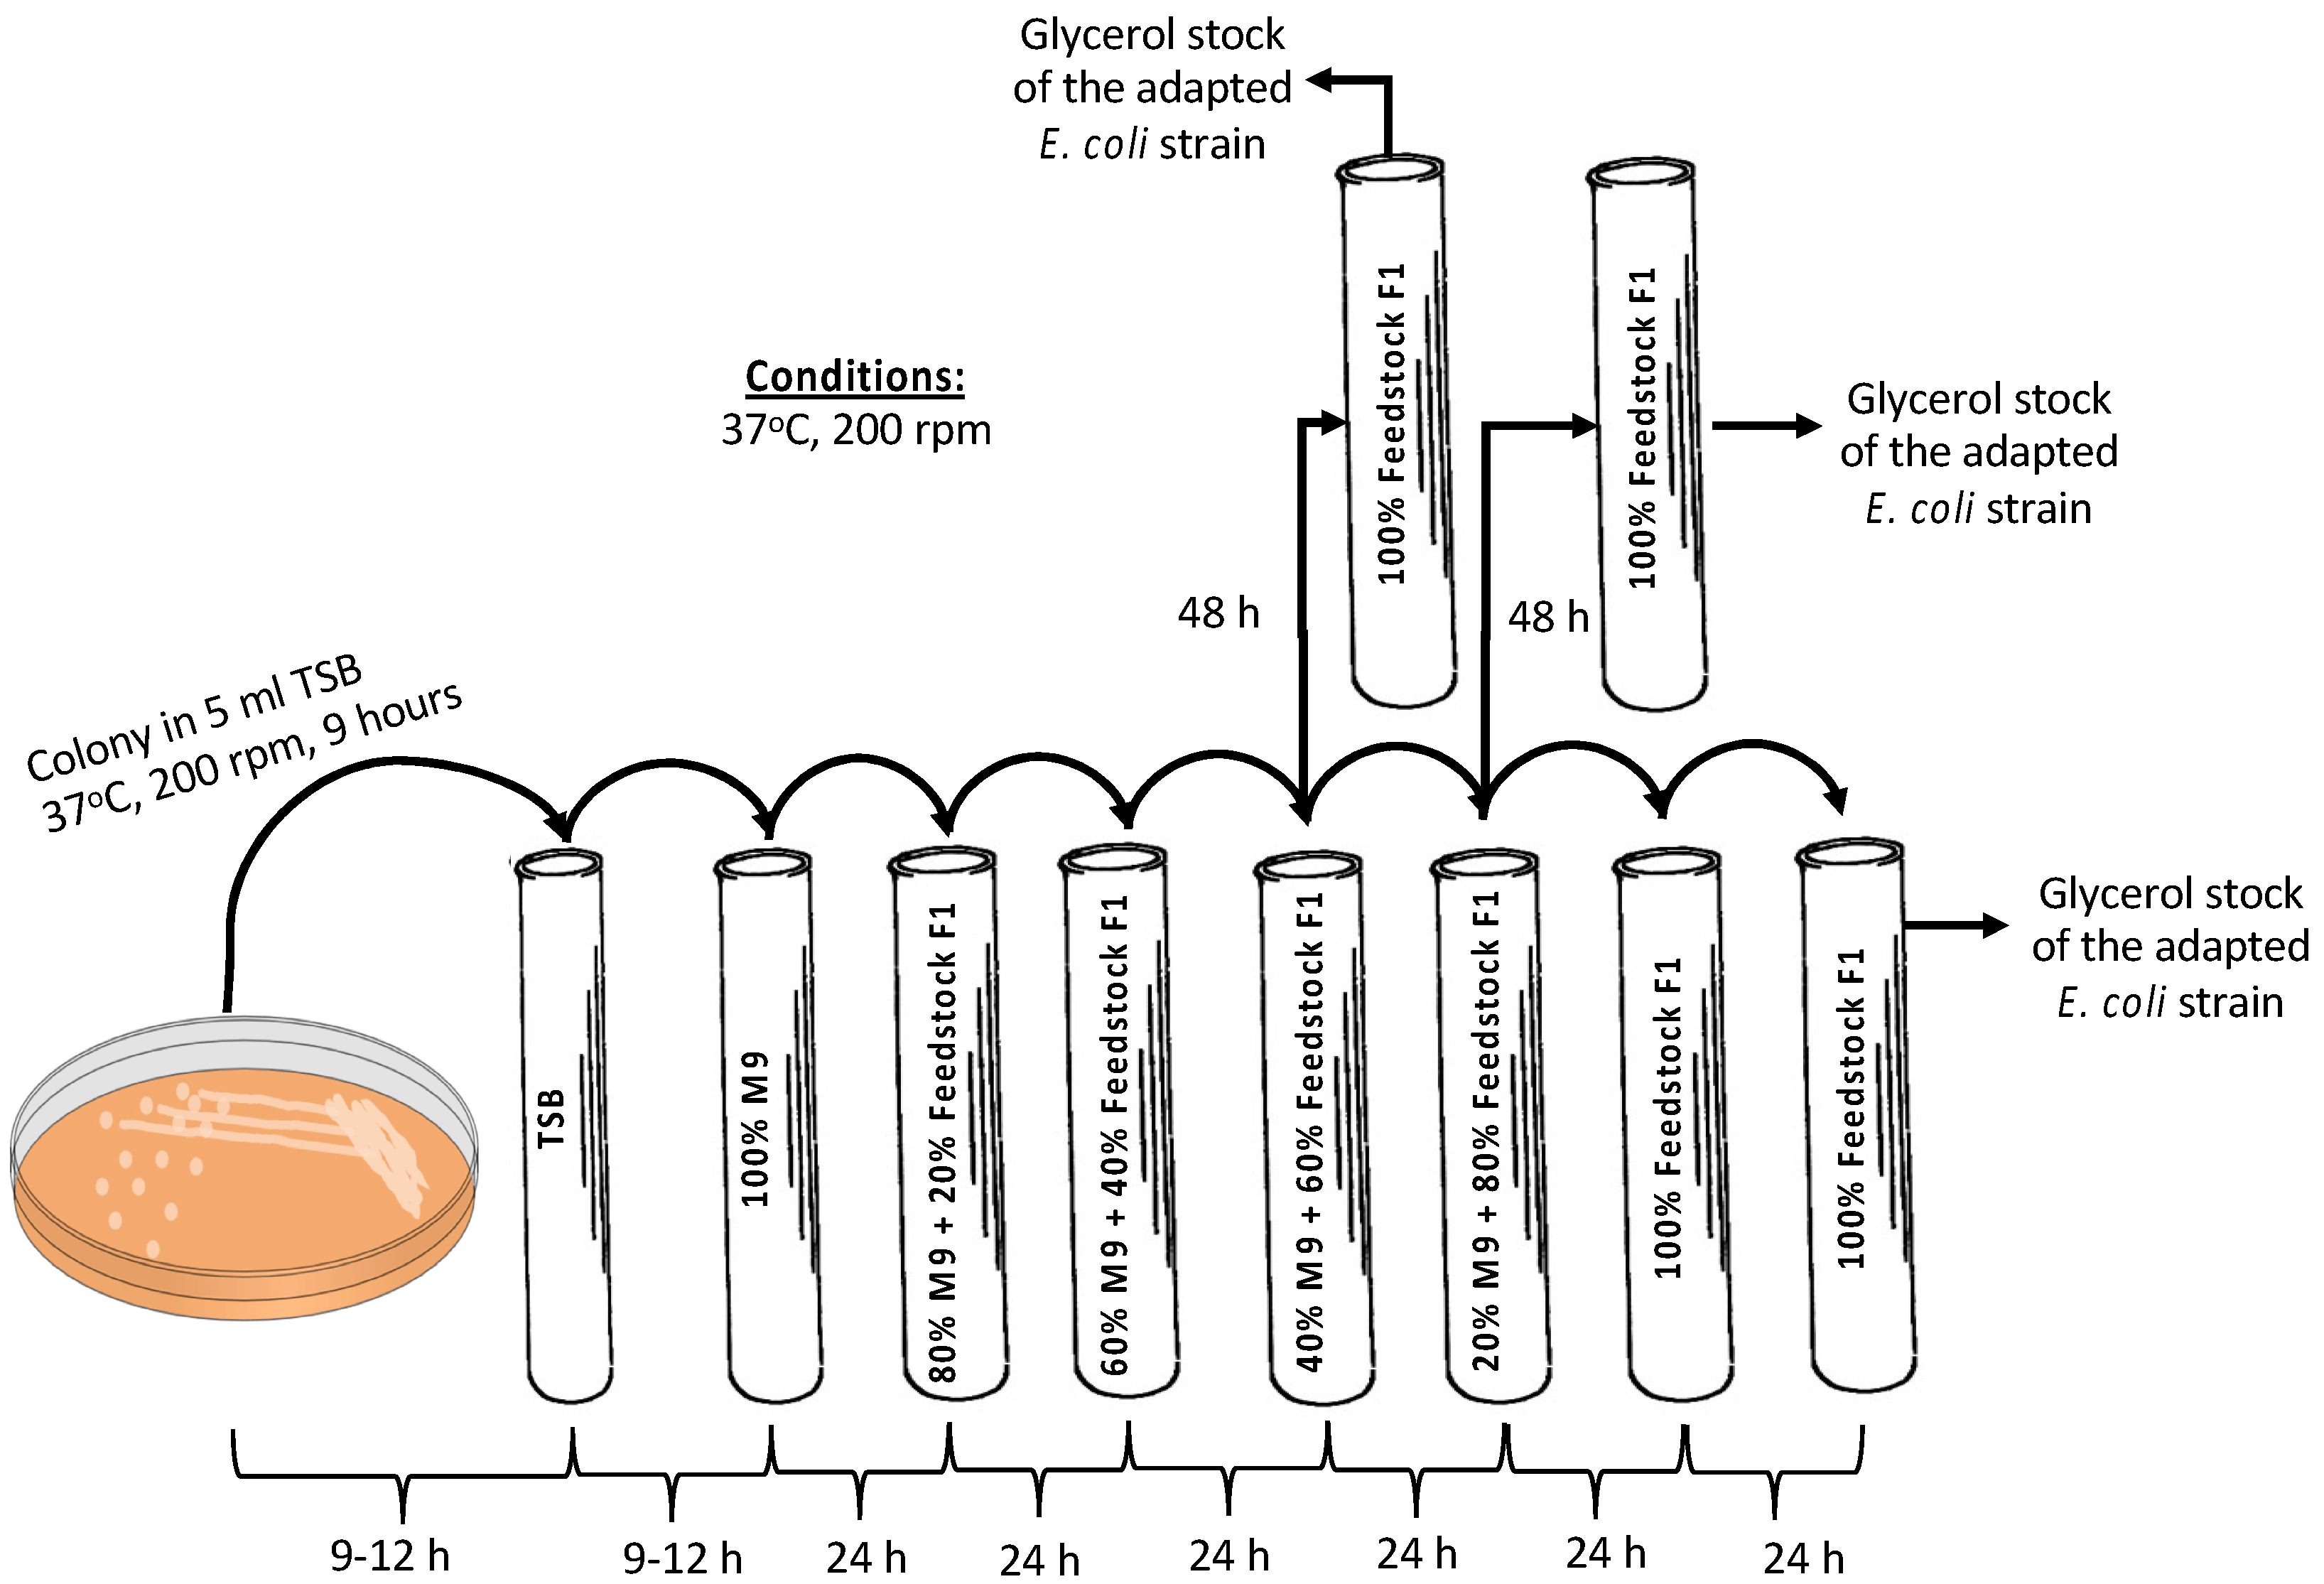
2.3.1. Adaptation of the E. coli A1:ldhA Strain on the Biological Feedstock
2.3.2. Preliminary Validation in Shake Flask Scale
2.3.3. Scale-Up in a Bench-Scale Bioreactor
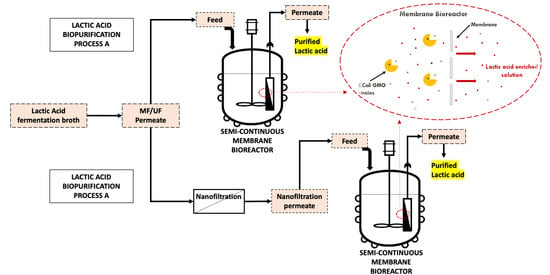
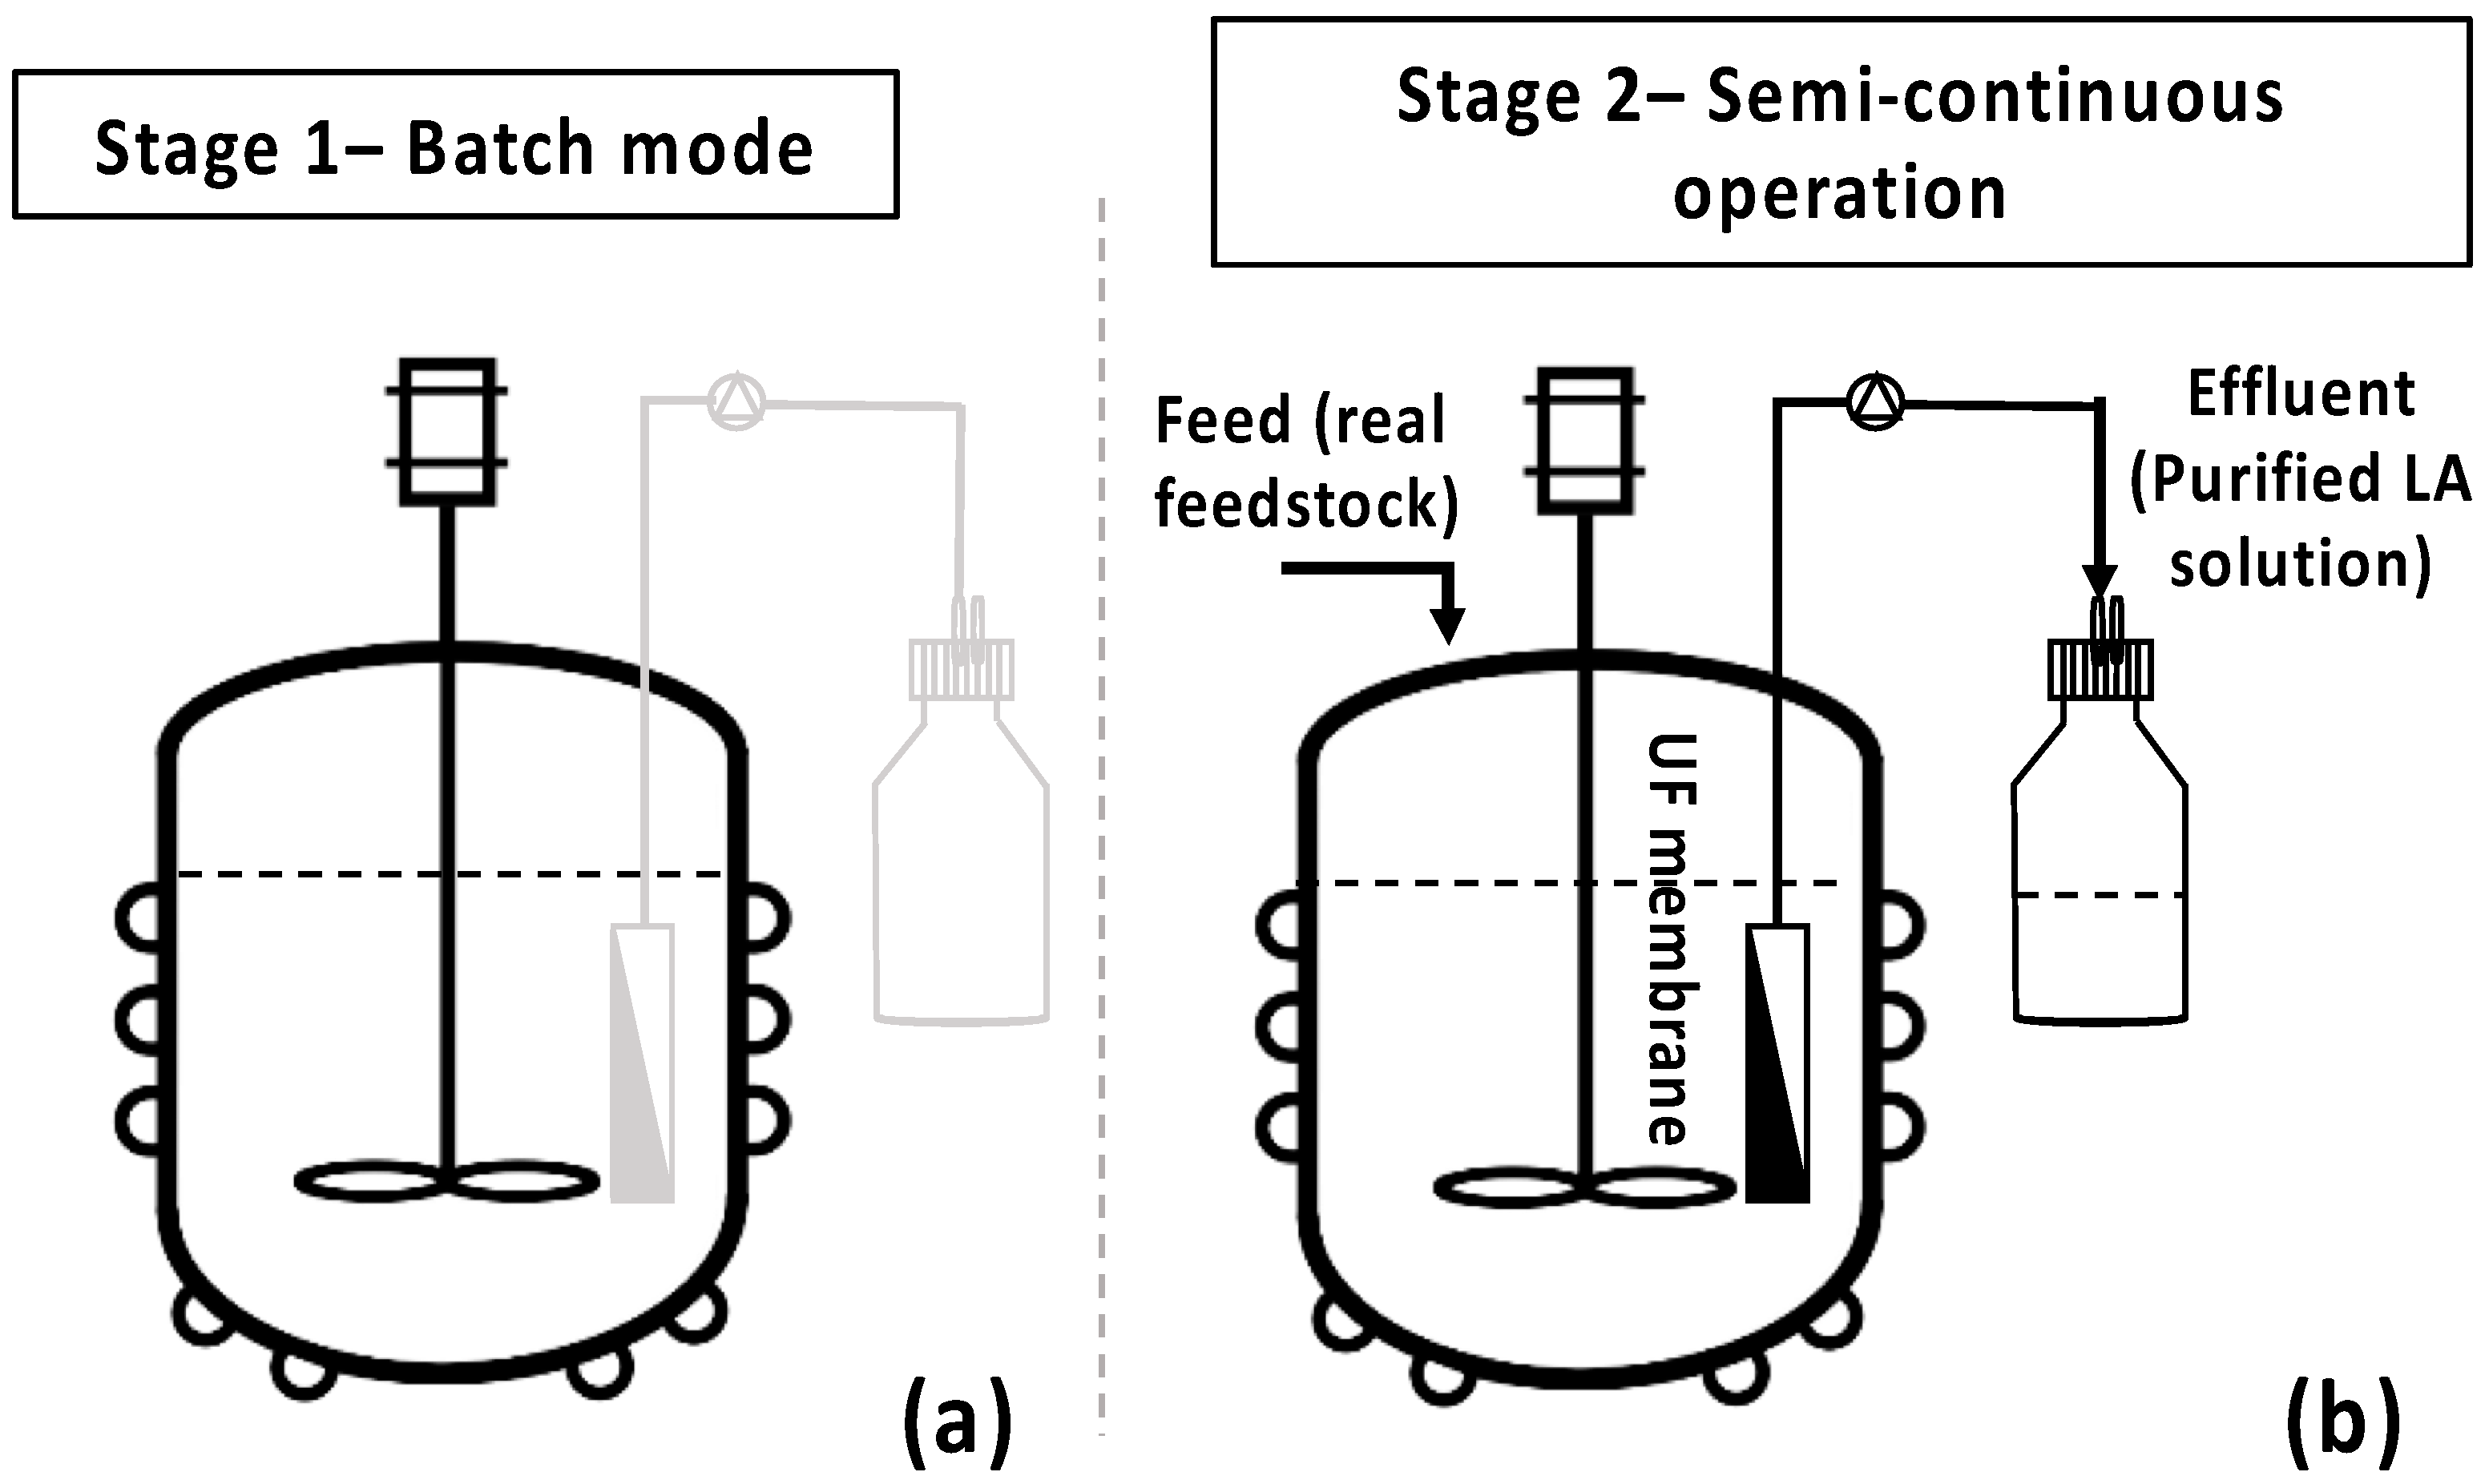
2.3.4. Semi-Continuous MBR Bio-Purification Process for LA—Comparative Assessment
2.4. Analytical Methods
2.4.1. High-Performance Liquid Chromatography (HPLC)
2.4.2. Total Organic Carbon (TOC) and Total Nitrogen (TN)
2.4.3. Optical Density (OD600) and Dry Biomass
3. Results and Discussion
3.1. Adaptation of the E. coli A1:ldhA Strain on the Biological Feedstock
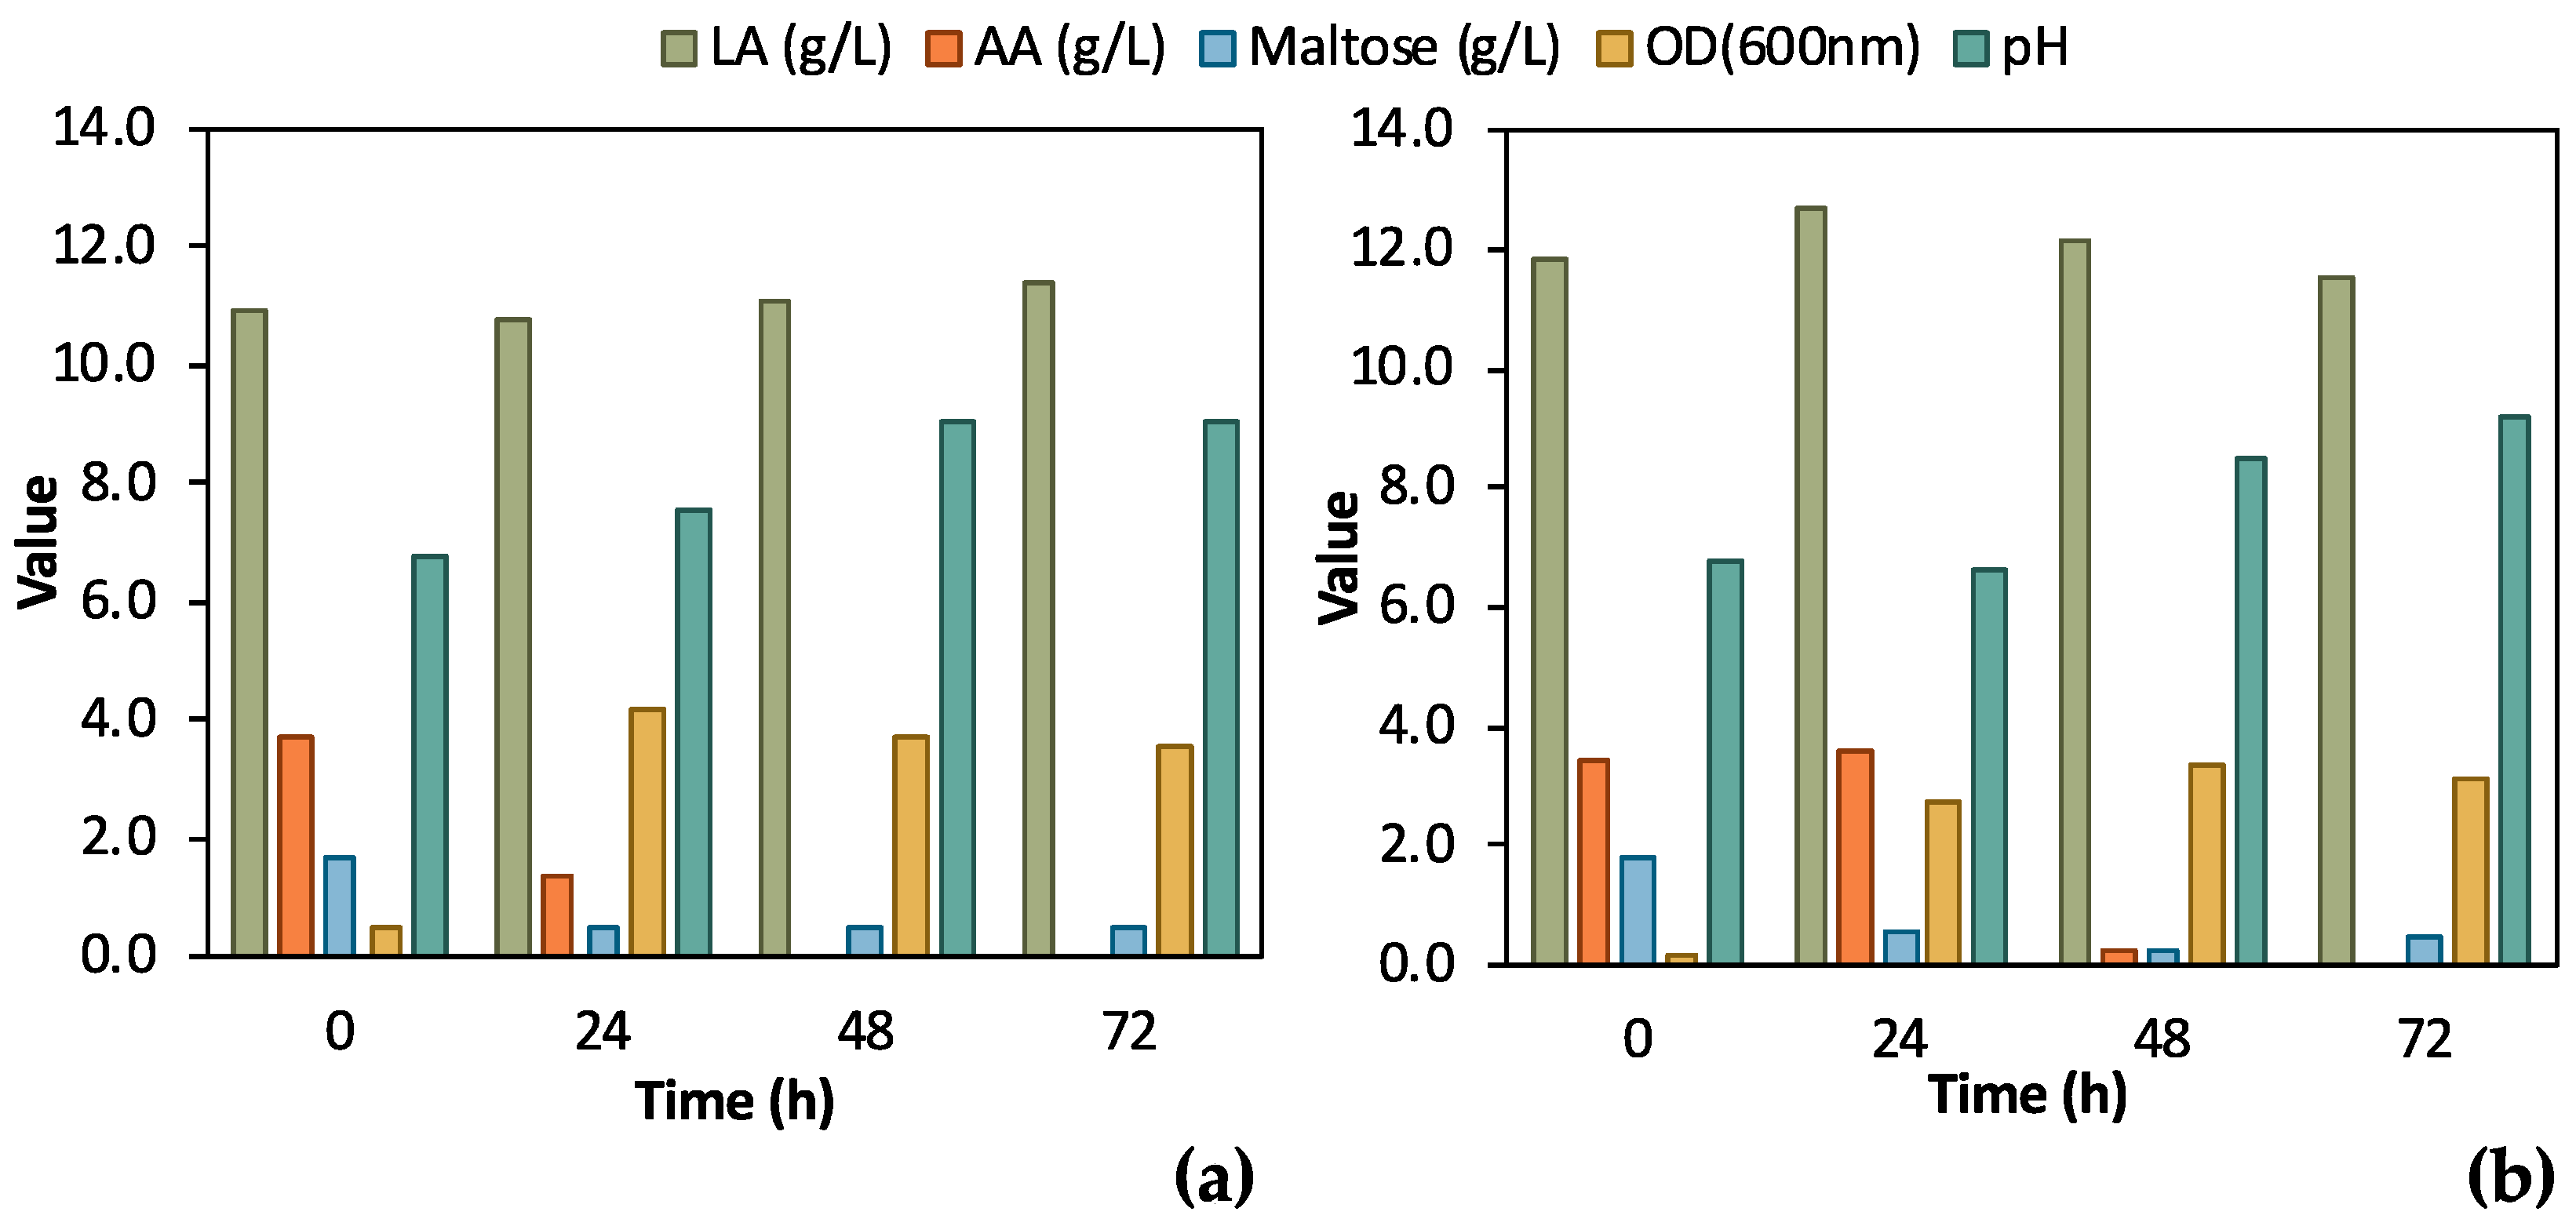
3.2. Preliminary Validation in Shake Flask Scale
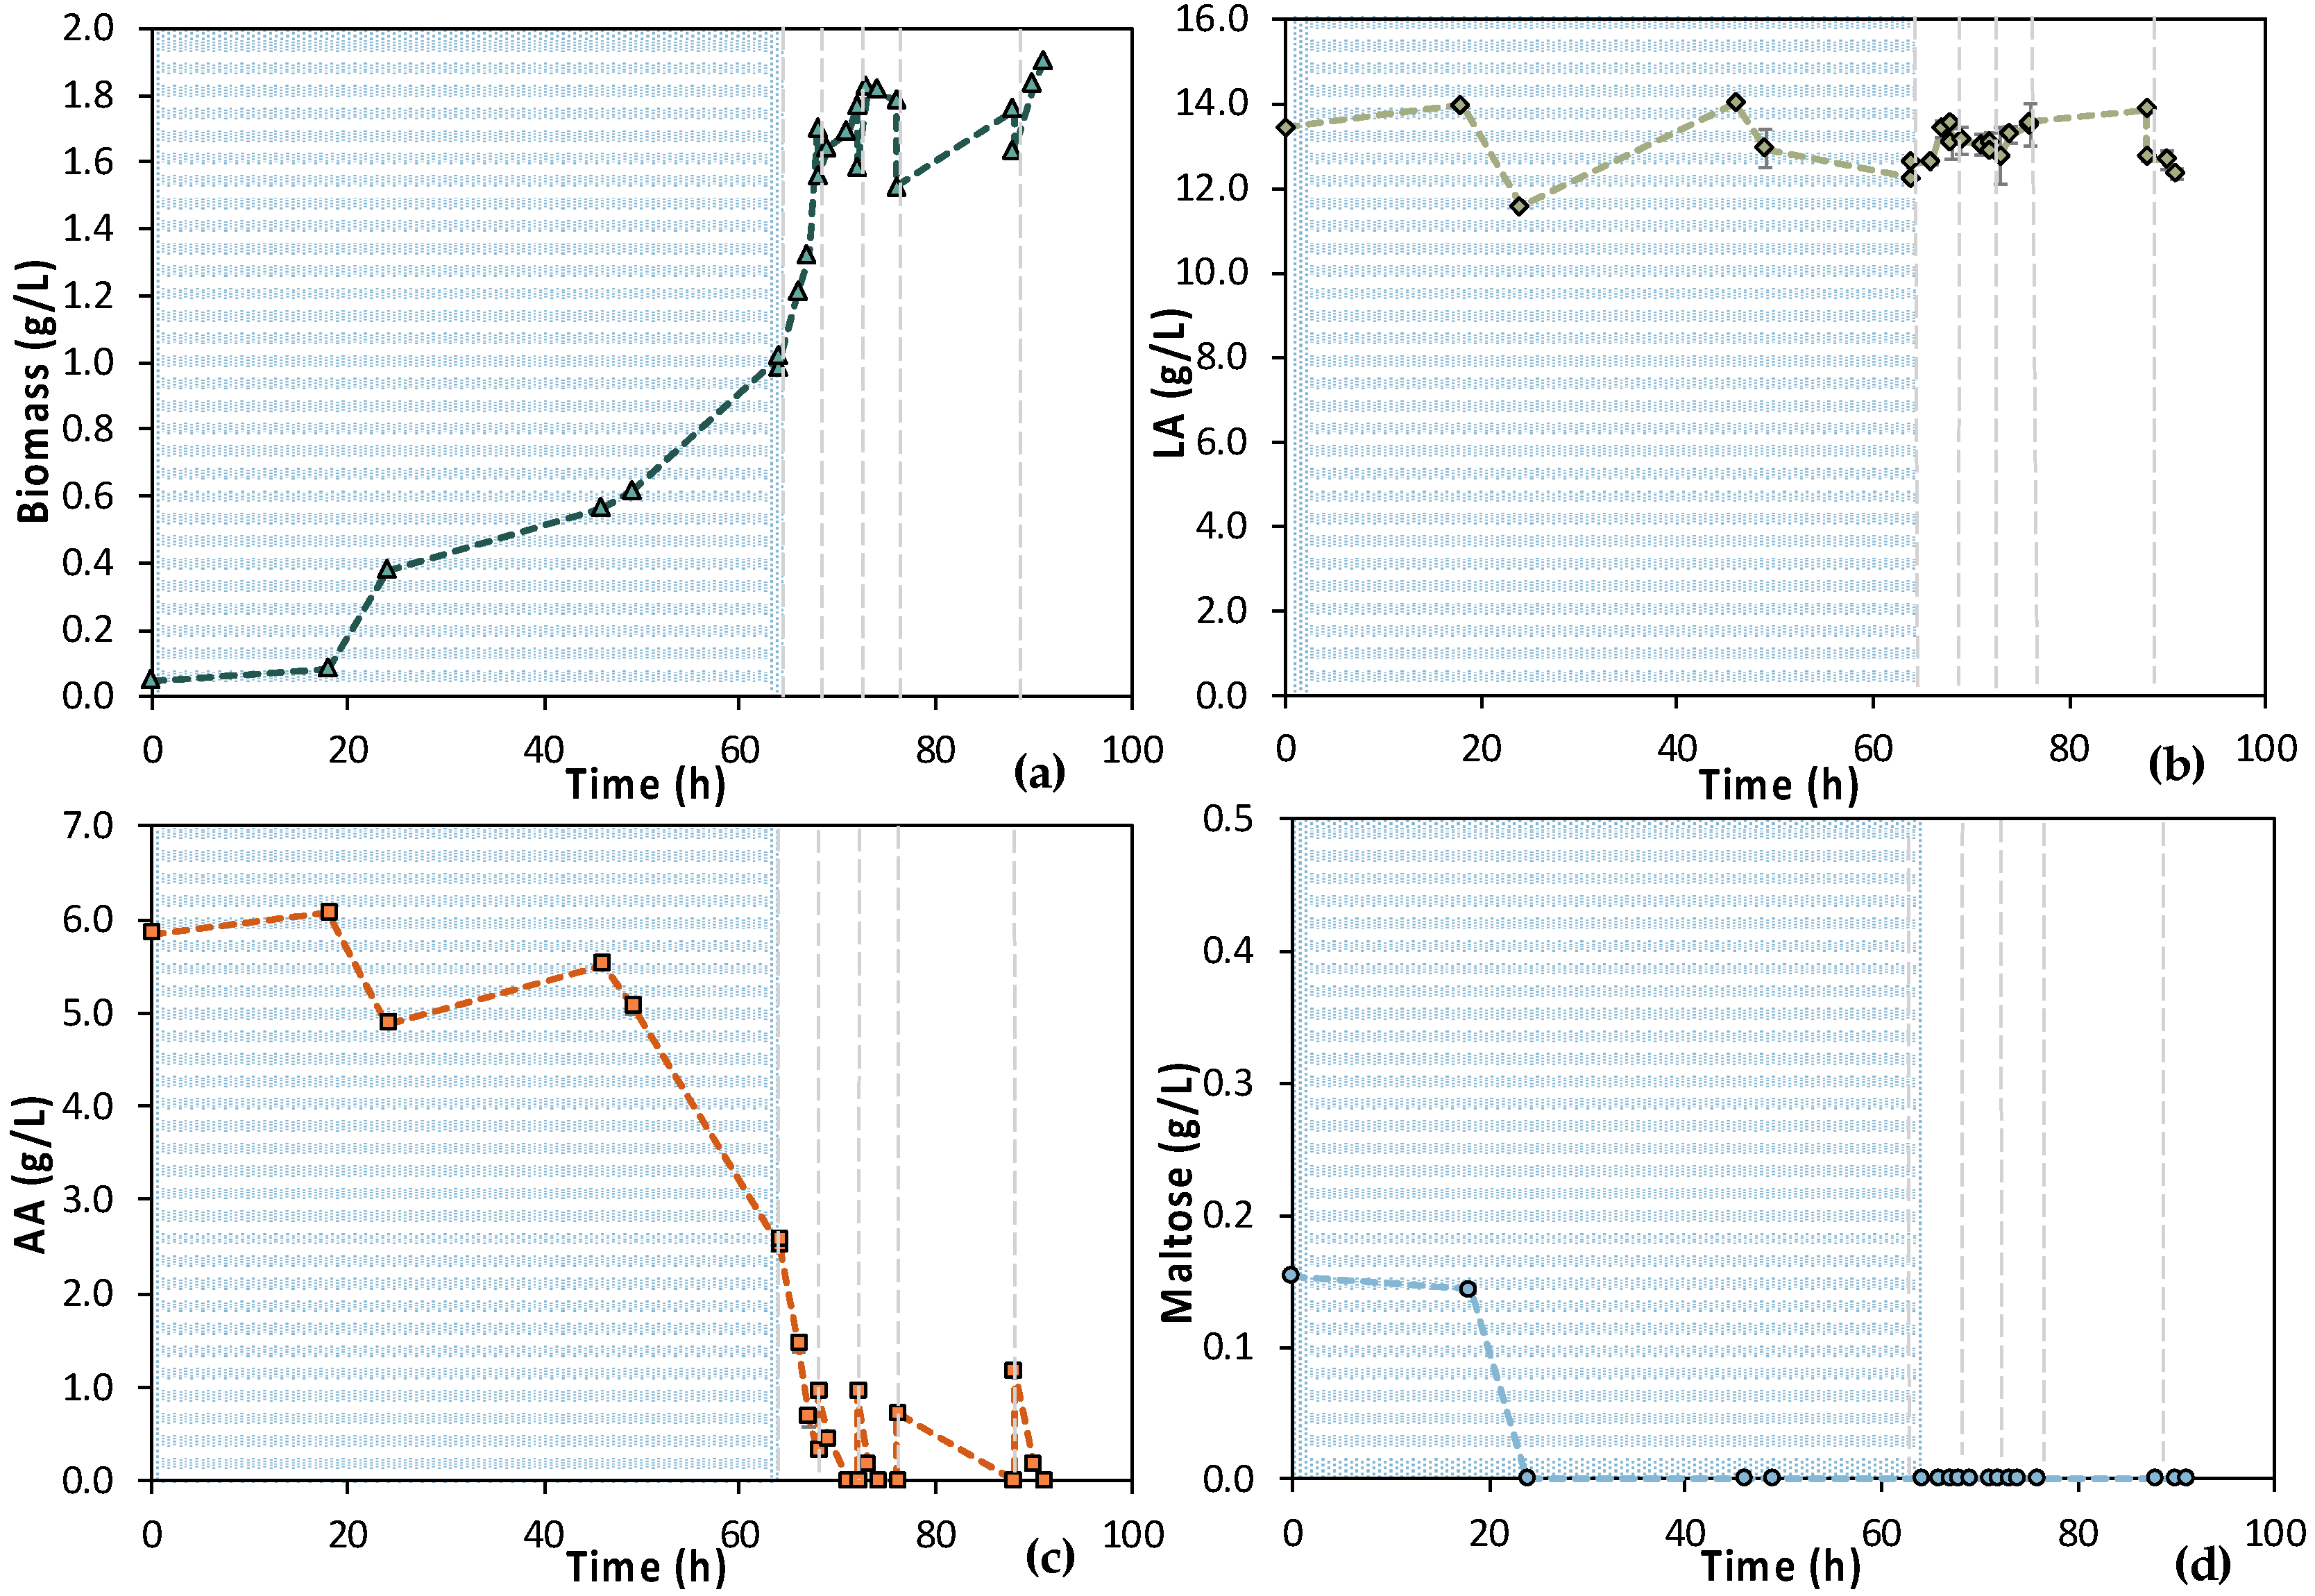
3.3. Scale-Up in a Bench-Scale Bioreactor
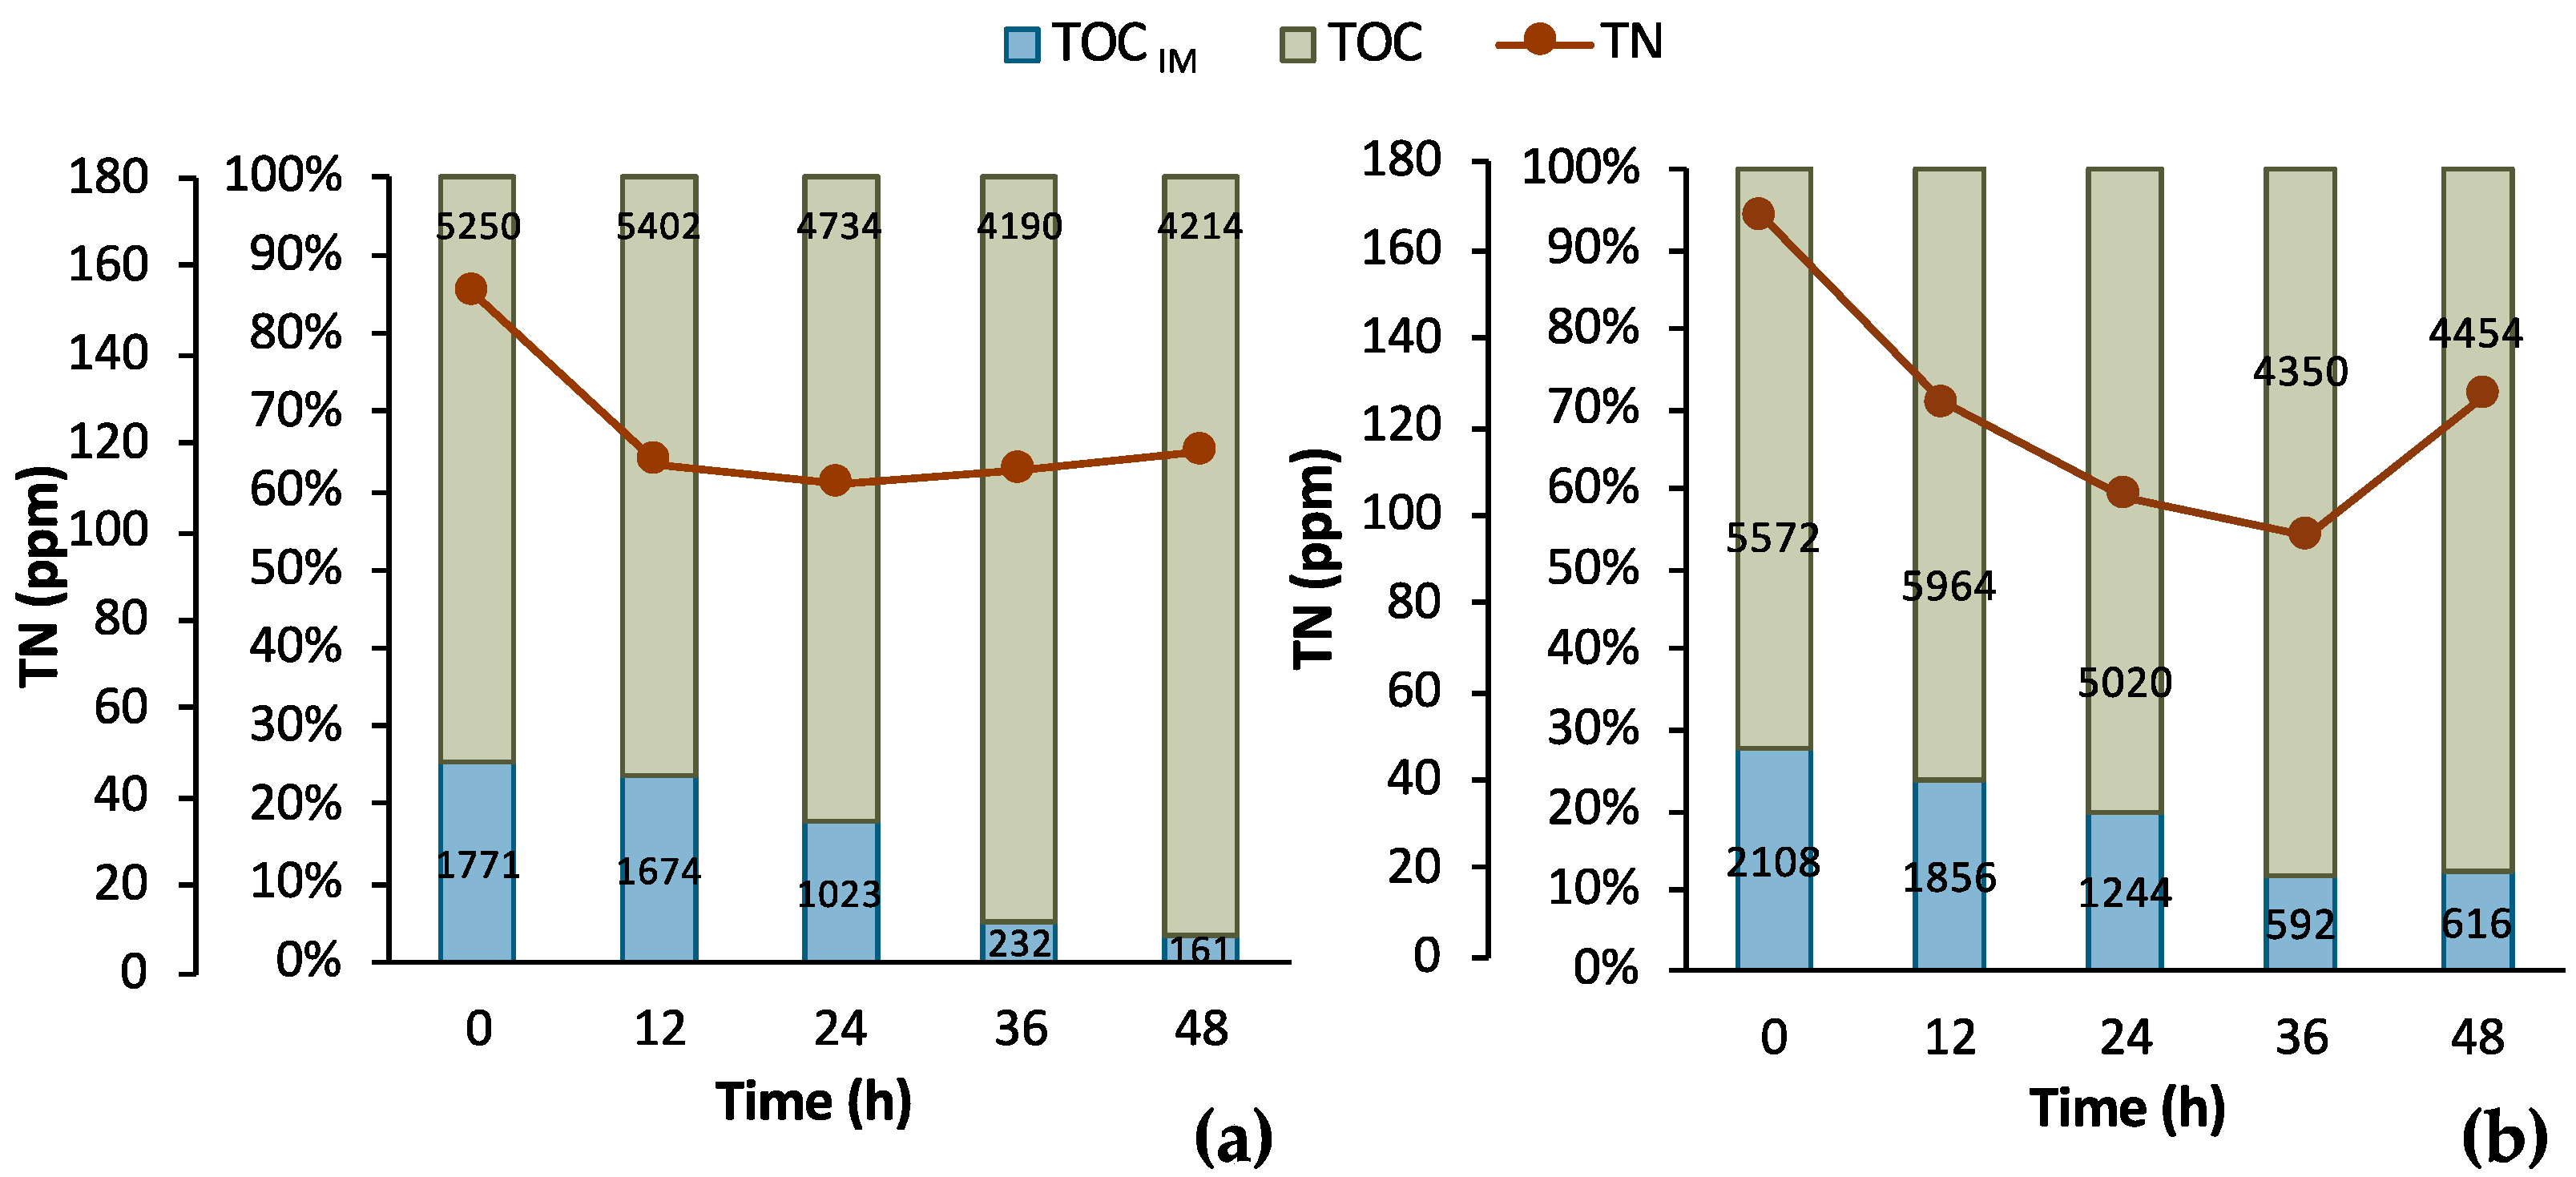
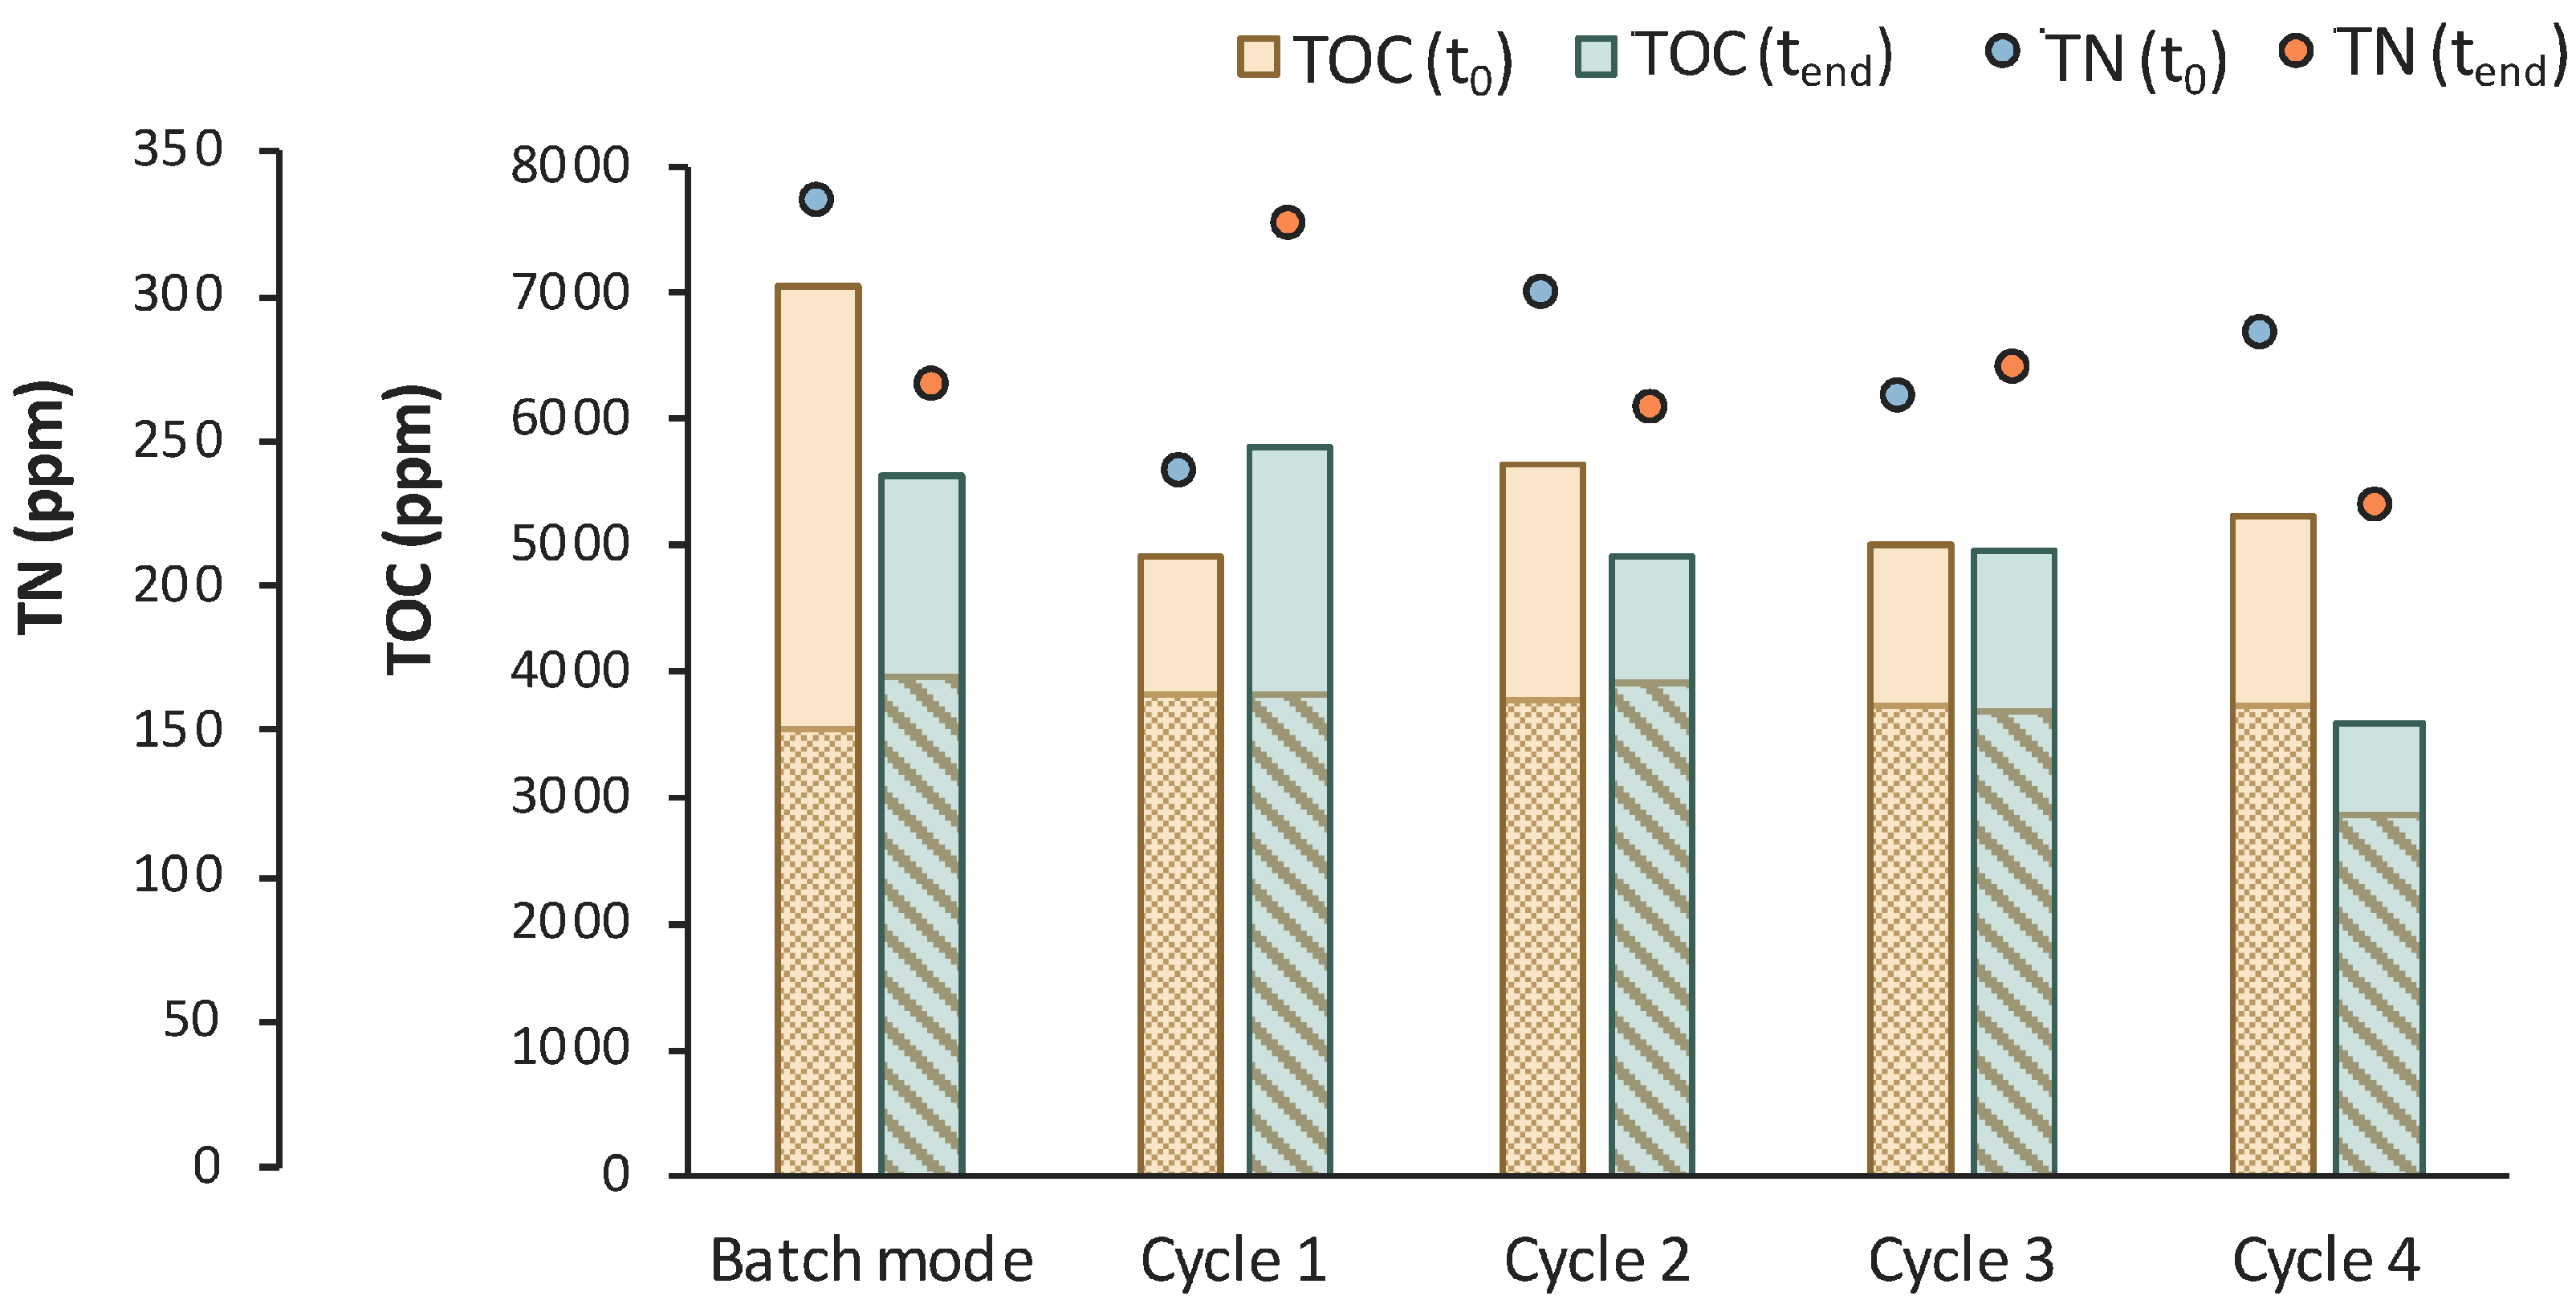
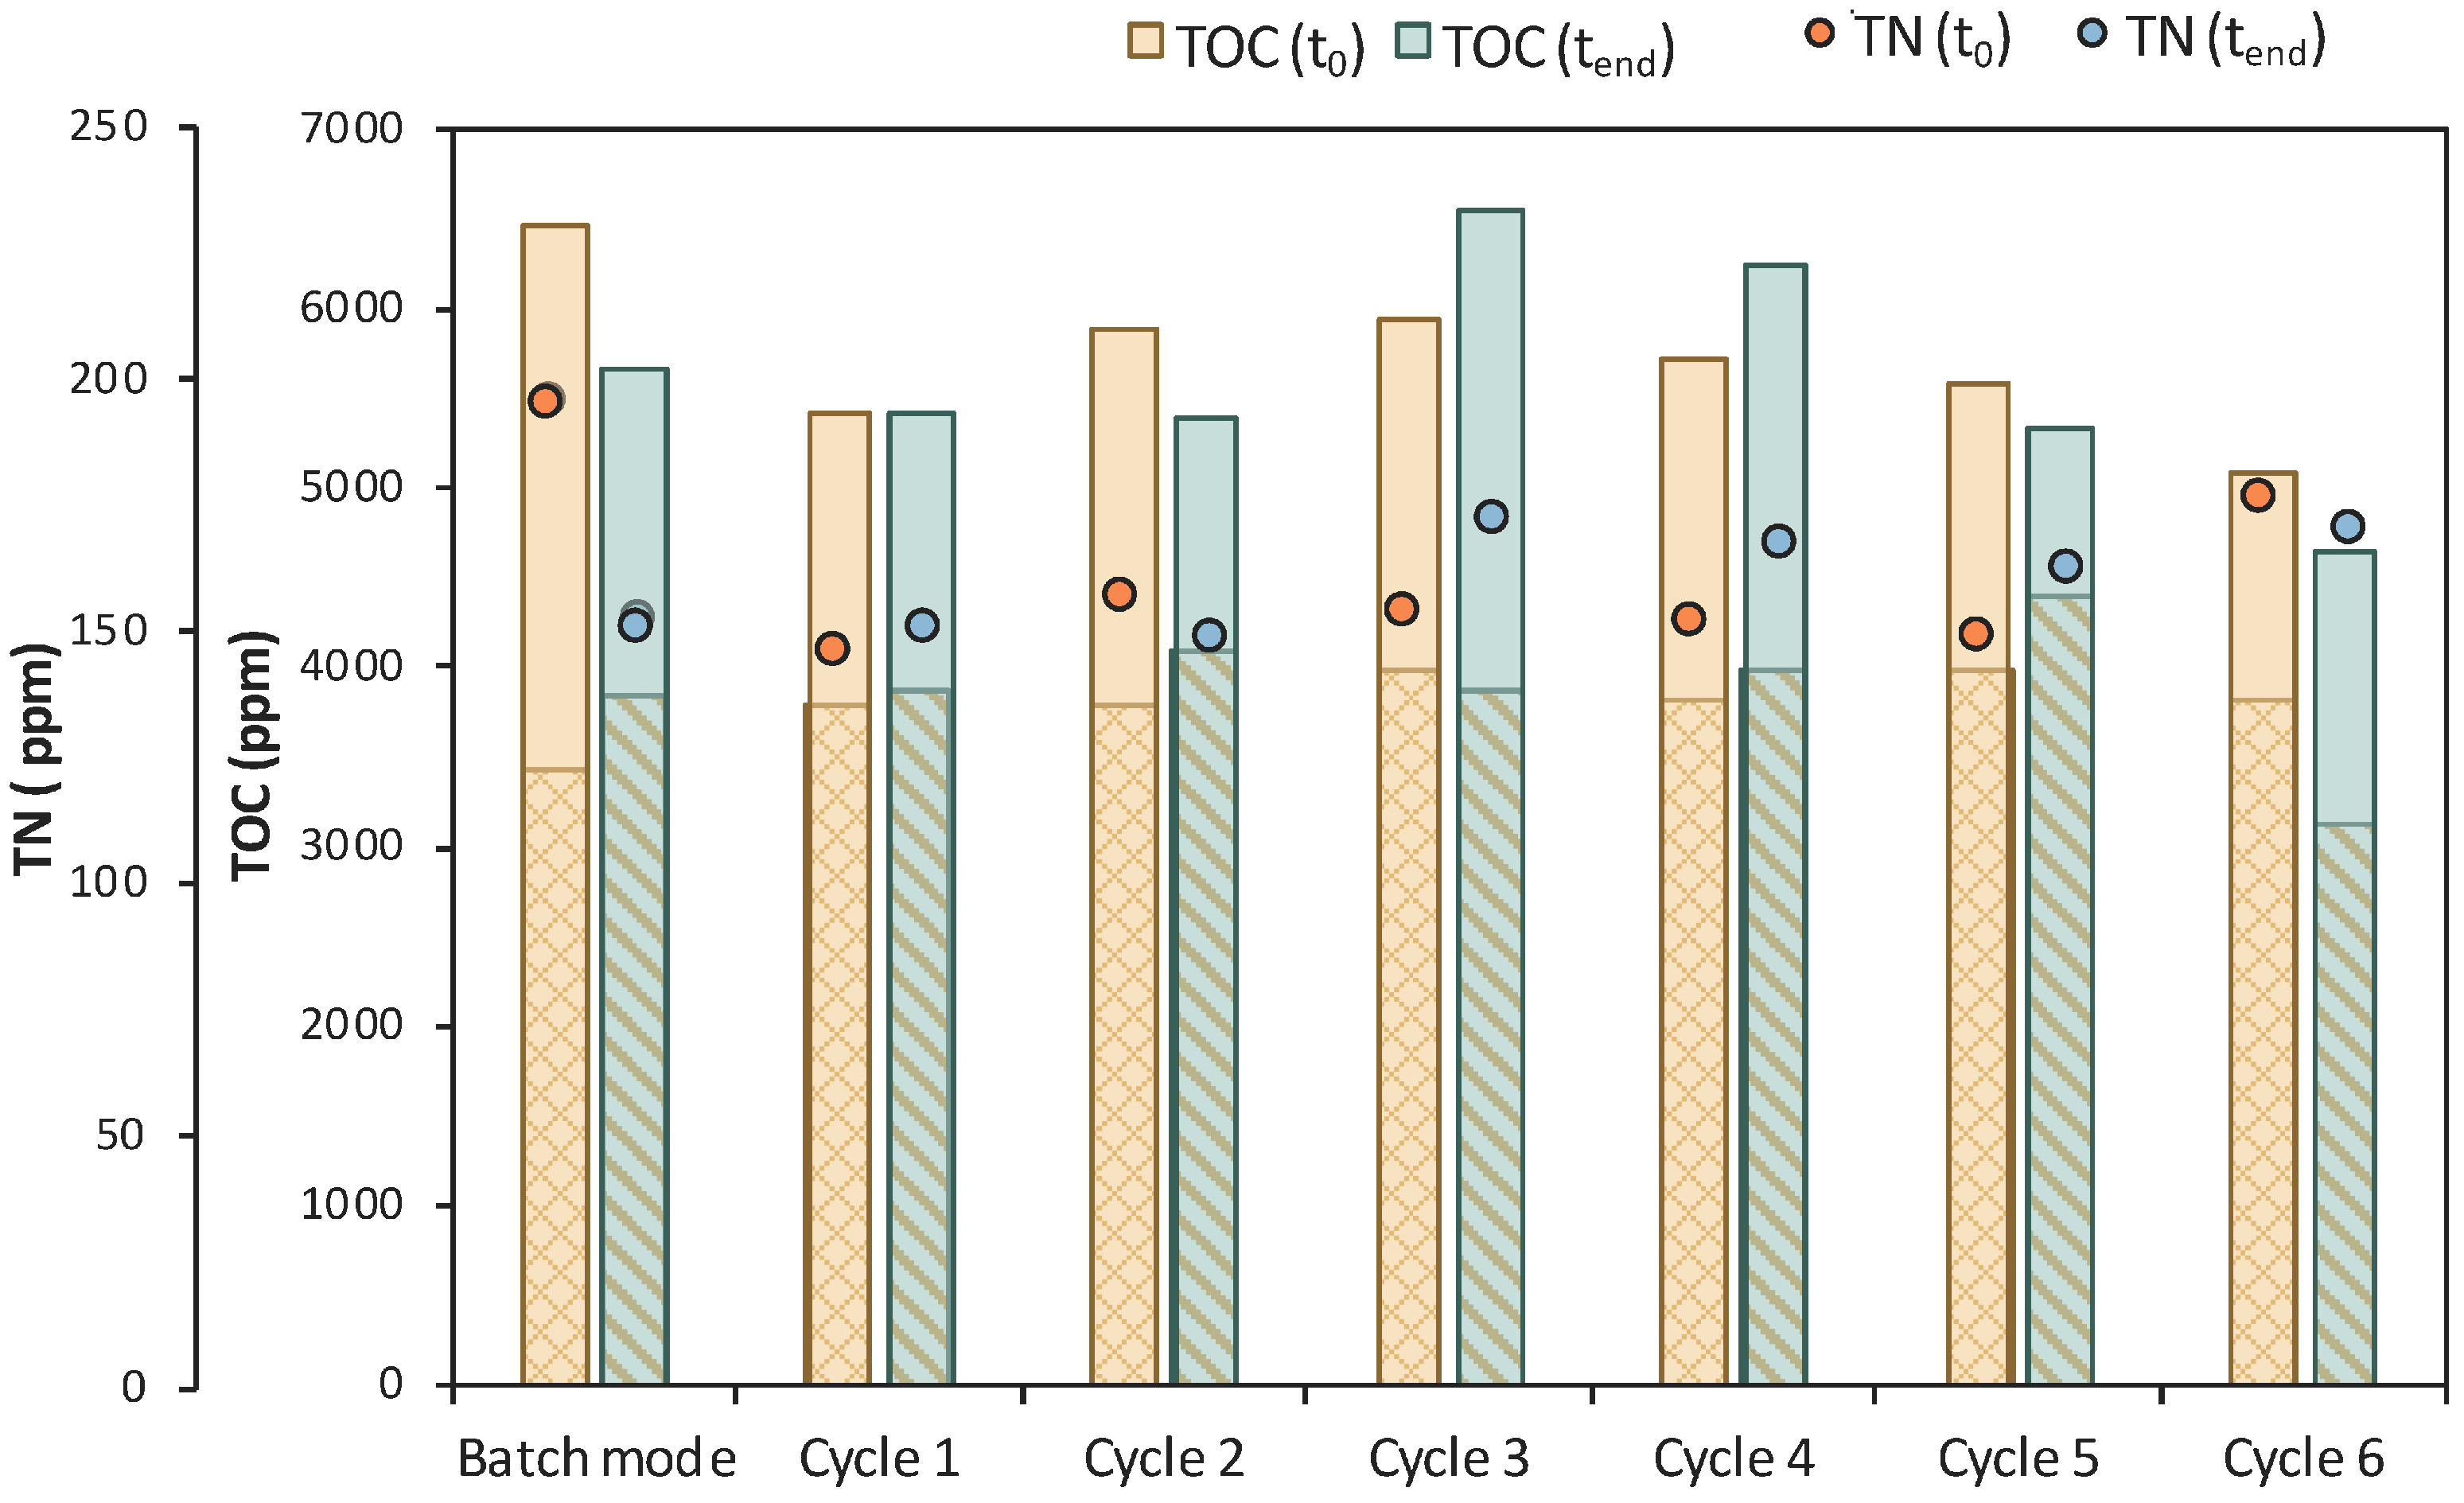
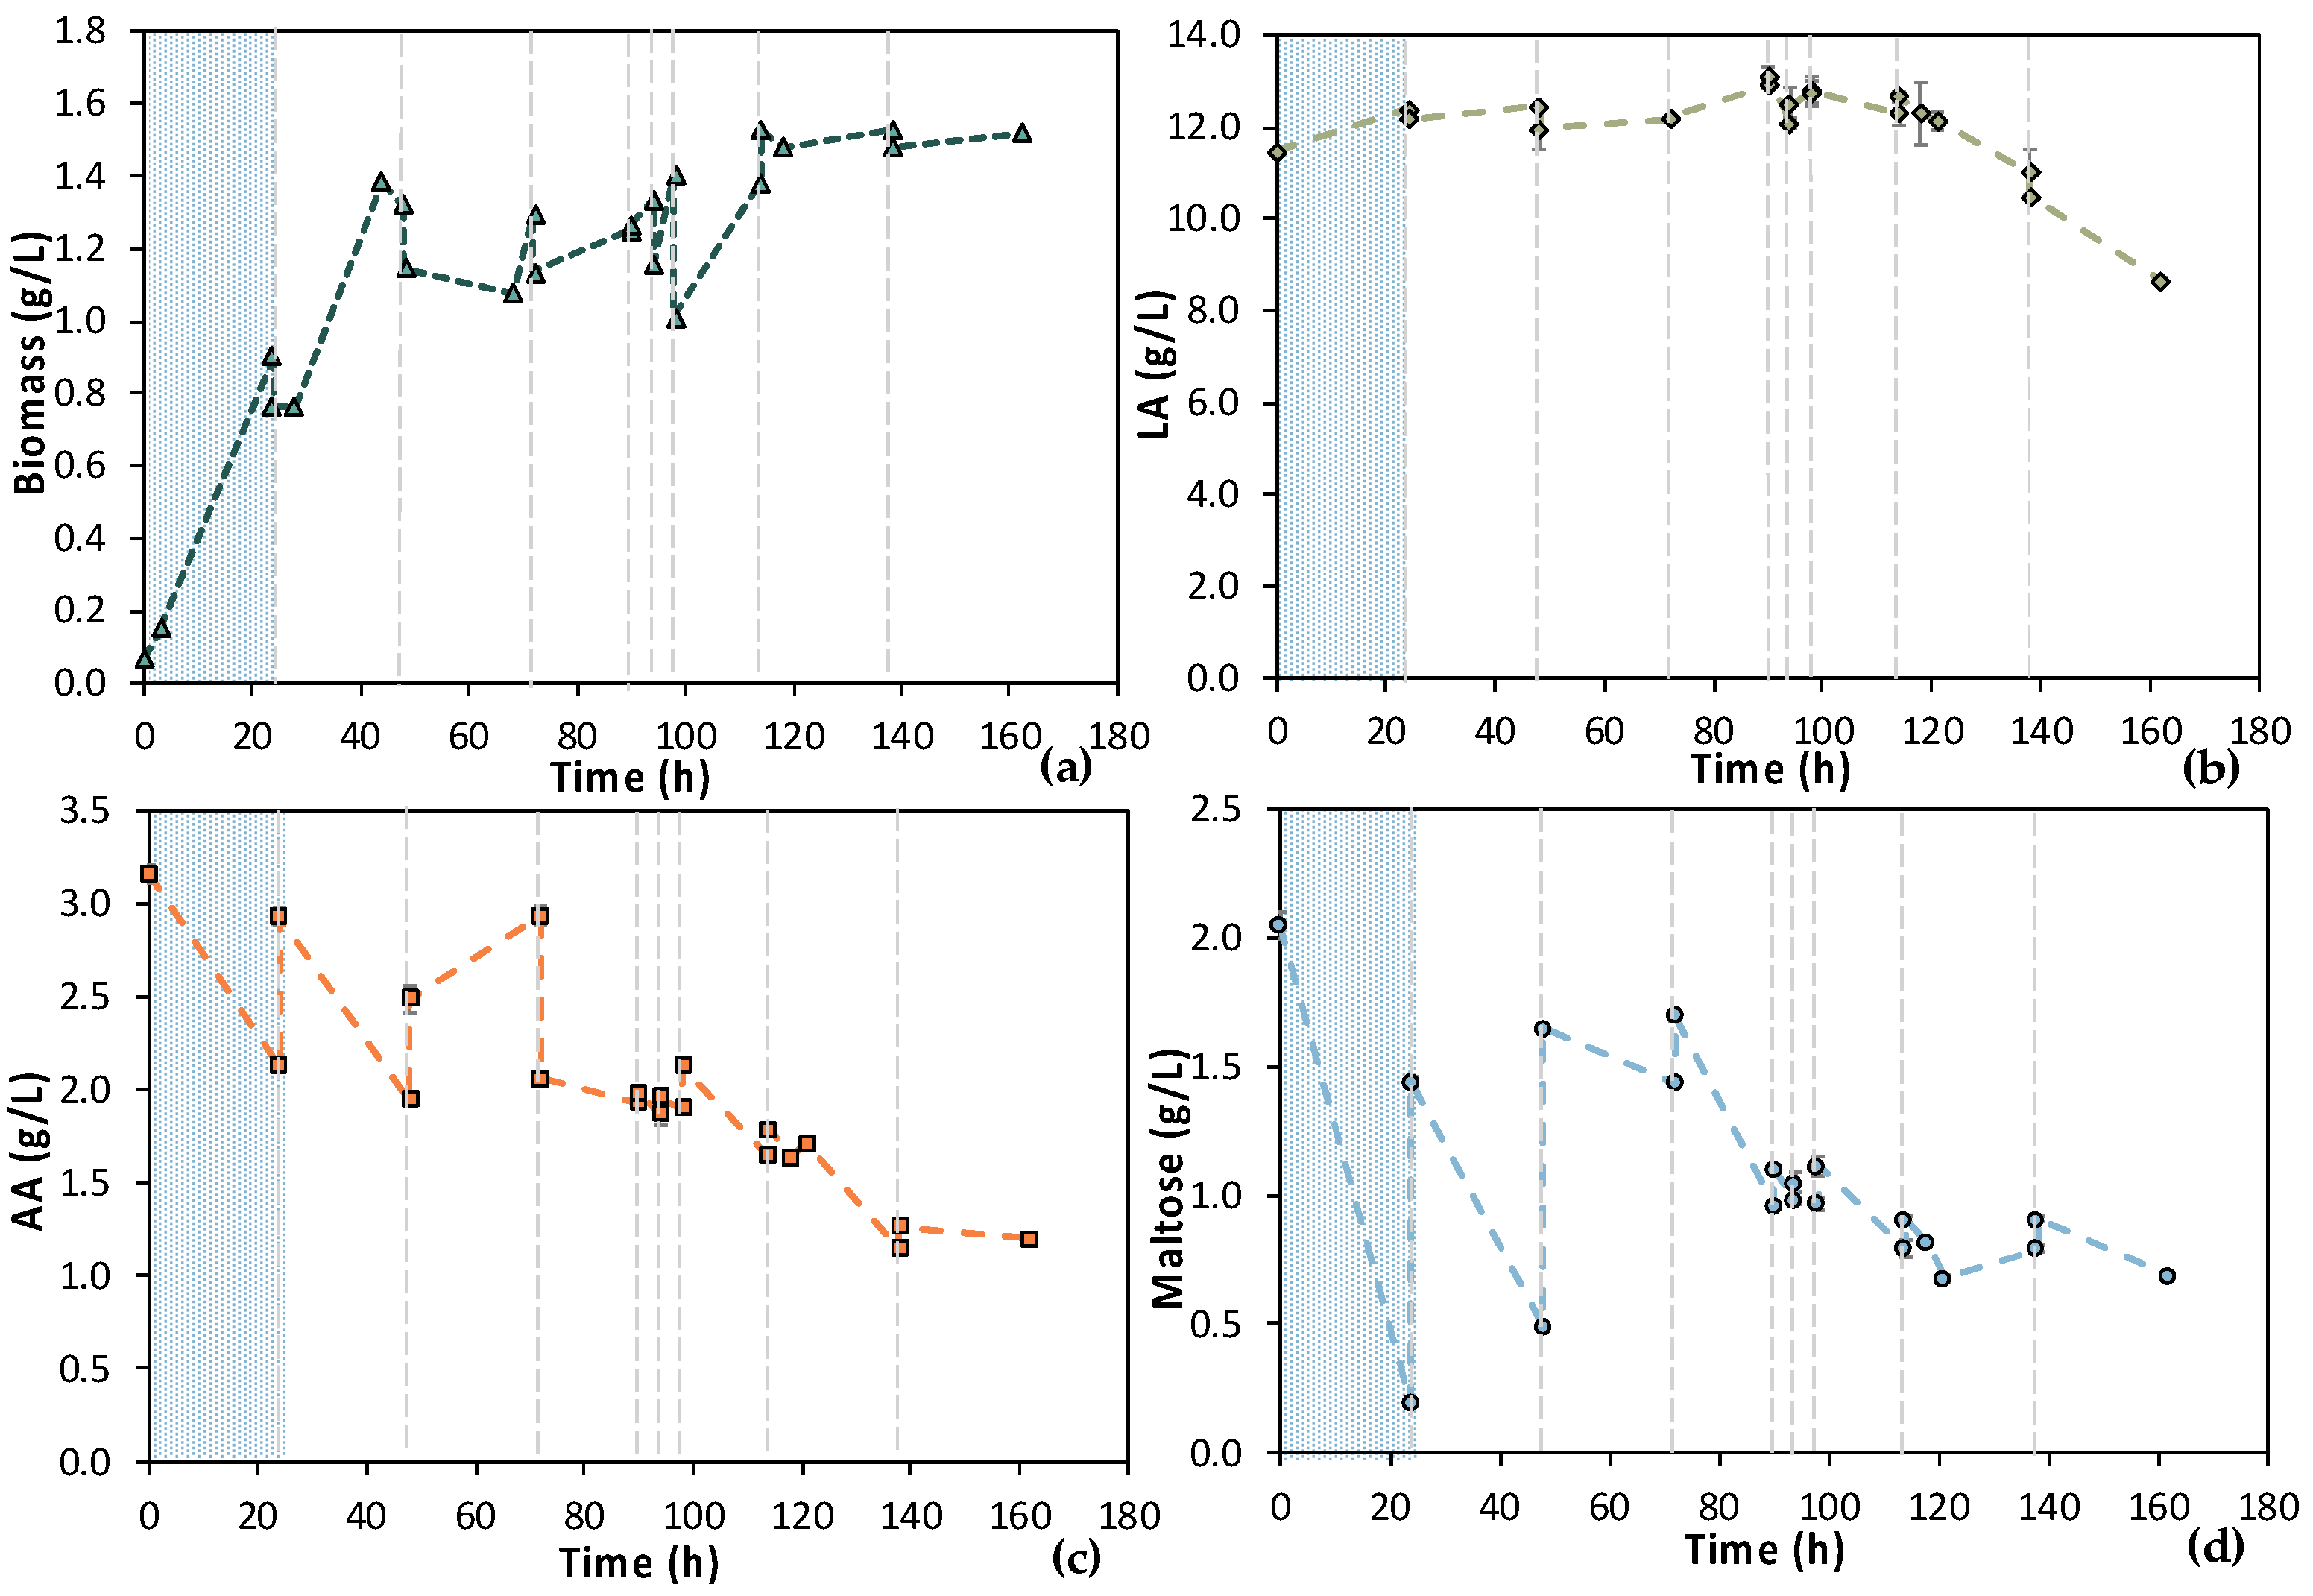
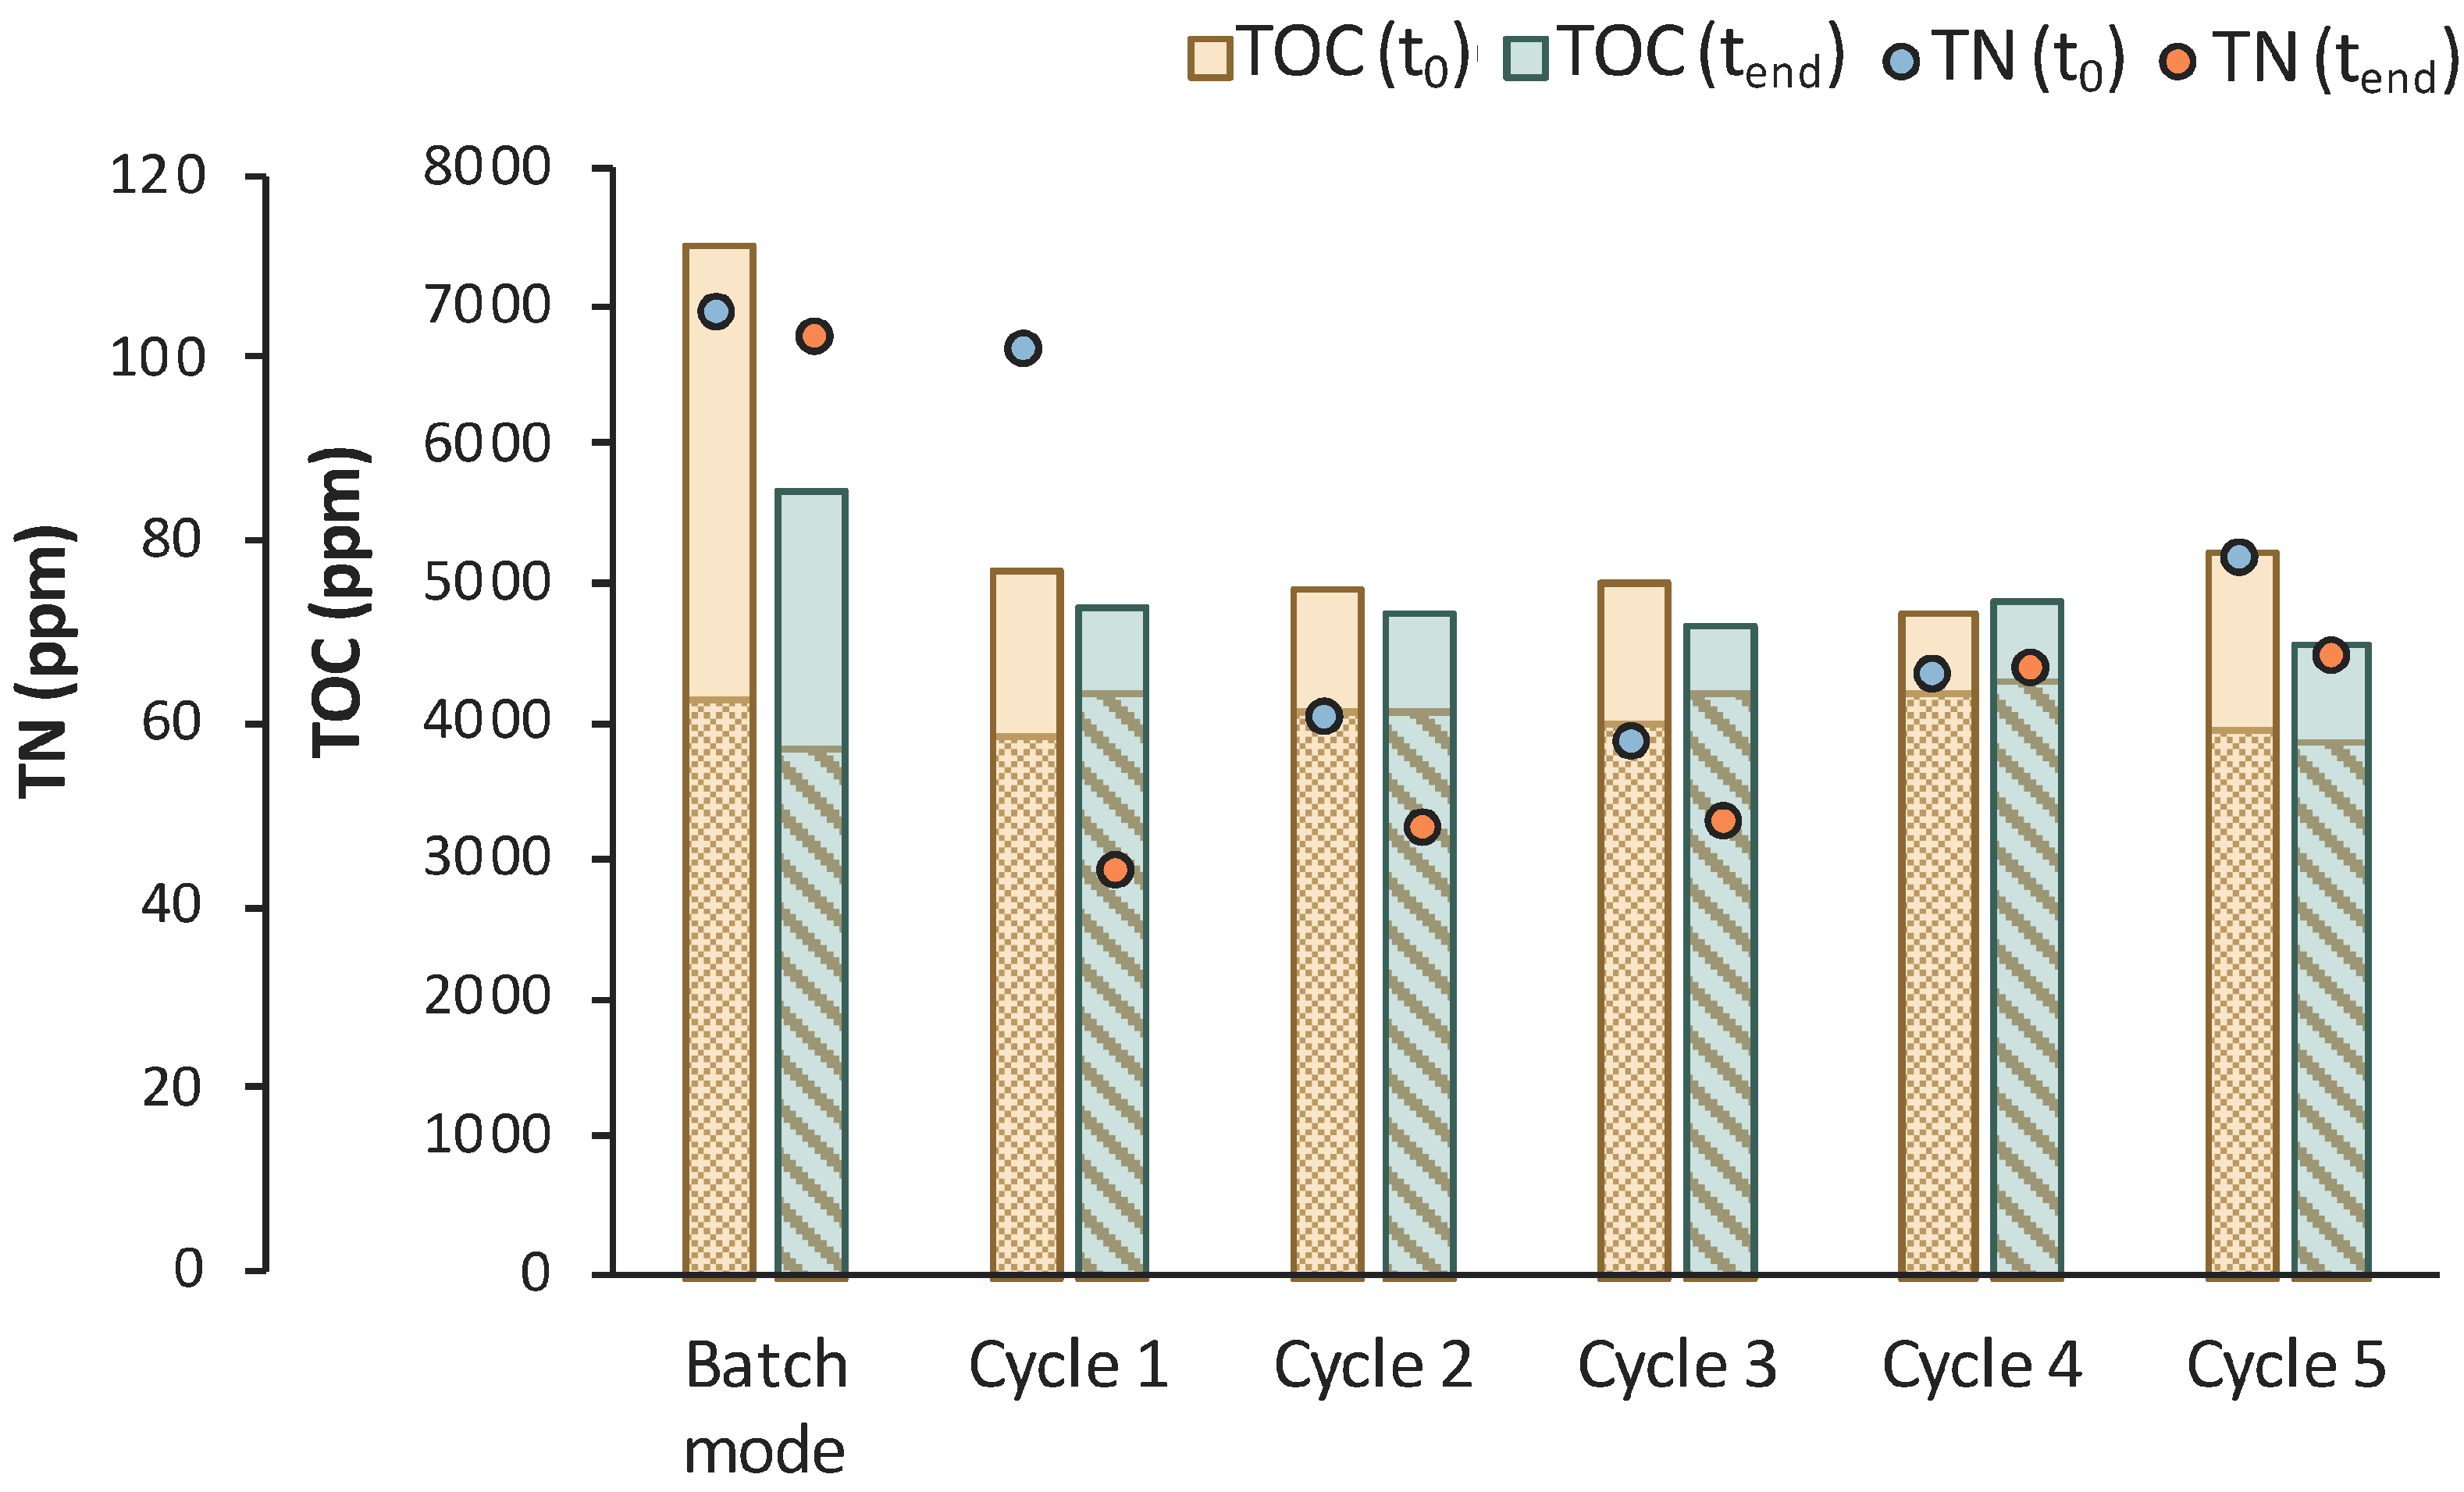
3.4. Semi-Continuous MBR Bio-Purification Process for LA—Comparative Assessment
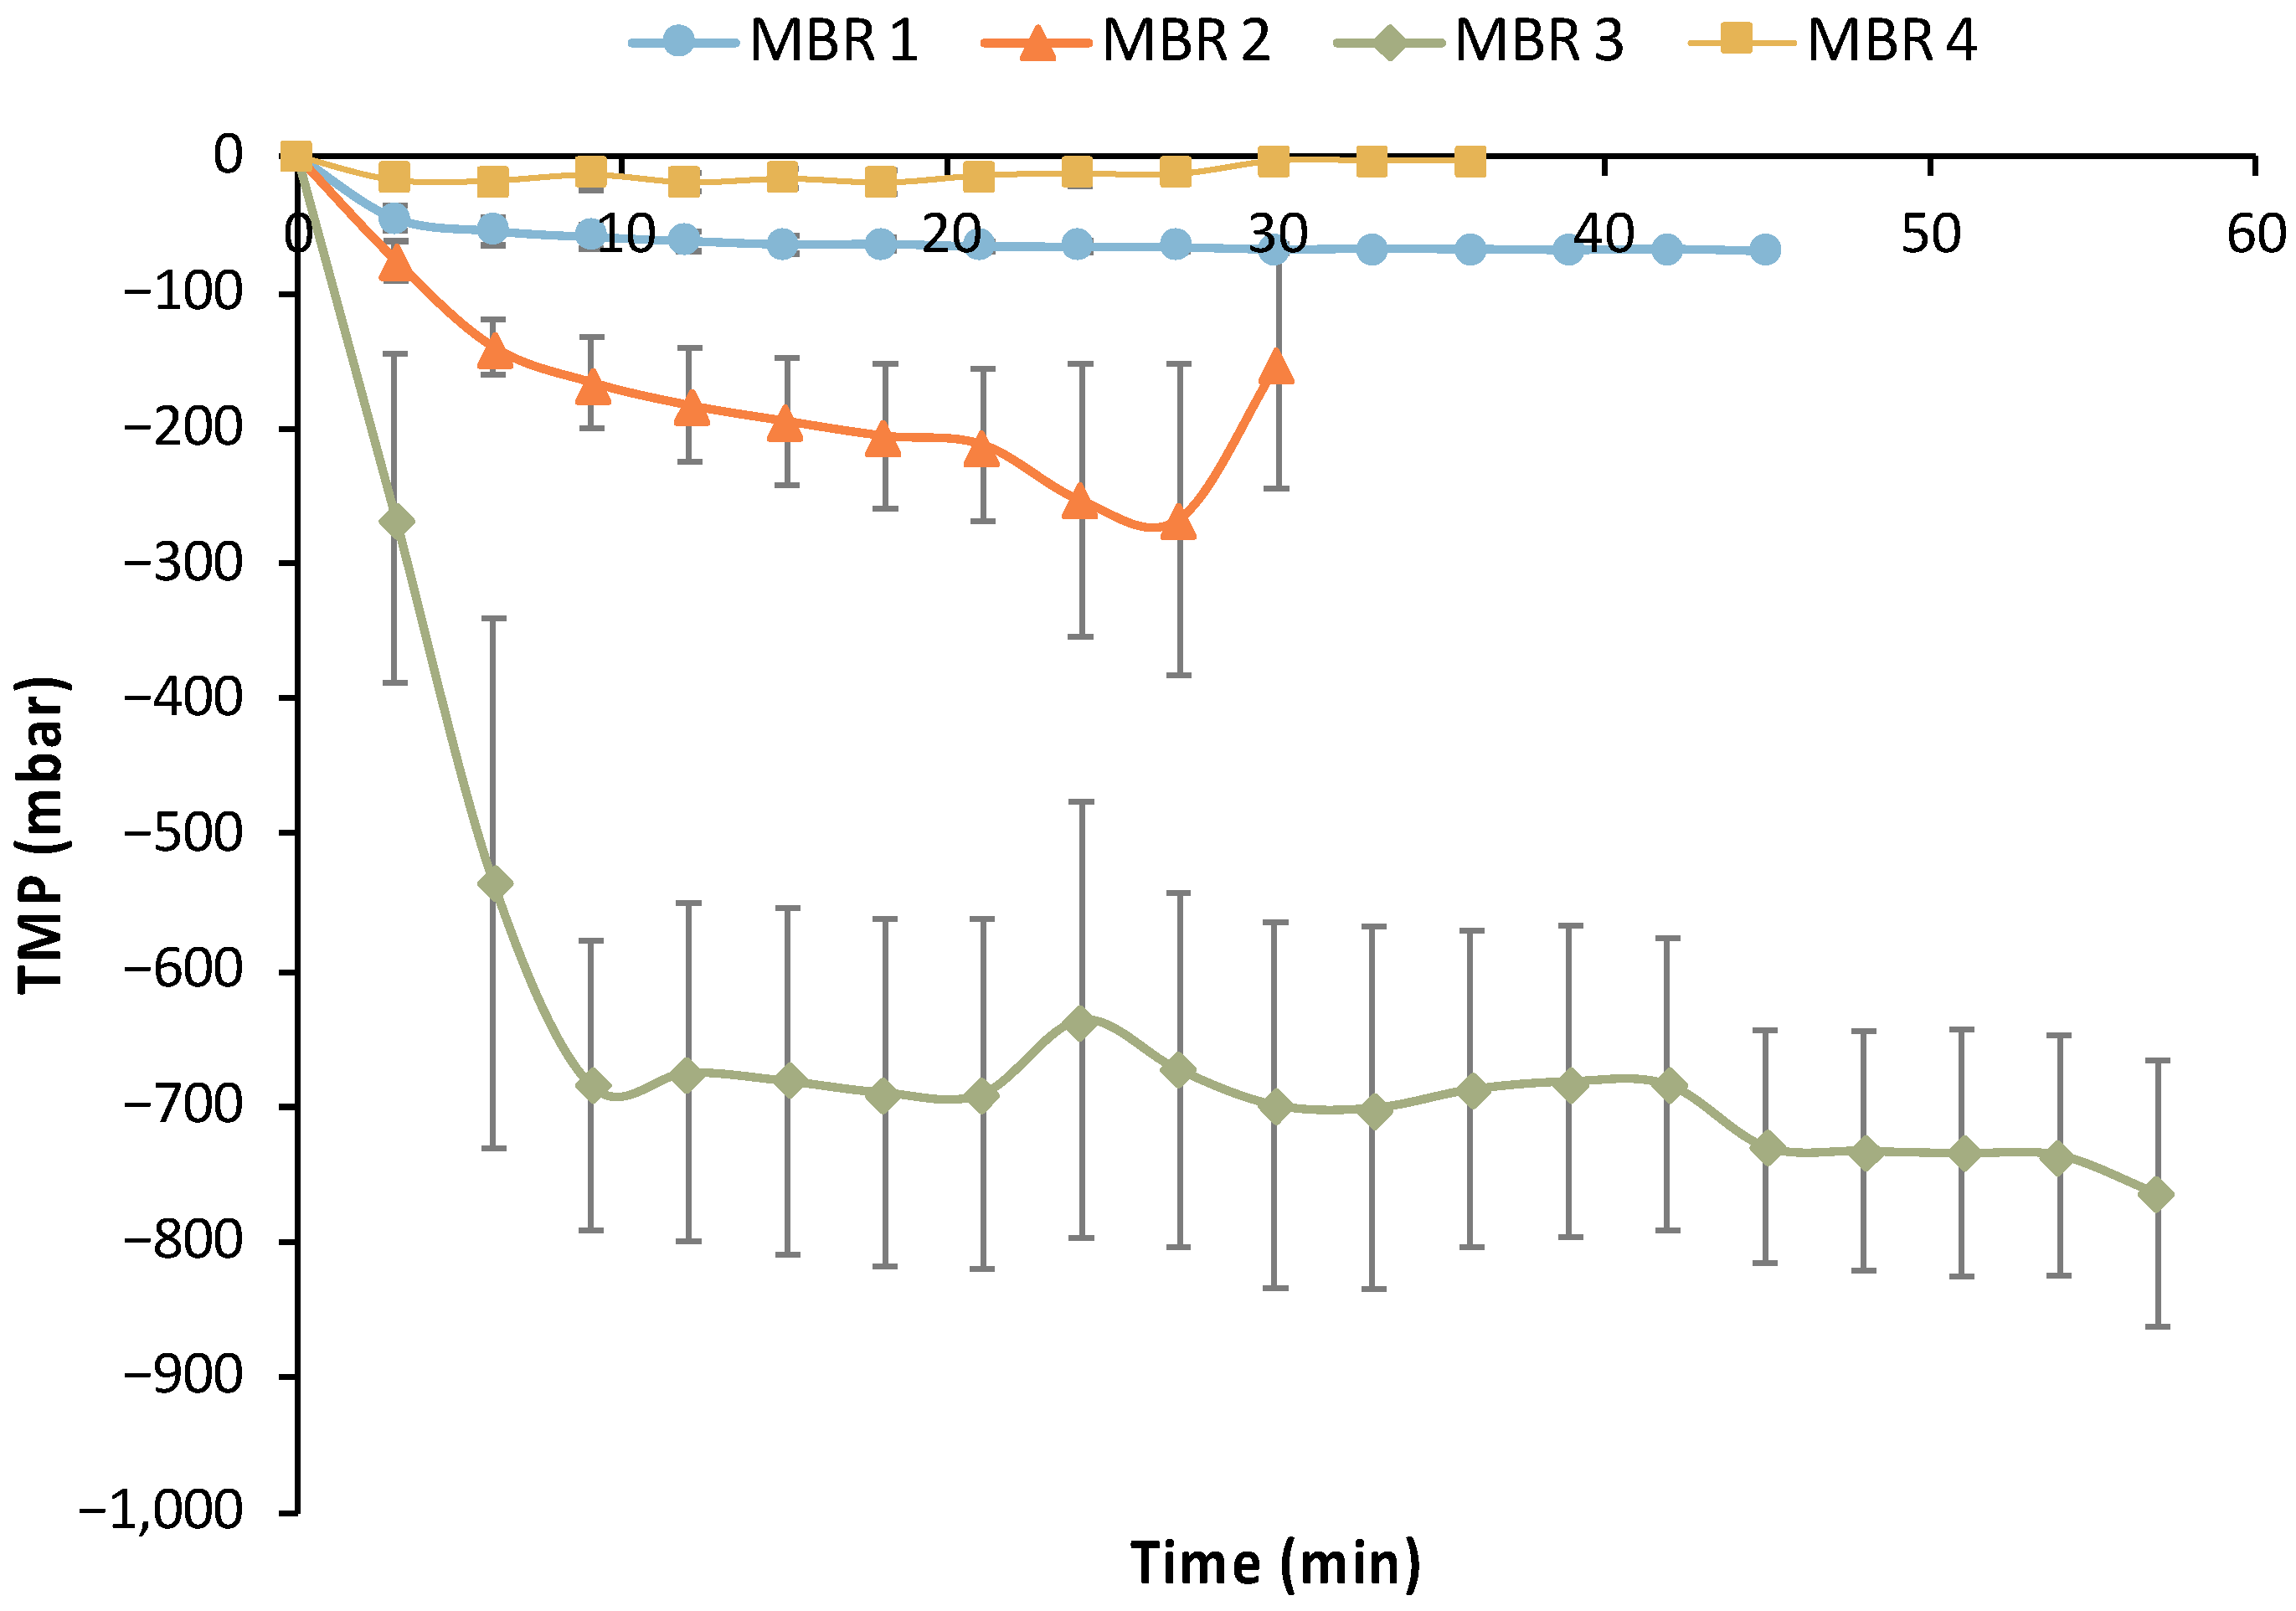
3.5. UF Membrane Performance
4. Conclusions
Supplementary Materials
Author Contributions
Funding
Institutional Review Board Statement
Informed Consent Statement
Data Availability Statement
Acknowledgments
Conflicts of Interest
References
- Feher, C.; Gazsó, Z.; Gál, B.; Kontra, A.; Barta, Z.; Réczey, K. Integrated process of arabinose biopurification and xylitol fermentation based on the diverse action of Candida boidinii. Chem. Biochem. Eng. Q. 2015, 29, 587–597. [Google Scholar] [CrossRef]
- Lange, L.; Connor, K.O.; Arason, S.; Bundgård-Jørgensen, U.; Canalis, A.; Carrez, D.; Gallagher, J.; Gøtke, N.; Huyghe, C.; Jarry, B. Developing a sustainable and circular bio-based economy in EU: By partnering across sectors, upscaling and using new knowledge faster, and for the benefit of climate, environment & biodiversity, and people & business. Front. Bioeng. Biotechnol. 2021, 8, 619066. [Google Scholar]
- Ojo, A.O.; de Smidt, O. Lactic Acid: A Comprehensive Review of Production to Purification. Processes 2023, 11, 688. [Google Scholar] [CrossRef]
- Cox, R.; Narisetty, V.; Castro, E.; Agrawal, D.; Jacob, S.; Kumar, G.; Kumar, D.; Kumar, V. Fermentative valorisation of xylose-rich hemicellulosic hydrolysates from agricultural waste residues for lactic acid production under non-sterile conditions. Waste Manag. 2023, 166, 336–345. [Google Scholar] [CrossRef]
- Papadopoulou, E.; González, M.C.; Reif, D.; Ahmed, A.; Tsapekos, P.; Angelidaki, I.; Harasek, M. Separation of lactic acid from fermented residual resources using membrane technology. J. Environ. Chem. Eng. 2023, 11, 110881. [Google Scholar] [CrossRef]
- Alvarado-Morales, M.; Kuglarz, M.; Tsapekos, P.; Angelidaki, I. Municipal biopulp as substrate for lactic acid production focusing on downstream processing. J. Environ. Chem. Eng. 2021, 9, 105136. [Google Scholar] [CrossRef]
- Anagnostopoulou, C.; Kontogiannopoulos, K.N.; Gaspari, M.; Morlino, M.S.; Assimopoulou, A.N.; Kougias, P.G. Valorization of household food wastes to lactic acid production: A response surface methodology approach to optimize fermentation process. Chemosphere 2022, 296, 133871. [Google Scholar] [CrossRef]
- Ahmad, A.; Banat, F.; Taher, H. A review on the lactic acid fermentation from low-cost renewable materials: Recent developments and challenges. Environ. Technol. Innov. 2020, 20, 101138. [Google Scholar] [CrossRef]
- Yankov, D. Fermentative lactic acid production from lignocellulosic feedstocks: From source to purified product. Front. Chem. 2022, 10, 823005. [Google Scholar] [CrossRef]
- Naser, A.Z.; Deiab, I.; Darras, B.M. Poly (lactic acid)(PLA) and polyhydroxyalkanoates (PHAs), green alternatives to petroleum-based plastics: A review. RSC Adv. 2021, 11, 17151–17196. [Google Scholar] [CrossRef] [PubMed]
- Agrawal, D.; Kumar, V. Recent progress on sugarcane-bagasse based lactic acid production: Technical advancements, potential and limitations. Ind. Crops Prod. 2023, 193, 116132. [Google Scholar] [CrossRef]
- Jantasee, S.; Kienberger, M.; Mungma, N.; Siebenhofer, M. Potential and assessment of lactic acid production and isolation—A review. J. Chem. Technol. Biotechnol. 2017, 92, 2885–2893. [Google Scholar] [CrossRef]
- Thygesen, A.; Tsapekos, P.; Alvarado-Morales, M.; Angelidaki, I. Valorization of municipal organic waste into purified lactic acid. Bioresour. Technol. 2021, 342, 125933. [Google Scholar] [CrossRef]
- González-Navarrete, C.; Sánchez-Ramírez, E.; Ramírez-Márquez, C.; Hernández, S.; Cossío-Vargas, E.; Segovia-Hernández, J.G. Innovative reactive distillation process for the sustainable purification of lactic acid. Ind. Eng. Chem. Res. 2021, 61, 621–637. [Google Scholar] [CrossRef]
- Li, C.; Gao, M.; Zhu, W.; Wang, N.; Ma, X.; Wu, C.; Wang, Q. Recent advances in the separation and purification of lactic acid from fermentation broth. Process Biochem. 2021, 104, 142–151. [Google Scholar] [CrossRef]
- Lee, H.D.; Lee, M.Y.; Hwang, Y.S.; Cho, Y.H.; Kim, H.W.; Park, H.B. Separation and purification of lactic acid from fermentation broth using membrane-integrated separation processes. Ind. Eng. Chem. Res. 2017, 56, 8301–8310. [Google Scholar] [CrossRef]
- Ecker, J.; Raab, T.; Harasek, M. Nanofiltration as key technology for the separation of LA and AA. J. Membr. Sci. 2012, 389, 389–398. [Google Scholar] [CrossRef]
- Ecker, J.; Schaffenberger, M.; Koschuh, W.; Mandl, M.; Böchzelt, H.; Schnitzer, H.; Harasek, M.A.; Steinmüller, H. Green biorefinery upper Austria–pilot plant operation. Sep. Purif. Technol. 2012, 96, 237–247. [Google Scholar] [CrossRef]
- Schaffenberger, M.S. Green Biorefinery—The Production, Isolation and Polishing of Amino Acids from Grass Silage Juice at Pilot and Laboratory Scale; Graz University of Technology: Graz, Austria, 2013. [Google Scholar]
- Nastouli, A.; Sweeney, J.; Harasek, M.; Karabelas, A.J.; Patsios, S.I. Development of a hybrid bio-purification process of lactic acid solutions employing an engineered E. coli strain in a membrane bioreactor. Biotechnol. Biofuels Bioprod. 2024, 17, 48. [Google Scholar] [CrossRef] [PubMed]
- Wang, D.; Zheng, Y.; Xu, L.; Fan, X.; Wei, N.; Jin, N.; Huang, S.; Xiao, Q.; Wu, Z. Engineered cells for selective detection and remediation of Hg2+ based on transcription factor MerR regulated cell surface displayed systems. Biochem. Eng. J. 2019, 150, 107289. [Google Scholar] [CrossRef]
- Cheng, H.; Wang, H.; Lv, J.; Jiang, M.; Lin, S.; Deng, Z. A novel method to prepare L-arabinose from xylose mother liquor by yeast-mediated biopurification. Microb. Cell Factories 2011, 10, 43. [Google Scholar] [CrossRef]
- Diaz, C.A.; Bennett, R.K.; Papoutsakis, E.T.; Antoniewicz, M.R. Deletion of four genes in Escherichia coli enables preferential consumption of xylose and secretion of glucose. Metab. Eng. 2019, 52, 168–177. [Google Scholar] [CrossRef]
- Liang, M.; Chen, M.; Liu, X.; Zhai, Y.; Liu, X.-W.; Zhang, H.; Xiao, M.; Wang, P. Bioconversion of D-galactose to D-tagatose: Continuous packed bed reaction with an immobilized thermostable L-arabinose isomerase and efficient purification by selective microbial degradation. Appl. Microbiol. Biotechnol. 2012, 93, 1469–1474. [Google Scholar] [CrossRef]
- Chauliac, D.; Pullammanappallil, P.; Ingram, L.; Shanmugam, K. Removing chiral contamination of lactate solutions by selective metabolism of the D-enantiomer. Biotechnol. Lett. 2015, 37, 2411–2418. [Google Scholar] [CrossRef]
- Chauliac, D.; Pullammanappallil, P.C.; Ingram, L.O.; Shanmugam, K. A combined thermochemical and microbial process for recycling polylactic acid polymer to optically pure l-lactic acid for reuse. J. Polym. Environ. 2020, 28, 1503–1512. [Google Scholar] [CrossRef]
- Sweeney, J.B.; Murphy, C.D.; McDonnell, K. Development of a bacterial propionate-biosensor for anaerobic digestion monitoring. Enzym. Microb. Technol. 2018, 109, 51–57. [Google Scholar] [CrossRef]
- Papadopoulou, E.; Vance, C.; Vallespin, P.S.R.; Tsapekos, P.; Angelidaki, I. Saccharina latissima, candy-factory waste, and digestate from full-scale biogas plant as alternative carbohydrate and nutrient sources for lactic acid production. Bioresour. Technol. 2023, 380, 129078. [Google Scholar] [CrossRef]
- Nastouli, A.; Tsirigka, A.; Harasek, M.; Karabelas, A.J.; Patsios, S.I. The Effect of Heat Sterilization on Key Filtration Performance Parameters of a Commercial Polymeric (PVDF) Hollow-Fiber Ultrafiltration Membrane. Membranes 2022, 12, 725. [Google Scholar] [CrossRef]
- Sun, H.; Levenfors, J.J.; Brandt, C.; Schnürer, A. Characterisation of meropenem-resistant Bacillus sp. FW 1 isolated from biogas digestate. Environ. Microbiol. Rep. 2023, 16, e13217. [Google Scholar] [CrossRef]
- Pan, Z.; Qi, G.; Andriamanohiarisoamanana, F.J.; Yamashiro, T.; Iwasaki, M.; Nishida, T.; Tangtaweewipat, S.; Umetsu, K. Potential of anaerobic digestate of dairy manure in suppressing soil-borne plant disease. Anim. Sci. J. 2018, 89, 1512–1518. [Google Scholar] [CrossRef]
- Setlow, P. Spores of Bacillus subtilis: Their resistance to and killing by radiation, heat and chemicals. J. Appl. Microbiol. 2006, 101, 514–525. [Google Scholar] [CrossRef] [PubMed]
- Cho, W.-I.; Chung, M.-S. Bacillus spores: A review of their properties and inactivation processing technologies. Food Sci. Biotechnol. 2020, 29, 1447–1461. [Google Scholar] [CrossRef] [PubMed]
- Lamsa, A.; Liu, W.T.; Dorrestein, P.C.; Pogliano, K. The Bacillus subtilis cannibalism toxin SDP collapses the proton motive force and induces autolysis. Mol. Microbiol. 2012, 84, 486–500. [Google Scholar] [CrossRef] [PubMed]
- Bridier, A.; Meylheuc, T.; Briandet, R. Realistic representation of Bacillus subtilis biofilms architecture using combined microscopy (CLSM, ESEM and FESEM). Micron 2013, 48, 65–69. [Google Scholar] [CrossRef]


| Feedstock Description | Initial Feedstock | LA (g/L) | Acetic Acid (AA) (g/L) | Sugars (g/L) | Reference |
|---|---|---|---|---|---|
| UF permeate | Grass silage leachate | 20.40 | 3.31 | 11.00 | [17] |
| UF permeate | Grass silage leachate | 28.00 | 4.98 | 8.90 | [19] |
| UF permeate | Bio-pulp | 15.40 | 1.01 | n.d. | [6] |
| NF permeate | Grass silage leachate | 33.80 | 7.81 | 0.17 | [18] |
| NF permeate | Bio-pulp | 14.70 | 1.02 | - 1 | [6] |
| Compound | Initial Feed (g/L) | Feedstock F1 (g/L) | Feedstock F2 (g/L) |
|---|---|---|---|
| LA (g/L) | 29.04 | ~10 | ~10 |
| Maltose (g/L) | 35.60 | ~2.0 | ~0.5 |
| AA (g/L) | 0.55 | ~3.0 | ~6.0 |
| Description | MBR 1 | MBR 2 | MBR 3 | MBR 4 | |||
|---|---|---|---|---|---|---|---|
| General conditions | Feedstock type | Feedstock F1 | Feedstock F1 | Feedstock F1 | Feedstock F2 | ||
| Nutrients in stage 1 (batch) | 25% of M9 solution | 50% of M9 solution | 50% of M9 solution | 100% of M9 solution + trace elements | |||
| Nutrients in stage 2 (semi-continuous) | 25% of M9 solution | 50% of M9 solution | 50% of M9 solution | 100% of M9 solution + trace elements | |||
| Stage 1 (Batch mode) | Fermentation time | t = 46 h | t = 28 h | t = 24 h | t = 64 h | ||
| Stage 2 (Semi-continuous mode) | Cycle 1 | 1.1 | Effluent/Feed volume | 200 mL | 200 mL | 300 mL | 230 mL |
| 1.2 | Fermentation time | t = 4 h | t = 14 h | t = 24 h | t = 4 h | ||
| Cycle 2 | 2.1 | Effluent/Feed volume | 200 mL | 200 mL | 300 mL | 230 mL | |
| 2.2 | Fermentation time | t = 4 h | t = 3 h | t = 24 h | t = 4 h | ||
| Cycle 3 | 3.1 | Effluent/Feed volume | 200 mL | 200 mL | 225 mL | 230 mL | |
| 3.2 | Fermentation time | t = 4 h | t = 22 h | t = 18 h | t = 4 h | ||
| Cycle 4 | 4.1 | Effluent/Feed volume | 300 mL | 200 mL | 80 mL | 300 mL | |
| 4.2 | Fermentation time | t = 12 h | t = 48 h | t = 4 h | t = 12 h | ||
| Cycle 5 | 5.1 | Effluent/Feed volume | 120 mL | - | 80 mL | 250 mL | |
| 5.2 | Fermentation time | t = 7h | - | t = 4 h | t = 4 h | ||
| Cycle 6 | 6.1 | Effluent/Feed volume | 300 mL | - | 200 mL | - | |
| 6.2 | Fermentation time | t = 7h | - | t = 16 h | - | ||
| Cycle 7 | 7.1 | Effluent/Feed volume | - | - | 100 mL | - | |
| 7.2 | Fermentation time | - | - | t = 24 h | - | ||
| Cycle 8 | 8.1 | Effluent/Feed volume | - | - | 10 mL | - | |
| 8.2 | Fermentation time | - | - | t = 24 h | - | ||
| Minimal Media M9 | Feedstock F1 | t (h) | OD600 | Maltose (g/L) | Glucose (g/L) | AA (g/L) | LA (g/L) | Comments |
|---|---|---|---|---|---|---|---|---|
| 80% | 20% | 0 | 0.165 ± 0.009 | 0.43 ± 0.01 | 0.66 ± 0.01 | 1.22 ± 0.02 | 13.68 ± 0.17 | |
| 24 | 1.209 ± 0.012 | 0.10 ± 0.00 | 0.00 ± 0.00 | 0.82 ± 0.00 | 13.71 ± 0.04 | |||
| 60% | 40% | 0 | 0.172 ± 0.003 | 0.98 ± 0.01 | 0.56 ± 0.00 | 1.81 ± 0.02 | 13.39 ± 0.09 | |
| 24 | 1.035 ± 0.008 | 0.50 ± 0.01 | 0.04 ± 0.02 | 1.76 ± 0.02 | 13.27 ± 0.21 | |||
| 40% | 60% | 0 | 0.179 ± 0.005 | 1.52 ± 0.05 | 0.44 ± 0.00 | 2.44 ± 0.06 | 13.16 ± 0.38 | |
| 24 | 1.031 ± 0.011 | 0.47 ± 0.01 | 0.06 ± 0.00 | 2.66 ± 0.07 | 12.86 ± 0.32 | |||
| 20% | 80% | 0 | 0.151 ± 0.001 | 2.09 ± 0.03 | 0.36 ± 0.00 | 2.98 ± 0.02 | 12.50 ± 0.10 | |
| 24 | 0.876 ± 0.001 | 1.09 ± 0.14 | 0.04 ± 0.01 | 3.71 ± 0.01 | 12.25 ± 0.01 | |||
| 48 | 1.050 ± 0.009 | 0.73 ± 0.00 | 0.00 ± 0.01 | 4.10 ± 0.02 | 12.39 ± 0.06 | |||
| 0% | 100% | 0 | 0.171 ± 0.003 | 2.64 ± 0.04 | 0.22 ± 0.01 | 3.65 ± 0.14 | 12.41 ± 0.42 | Inoculated from 40% M9:60% biological feedstock |
| 24 | 0.855 ± 0.010 | 0.82 ± 0.05 | 0.00 ± 0.00 | 3.75 ± 0.04 | 12.43 ± 0.06 | |||
| 48 | 1.054 ± 0.012 | 0.60 ± 0.02 | 0.00 ± 0.00 | 3.00 ± 0.01 | 12.16 ± 0.01 | |||
| 24 | 0.880 ± 0.010 | 0.69 ± 0.01 | 0.00 ± 0.00 | 4.14 ± 0.04 | 12.49 ± 0.11 | Inoculated from 20% M9:80% biological feedstock | ||
| 24 | 1.210 ± 0.015 | 0.60 ± 0.01 | 0.00 ± 0.00 | 4.03 ± 0.02 | 12.31 ± 0.01 | Inoculated from 100% biological feedstock |
| MBR Experiment | Second Stage Duration | Max |TMP| (mbar) | Max AA Consumption Rate (g/L/h) | Max Maltose Consumption Rate (g/L/h) | Net Recovery Rate (mL/h) | Max Maltose Removal (%) | Max AA Removal (%) |
|---|---|---|---|---|---|---|---|
| 1 | 96 | 72 | 0.058 | 0.065 | 13.75 | 67.3 | 25.0 |
| 2 | 87 | 440 | 0.081 | 0.063 | 9.19 | 100.0 | 60.9 |
| 3 | 138 | 946 | 0.040 | 0.040 | 10.04 | 66.0 | 33.7 |
| 4 | 27 | 45 | 0.587 | n.a. | 44.29 | 100.0 | 100.0 |
Disclaimer/Publisher’s Note: The statements, opinions and data contained in all publications are solely those of the individual author(s) and contributor(s) and not of MDPI and/or the editor(s). MDPI and/or the editor(s) disclaim responsibility for any injury to people or property resulting from any ideas, methods, instructions or products referred to in the content. |
© 2024 by the authors. Licensee MDPI, Basel, Switzerland. This article is an open access article distributed under the terms and conditions of the Creative Commons Attribution (CC BY) license (https://creativecommons.org/licenses/by/4.0/).
Share and Cite
Nastouli, A.; Moschona, A.; Bizirtsakis, P.A.; Sweeney, J.; Angelidaki, I.; Harasek, M.; Karabelas, A.J.; Patsios, S.I. A Novel Bio-Purification Process Employing an Engineered E. coli Strain for Downstream Processing of Lactic Acid Solutions from the Fermentation of Agro-Industrial by-Products. Bioengineering 2024, 11, 412. https://doi.org/10.3390/bioengineering11050412
Nastouli A, Moschona A, Bizirtsakis PA, Sweeney J, Angelidaki I, Harasek M, Karabelas AJ, Patsios SI. A Novel Bio-Purification Process Employing an Engineered E. coli Strain for Downstream Processing of Lactic Acid Solutions from the Fermentation of Agro-Industrial by-Products. Bioengineering. 2024; 11(5):412. https://doi.org/10.3390/bioengineering11050412
Chicago/Turabian StyleNastouli, Alexandra, Alexandra Moschona, Panagiotis A. Bizirtsakis, Joseph Sweeney, Irini Angelidaki, Michael Harasek, Anastasios J. Karabelas, and Sotiris I. Patsios. 2024. "A Novel Bio-Purification Process Employing an Engineered E. coli Strain for Downstream Processing of Lactic Acid Solutions from the Fermentation of Agro-Industrial by-Products" Bioengineering 11, no. 5: 412. https://doi.org/10.3390/bioengineering11050412