
Effect of Deep Drying and Torrefaction Temperature on Proximate, Ultimate Composition, and Heating Value of 2-mm Lodgepole Pine (Pinus contorta) Grind


Abstract
:1. Introduction
1.1. Biomass Limitations for Solid and Liquid Fuel Applications
1.2. Dry Torrefaction
1.3. Deep Drying and Torrefaction Parameters
1.4. Objectives
2. Materials and Methods
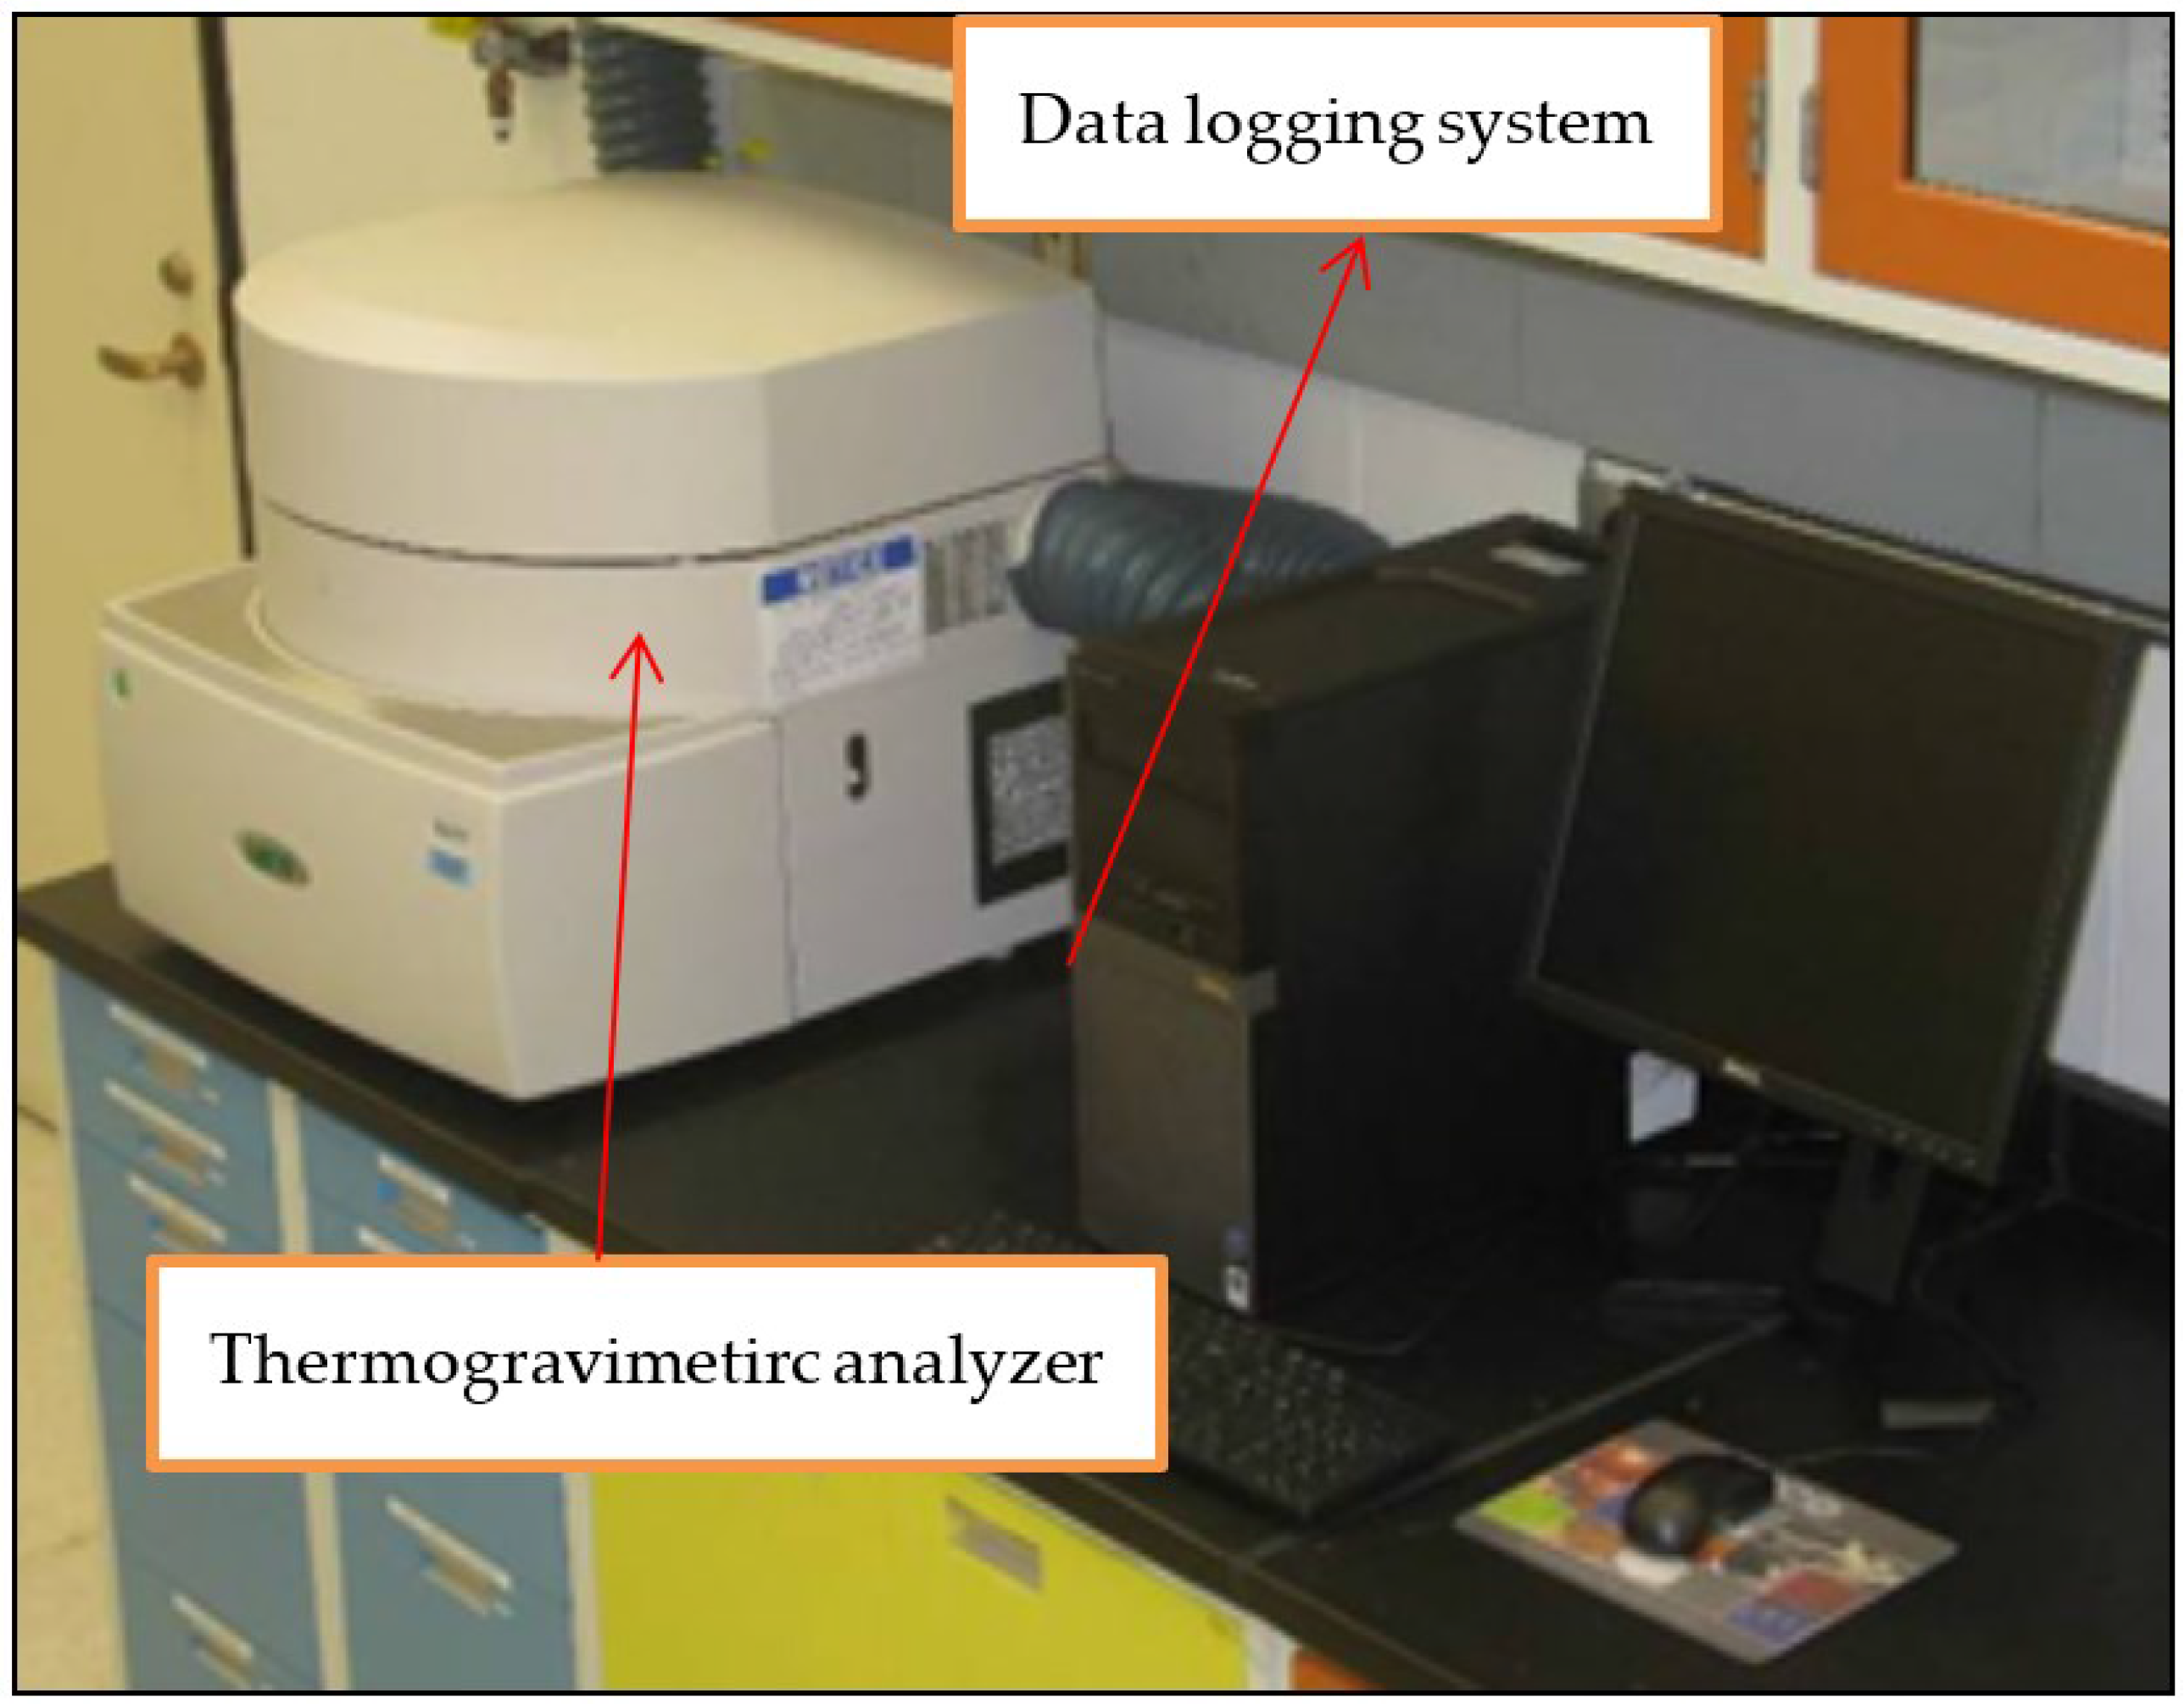
2.1. Torrefaction Studies Using the Thermogravimetric Analyzer
2.2. Data Analysis: Analysis of Variance and Multiple Regression Analysis
3. Results
3.1. Proximate, Ultimate Composition and Higher Heating Values
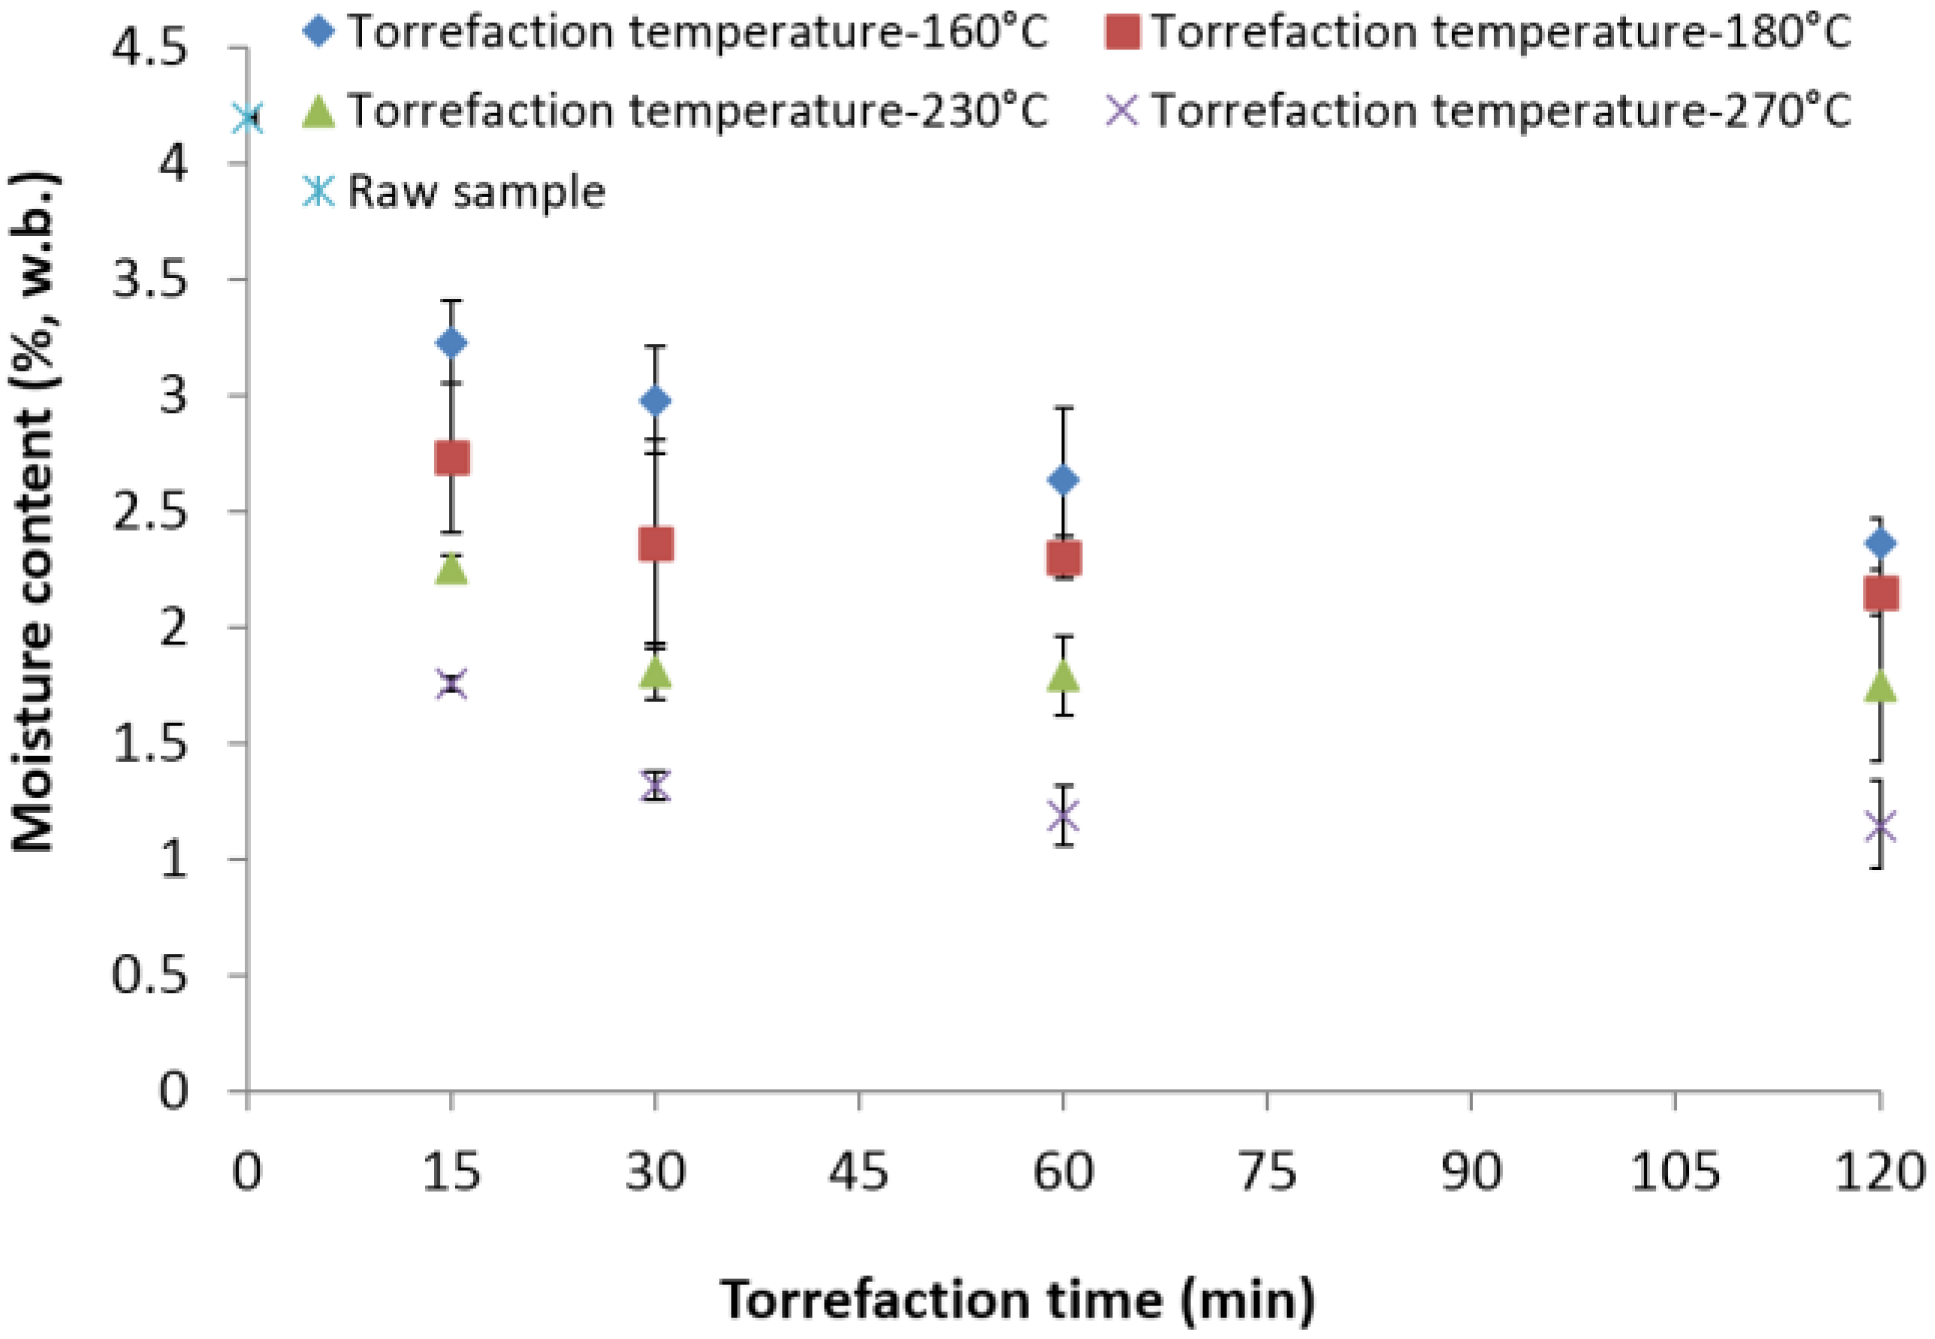
3.2. Moisture Content
3.3. Volatile Content
3.4. Ash Content
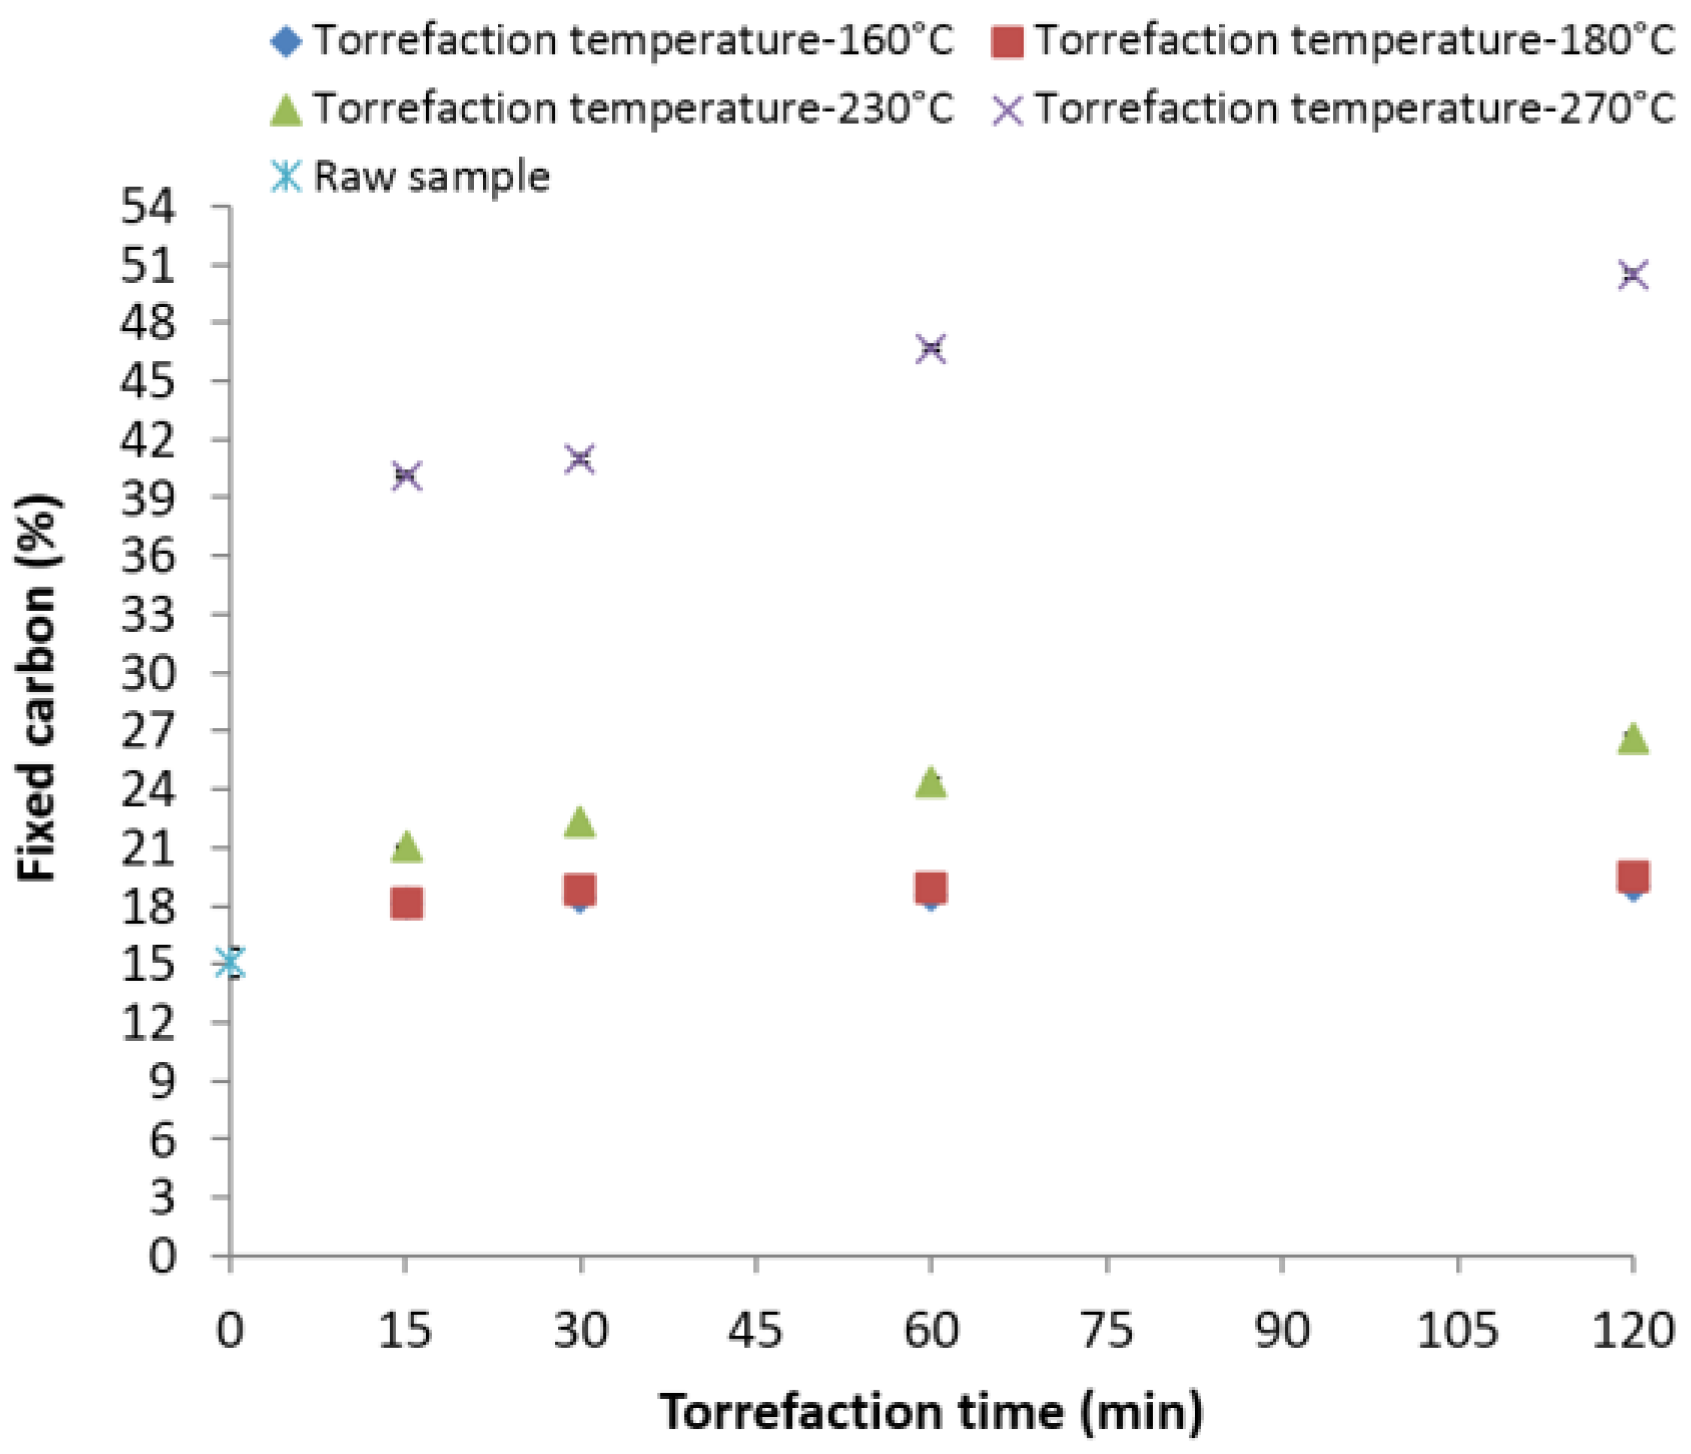
3.5. Fixed Carbon
3.6. Ultimate Composition
3.7. Carbon (%)
3.8. Hydrogen (%)
3.9. Oxygen (%)
3.10. Nitrogen and Sulfur (%)
3.11. H/C and O/C Ratios
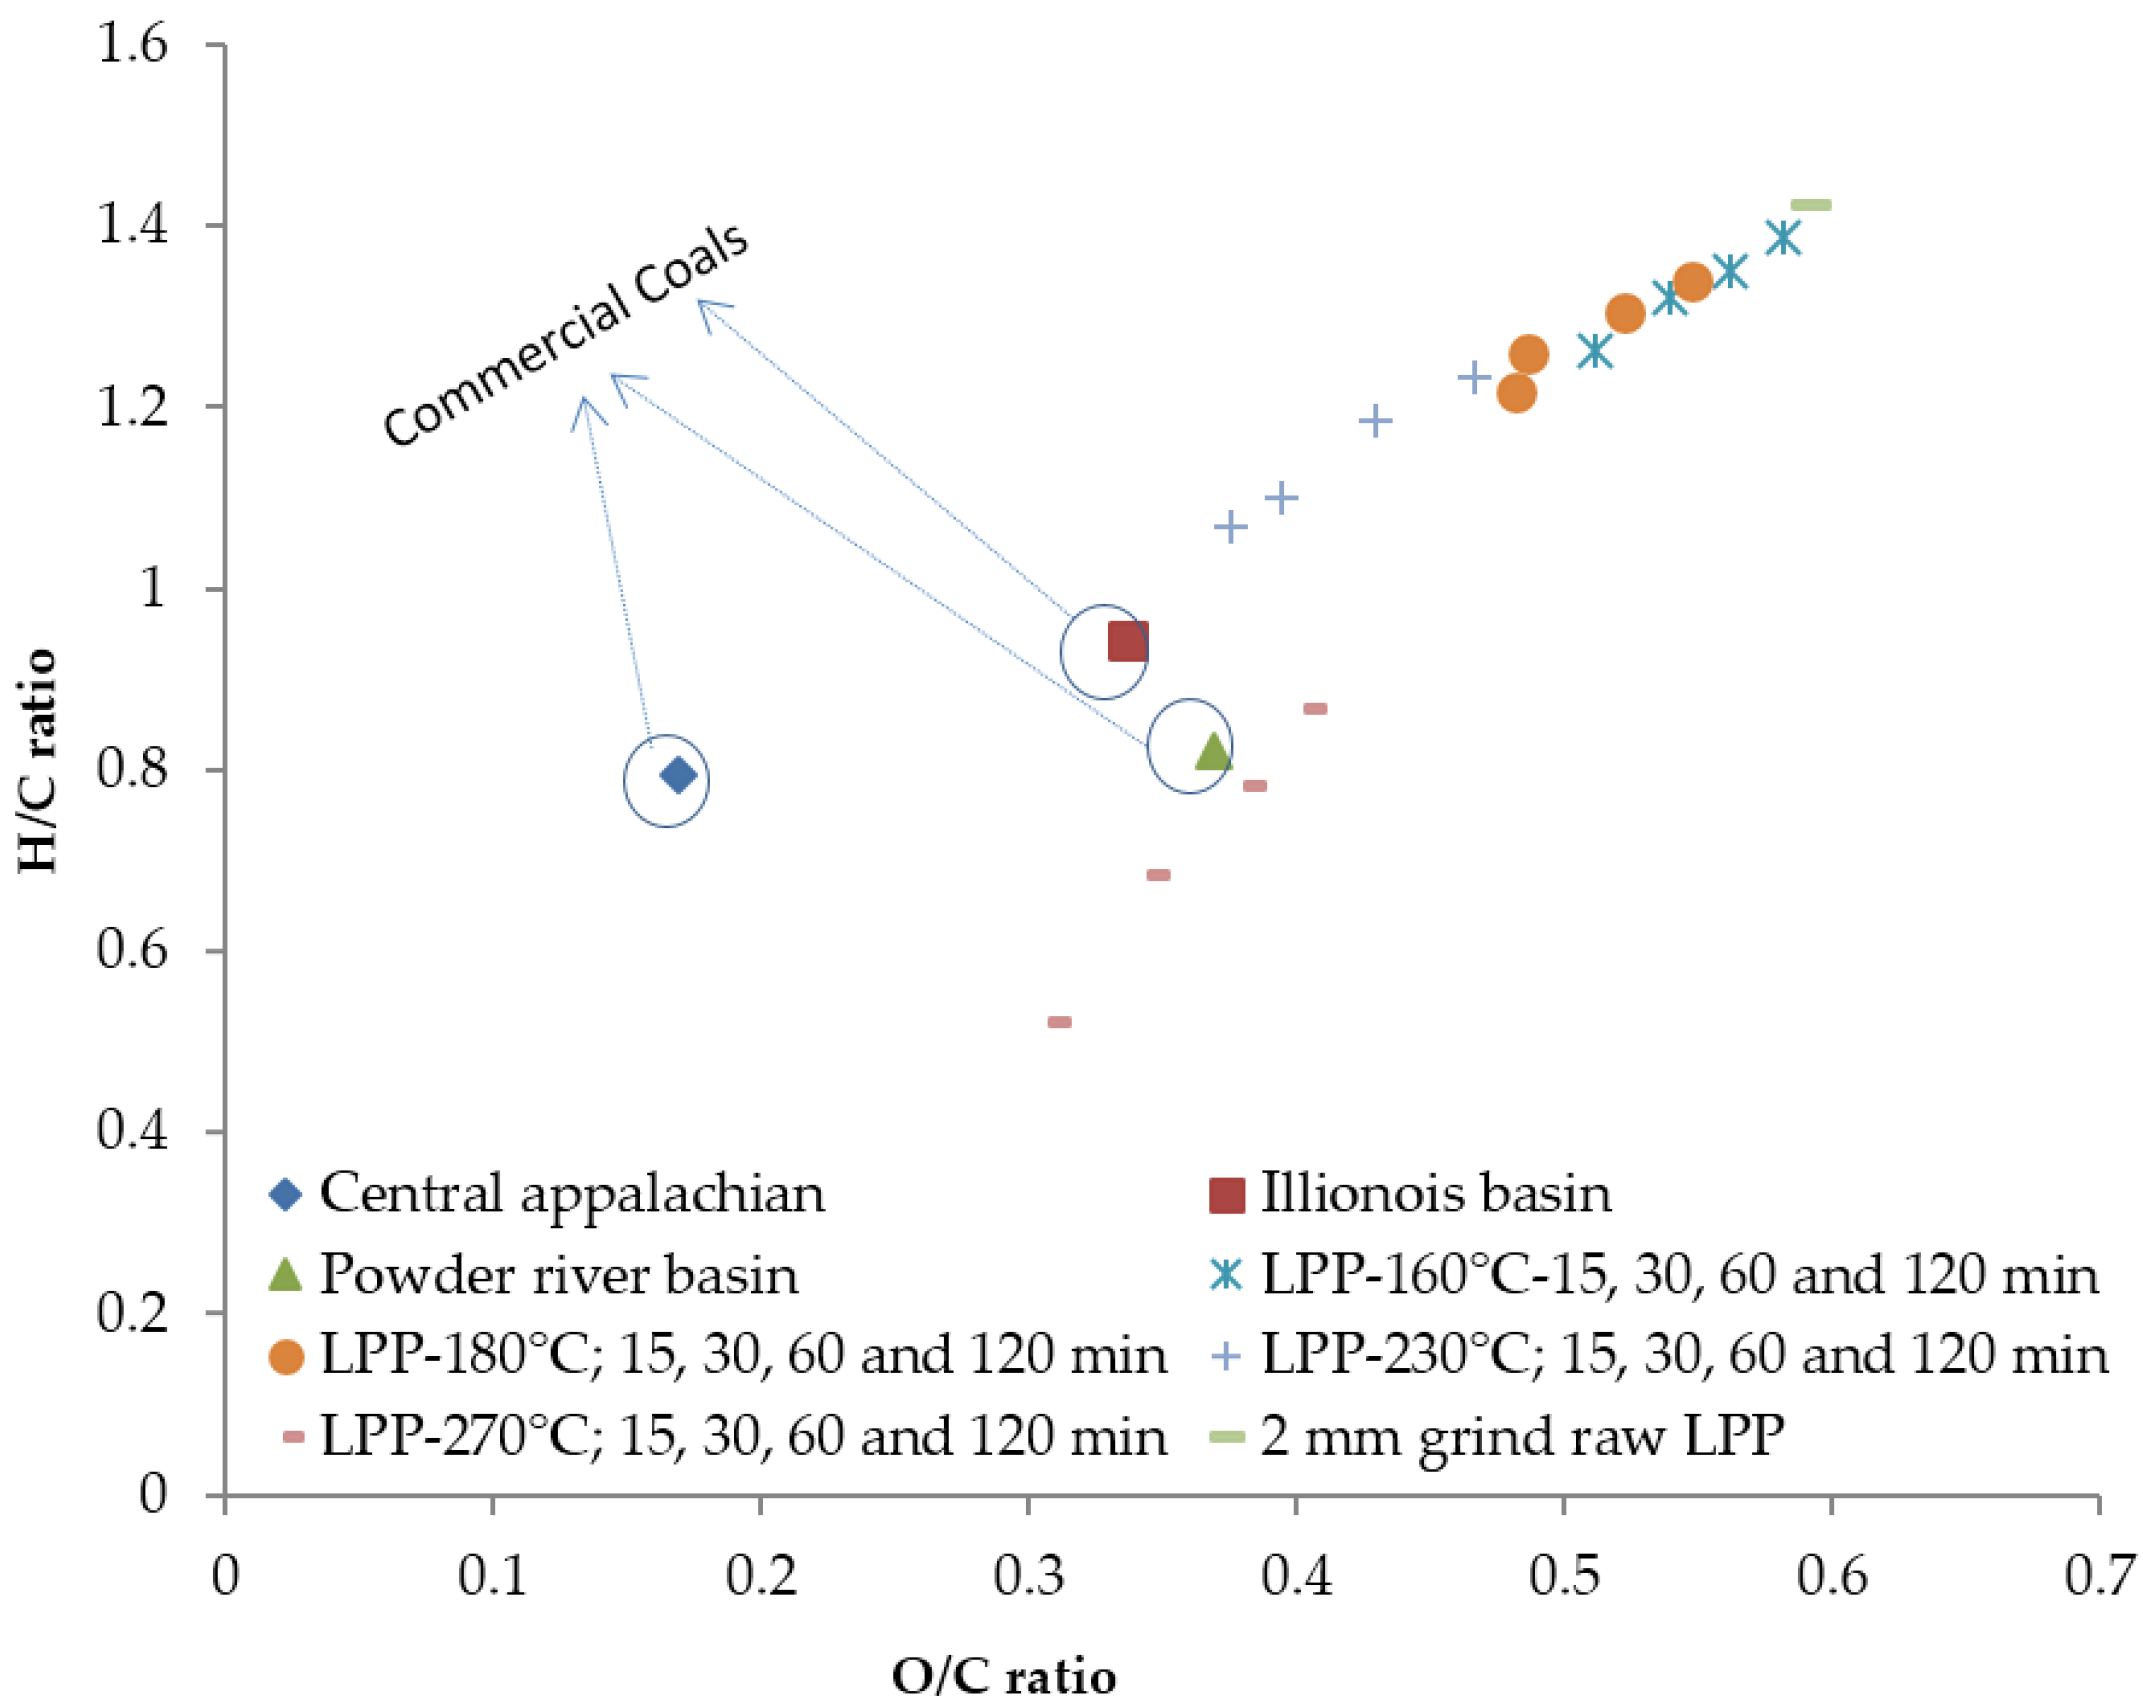
3.12. van Krevelen Diagram
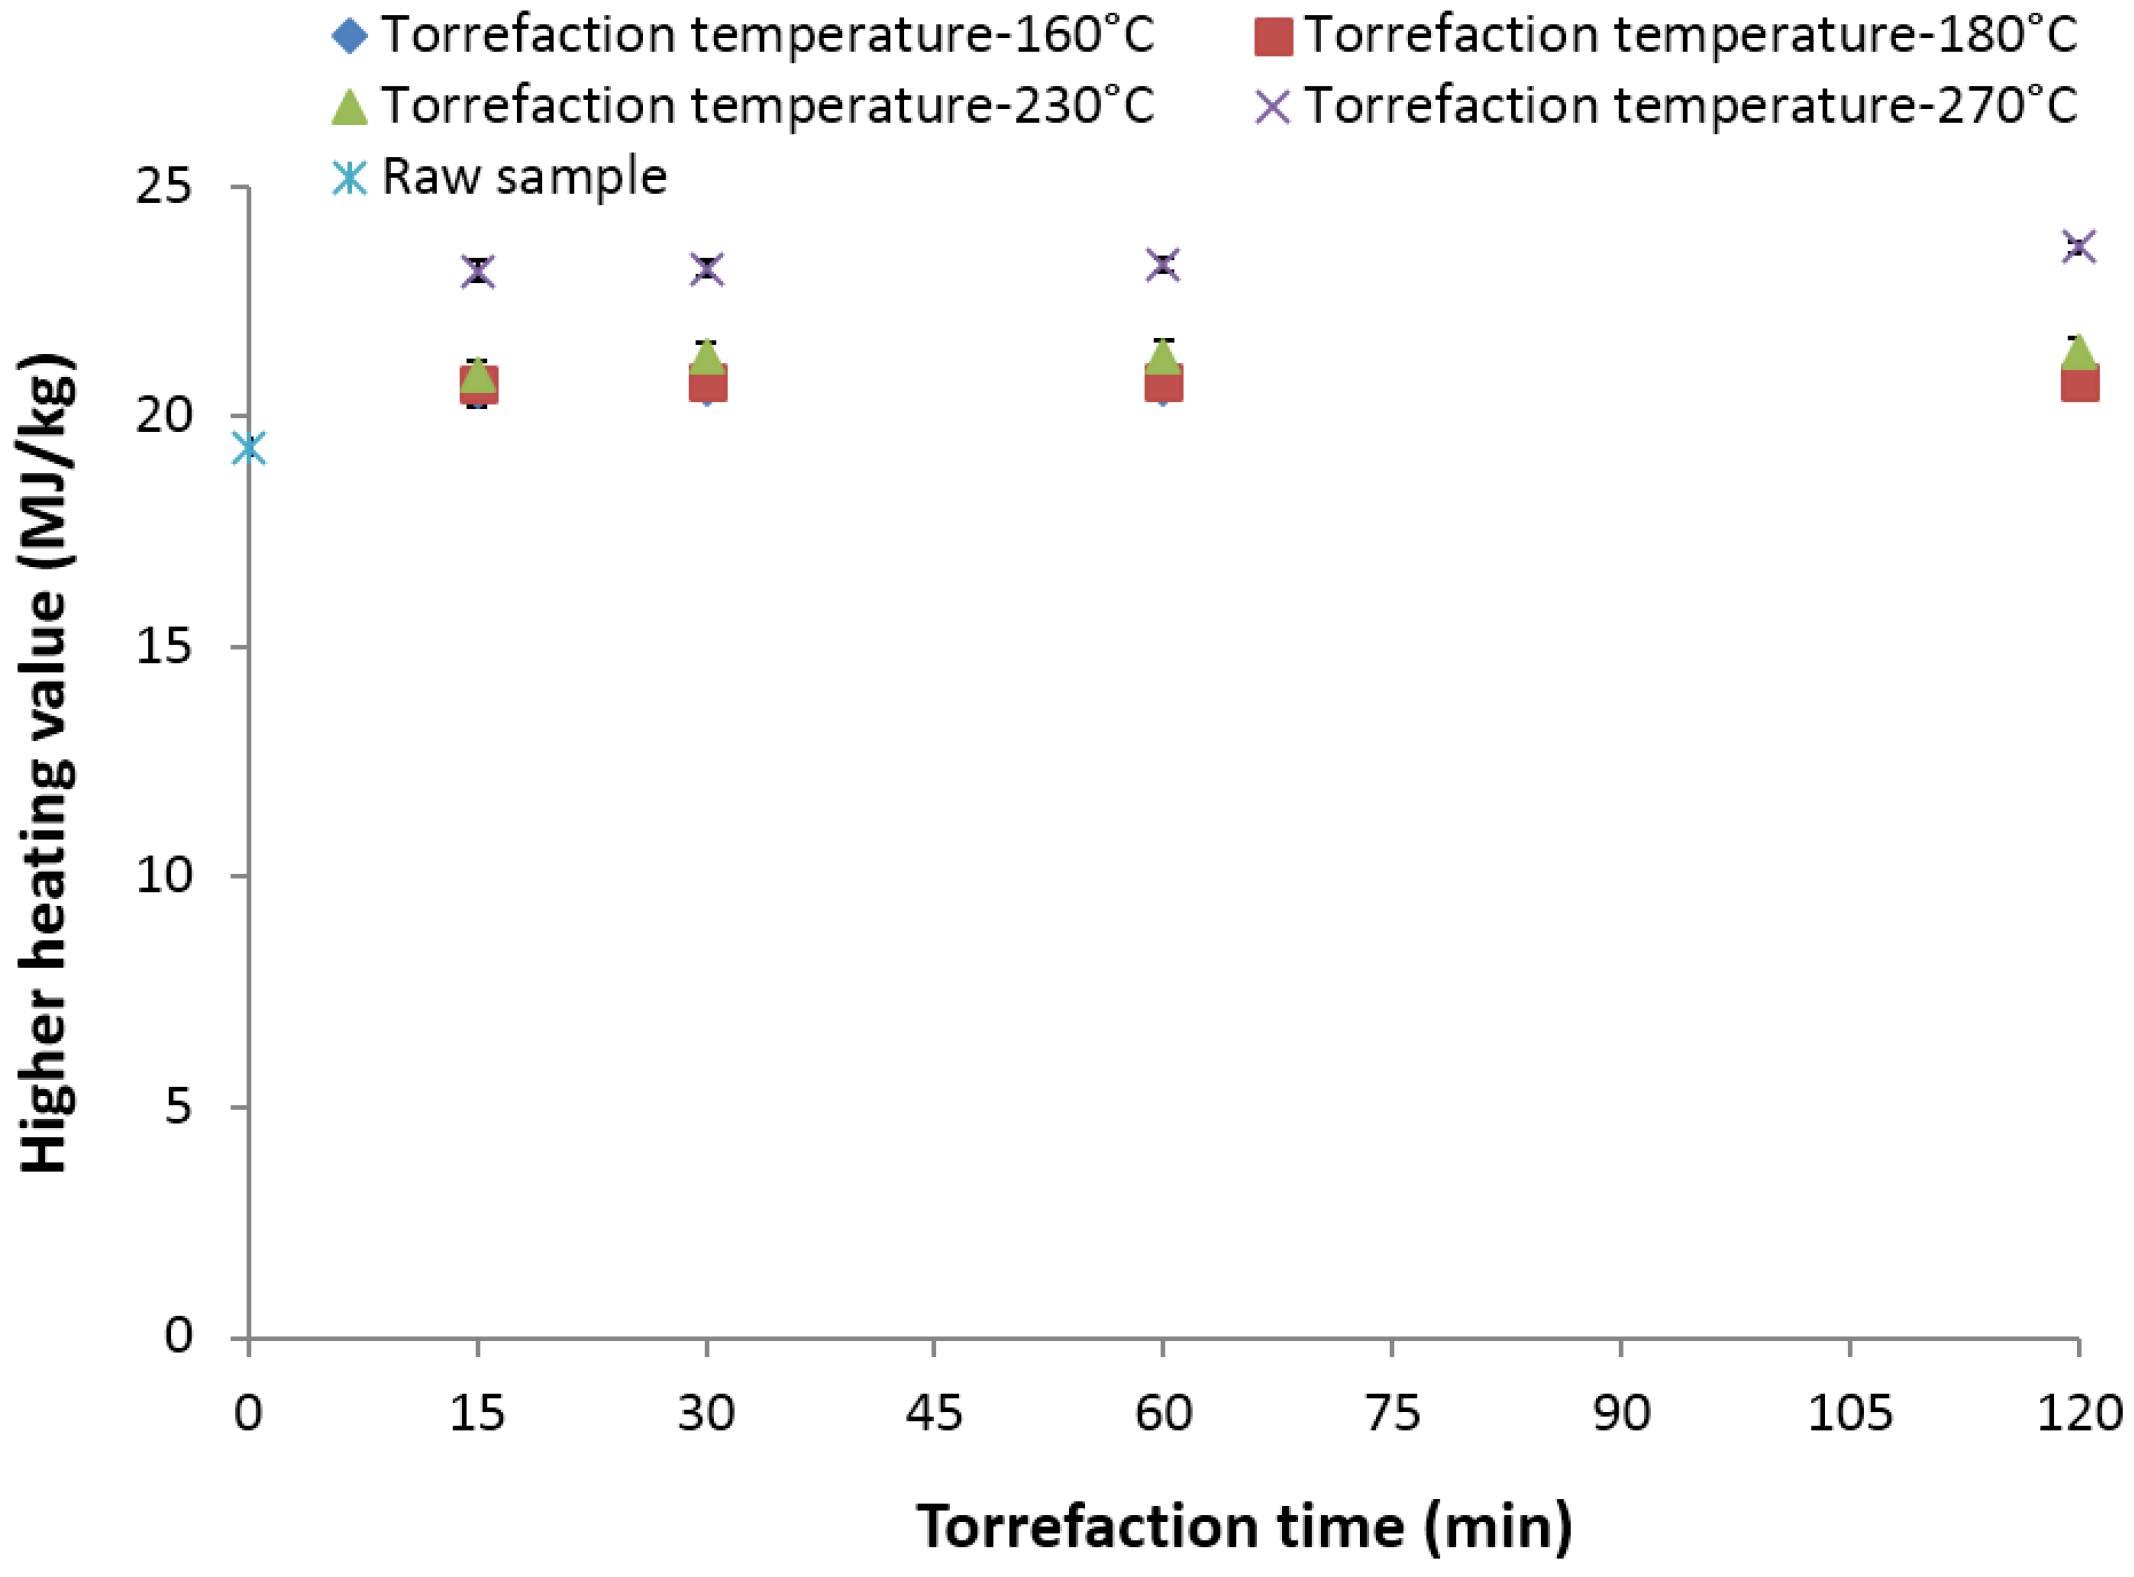
3.13. Higher Heating Value (MJ/kg)
4. Analysis of Variance and Multiple Regression Models
5. Discussion
6. Conclusions
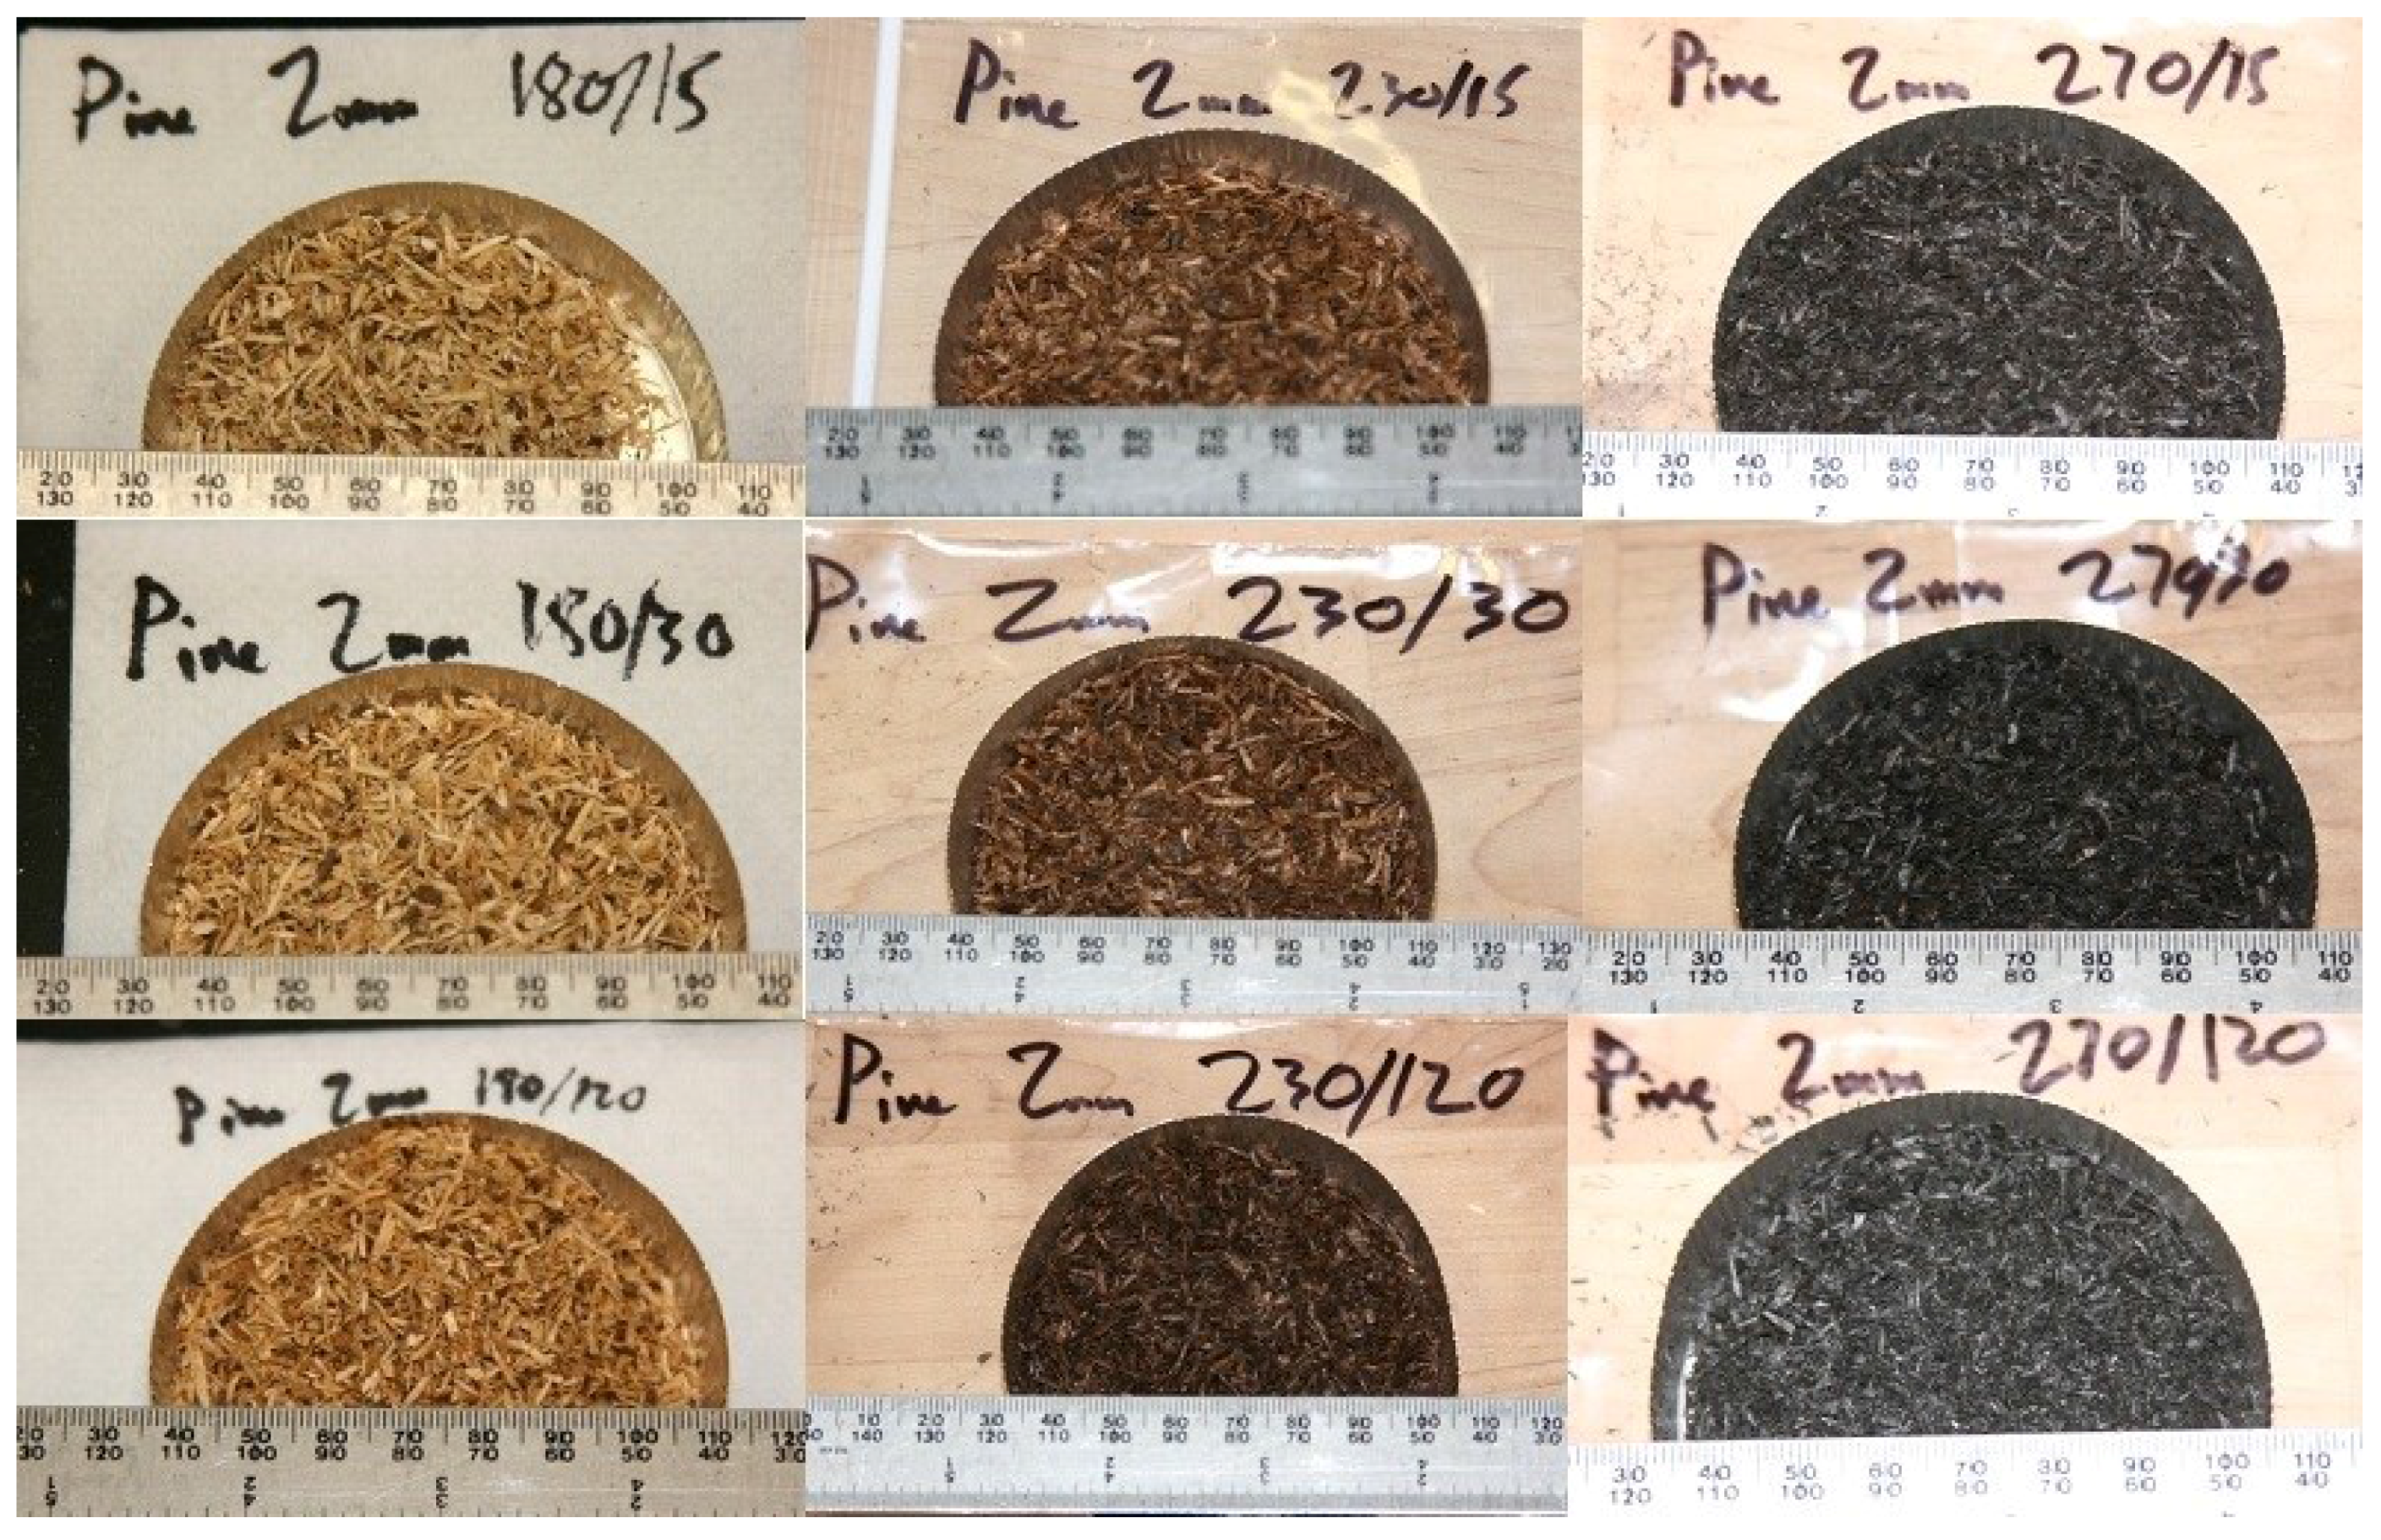
- The changes in proximate and ultimate composition were marginal at deep drying temperatures of 160 and 180 °C, whereas at torrefaction temperatures of 230 and 270 °C, the changes were significant.
- Increasing the torrefaction temperature to 270 °C and the residence time to 30 min significantly decreases the moisture content, hydrogen content, and oxygen content and increases the carbon and heating value.
- At 270 °C and a 120-min residence time, carbon content increases to 69.86%, while oxygen and hydrogen content decrease to 28.24% and 3%, whereas the volatile content decreases to 45.81%.
- The H/C and O/C ratios of the raw samples are about 1.42 and 0.59, whereas at 270 °C and 120 min, the H/C and O/C ratio decreases to 0.56 and 0.47.
- The changes in these chemical compositions are attributed to the devolatilization of hemicellulose, which will typically happen at torrefaction temperatures of >200 °C. These reactions result in the formation of water, carbon monoxide, and carbon dioxide and influence the hydrogen and carbon content of the biomass.
- The heating value increased from its initial value of about 19.41 MJ/kg to about 23.67 MJ/kg at 270 °C and a 120-min residence time. At lower torrefaction temperatures of 160–180 °C, the increase in the heating value is marginal.
Acknowledgments
Conflicts of Interest
References
- Framework Convention on Climate Change (FCCC), United Nations. Adoption of the Paris Agreement. In Proceedings of the Conference of Parties, Twenty-First Session, Paris, France, 11 December 2015.
- Arias, B.R.; Pevida, C.G.; Fermoso, J.D.; Plaza, M.G.; Rubiera, F.G.; Pis Martinez, J.J. Influence of torrefaction on the grindability and reactivity of woody biomass. Fuel Process. Technol. 2008, 89, 169–175. [Google Scholar] [CrossRef]
- United Nations. Kyoto Protocol to the United Nations Framework Convention on Climate Change; United Nations: Kyoto, Japan, 1998; pp. 1–20. [Google Scholar]
- U.S. Department of Energy. U.S. Billion-Ton Update: Biomass Supply for a Bioenergy and Bioproducts Industry; Perlack, R.D., Stokes, B.J., Eds.; U.S. Department of Energy, Oak Ridge National Laboratory: Oak Ridge, TN, USA, 2011; p. 227.
- Tumuluru, J.S.; Tabil, L.G.; Song, Y.; Iroba, K.L.; Meda, V. Grinding energy and physical properties of chopped and hammer-milled barley, wheat, oat and canola straws. Biomass Bioenergy 2014, 60, 58–67. [Google Scholar] [CrossRef]
- Tumuluru, J.S. Comparison of Chemical Composition and Energy Property of Torrefied Switchgrass and Corn Stover. Front. Energy Res. 2015, 3, 46. [Google Scholar] [CrossRef]
- Tumuluru, J.S.; Searcy, E.; Kenney, K.L.; Smith, W.A.; Gresham, G.; Yancey, N. Impact of feedstock supply systems unit operations on feedstock cost and quality for bioenergy applications. In Valorization of lignocellulosic Biomass in a Biorefinery: From Logistic to Environmental and Performance Impact; Kumar, R., Singh, S., Balan, V., Eds.; Nova Science Publishers: New York, NY, USA, 2016. [Google Scholar]
- Karki, B.; Muthukumarappan, K.; Wang, Y.J.; Dale, B.; Balan, V.; Gibbons, W.R.; Karunanithy, C. Physical characteristics of AFEX-pretreated and densified switchgrass, prairie cord grass, and corn stover. Biomass Bioenergy 2015, 78, 164–174. [Google Scholar] [CrossRef]
- Lynam, J.G.; Reza, M.T.; Vasquez, V.R.; Coronella, C.J. Pretreatment of rice hulls by ionic liquid dissolution. Bioresour. Technol. 2012, 114, 629–636. [Google Scholar] [CrossRef] [PubMed]
- Reza, M.T.; Lynam, J.G.; Uddin, M.H.; Coronella, C.J. Hydrothermal carbonization: Fate of inorganics. Biomass Bioenergy 2013, 49, 86–94. [Google Scholar] [CrossRef]
- Singh, S.; Cheng, G.; Sathitsuksanoh, N.; Wu, D.; Varanasi, P.; George, A.; Balan, V.; Gao, X.; Kumar, R.; Dale, B.E.; et al. Comparison of different biomass pretreatment techniques and their impact on chemistry and structure. Front. Energy Res. 2015, 2, 1–12. [Google Scholar] [CrossRef]
- Tumuluru, J.S.; Hess, J.R.; Boardman, R.D.; Wright, C.T.; Westover, T.L. Formulation, pretreatment, and densification options to improve biomass specifications for co-firing high percentages with coal. Ind. Biotechnol. 2012, 8, 113–132. [Google Scholar] [CrossRef]
- Tumuluru, J.S.; Sokhansanj, S.; Hess, J.R.; Wright, C.T.; Boardman, R.D. A review on biomass torrefaction process and product properties for energy applications. Ind. Biotechnol. 2011, 7, 384–401. [Google Scholar] [CrossRef]
- Sarkar, M.; Kumar, A.; Tumuluru, J.S.; Patil, K.N.; Bellmer, D.D. Gasification performance of switchgrass pretreated with torrefaction and densification. Appl. Energy 2014, 127, 194–201. [Google Scholar] [CrossRef]
- Yang, Z.; Sarkar, M.; Kumar, A.; Tumuluru, J.S.; Huhnke, R.L. Effects of torrefaction and densification on switchgrass pyrolysis products. Bioresour. Technol. 2014, 174, 266–273. [Google Scholar] [CrossRef] [PubMed]
- Hoover, A.N.; Tumuluru, J.S.; Teymouri, F.; Moore, J.; Gresham, G. Effect of pelleting process variables on physical properties and sugar yields of ammonia fiber expansion pretreated corn stover. Bioresour. Technol. 2014, 164, 128–135. [Google Scholar] [CrossRef] [PubMed]
- Ray, A.E.; Hoover, A.N.; Nagle, N.; Chen, X.; Gresham, G.L. Effect of pelleting on the recalcitrance and bioconversion of dilute-acid pretreated corn stover under low- and high-solids conditions. Biofuels 2013, 4, 271–284. [Google Scholar] [CrossRef]
- Aston, J.E.; Tumuluru, J.S.; Lacey, J.A.; Thompson, D.N.; Thompson, V.S.; Fox, S. Alkaline deacetylation of corn stover: Effects on feedstock quality. In Proceedings of the 2015 AICHE Annual Meeting, Salt Lake City, UT, USA, 8–13 November 2015.
- Bergman, P.C.A.; Kiel, J.H.A. Torrefaction for Biomass Upgrading. ECN-RX-05-180. In Proceedings of the 14th European Biomass Conference & Exhibition, Paris, France, 17–21 October 2005.
- Fonseca, F.F.; Luengo, C.A.; Bezzon, G.; Soler, P.B. Bench unit for biomass residues torrefaction. In Proceedings of the Conference on Biomass for Energy and Industry, Würzburg, Germany, 8–11 June 1998.
- Tumuluru, J.S.; Hess, J.R. New market potential: Torrefaction of woody biomass. Available online: http://www.iom3.org/materials-world-magazine/feature/2015/jun/02/new-market-potential-torrefaction-woody-biomass (accessed on 27 February 2016).
- Zanzi, R.; Ferro, D.T.; Torres, A.; Soler, P.B.; Bjornbom, E. Biomass torrefaction. In Proceedings of the 6th Asia-Pacific International Symposium on Combustion and Energy Utilization, Kuala Lumpur, Malaysia, 20–22 May 2002.
- Chen, W.H.; Kuo, P.C.E. A study on torrefaction of various biomass materials and its impact on lignocellulosic structure simulated by a thermogravimetry. Energy 2010, 35, 2580–2586. [Google Scholar] [CrossRef]
- Bridgeman, T.G.; Jones, J.M.; Shield, I.; Williams, P.T. Torrefaction of reed canary grass, wheat straw and willow to enhance solid fuel qualities and combustion properties. Fuel 2008, 87, 844–856. [Google Scholar] [CrossRef]
- Johnston, D.C. Estimating Lodgepole Pine Biomass. Theses, Dissertations, Professional Papers, Paper 2237, Missoula, MT, USA, 1977. Available online: http://scholarworks.umt.edu/etd (accessed on 1 June 2016). [Google Scholar]
- Parisa, Z.; Sokhansanj, S.; Bi, X.; Lim, S.J.; Mani, S.; Melin, S.; John, K. Density, heating value, and composition of pellets made from Lodgepole Pine (Pinus concorta Douglas) infested with mountain pine beetle (Dendroctonus ponderosae Hopkins). Can. Biosyst. Eng. 2008, 50, 3.47–3.55. [Google Scholar]
- Backlund, I. Cost-effective Cultivation of Lodgepole Pine for Biorefinery Applications. In Faculty of Forest Sciences Department of Forest Biomaterials and Technology; Swedish University of Agricultural Sciences Umeå: Uppsala, Switzerland, 2013. [Google Scholar]
- Bridgewater, A.V.; Czernik, S.; Piskorz, J. An overview of fast pyrolysis. In Progress in Thermochemical Biomass Conversion; Blackwell Science Ltd.: Oxford, UK, 2001; pp. 977–997. [Google Scholar]
- ASTM Standard D3173-86, A. Standard Test Method for Moisture in the Analysis Sample of Coal and Coke; ASTM International: West Conshohocken, PA, USA, 1996; Available online: http://www.astm.org/DATABASE.CART/HISTORICAL/D3173-87R96.htm (accessed on 6 January 2016).
- ASTM Standard D3174, A. Standard Test Method for Ash in the Analysis Sample of Coal and Coke from Coal; ASTM International: West Conshohocken, PA, USA, 2002; Available online: http://www.astm.org/Standards/D3174 (accessed on 6 January 2016).
- ASTM Standard D3175, A. Standard Test Method for Volatile Matter in the Analysis Sample of Coal and Coke; ASTM International: West Conshohocken, PA, USA, 2007; Available online: http://www.astm.org/Standards/D3175 (accessed on 6 January 2016).
- ASTM Standard D3178, A. Standard Test Methods for Carbon and Hydrogen in the Analysis Sample of Coal and Coke; ASTM International: West Conshohocken, PA, USA, 2002; Available online: http://www.astm.org/Standards/D3178.htm (accessed on 6 January 2016).
- ASTM Standard D3179, A. Standard Test Methods for Nitrogen in the Analysis Sample of Coal and Coke; ASTM International: West Conshohocken, PA, USA, 2002; Available online: https://www.astm.org/Standards/D3179.htm (accessed on 6 January 2016).
- ASTM Standard D3177, A. Standard Test Methods for Total Sulfur in the Analysis Sample of Coal and Coke; ASTM International: West Conshohocken, PA, USA, 2007; Available online: http://www.astm.org/Standards/D3177.htm (accessed on 6 January 2016).
- ASTM Standard D5865-10a., A.S. Standard Test Method for Gross Calorific Balue of Coal and Coke; ASTM International: West Conshohocken, PA, USA, 2010; Available online: http://www.astm.org/Standards/D5864-10a (accessed on 6 January 2016).
- Branca, C.; di Blasi, C.; Galgano, A.; Brostrom, M. Effects of the Torrefaction Conditions on the Fixed-Bed Pyrolysis of Norway Spruce. Energy Fuel. 2014, 28, 5882–5891. [Google Scholar] [CrossRef]
- Nhuchhen, D.R.; Basu, P.; Acharya, B. Torrefaction of poplar in a continouus two-stage, indirectly heated totary torrefier. Energy Fuel 2016, 30, 1027–1038. [Google Scholar]
- Carter, C.L.; Abdoulmoumine, N.; Kulkarni, A.; Adhikari, S.; Fasina, O. Physicochemical properties of thermally treated biomass and energy requirement for torrefaction. ASABE 2013, 53, 1093–1100. [Google Scholar]
- Dutta, A. Torrefaction and Other Processing Options; Guelph, U.O., Ed.; University of Guelph: Guelph, ON, Canada, 2011; Available online: http://www.ofa.on.ca/uploads/userfiles/files/animesh%20dutta.pdf (accessed on 24 February 2016).
- Peng, J.H.; Bi, H.T.; Sokhansanj, S.; Lim, J.C. A study of particle size effect on biomass torrefaction and densification. Energy Fuel 2012, 26, 3826–3839. [Google Scholar] [CrossRef]
- Bates, R.B.; Ghoniem, A.F. Biomass torrefaction: Modeling of volatile and solid product evlution kinetics. Bioresour. Technol. 2012, 124, 460–469. [Google Scholar] [CrossRef] [PubMed]
- Prins, M.J. Thermodynamic Analysis of Biomass Gasification and Torrefaction; Technische Universiteit Eindhoven: Eindhoven, The Netherlands, 2005. [Google Scholar]
- Medic, D.; Darr, M.; Shah, A.; Potter, B.; Zimmerman, J. Effects of torrefaction process parameters on biomass feedstock upgrading. Fuel 2012, 91, 147–154. [Google Scholar] [CrossRef]
- Park, J.; Meng, J.; Lim, K.H.; Rojas, O.J.; Park, S. Transformation of lignocellulocis biomass during torrefaction. J. Anal. Appl. Pyrolysis 2013, 100, 199–206. [Google Scholar] [CrossRef]
- Poudel, J.; Oh, S.C. A kinetic analysis of wood degradation in supercritical alcohols. Ind. Eng. Chem. Res. 2012, 51, 4509–4514. [Google Scholar] [CrossRef]
- Tumuluru, J.S.; Boardman, R.D.; Wright, C.T.; Hess, J.R. Some chemical compositional changes in Miscanthus and white oak sawdust samples during torrefaction. Energies 2012, 5, 3928–3947. [Google Scholar] [CrossRef]
- Tumuluru, J.S.; Boardman, R.D.; Wright, C.T. Response surface analysis of elemental composition and energy properties of corn stover during torrefaction. J. Biobased Mater. Bioenergy 2012, 6, 25–35. [Google Scholar] [CrossRef]
- Nimlos, M.; Brooking, E.; Looker, M.J.; Evans, R.J. Biomass torrefaction studies with a molecular beam mass spectrometer. Am. Chem. Soc. 2003, 48, 590. [Google Scholar]
- Nhuchhen, D.R. Studies on Advanced Means of Biomass Torrefaction; Dalhousie University: Halifaxm, NS, Canada, 2016. [Google Scholar]
- Wang, M.J.; Huang, Y.F.; Chiueh, P.T.; Kuan, W.H.; Lo, S.L. Microwave-induced torrefaction of rice husk and sugarcane residues. Energy 2012, 37, 177–184. [Google Scholar] [CrossRef]


| S. No. | Chemical Composition | Procedure |
|---|---|---|
| Proximate | ||
| 1 | Moisture | ASTM D3173 [29] |
| 2 | Ash | ASTM D 3174 [30] |
| 3 | Volatiles | ASTM D3175 [31] |
| 4 | Fixed carbon | Fixed carbon calculated by the difference method |
| Ultimate Composition | ||
| 1 | Moisture | ASTM D3173 [29] |
| 2 | Carbon | ASTM D3178 [32] |
| 3 | Hydrogen | ASTM D3178 [32] |
| 4 | Nitrogen | ASTM D3179 [33] |
| 5 | Sulphur | ASTM D3177 [34] |
| 7 | Oxygen | Oxygen calculated by the difference method |
| 8 | H/C ratio | H/C: number of hydrogen atoms/number of carbon atoms = (%H/1)/(%C/12) |
| 9 | O/C ratio | O/C: number of oxygen atoms/number of carbon atoms = (%O/8)/(%C/12) |
| 6 | Higher heating value (HHV) | ASTM D5865 [35] |
| Process | Temperatures (°C) | Residence Time (min) | Particle Size (mm) | Heating Rate (°C/min) |
|---|---|---|---|---|
| Deep drying | 160, 180 | 15, 30, 60, and 120 | 2 | 10 |
| Torrefaction | 230, 270 | 15, 30, 60, and 120 | 2 | 10 |
| S. No. | Chemical Composition | (%) |
|---|---|---|
| Proximate | ||
| 1 | Moisture | 4.2 |
| 2 | Ash | 0.69 |
| 3 | Volatiles | 80.23 |
| 4 | Fixed carbon | 15.1 |
| Ultimate composition | ||
| 1 | Carbon | 52.23 |
| 2 | Hydrogen | 6.2 |
| 3 | Nitrogen | 0.47 |
| 4 | Sulphur | 0.022 |
| 5 | Oxygen | 41.23 |
| 6 | H/C | 1.42 |
| 7 | O/C | 0.59 |
| 8 | Higher heating value (HHV) | 19.37 |
| S. No. | Chemical Composition and higher heating value | Multiple Regression Equation | Coefficient of Determination (R2) | Statistical Significance |
|---|---|---|---|---|
| Proximate composition | ||||
| 1 | Moisture content (%, w.b.) | 0.93 | p < 0.001 | |
| 2 | Ash (%) | 0.93 | p < 0.001 | |
| 3 | Volatiles (%) | 0.79 | p < 0.001 | |
| 4 | Fixed carbon (%) | 0.80 | p < 0.001 | |
| Ultimate composition | ||||
| 1 | Hydrogen (%) | 0.72 | p < 0.001 | |
| 2 | Carbon (%) | 0.97 | p < 0.001 | |
| 3 | Oxygen (%) | 0.96 | p < 0.001 | |
| 4 | Nitrogen (%) | 0.89 | p < 0.001 | |
| 5 | Sulfur (%) | 0.89 | p < 0.001 | |
| 6 | H/C ratio | 0.83 | p < 0.001 | |
| 7 | O/C ratio | 0.72 | p < 0.05 | |
| 8 | Higher heating value (MJ/kg) | 0.82 | p < 0.001 |
| S. No. | Chemical Composition and higher heating value | Process Variables | |
|---|---|---|---|
| Torrefaction Temperature (x1) | Torrefaction Residence Time (x2) | ||
| Proximate composition | |||
| 1 | Moisture content (%, w.b.) | (−) *** | (−) *** |
| 2 | Ash (%) | (+) *** | (+) *** |
| 3 | Volatile content (%) | (−) *** | ns |
| 4 | Fixed carbon (%) | (+) *** | (+) *** |
| Ultimate composition | |||
| 5 | Hydrogen (%) | (−) *** | ns |
| 6 | Carbon (%) | (+) *** | (+) *** |
| 7 | Nitrogen (%) | (−) *** | (−) ** |
| 8 | Oxygen (%) | (−) *** | (−) *** |
| 9 | Sulfur (%) | (−) *** | (−) *** |
| 10 | H/C ratio | (−) *** | (−) * |
| 11 | O/C ratio | (−) *** | ns |
| 12 | Higher heating value (MJ/kg) | (+) *** | ns |
© 2016 by the author; licensee MDPI, Basel, Switzerland. This article is an open access article distributed under the terms and conditions of the Creative Commons Attribution (CC-BY) license (http://creativecommons.org/licenses/by/4.0/).
Share and Cite
Tumuluru, J.S. Effect of Deep Drying and Torrefaction Temperature on Proximate, Ultimate Composition, and Heating Value of 2-mm Lodgepole Pine (Pinus contorta) Grind. Bioengineering 2016, 3, 16. https://doi.org/10.3390/bioengineering3020016
Tumuluru JS. Effect of Deep Drying and Torrefaction Temperature on Proximate, Ultimate Composition, and Heating Value of 2-mm Lodgepole Pine (Pinus contorta) Grind. Bioengineering. 2016; 3(2):16. https://doi.org/10.3390/bioengineering3020016
Chicago/Turabian StyleTumuluru, Jaya Shankar. 2016. "Effect of Deep Drying and Torrefaction Temperature on Proximate, Ultimate Composition, and Heating Value of 2-mm Lodgepole Pine (Pinus contorta) Grind" Bioengineering 3, no. 2: 16. https://doi.org/10.3390/bioengineering3020016