
Eventogram: A Visual Representation of Main Events in Biomedical Signals


1
Department of Obstetrics & Gynecology, University of British Columbia, Vancouver, BC V6Z 2K5, Canada
2
Department of Electrical and Computer Engineering, University of British Columbia, Vancouver, BC V6T 1Z4, Canada
Bioengineering 2016, 3(4), 22; https://doi.org/10.3390/bioengineering3040022
Submission received: 19 August 2016
/
Revised: 15 September 2016
/
Accepted: 18 September 2016
/
Published: 22 September 2016
Abstract
:Biomedical signals carry valuable physiological information and many researchers have difficulty interpreting and analyzing long-term, one-dimensional, quasi-periodic biomedical signals. Traditionally, biomedical signals are analyzed and visualized using periodogram, spectrogram, and wavelet methods. However, these methods do not offer an informative visualization of main events within the processed signal. This paper attempts to provide an event-related framework to overcome the drawbacks of the traditional visualization methods and describe the main events within the biomedical signal in terms of duration and morphology. Electrocardiogram and photoplethysmogram signals are used in the analysis to demonstrate the differences between the traditional visualization methods, and their performance is compared against the proposed method, referred to as the “eventogram” in this paper. The proposed method is based on two event-related moving averages that visualizes the main time-domain events in the processed biomedical signals. The traditional visualization methods were unable to find dominant events in processed signals while the eventogram was able to visualize dominant events in signals in terms of duration and morphology. Moreover, eventogram-based detection algorithms succeeded with detecting main events in different biomedical signals with a sensitivity and positive predictivity >95%. The output of the eventogram captured unique patterns and signatures of physiological events, which could be used to visualize and identify abnormal waveforms in any quasi-periodic signal.
1. Introduction
Periodogram, spectrogram, and wavelet methods are the current standard methods for visualizing and analyzing one-dimensional, quasi-periodic biosignals. Such visualizations generate temporal-spatial information in order to gain scientific insights into the physical measurement. These powerful visualization techniques play a key role in understanding large and complex signals. The task of a visualization algorithm is to translate the raw signals into a meaningful graphical representation to facilitate interpretation by the scientist. In many cases, sophisticated analysis techniques can help to extract essential information from the biomedical signals.
The periodogram is a frequency visualization of the processed signal, while the spectrogram and wavelet are time-frequency visualizations. However, these techniques do not provide detailed information of the dominant events in terms of morphology and duration. Many researchers attempted to visualize signals in the time domain [1,2,3,4,5,6,7,8]; however, this massive research effort did not lead to a generic, intuitive implementation framework that is specifically applied across different disciplines, including current clinical problems [9].
The aim of this paper is to introduce a new, simple, easy-to-use visualization algorithm that extracts the main events in signals, especially in one-dimensional, quasi-periodic biosignals such as electrogradiograms (ECGs) and photoplethysmograms (PPGs). These biosignals contain valuable information represented by physiological events. Once an event has been detected, the corresponding signal can be extracted and analyzed in terms of its amplitude (peak), morphology, energy and entropy distribution, frequency content, and intervals between events. Determining the dominant events within these biomedical signals that will provide more insight into the information of the signal can ultimately improve the development of more accurate diagnostic tools. The commonly used visualization methods known as the periodogram, spectrogram, and wavelet methods will be evaluated followed by the introduction, evaluation and comparison of the new algorithm, referred to as the “eventogram” throughout this paper. The eventogram provides and detects the dominant time-domain events within the biomedical signals using two moving averages and performs at a level that the traditional methods cannot achieve.
2. Materials and Methods
2.1. Data Used
2.2. Method I: Periodogram
Periodogram (also called spectral analysis) views the processed biomedical signal as a sum of cosine waves with varying amplitudes and frequencies. It is obtained by the fast Fourier transform and usually shows frequency as an x-axis, and magnitude of the spectrum as a y-axis. The main goal of the periodogram is to identify the important frequencies (or periods) in the processed biomedical signal. In other words, the periodogram graph shows the dominant frequency behavior within the signal. The periodogram, , was calculated as follows:
where x is the biomedical signal with length N, n is the data sample, and f is the frequency.
2.3. Method II: Spectrogram
The main difference between the spectrogram and periodogram methods is that the spectrogram is a time-frequency visualization (takes into consideration time localization) while the periodogram relies only on the frequency domain. A spectrogram can be seen as multiple short periods of spectrum combined together. It is three-dimensional by nature, including the time, frequency, and magnitude of the spectrum. Typically, the spectrogram is displayed by using time as an x-axis and frequency as a y-axis. It also uses colors to show the magnitude of the spectrum. It is usually obtained by the short-time fast Fourier transform (FFT), which commonly includes a windowing function to extract the local time signal before conducting a short-time FFT. The main goal of the spectrogram is to identify the dominant frequencies with respect to time in the processed biomedical signal. The spectrogram, , is calculated as follows:
where x is the biomedical signal, is the window function, and f is the frequency. The time index, t, is normally considered to be ‘slow’ time and is usually not expressed in as a high resolution as time τ.
2.4. Method III: Wavelets
A wavelet is the same as a spectrogram, but a wavelet transform can offer a multiresolution while the spectrogram can only offer a fixed resolution. Wavelets are closely related to filter banks. The wavelet transform (WT) of the biomedical signal is an integral transform defined by:
where is known as the wavelet detail coefficient at the scale and location indices of the biomedical signal , and denotes the complex conjugate of the wavelet function . The transform yields a time-scale representation similar to the time-frequency representation of the short-time Fourier transform (STFT). In contrast to the STFT, the WT uses a set of analyzing functions that allow a variable time and frequency resolution for different frequency bands. The set of analyzing functions—the wavelet family —is deduced from a mother wavelet by:
where a and b are the dilation (scale) and translation parameters, respectively. The scale parameter a of the WT is comparable to the frequency parameter of the STFT. The mother wavelet is a short oscillation with a zero mean. The orthonormal dyadic discrete wavelets are associated with scaling functions and their dilation equations. The scaling function is associated with the smoothing of the signal and has the same form as the wavelet, given by . However, the convolution of the biomedical signal with the scaling function produces approximation coefficients as follows:
where the biomedical signal can then be represented by a combined series expansion, using both the approximation coefficients A and the detail coefficients D.
2.5. Method IV: Eventogram
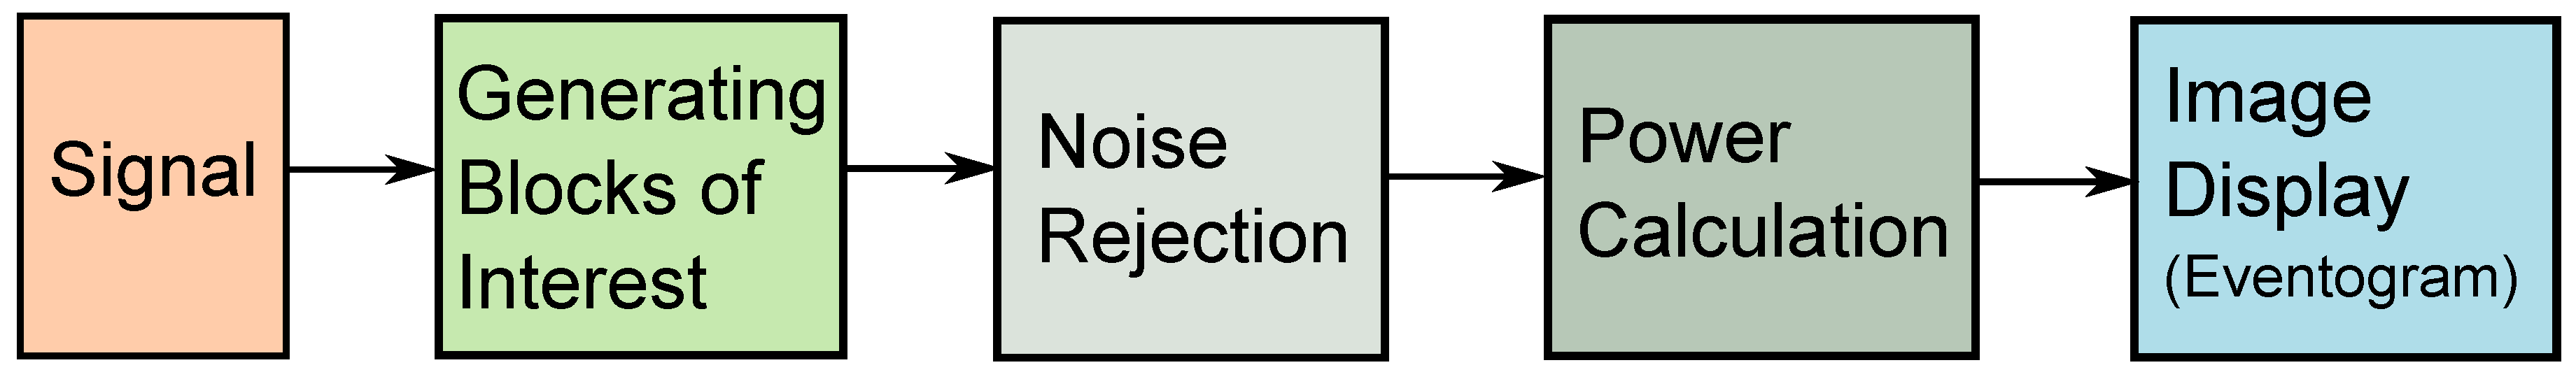
The eventogram is a novel visual-representation algorithm based on the fundamental concept of two moving averages. The idea of using two moving averages has already been tested over different biomedical signals for detecting a waves in APG (acceleration of PPG) signals [12,13,14], for detecting c, d, and e waves in APG [15], for detecting systolic waves in PPG signals [11], for detecting QRS complexes in ECG signals [16,17], for detecting T waves in ECG signals [18], and for detecting heart sounds [19]. An essential step of the two-moving-averages approach is the generation of the blocks of interest, and it is this step that is specifically applied in the eventogram methodology proposed in this paper. The blocks of interest are generated using two moving averages, which are now used to produce the eventogram. Noisy events rejection, power calculation, and image display are the new additional steps introduced to produce the eventogram. The structure of the eventogram is given in Figure 2.
Generating Blocks of Interest:
Blocks of interest are generated using two event-related moving averages that demarcate the systolic and heartbeat areas. In this procedure, the first moving average () is used to emphasize the first event and is given by
where represents the window size of the first-event duration. The resulting value is rounded to the nearest odd integer.
The second moving average () is used to emphasize the second event area to be used as a threshold for the first moving average and is given by
where represents the window size of approximately one beat duration. Its value is rounded to the nearest odd integer.
In this stage, the blocks of interest are generated by comparing the signal with . If any sample in it will be replaced by zero. If not, it will be replaced by a value of one. The generated time series of a binary string is called blocks of interest. However, some blocks of interest will contain noise segments that occur multiple times. The data within a series of ones are referred to as a B.
Since we obtained the blocks of interests, the next steps will start by rejecting the blocks that contain noise, calculating the power of each block, and then visualizing the power of the blocks in terms of and , as follows:
Noise Rejection:
Rejection is based on the average value of the standard deviations of all blocks. The standard deviation of each block (m) is calculated as follows:
where L is the length of the data within each data block B.
After calculating the standard deviations of all blocks, a threshold () is applied to reject blocks that contain noise as follows:
where M is the number of data blocks and is the average value of the standard deviations of all blocks. Usually, the noisy segments have small standard deviation compared to the ones that contain informative events (i.e., wave, spike, or peak). Thus, the block that satisfies is accepted; otherwise, it is rejected.
Power Calculation:
The power of each block, calculated at a specific window length and a specific window length , is used to represent a value in the eventogram, as follows:
where B is the data segment within a specific block m. This step generates a power matrix: , where u is the different values of () and v is the number of values of ().
Image display:
The P matrix (obtained in the previous step) is displayed as an image with a full range of colors. Each element of P specifies the color for one pixel of the image representing the intensity of the power over the data block generated using and . Here, the range is used from blue to red, and passes through the colors cyan, yellow, and orange. The blue color refers to the lowest value of power while the red color refers to the highest value of power. The resulting image is a u-by-v grid of pixels, where u is the number of columns and v is the number of rows in P. The visual representation of this step is called an eventogram—the image display step produces the eventogram. The main goal of the eventogram is to identify the dominant time-domain events and their associated signal morphologies within the processed biomedical signal using and . The pixel associated with the highest value of power is considered to contain the main event. The eventogram is a time–time representation of a signal.
3. Results and Discussion
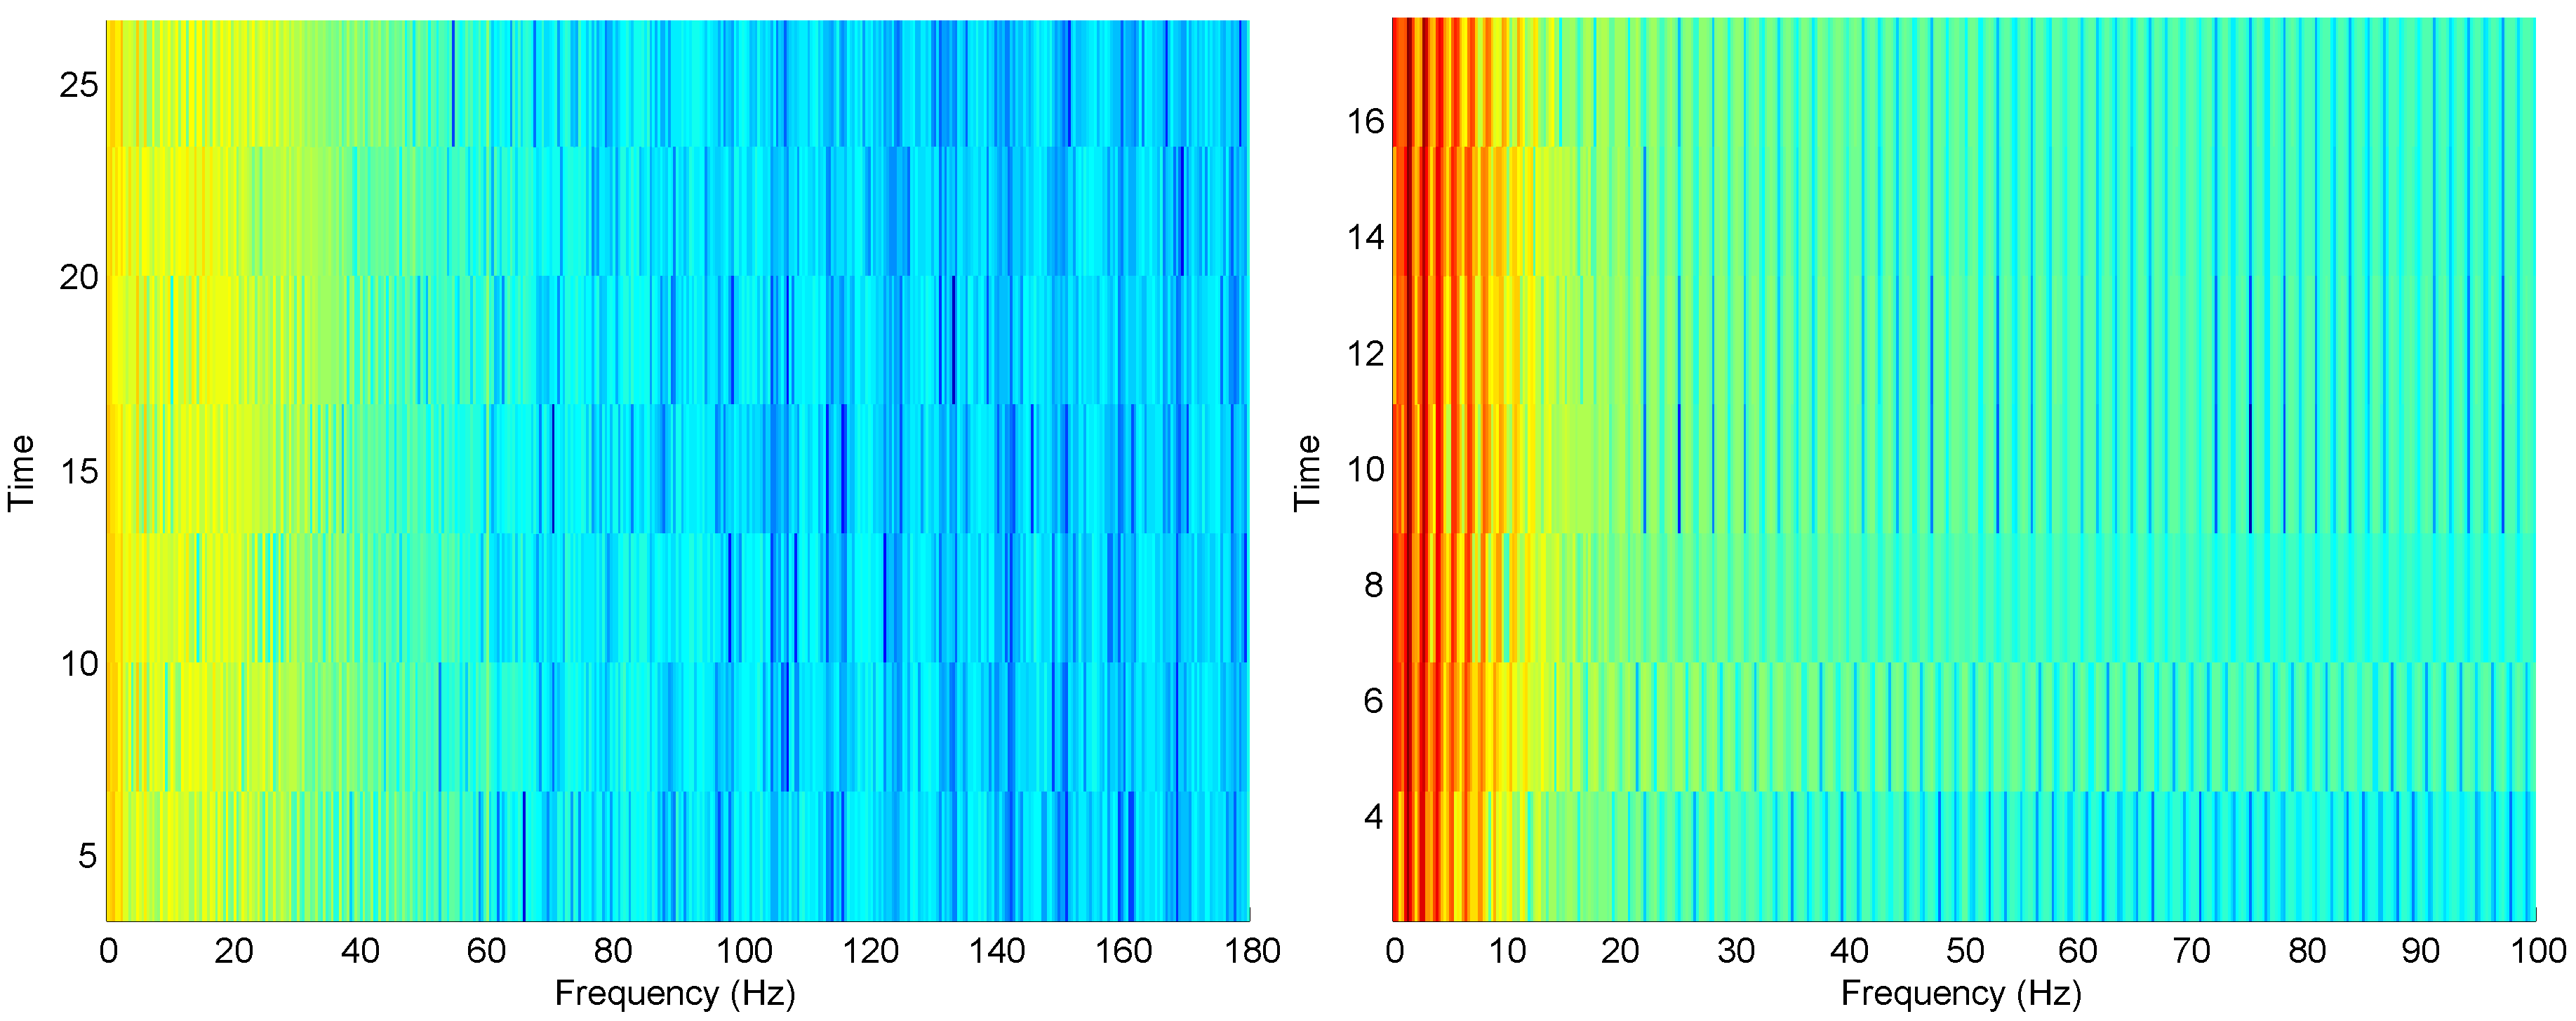
Figure 3 shows the periodogram for ECG and PPG; it provides frequency information about the processed signal. Both ECG and PPG examples have the direct current component and some low frequency noise. On the other hand, the spectrogram provides different frequency information about the signal, which is the frequency range that holds most of the energy of the processed signal. For example, most of the energy for the ECG signal lies in the range 0–30 Hz, while the PPG signal is in the range 0–10 Hz, as shown in Figure 4.
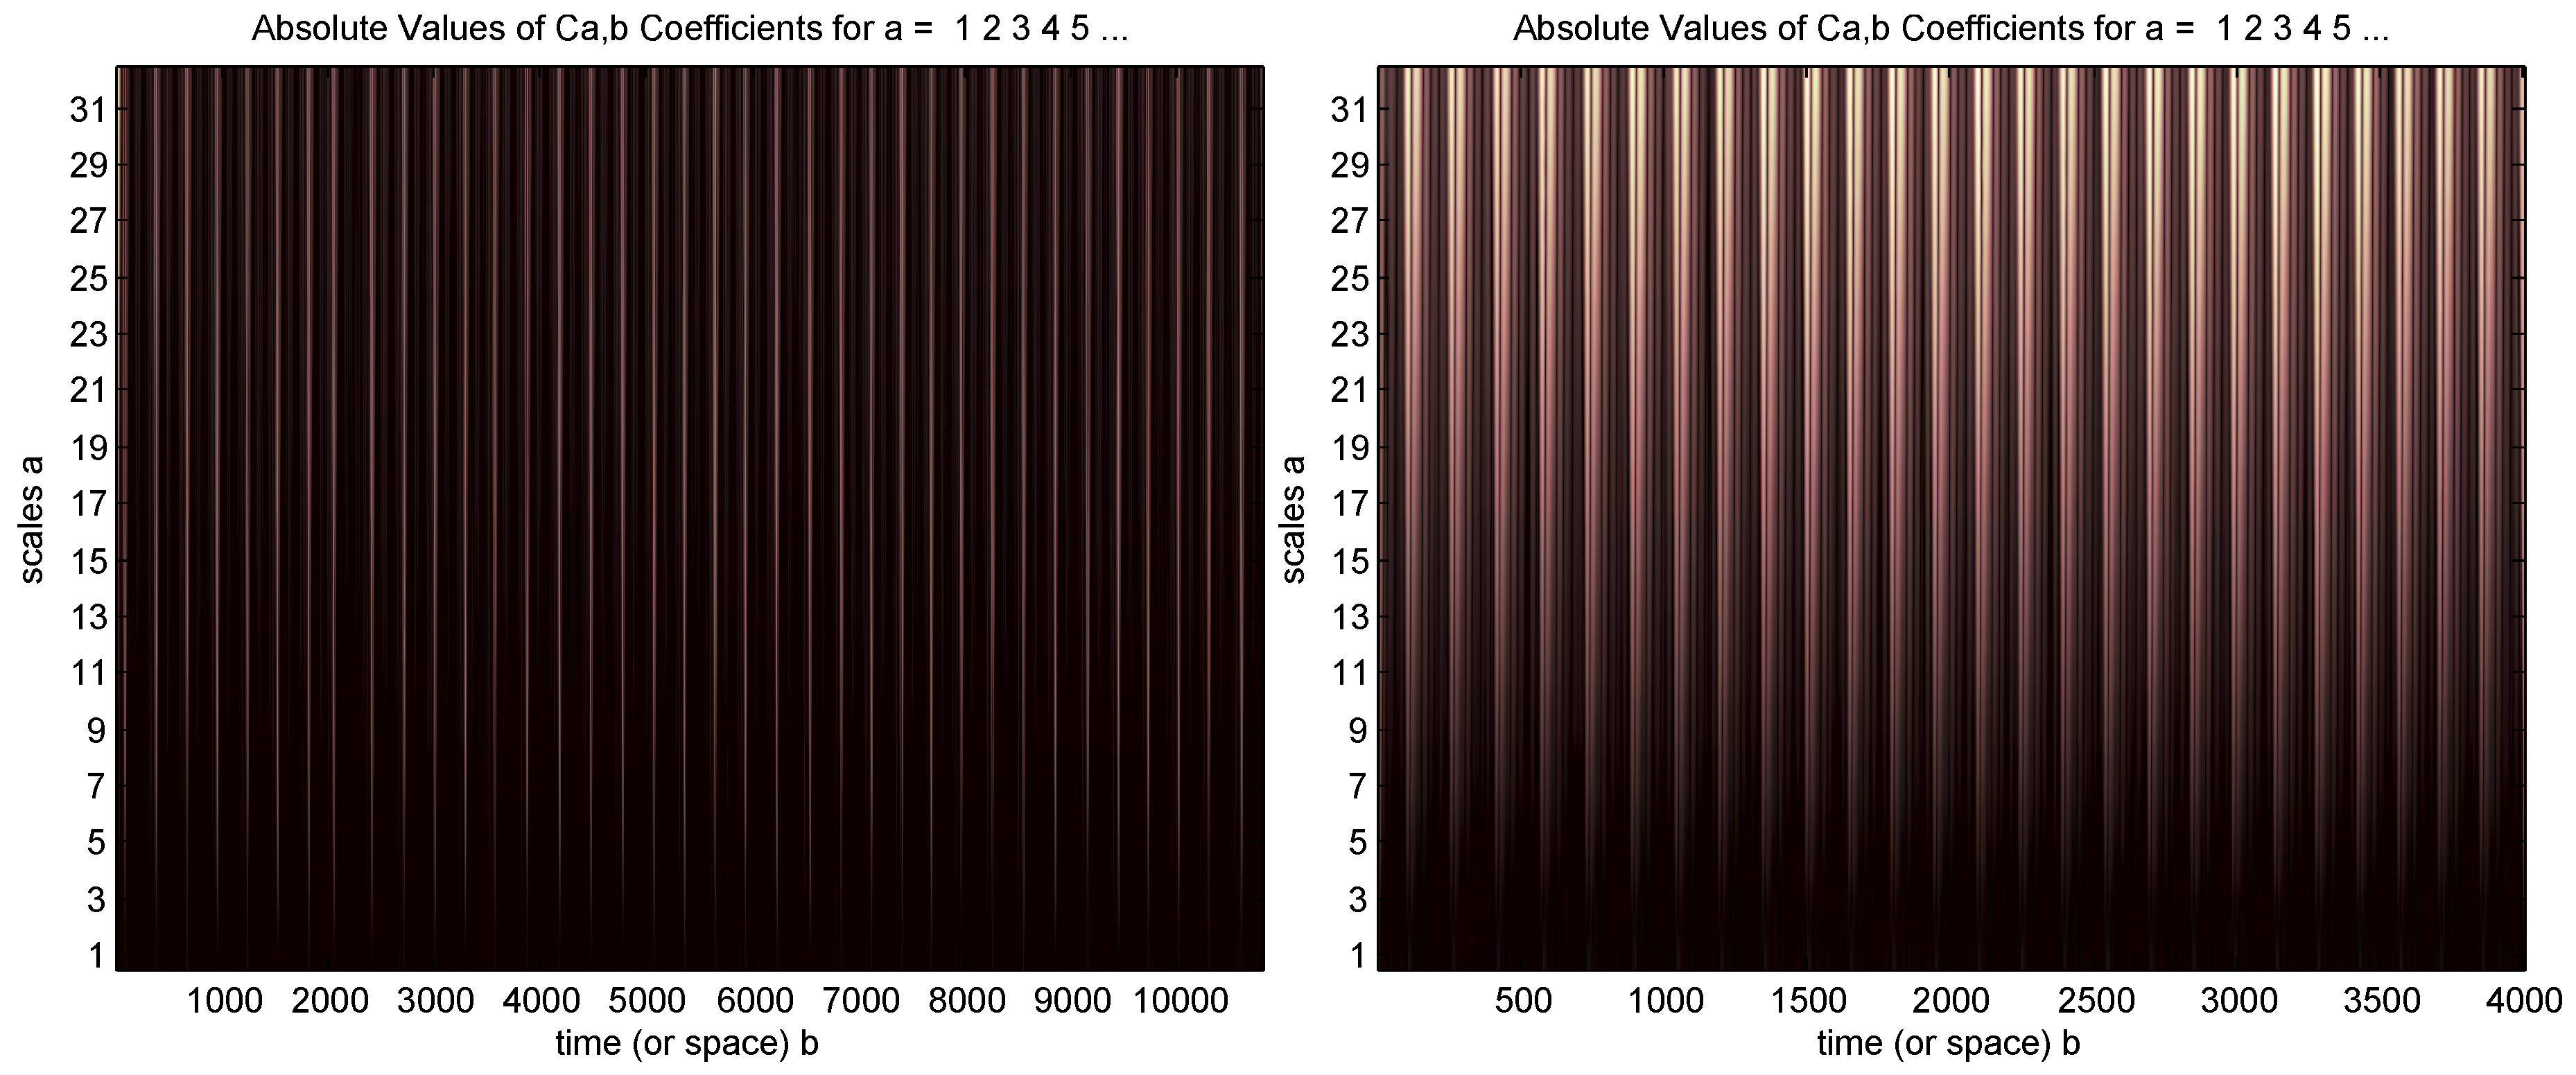
A continuous wavelet transform is used with the “sym2” wavelet and a 1–32 scale based on the recommendation in [20], as shown in Figure 5. However, the wavelet visual presentation did not provide any information about the signal.
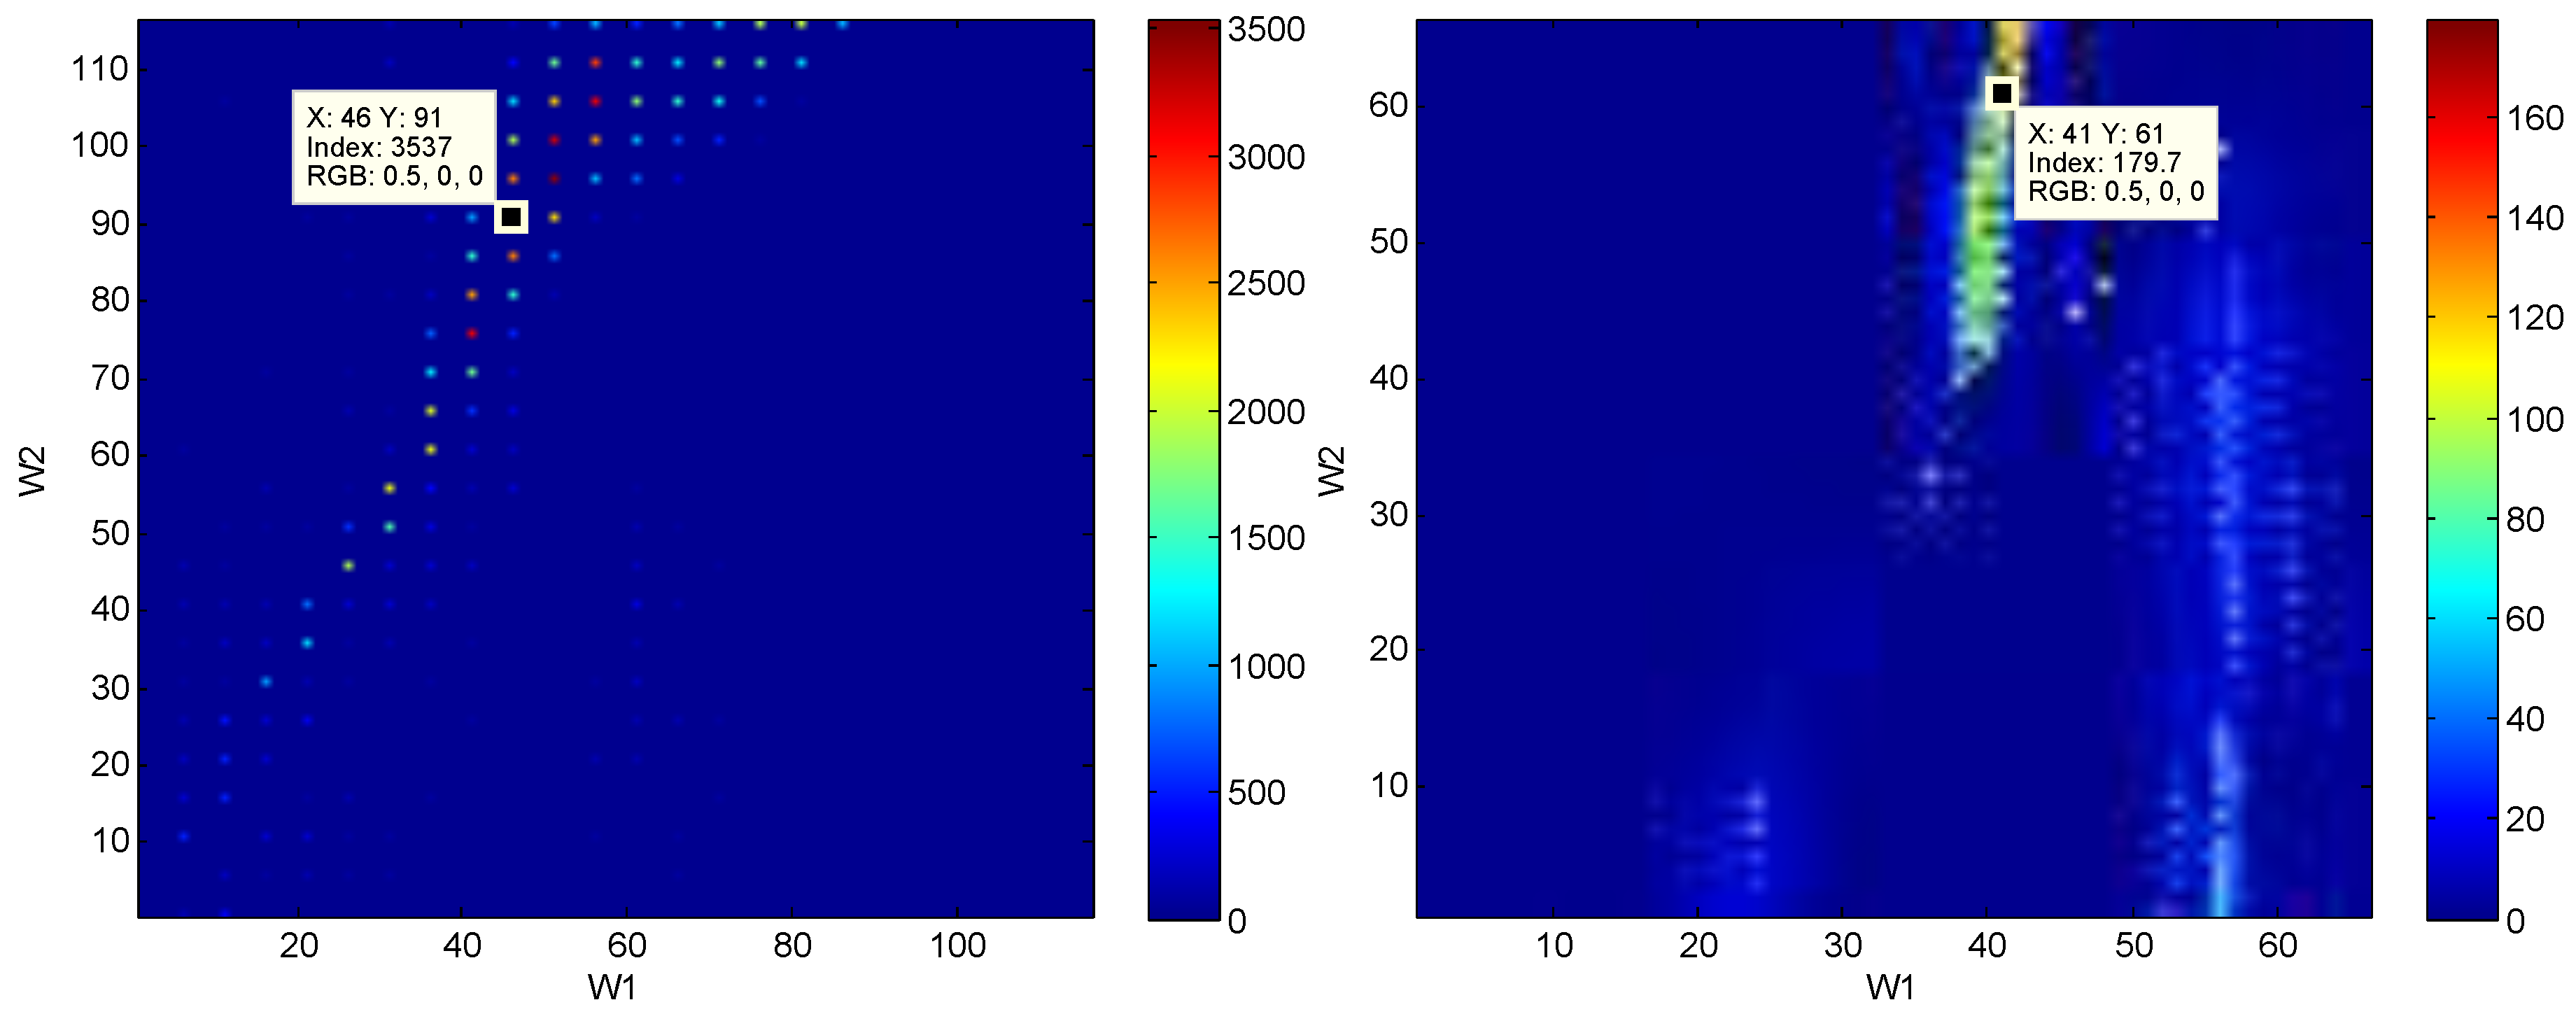
Running the eventogram algorithm on the ECG and PPG signals (cf. Figure 6) provided useful information about the signals that was not provided by the traditional visualization methods. For example, in the ECG signal, and were varied and the maximum power value was found at window size samples and samples. This means there is a dominant event of length 46 samples occurring within a periodic event of length 91 samples. For PPG signals, the window sizes ( and ) were also varied, and the maximum power value was found at samples and samples. However, the traditional visualization methods did not provide any insights into the events within the ECG and PPG signals.
The eventogram describes the biomedical signal in terms of two time-domain window sizes and . The eventogram is a time–time representation which is different from the time-frequency representation produced by the spectrogram and wavelet methods. The time–time representation of a biomedical signal in terms of two windows will help clinicians understand the dominant durations and visualize their morphologies. Thus, the eventogram is more informative than the classical visualization methods. Note, the Recurrence Plot [21] was not included in this study, as it represents phase space trajectory of the processed signal. The phase analysis is not meaningful for physicians or biomedical engineers when analyzing and diagnosing biomedical signals—correlating phase changes with a disease is not easy nor precise.
The application of the eventogram methodology on PPG and ECG signals is demonstrated in Figure 6. Dominant events are marked by red pixels where the combination of and scored the highest power. Once and are identified for the most dominant event, the next step is to visualize its corresponding waveform in terms of duration and morphology, as shown in Figure 7. In the case of ECG signal, the eventogram picked the QRS complexes to be the most dominant event, while the eventogram detected the systolic wave as the most dominant event in the PPG signal. Note that examination of the second highest power, the third highest, and so on, in the eventogram is also possible to check their corresponding dominant events.
Another advantage of the eventogram is that the search area can be either customizable or automated. For example, the search ranges for the ECG signal were 1–115 samples for and , while 1–65 samples for the PPG signal. In Figure 8 and Figure 9, the search areas are automatically adjusted to equal the sampling frequency, and the step sizes are automatically adjusted to be the of the sampling frequency—the value will then be rounded toward negative infinity.
The window lengths for the ECG signals (cf. Figure 8) are 360 samples with a step size of five samples for ECG data length of 100 s, while the window lengths for the PPG signals (cf. Figure 9) are 367 samples with a step size of five samples for PPG data length of 20 s.
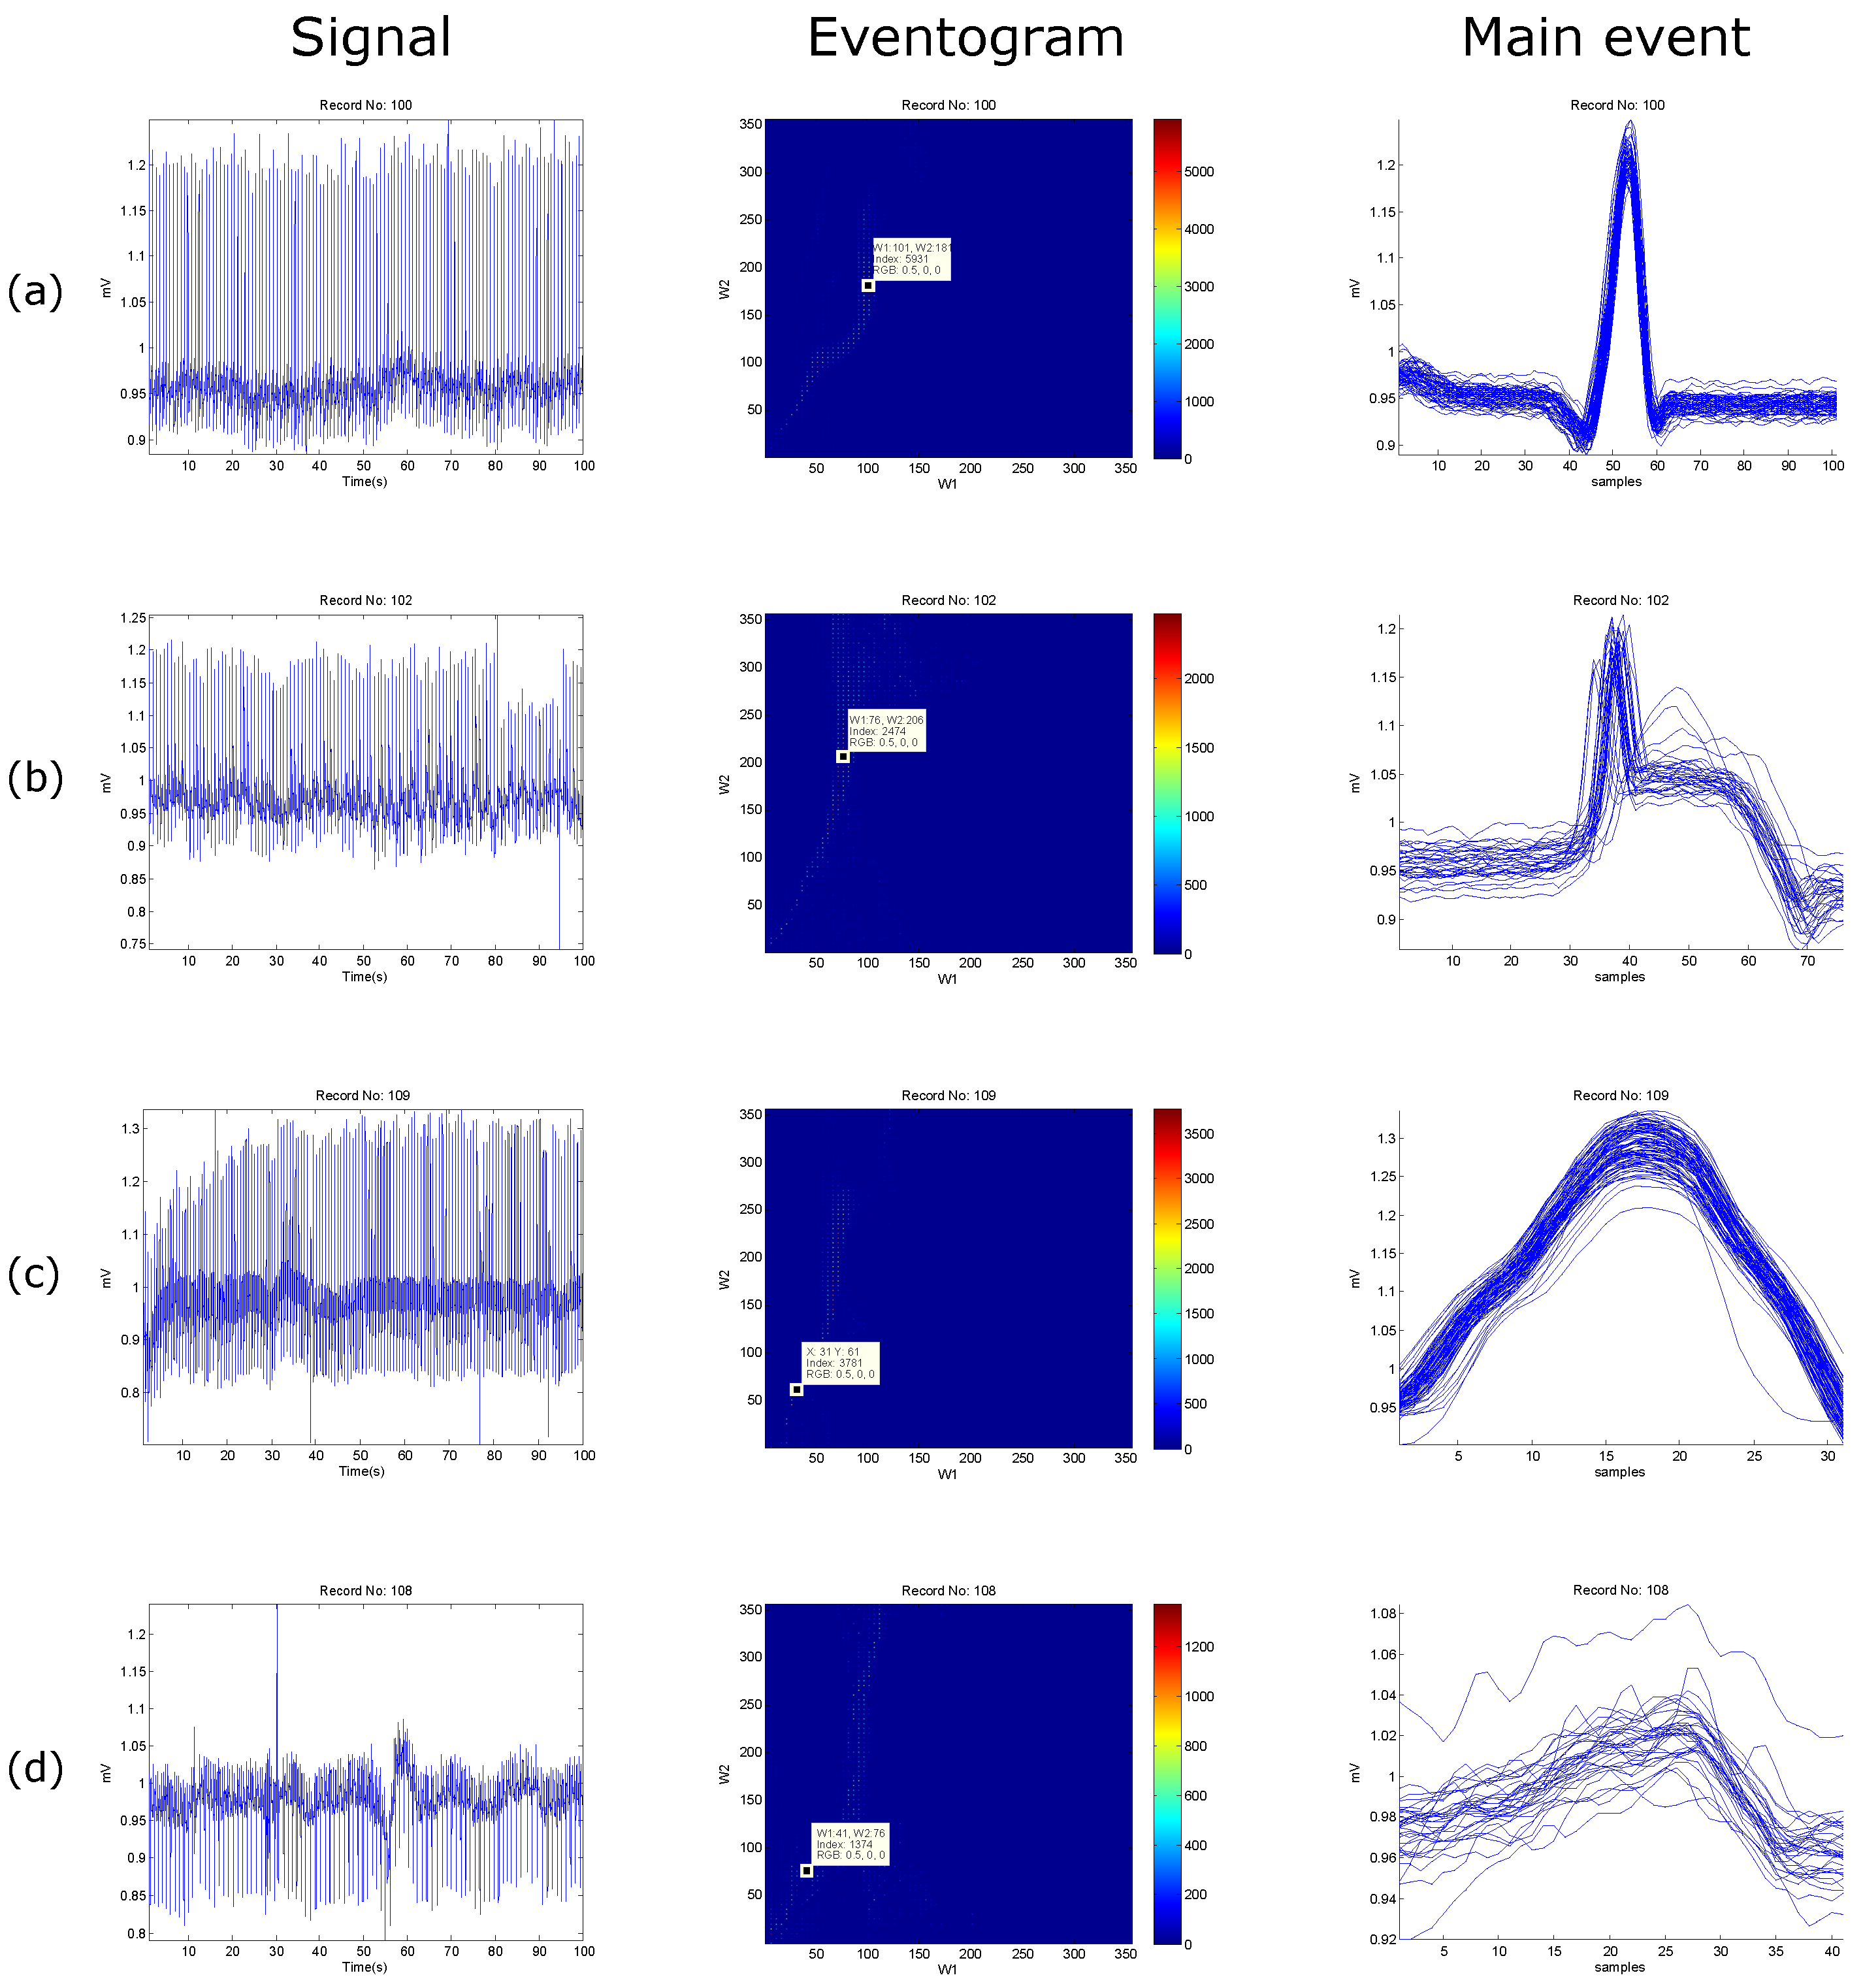
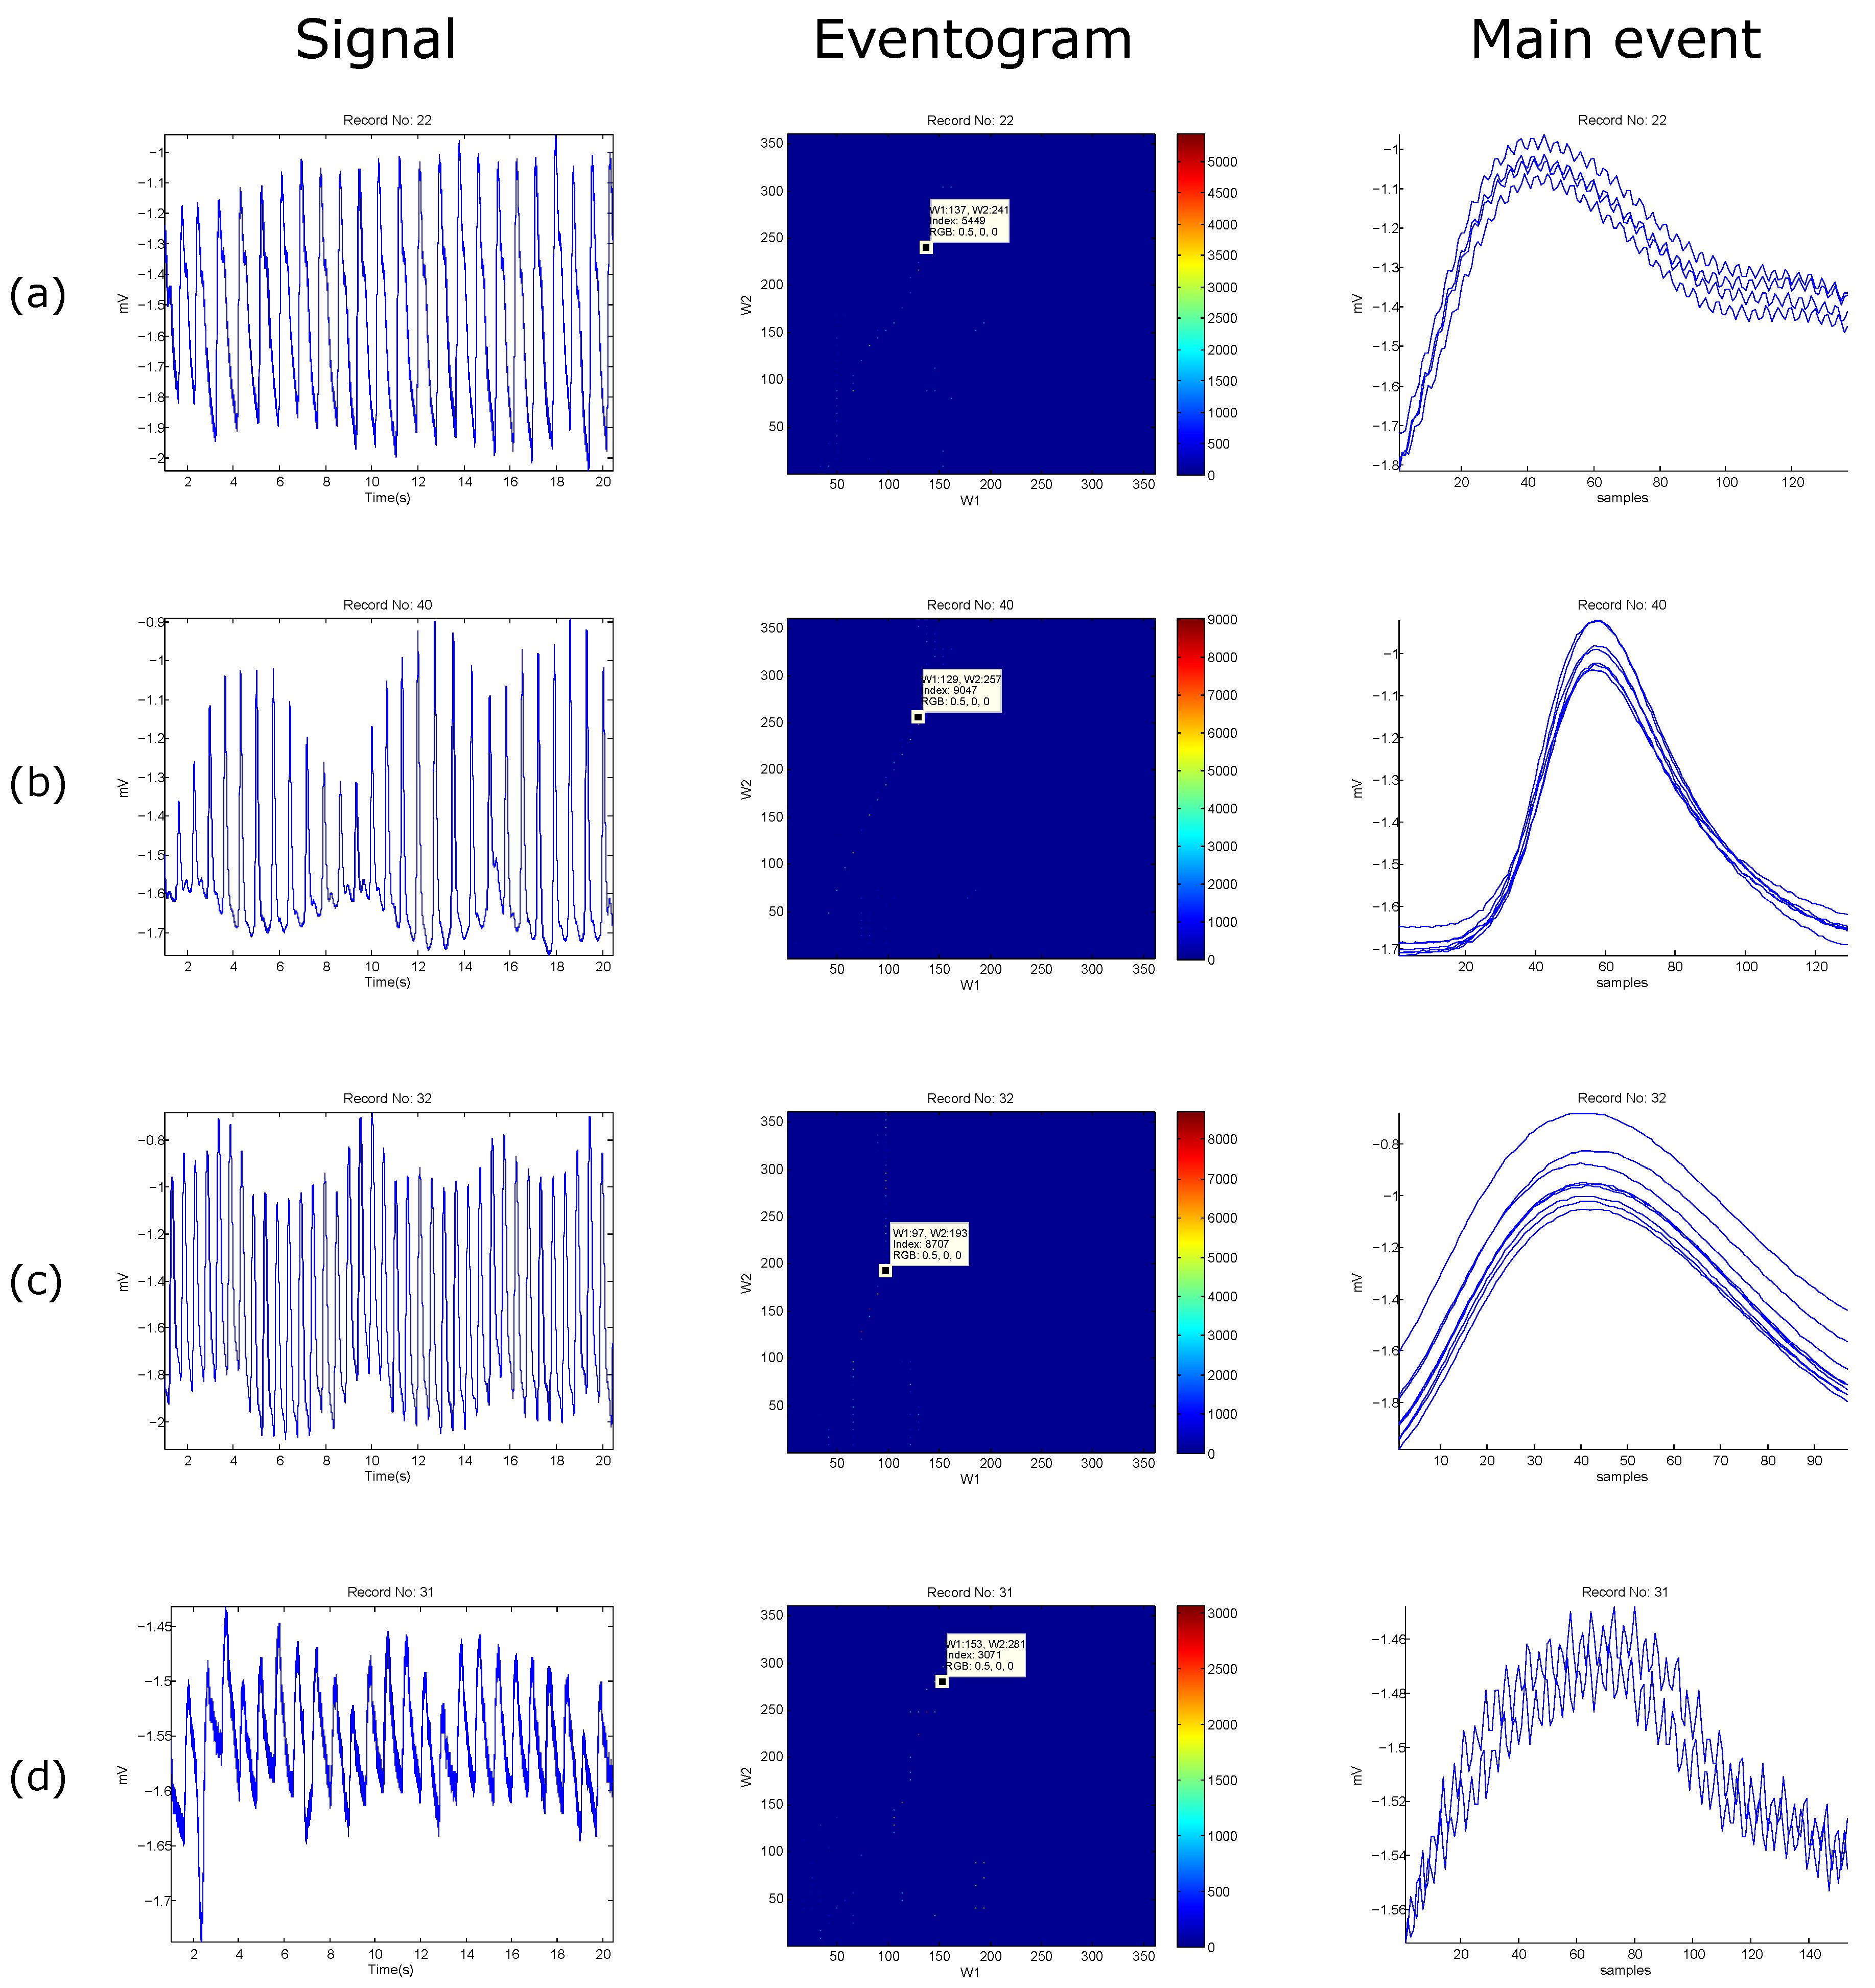
The eventogram analysis of biomedical signals with regular heart rhythm is simple and efficient as the heart beats are repeated with an equally spaced pattern. This regularity helps the time-domain threshold methodologies to detect main events successfully. The regular heart rhythm is called the normal sinus rhythm [22], which means that the rhythm is constant and the occurrence of the next beat is predictable. The eventogram easily detects the QRS complexes and systolic peaks correctly in a regular heart rhythm in ECG and PPG signals, respectively, as shown in Figure 8a and Figure 9a. Moreover, the eventogram is able to detect main events in biomedical signals with irregular rhythm, as shown in Figure 8b,c and Figure 9c. The results show that the eventogram is suitable for any quasi-periodic biomedical signals, as it is robust against the irregular rhythm, non-stationary effects (cf. Figure 8b–d and Figure 9b–d), and low signal-to-noise ratio (cf. Figure 8d and Figure 9d).
Classical visualization methods do not provide precise information in terms of event morphology and duration within the processed signal. These methods rely only on qualitative examination, compared to the proposed eventogram method that relies on both qualitative and quantitative analysis. The eventogram uses different window size choices, where dominant events can be quantitatively and qualitatively visualized, therefore providing more precise insight into signal characteristics. To validate the concept, application, and performance of the eventogram, rigorous testing over multiple data sets for detecting different events were conducted, as follows:
- For QRS detection in ECG signals: The eventogram-based QRS detector has two additional steps to the eventogram: one at the beginning before applying the eventogram (preprocessing step) and one at the end after applying the eventogram (thresholding step). The eventogram is considered to be the feature extraction step. Interestingly, the eventogram-based QRS detector, with ms and ms, obtained a sensitivity (SE) of 99.29% and a positive predictivity (+P) of 98.11% over the first lead of 10 databases with a total of 1,179,812 beats. When applied to the well-known MIT-BIH Arrhythmia Database, an SE of 99.78% and a +P of 99.87% were attained [17].
- For T wave detection in ECG signals: The eventogram-based T wave detector has three additional steps to the eventogram: two steps at the beginning before applying the eventogram (filtering and QRS removal) and one at the end after applying the eventogram (thresholding based on RR intervals). The eventogram is considered to be the feature extraction step. Over the MIT-BIH Arrhythmia Database, the eventogram-based T wave detector, with ms and ms, achieved a SE of 99.86% and a +P of 99.65%, which are promising results for handling the non-stationary effects, low SNR, normal sinus rhythm (NSR), left bundle branch block, right bundle branch block, premature ventricular contraction, and premature atrial contraction in ECG signals [18].
- For systolic wave detection in PPG signals: The eventogram-based systolic wave detector has two additional steps to the eventogram: one step at the beginning before applying the eventogram (filtering) and one at the end after applying the eventogram (thresholding). The eventogram is considered to be the feature extraction step. The eventogram-based systolic wave detection algorithm, with ms and ms, was evaluated using 40 records after three heat stress simulations, containing 5071 heartbeats, with an overall SE of 99.89% and the +P was 99.84% [11].
- For and wave detection in PPG signals: The eventogram-based a and b waves detector has two additional steps to the eventogram: one step at the beginning before applying the eventogram (filtering) and one at the end after applying the eventogram (thresholding). The eventogram is considered to be the feature extraction step. The eventogram-based a wave detection algorithm, with ms and ms, demonstrated overall SE of 99.78%, +P of 100% over signals that suffer from (1) non-stationary effects; (2) irregular heartbeats; and (3) low amplitude waves. In addition, the b detection algorithm (based on the detection of a waves) achieved an overall SE of 99.78% and a +P of 99.95% [14].
- For , , and wave detection in PPG signals: The eventogram-based c, d, and e waves detector has three additional steps to the eventogram: two steps at the beginning before applying the eventogram (filtering and removal of segment) and one at the end after applying the eventogram (thresholding). The eventogram is considered to be the feature extraction step. The performance of the eventogram-based c, d, and e waves detector, with ms and ms, was tested on 27 PPG records collected during rest and after two hours of exercise, resulting in 97.39% SE and 99.82% +P [15].
- For S1 and S2 detection in heart sounds: The eventogram-based heart sounds detector has two additional steps to the eventogram: one step at the beginning before applying the eventogram (filtering) and one at the end after applying the eventogram (thresholding). The eventogram is considered to be the feature extraction step. The SE and +P of the eventogram-based S1 and S2 detector, with ms and ms, were 70% and 68%, respectively, in heart sounds collected from children with pulmonary artery hypertension [19].
Finally, eventogram-based detectors succeeded in detecting QRS and T waves in ECG signals, systolic and waves in PPG, and S1 and S2 in heart sounds. Results show that the eventogram-based detectors are promising in terms of computational complexity and efficiency. This paper is considered to be a proof-of-concept work. The proposed visualization method is simple and efficient when applied to ECG and PPG signals; however, it may fail when applied to other signals. As it is a new concept, there is a need to publish the current results and let the scientific community evaluate its performance on their studies.
Presently, the eventogram is tested over one-dimensional biomedical signals collected and analyzed independently, covering temporal and spatial visualization. However, for multiple signals collected simultaneously, there will be a need to test the vectorial and interactive visualizations capability of the eventogram. Note that vectorial visualizations present signals with respect to direction and magnitude, while interactive visualization facilitates efficient interrogation of biomedical signals at different levels of detail. As the core implementation of the eventogram relies mainly on two simple moving averages (fast algorithms), it is expected that there will be no issue in terms of computational efficiency with vectorial and interactive visualizations. Because of the eventogram’s intuitive visualization and computational efficiency, it can be implemented on mobile devices.
The significance of the eventogram comes from incorporating two types of visualization: temporal and spatial. Note that temporal visualizations present signals with respect to time, while spatial visualizations present data in 2D or 3D space. Moreover, the design and implementation of the eventogram set a framework that can be modified in a standard way, as suggested in [23]. In other words, we can consider the eventogram as LEGO building blocks. The eventogram has three main building blocks: generating blocks of interest, noise rejection, and power calculation. Each one of these steps can be modified independently based on the detection problem, which makes the eventogram more flexible, universal, and applicable to achieve high accuracy.
The eventogram offers the advantages of being used as is or can be customized by researchers to build a new and better eventogram following the LEGO analogy (e.g., change the filter type, filter order, moving average type based on their applications). The use of moving averages provides efficient temporal filtering to the processed signal where it is statistically stationary at least over the duration of the moving window. Exploring these findings across different types of signals, such as the optical signal, the communication signal, the geophysical and astrophysical signal, the earth resources signal, the acoustic and vibration signal, the radar signal, and the sonar signal, will improve generalization across the entire signal analysis discipline.
4. Conclusions
Event detection in biomedical signals is an important step before analyzing the corresponding waveform in more detail. A newly introduced visualization algorithm, referred to as the eventogram, depends on two event-related moving averages. The eventogram provides us with important information about the signal, such as the duration of the most dominant event and its morphology. It also provides new information and insight into the processed signal when compared to the traditional signal visualization techniques. Dominant events identified by the eventogram will provide a clearer set of information for clinicians to improve their decision making. Moreover, the performance of the eventogram-based detector is promising, as it has been tested on different databases that contain unusual noise and different waveform morphologies. One of the unique and powerful characteristics of the eventogram is its ability to be applied to different types of biomedical and quasi-periodic signals.
Acknowledgments
Mohamed Elgendi is grateful for the support from Mining for Miracles, BC Children’s Hospital Foundation and Women’s Health Research Centre of British Columbia, Vancouver, British Columbia, Canada.
Conflicts of Interest
The author declares no conflict of interest.
References
- Nicolis, G.; Prigogine, I.; Nocolis, G. Exploring Complexity: An Introduction; W.H. Freeman: New York, NY, USA, 1989. [Google Scholar]
- Lin, J.; Keogh, E.; Lonardi, S. Visualizing and discovering non-trivial patterns in large time series databases. Inf. Vis. 2005, 4, 61–82. [Google Scholar] [CrossRef]
- Wei, L.; Kumar, N.; Lolla, V.; Keogh, E.; Lonardi, S.; Ratanamahatana, C.A.; Van Herle, H. A practical tool for visualizing and data mining medical time series. In Proceedings of the 18th IEEE Symposium on Computer-Based Medical Systems, Dublin, Ireland, 23–24 June 2005; pp. 341–346.
- Mohammad, Y.; Nishida, T. Constrained motif discovery in time series. New Gener. Comput. 2009, 27, 319–346. [Google Scholar] [CrossRef]
- Klimov, D.; Shahar, Y.; Taieb-Maimon, M. Intelligent visualization and exploration of time-oriented data of multiple patients. Artif. Intell. Med. 2010, 49, 11–31. [Google Scholar] [CrossRef] [PubMed]
- Andrienko, G.; Andrienko, N.; Mladenov, M.; Mock, M.; Poelitz, C. Extracting events from spatial time series. In Proceedings of the 14th IEEE International Conference Information Visualisation, London, UK, 26–29 July 2010; pp. 48–53.
- Aguera, P.E.; Jerbi, K.; Caclin, A.; Bertrand, O. ELAN: A software package for analysis and visualization of MEG, EEG, and LFP signals. Comput. Intell. Neurosci. 2011, 2011, 158970. [Google Scholar] [CrossRef] [PubMed]
- Kouzaev, G.A. EM Topological Signaling and Computing. In Applications of Advanced Electromagnetics; Springer: Berlin, Germany, 2013; pp. 413–494. [Google Scholar]
- Li, Y.; Lin, J.; Oates, T. Visualizing Variable-Length Time Series Motifs. In Proceedings of the SIAM International Conference on Data Mining, Anaheim, CA, USA, 26–28 April 2012; pp. 895–906.
- Moody, G.B.; Mark, R.G. The impact of the MIT-BIH Arrhythmia Database. IEEE Eng. Med. Biol. Mag. 2001, 20, 45–50. [Google Scholar] [CrossRef] [PubMed]
- Elgendi, M.; Norton, I.; Brearley, M.; Abbott, D.; Schuurmans, D. Systolic Peak Detection in Acceleration Photoplethysmograms Measured from Emergency Responders in Tropical Conditions. PLoS ONE 2013, 8, e76585. [Google Scholar] [CrossRef] [PubMed] [Green Version]
- Elgendi, M.; Jonkman, M.; De Boer, F. Measurement of a-a Intervals at Rest in the Second Derivative Plethysmogram. In Proceedings of the 2009 International Symposium on Bioelectronics and Bioinformatics, Melbourne, Australia, 9–11 December 2009; Fang, Q., Cosic, I., Eds.; RMIT University, School of Electrical and Computer Engineering: Melbourne, Australia, 2009; pp. 67–79. [Google Scholar]
- Elgendi, M.; Jonkman, M.; De Boer, F. Heart Rate Variability Measurement Using the Second Derivative Photoplethysmogram. In Proceedings of the 3rd International Conference on Bio-inspired Systems and Signal Processing (BIOSIGNALS2010), Valencia, Spain, 20–23 January 2010; pp. 82–87.
- Elgendi, M.; Norton, I.; Brearley, M.; Abbott, D.; Schuurmans, D. Detection of a and b waves in the acceleration photoplethysmogram. Biomed. Eng. Online 2014, 13, 139. [Google Scholar] [CrossRef] [PubMed]
- Elgendi, M. Detection of c, d, and e waves in the acceleration photoplethysmogram. Comput. Methods Programs Biomed. 2014, 117, 125–136. [Google Scholar] [CrossRef] [PubMed]
- Elgendi, M.; Jonkman, M.; De Boer, F. Frequency Bands Effects on QRS Detection. In Proceedings of the 3rd International Conference on Bio-inspired Systems and Signal Processing (BIOSIGNALS2010), Valencia, Spain, 20–23 January 2010; pp. 428–431.
- Elgendi, M. Fast QRS Detection with an Optimized Knowledge-Based Method: Evaluation on 11 Standard ECG Databases. PLoS ONE 2013, 8, e73557. [Google Scholar] [CrossRef] [PubMed]
- Elgendi, M.; Eskofier, B.; Abbott, D. Fast T Wave Detection Calibrated by Clinical Knowledge with Annotation of P and T Waves. Sensors 2015, 15, 17693. [Google Scholar] [CrossRef] [PubMed]
- Elgendi, M.; Kumar, S.; Guo, L.; Rutledge, J.; Coe, J.Y.; Zemp, R.; Schuurmans, D.; Adatia, I. Detection of Heart Sounds in Children with and without Pulmonary Arterial Hypertension—Daubechies Wavelets Approach. PLoS ONE 2015, 10, e0143146. [Google Scholar] [CrossRef] [PubMed]
- Kania, M.; Fereniec, M.; Maniewski, R. Wavelet denoising for multi-lead high resolution ECG signals. Meas. Sci. Rev. 2007, 7, 30–33. [Google Scholar]
- Eckmann, J.P.; Kamphorst, S.O.; Ruelle, D. Recurrence Plots of Dynamical Systems. Europhys. Lett. 1987, 4, 973. [Google Scholar] [CrossRef]
- Braunwald, E.; Zipes, D.; Libby, P.; Bonow, R. Braunwald’s Heart Disease: A Textbook of Cardiovascular Medicine, 7th ed.; Saunders: Philadelphia, PA, USA, 2004. [Google Scholar]
- Bond, R.R.; Finlay, D.D.; Nugent, C.D.; Moore, G.; Guldenring, D. Methods for presenting and visualising electrocardiographic data: From temporal signals to spatial imaging. J. Electrocardiol. 2013, 46, 182–196. [Google Scholar] [CrossRef] [PubMed]
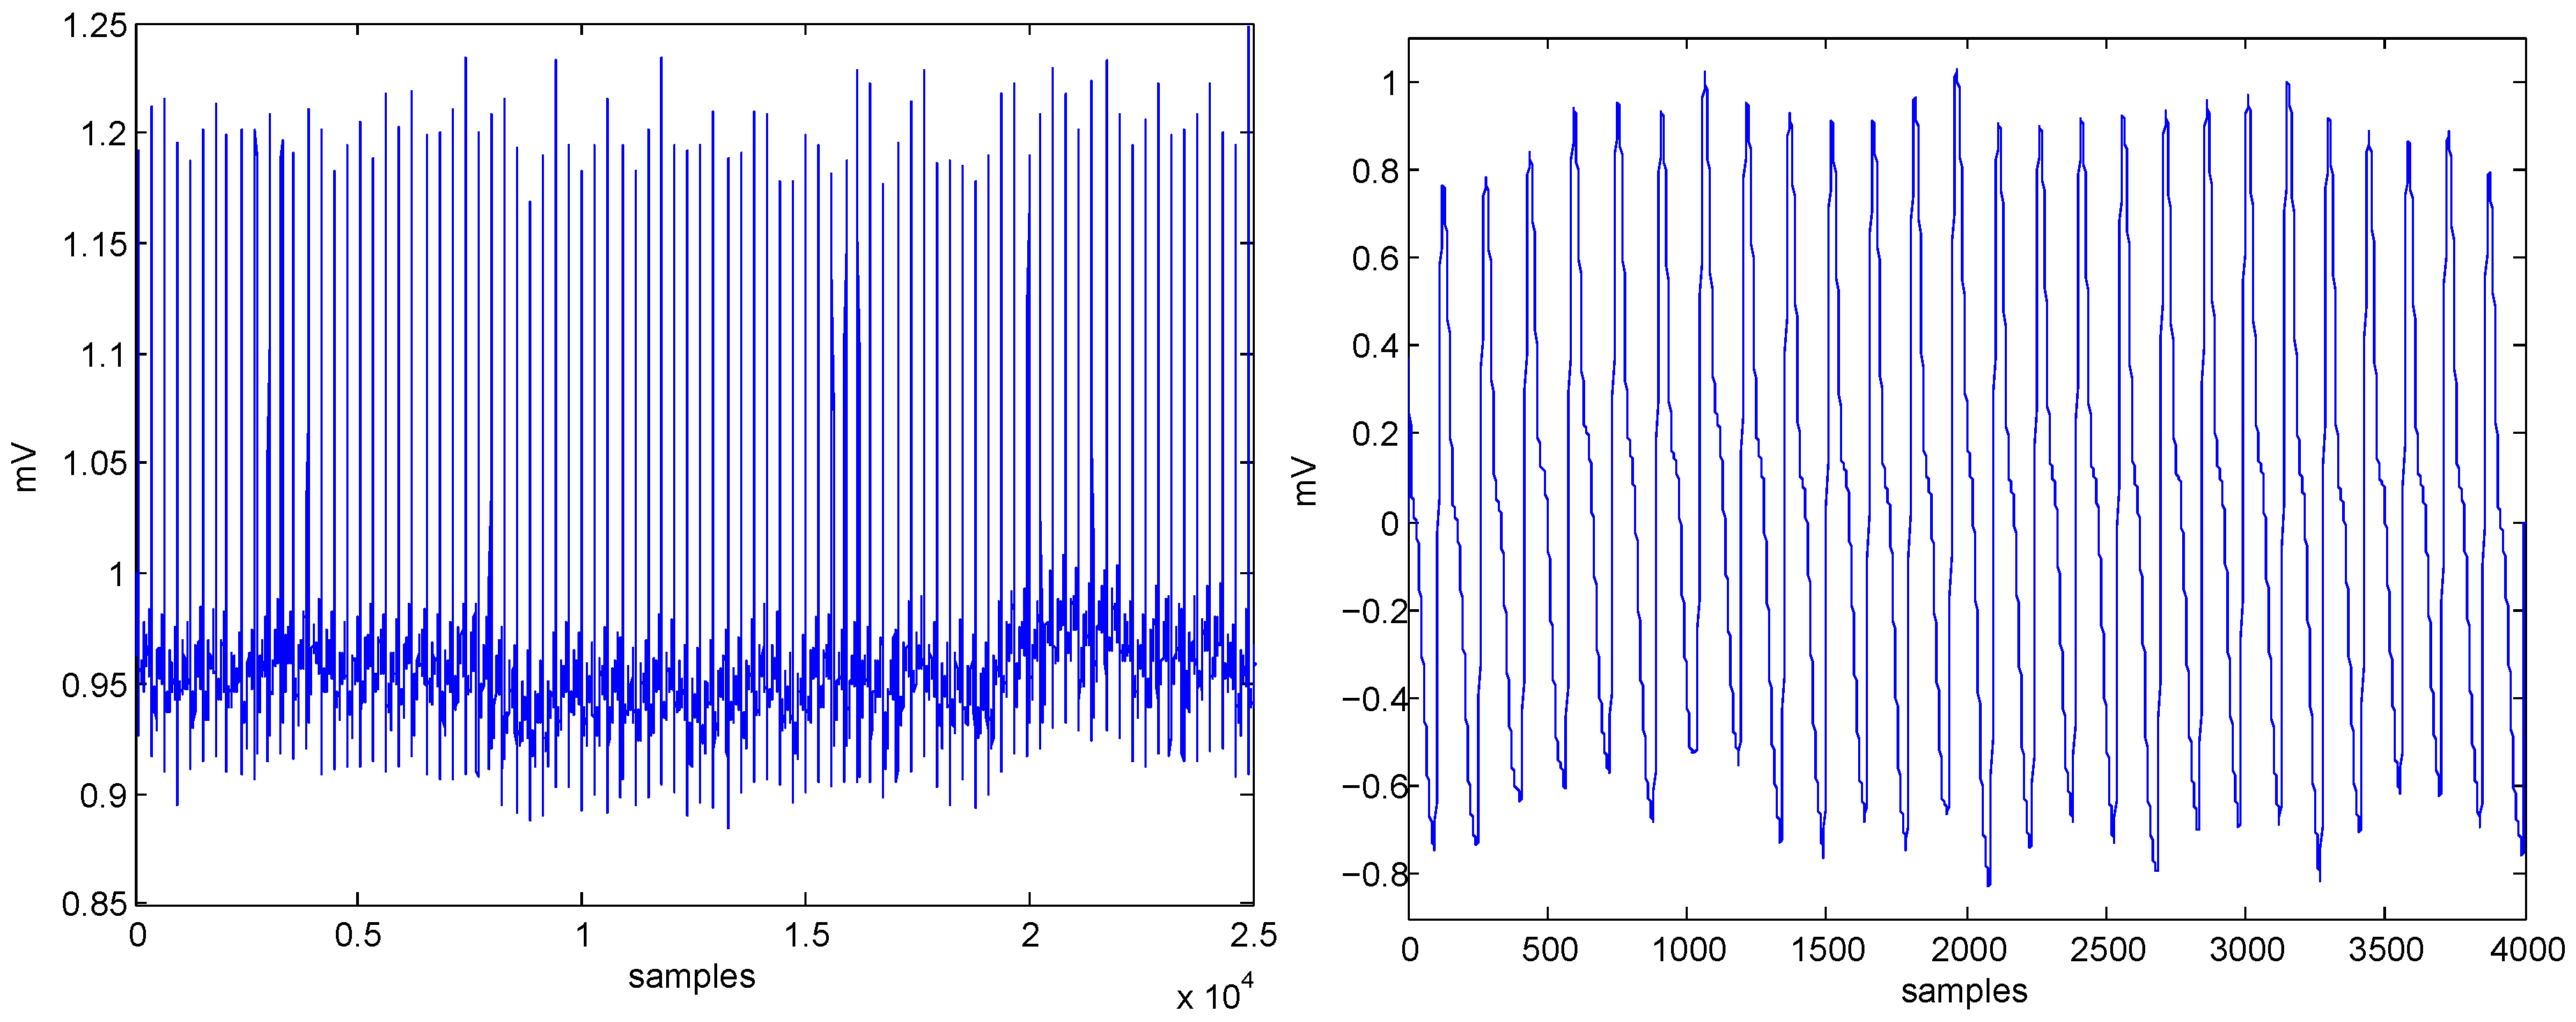
Figure 1.
Data used in the analysis ECG signal (left) and PPG signal (right). Note, ECG stands for electrocardiogram while PPG stands for photoplethysmogram.
Figure 1.
Data used in the analysis ECG signal (left) and PPG signal (right). Note, ECG stands for electrocardiogram while PPG stands for photoplethysmogram.

Figure 2.
Flowchart for generating an eventogram. Generating an eventogram consists of four main stages: feature extraction (generating potential blocks using two moving averages), noisy events rejection, power calculation, and image display.
Figure 2.
Flowchart for generating an eventogram. Generating an eventogram consists of four main stages: feature extraction (generating potential blocks using two moving averages), noisy events rejection, power calculation, and image display.

Figure 3.
Periodogram for ECG signal (left) and PPG signal (right) shown in Figure 1.
Figure 3.
Periodogram for ECG signal (left) and PPG signal (right) shown in Figure 1.
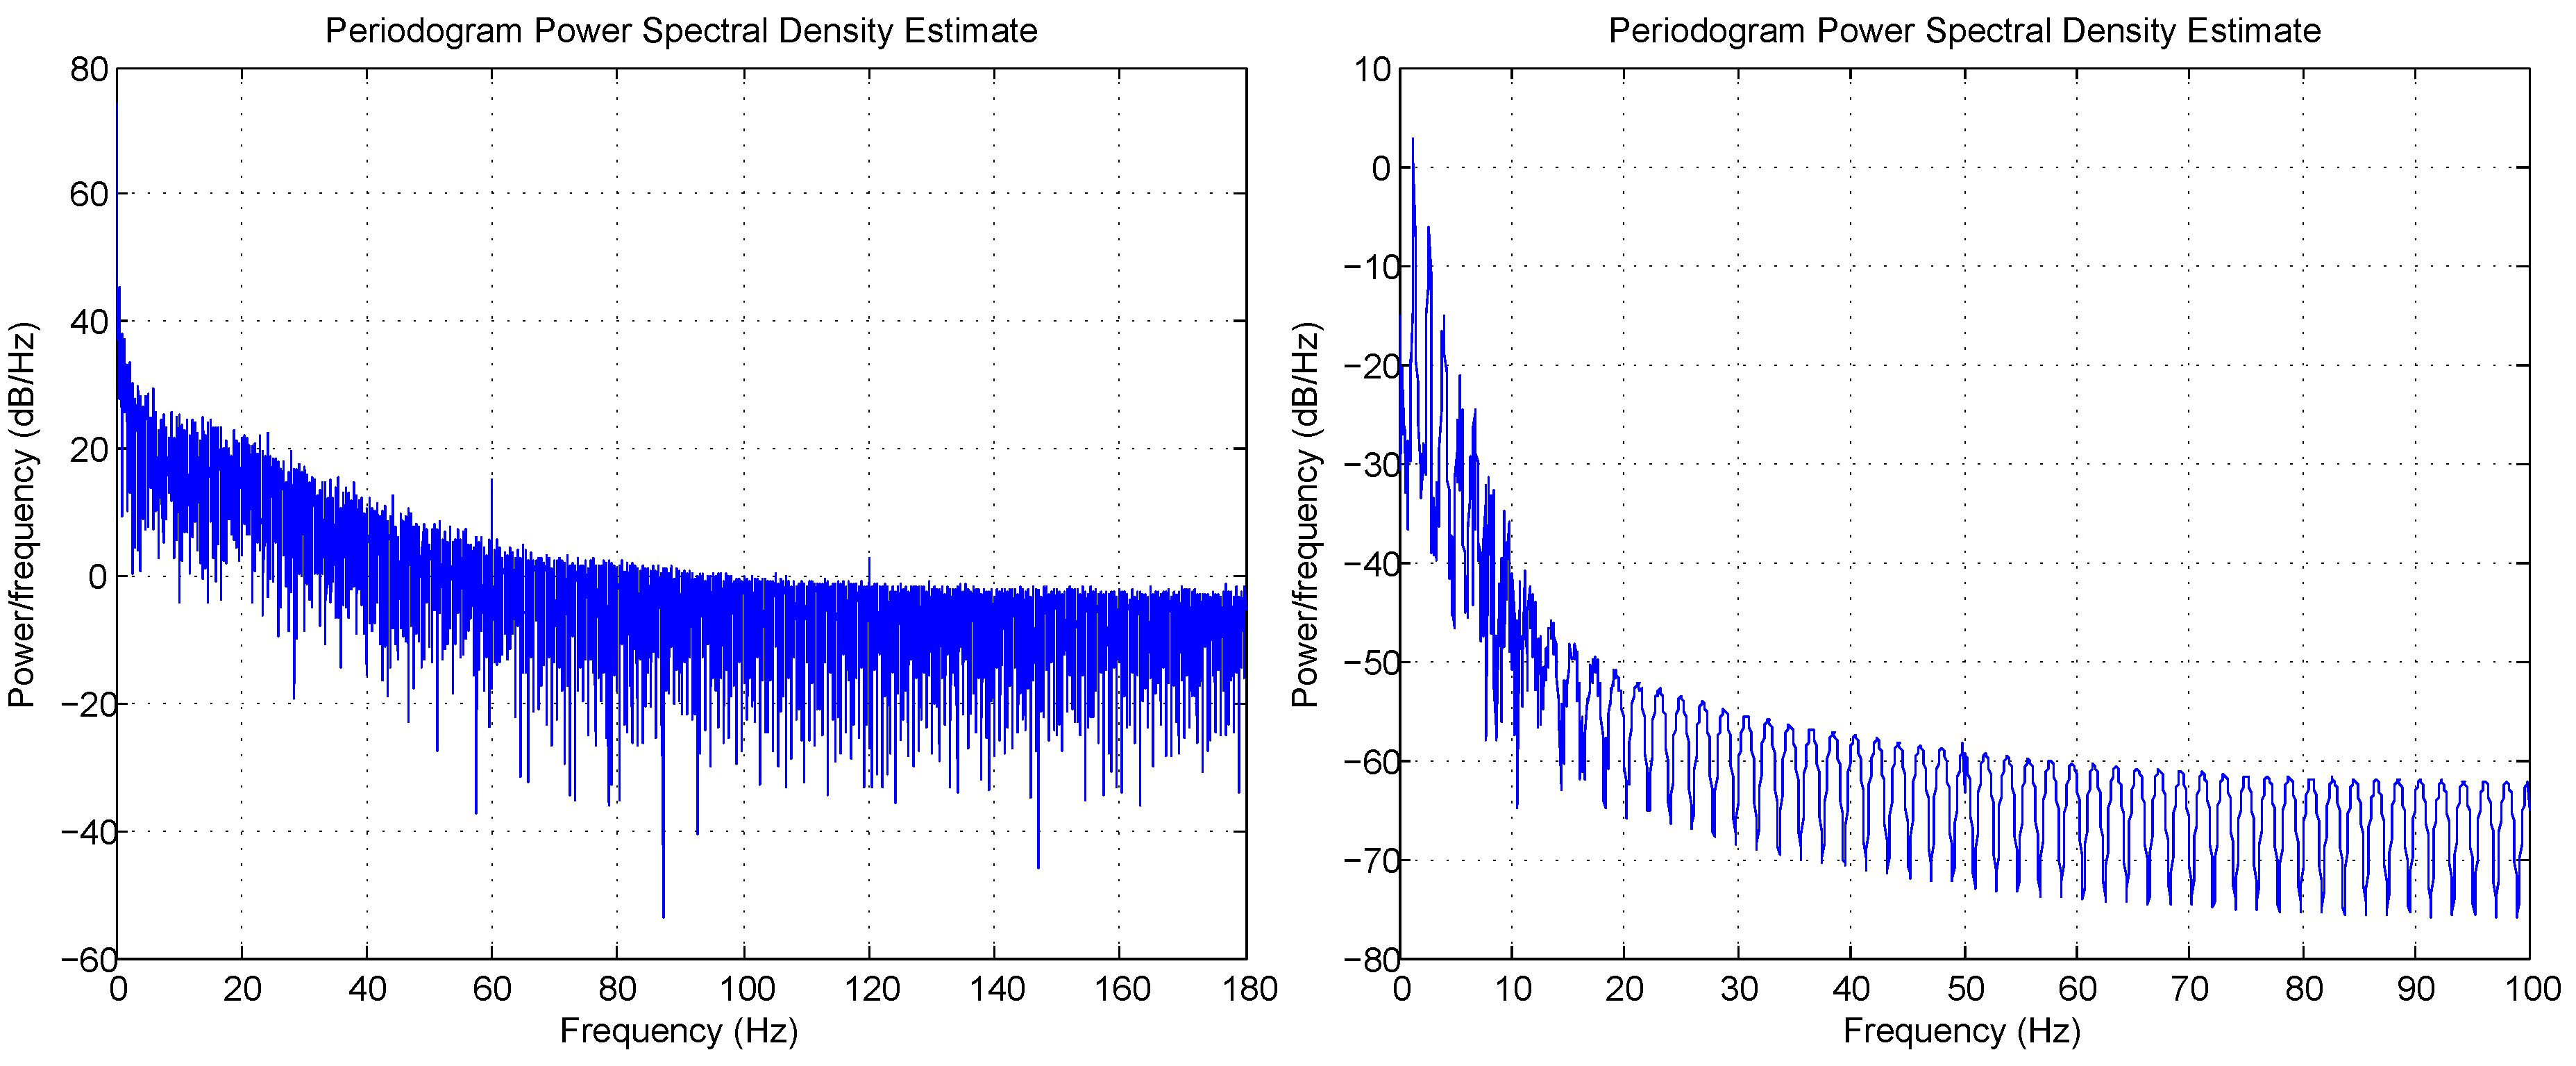
Figure 4.
Spectrogram for ECG signal (left) and PPG signal (right) shown in Figure 1.
Figure 4.
Spectrogram for ECG signal (left) and PPG signal (right) shown in Figure 1.

Figure 5.
Wavelet for ECG signal (left) and PPG signal (right) shown in Figure 1.
Figure 5.
Wavelet for ECG signal (left) and PPG signal (right) shown in Figure 1.

Figure 6.
Eventogram for ECG signal (left) and PPG signal (right) shown in Figure 1. The red color indicates strong dominance of a main event while the blue color indicates non-existence of a main event. The eventogram is stored as a two-dimensional (-by-) array of integers in the range [1, length(colormap)]; colormap is a -by-3 matrix of real numbers between and . The eventogram returns the index value in terms of and for the most dominant event that is associated with the red color or RGB (0.5,0,0)—the RGB color model is an additive color model in which red, green, and blue light are added together in various ways to reproduce a broad array of colors.

Figure 7.
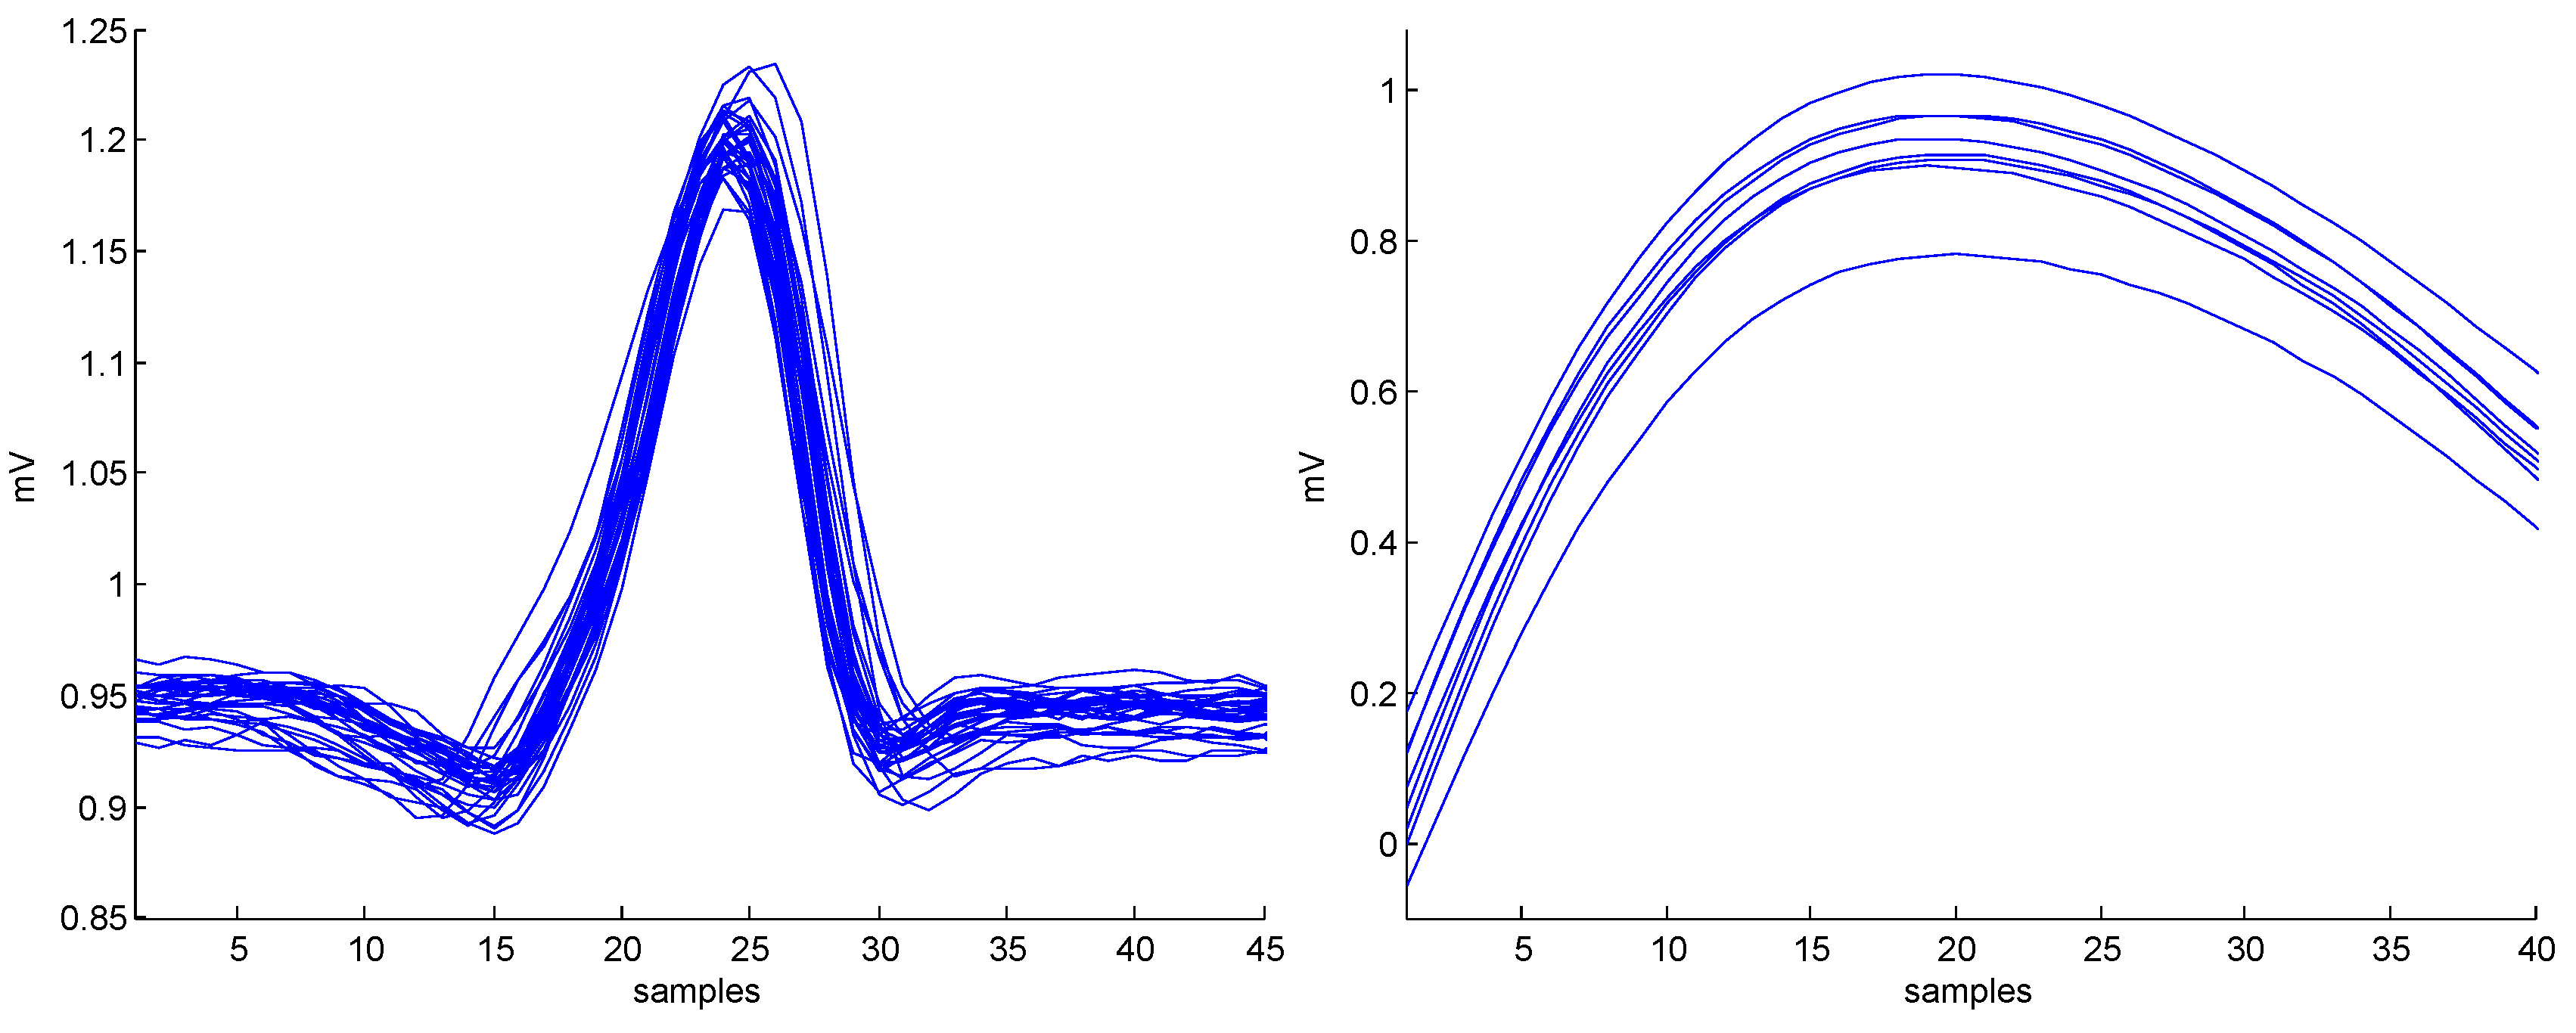
The main events (superimposed) detected by the eventograms shown in Figure 6 based on the highest value of power scored with and for the ECG (left) and the PPG (right) signals shown in Figure 1. Note, ECG stands for electrocardiogram while PPG stands for photoplethysmogram.

Figure 8.
Examples of eventogram output using ECG signals. (a) normal beats; (b) paced beats; (c) left bundle branch block beats; and (d) noisy ECG signal. The red color indicates strong dominance of a main event while the blue color indicates non-existence of a main event. The eventogram is stored as a two-dimensional (-by-) array of integers in the range [1, length(colormap)]; colormap is a -by-3 matrix of real numbers between and . The eventogram returns the index value in terms of and for the most dominant event that is associated with the red color or RGB (0.5,0,0).

Figure 9.
Examples of eventogram output using PPG signals. (a) PPG waveforms with Salient dicrotic notch; (b) PPG waveforms with a nonsalient dicrotic notch; (c) PPG signal measured after simulated heat stress; and (d) noisy PPG signal. The red color indicates strong dominance of a main event while the blue color indicates non-existence of a main event. The eventogram is stored as a two-dimensional (-by-) array of integers in the range [1, length(colormap)]; colormap is a -by-3 matrix of real numbers between and . The eventogram returns the index value in terms of and for the most dominant event that is associated with the red color or RGB (0.5,0,0).
© 2016 by the author; licensee MDPI, Basel, Switzerland. This article is an open access article distributed under the terms and conditions of the Creative Commons Attribution (CC-BY) license (http://creativecommons.org/licenses/by/4.0/).
Share and Cite
MDPI and ACS Style
Elgendi, M. Eventogram: A Visual Representation of Main Events in Biomedical Signals. Bioengineering 2016, 3, 22. https://doi.org/10.3390/bioengineering3040022
AMA Style
Elgendi M. Eventogram: A Visual Representation of Main Events in Biomedical Signals. Bioengineering. 2016; 3(4):22. https://doi.org/10.3390/bioengineering3040022
Chicago/Turabian StyleElgendi, Mohamed. 2016. "Eventogram: A Visual Representation of Main Events in Biomedical Signals" Bioengineering 3, no. 4: 22. https://doi.org/10.3390/bioengineering3040022
Note that from the first issue of 2016, this journal uses article numbers instead of page numbers. See further details here.