Article

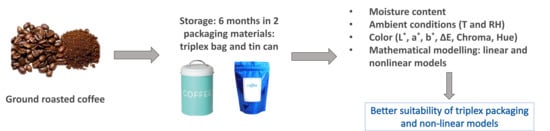
Regression Models for Description of Roasted Ground Coffee Powder Color Change during Secondary Shelf-Life as Related to Storage Conditions and Packaging Material

by
Maja Benković
* and
Ana Jurinjak Tušek
Faculty of Food Technology and Biotechnology, University of Zagreb, Pierottijeva 6, 10000 Zagreb, Croatia
*
Author to whom correspondence should be addressed.
Beverages 2018, 4(1), 16; https://doi.org/10.3390/beverages4010016
Submission received: 20 December 2017 / Revised: 10 January 2018 / Accepted: 19 January 2018 / Published: 19 February 2018
(This article belongs to the Special Issue Beverage Powder)

Abstract

:
Besides sensory attributes, color is a parameter affecting consumers’ perception of the powdered coffee product or brew. The aim of this study was to develop and compare non-linear and linear regression models for the description of experimentally determined color changes during 6 months of storage in two different packaging materials. Model parameters were estimated using two software packages: Eureqa Formulize (Nutonian, Inc., Boston, MA, USA) and Statistica 10.0 (StatSoft, Palo Alto, CA, USA) and compared based on their R2 goodness of fit. Both non-linear and linear models used in this study pointed to a significant influence of intrinsic (sample moisture content) and external (relative humidity (RH) and temperature) factors on ground roasted coffee color change. Non-linear model was the most suitable for description of color changes during storage. Based on lower moisture sorption of the sample packed in triplex bag, triplex packaging is proposed as the more suitable one.

Graphical Abstract

1. Introduction

Ground roasted coffee, due to its exquisite taste, aroma and psychoactive properties, represents the most widely used traditional beverage. It is consumed on regular basis as part of a daily routine by many people, mostly due to the stimulatory effect of caffeine. However, it also contains carbohydrates, lipids, vitamins, minerals, and phenolic compounds with numerous health effects. When discussing the health effect of coffee, numerous conflicting research findings have arisen [1]. For example, high levels of caffeine cause a rise in blood pressure and increased metabolic rate, which can have a negative impact on the overall physiological state. On the other hand, polyphenolic compounds present in coffee, mostly chlorgenic acid, is known for its beneficial health effects such as reduction of blood pressure and anti-inflammatory effects [2].
The quality of coffee is strictly related to the chemical composition of the coffee beans, which is affected by factors such as growth climate, and harvesting and post-harvesting conditions (drying, roasting, grinding, and storage) [3]. After initial harvesting and drying, coffee beans are subjected to roasting and, subsequently, grinding. One of the methods used for the assessment of coffee quality and the progress of the roasting procedure is color analysis [4]. Besides roasting, color analysis can also be used as a quality predictor during secondary shelf life, where, due to package opening and susceptibility to ambient light, air and temperature, coffee degradation reactions can occur [5]. Prediction of changes occurring in coffee products during storage is of great importance since these changes have the greatest influence on the consumers’ perception on the product quality. Furthermore, consumers’ perception and sensory evaluation of coffee is not related solely to aroma and odor, but also to the color and appearance of the coffee powder as well as the prepared brew [6,7].
Color degradation in different food products during processing and storage has been widely studied. Most of these studies refer to color degradation in relation to processing conditions [8,9,10,11], while some of them are oriented towards creating kinetic models for color degradation which occur during storage [5,12,13]. The importance of modelling the secondary shelf life of food products in general, lies in the understanding of their behavior after package opening and, thus, optimizing their properties, quality, and packaging material in order to maximize its shelf life, where the role of prediction models is especially emphasized [5].
The aim of this study was to develop and compare regression models for experimentally determined color changes during 6 months of storage of ground and roasted coffee packed in two types of packaging: tin cans and triplex (PE/Al/ PET) bags. Linear and non-linear regression models were proposed for changes in L*, a*, b*, ΔE, Chroma, and Hue. Model parameters were estimated using two software packages: Eureqa Formulize (Nutonian, Inc., Boston, MA, USA) and Statistica 10.0 (StatSoft, Palo Alto, CA, USA). The obtained models were compared based on their R2 goodness of fit.

2. Materials and Methods

2.1. Ground Coffee Samples

Ground roasted coffee samples were obtained from Frank d.o.o. (Zagreb, Croatia). Samples were originally packed in two types of packaging: tin cans (L1KMK) and triplex (PE/Al/PET) bags (V1KMK). After the first package opening, samples were stored at ambient conditions in a dark cupboard, in order to simulate home storage. Packaging was opened once a month, for 6 subsequent months of storage, during which moisture content of the samples, relative air humidity, air temperature, and color parameters were determined.

2.2. Moisture Content

Moisture content was determined according to the modified method of Haugaard–Sørensen et al. [14]. Samples were dried at 105 °C for 3 h in an oven dryer (INKO, Zagreb, Croatia) and weighed on an analytical balance (Sartorius, Göttingen, Germany) prior to and after drying. The difference in weight before and after drying was recorded as the mass of the water contained in the sample. Measurements were done in triplicate.

2.3. Ambient Conditions

During each color measurement, ambient conditions (relative air humidity—RH and air temperature—T) were recorded using a digital multimeter (Hyundai corp., Seoul, Korea). Measurements were done in triplicate.

2.4. Color Measurements

Color measurements were performed using the CM-700d spectrophotometer (Konica Minolta Sensing INC., Osaka, Japan). Prior to measurement white calibration was conducted using a white calibration plate supplied by the manufacturer. Color was recorded based on the CIE-lab L*, a*, b* scale throughout 6 months of storage. According to Bicho et al. [4] and McGuire [15], the coordinated L* represents lightness (contribution of black or white varying between 0 and 100), a* represents the contribution of green and red (positive or negative), and b* represents the contribution of blue or yellow (negative or positive). Besides L*, a* and b* values, total color difference, Chroma and Hue angle were calculated according to Equation (1) (ΔE), Equation (2) (Chroma) and Equation (3) (Hue angle):
Δ E = ( L * 0 L * ) 2 + ( a * 0 a * ) 2 + ( b * 0 b * ) 2
C h r o m a =   ( a 2 + b 2 )
H u e   a n g l e = tan 1 ( b / a )
where subscript “0” refers to the initial color reading of the sample after the first package opening [16,17,18]. All measurements were done in triplicate.

2.5. Nonlinear Regression Models

To describe the coffee color components (L*, a*, b*, ∆E, Chroma, Hue angle) change during storage, non-linear regression models were proposed. Color components change was modelled as a function of sample moisture content SMC (%), relative air humidity, RH (%), and air temperature, T (°C) (Equations (4) and (5)). Regression models for two packaging types were proposed.
c o l o u r c o m p o n e n t s = f ( S M C , R H , T )
c o l o u r c o m p o n e n t s = b 0 S M C b 1 R H b 2 T b 3
Parameters of nonlinear regression models were estimated using evolution algorithm implemented in Eureqa Formulize 0.96 Beta (Nutonian INC, Boston, MA, USA) and Levenberg-Marquardt algorithm implemented in Statistica 10.0 (StatSoft, Palo Alto, CA, USA). Evolutionary algorithms are heuristics inspired by Darwin’s theory of evolution. They use the principles of selection and reproduction of the best adapted individuals. The aim of an evolutionary algorithm is to optimize a given objective function F over a given search space. F is called the fitness function. Algorithm creates a population of “individuals”, where each individual is a set of parameters in the search space [19]. The Levenberg-Marquardt algorithm ensures numerical solutions in function parameter space using the least squares method. Calculation in Statistica 10.0 was performed with 50 iterations with convergence of 10−6 and confidence interval of 95%.

2.6. Linear Regression Models

Natural logarithm form of Equation (5) was used to obtain linear regression models for description of color components change (Equation (6)).
ln ( c o l o u r c o m p o n e n t s c h a n g e ) = β 0 + β 1 ln ( S M C ) + β 2 ln ( R H ) + β 3 ln ( T )
Parameters of linear regression models were also estimated using the evolutionary algorithm implemented into the Eureqa Formulize 0.96 Beta (Nutonian, INC) and using the least squares algorithm implemented into the Statistica 10.0 (StatSoft, Palo Alto, CA, USA).

3. Results and Discussion

3.1. Experimental Data

One of the main characteristics of coffee is a significant change in color during the roasting process [20]. After roasting, ground roasted coffee samples can be classified according to their color as light (L* > 35), medium (25 < L* < 35), or dark (L* < 25) roast [21]. During secondary shelf-life, changes occur in lipid composition, which affect sensory properties and color of the coffee. Furthermore, while during roasting temperature and exposure time play a crucial role in sensory and color changes, during storage moisture content, relative humidity and temperature seem to be the most important degradation factors [22]. Experimental data determined during 6 months of storage of ground roasted coffee samples is shown in Table 1.
Based on the experimental data shown in Table 1, L* values of all ground roasted coffee samples ranged from medium to dark roast. a* values ranged from 11.00 to 12.62 for the coffee sample packed in triplex bag; and between 11.25 and 12.46 for coffee sample packed in tin can, which was slightly higher in comparison to the triplex bag sample. a* and b* values for both packaging materials were positive and concentrated near the center of the planar plane, exhibiting the dominant red and yellow components of the tested samples. The sample packed in triplex bag exhibited a decrease in a* values, while the coffee sample packed in the tin can exhibited the opposite effect. Both samples exhibited a decrease in b* values. According to Rendon et al. [23], an increase in L*, a* and b* values during storage of roasted coffee beans was observed, which means that the brown color component fades during storage. In this case, different behavior of the a* color parameter can be attributed to different packaging material. According to Kallio et al. [24], types of packaging and permeability of packaging are of primary importance when coffee storage stability is addressed. When stored in a permeable package, coffee is especially subjected to rapid changes, mostly in the contents of volatile compounds responsible for its aroma.
During total color change calculation, L*, a* and b* parameters determined immediately after the first package opening were used as reference values. As shown in Table 1, total color difference was more pronounced for the coffee sample packed in the triplex bag.
The Chroma value indicates the degree of saturation of color and is proportional to the strength of the color [18]. Chroma values decreased for both packaging materials used in this study, with a more pronounced decrease for triplex bag packaging.
The Hue angle is another parameter frequently used to characterize color in food products. An angle of 0° or 360° represents red Hue, while angles of 90°, 180° and 270° represent yellow, green and blue Hue, respectively [16]. Hue angle of the coffee samples determined in this study, expressed in degrees, ranged from approximately 55° to 60°, which corresponded to the red Hue.
Moisture content values exhibited a consecutive rise throughout storage. The coffee sample packed in the tin can absorbed higher amounts of moisture due to larger headspace air volume present in the tin can packaging. The presence of air in the headspace is also known to contribute to a loss of coffee flavor [25]. Ambient conditions (relative humidity and temperature values) are also listed in Table 1, and were used for regression modelling, together with the moisture content measured directly in the samples by an oven drying method.

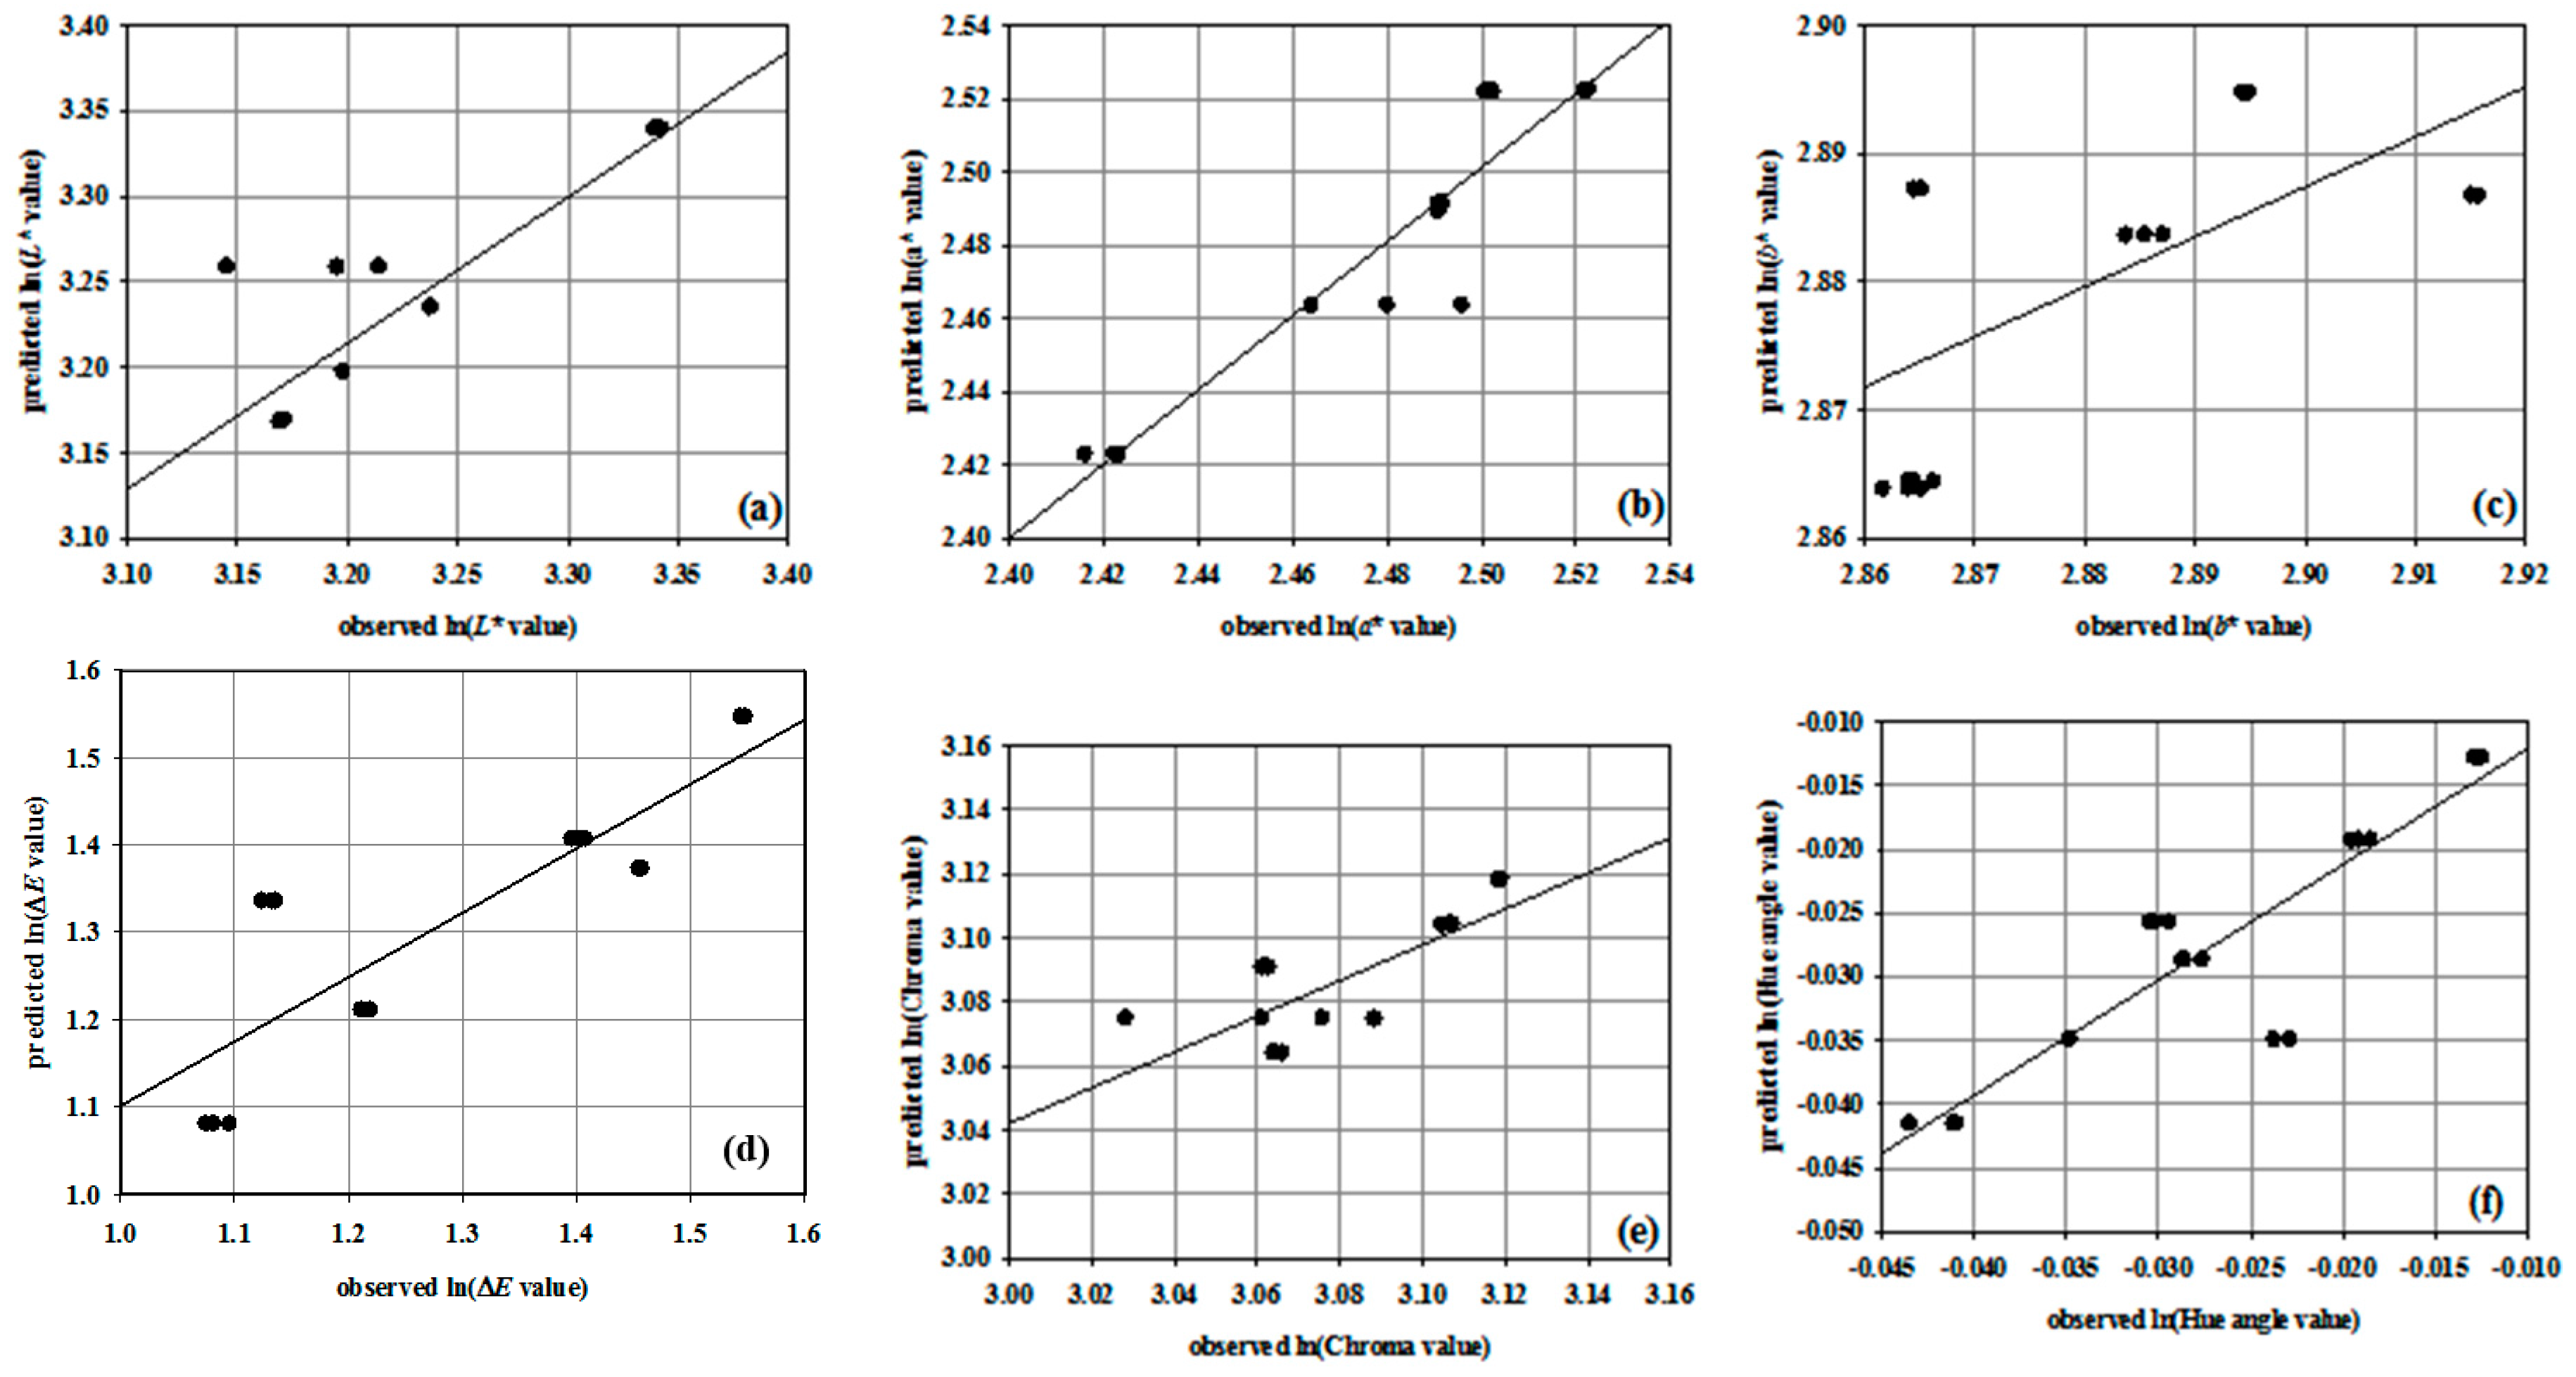
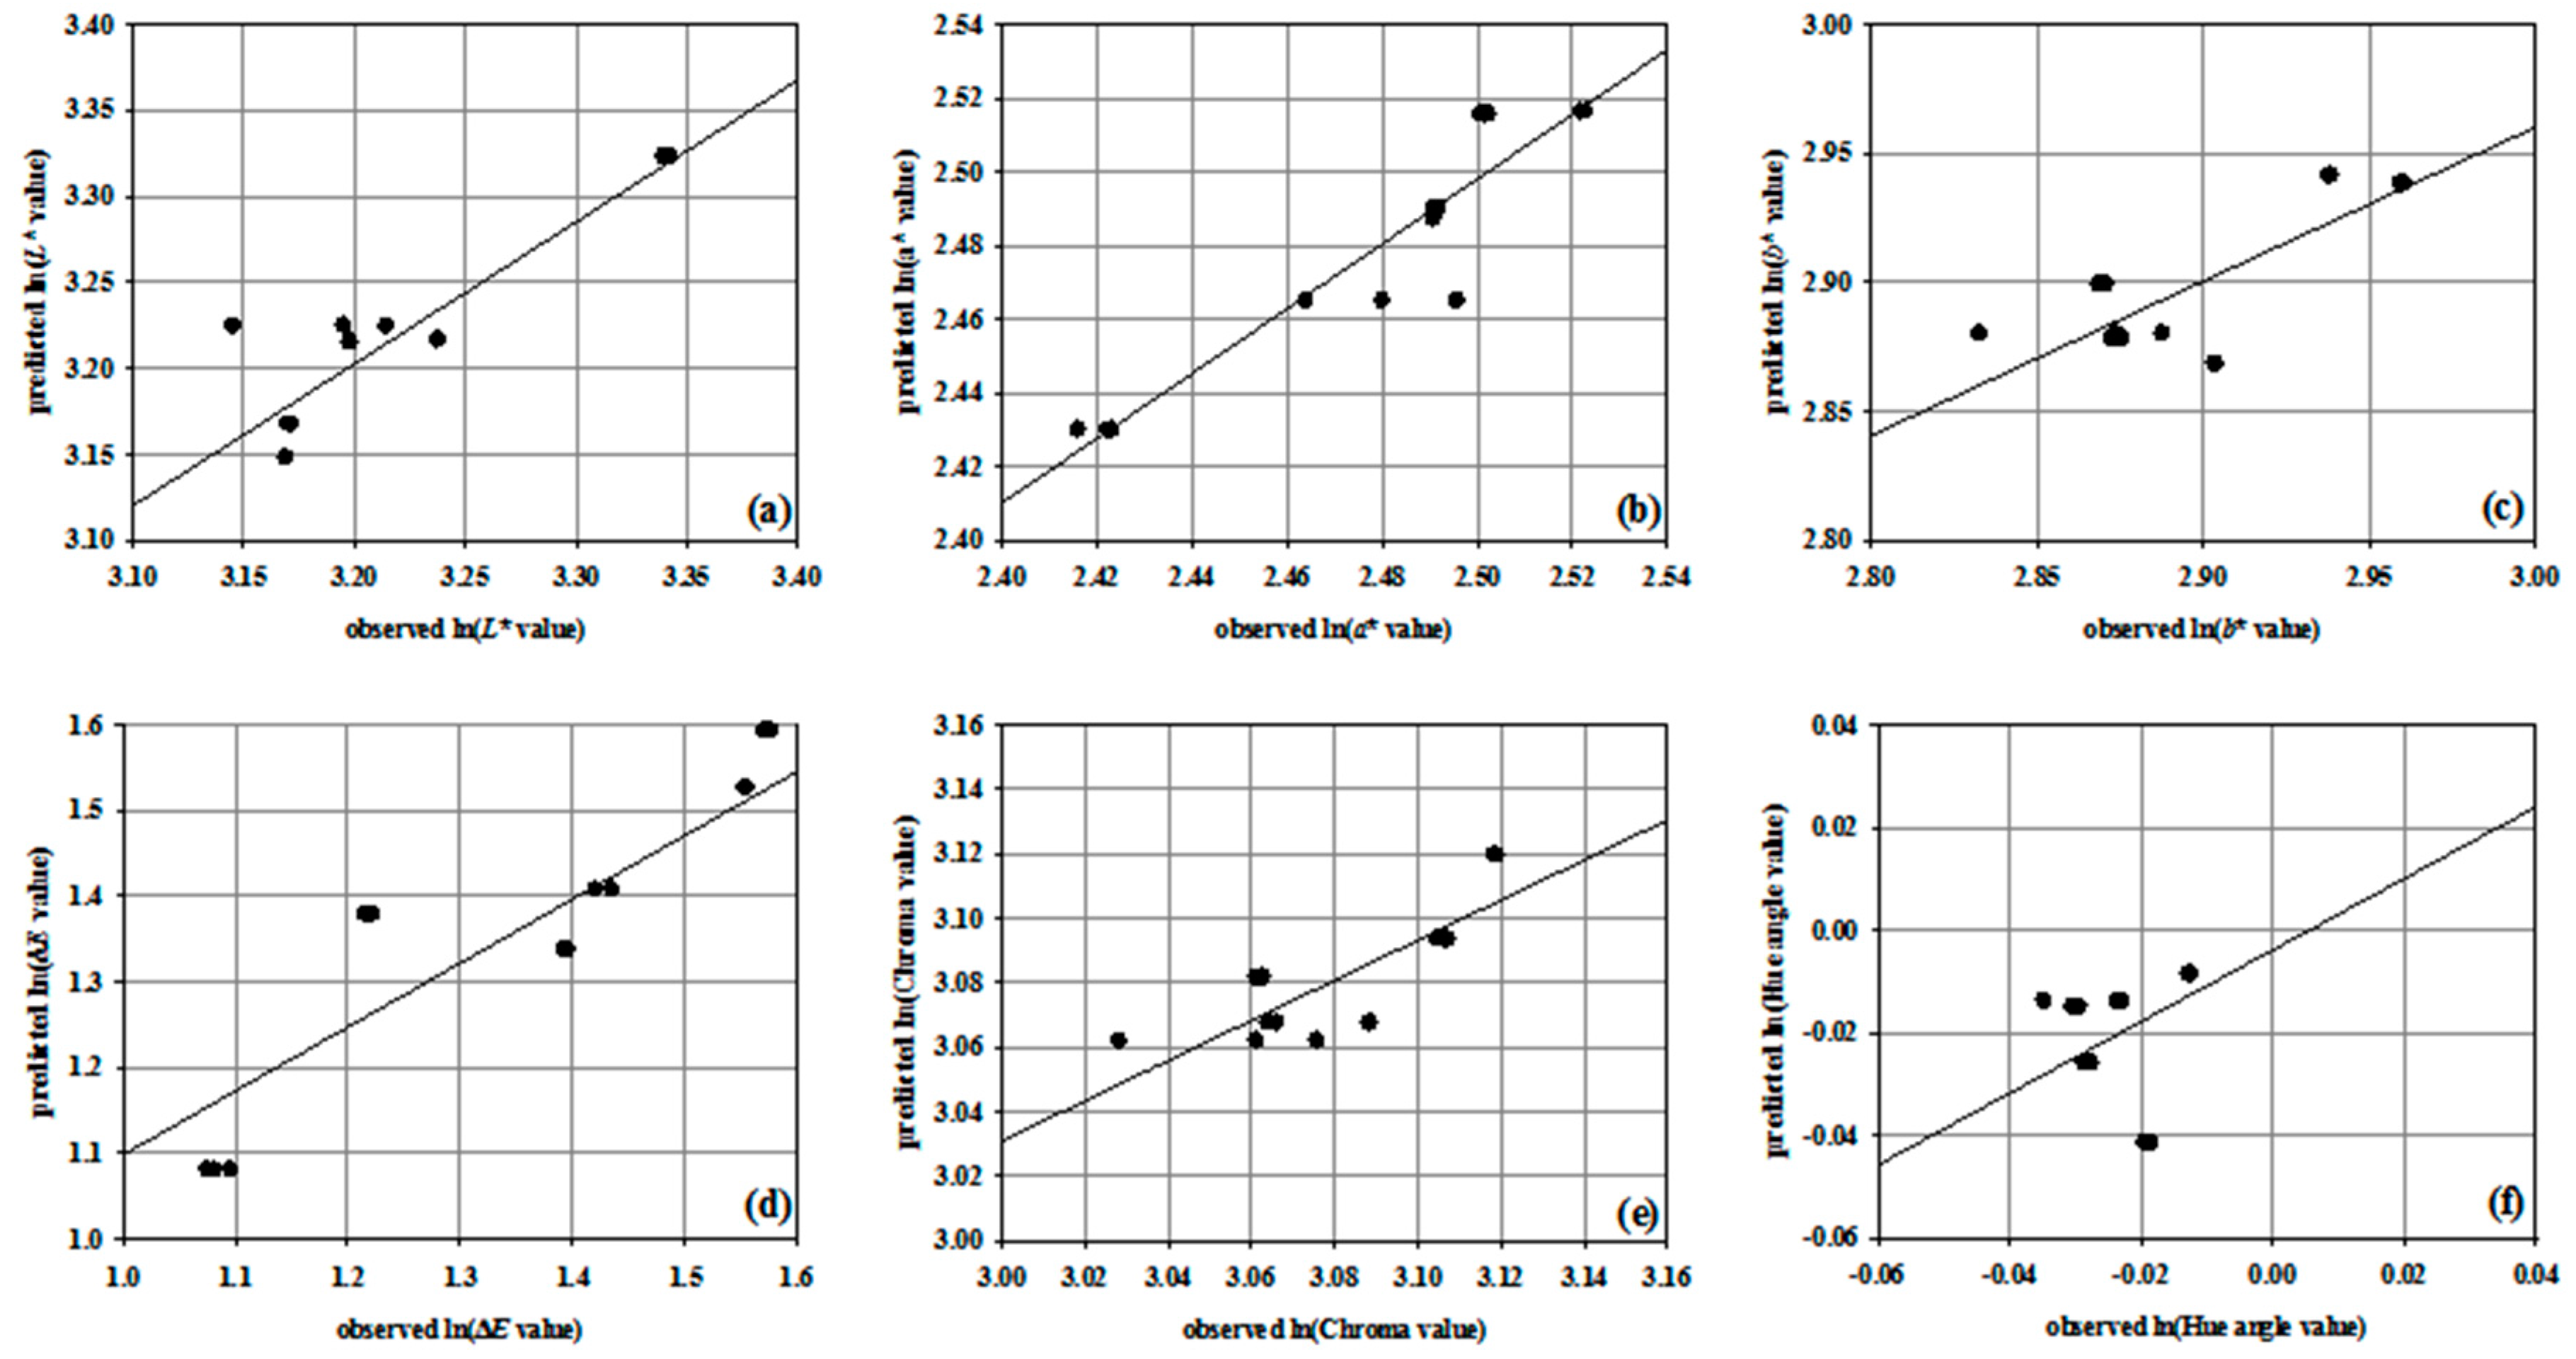
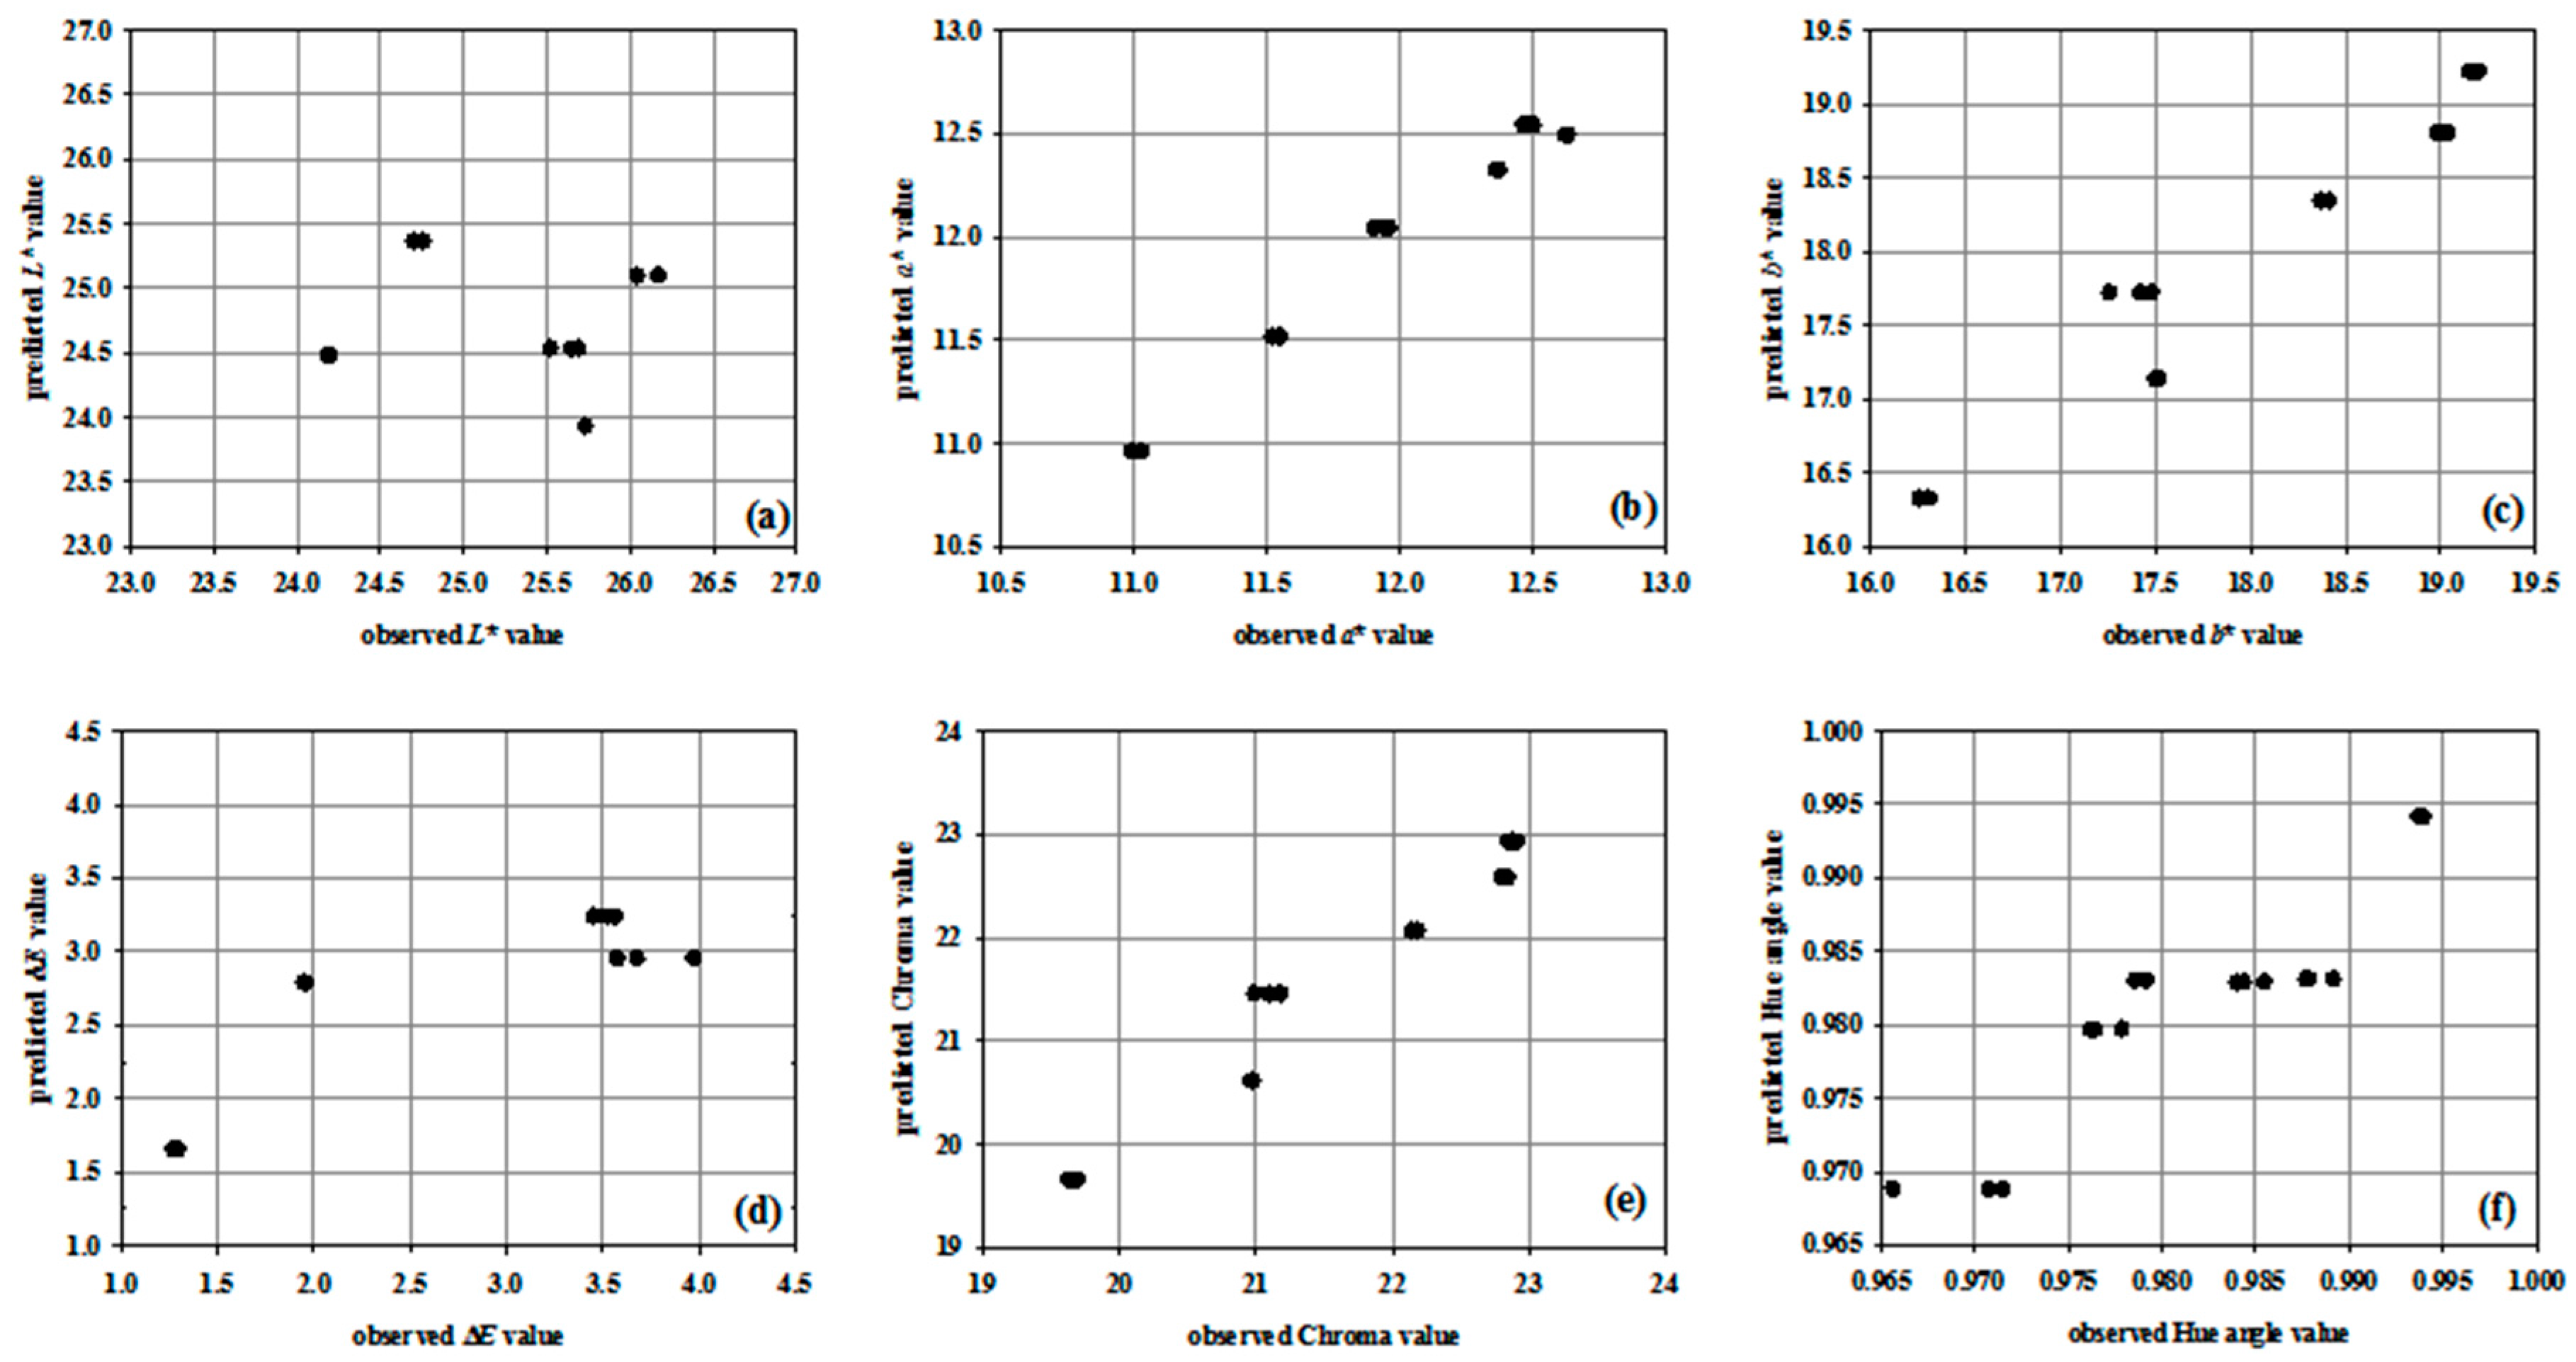
3.2. Non-Linear Regression Models

To analyze how the color components (L*, a*, b*, ΔE, Chroma, and Hue angle) of the roasted ground coffee change during secondary shelf-life, regression models were proposed. According to Equation (4) change in the color components depends on the sample moisture content, relative air humidity and air temperature. The influence of the packaging was also taken into account and regression models were developed for each packaging material separately. Parameters of both non-linear and linear regression models were estimated using two numerical methods, evolutionary algorithm implemented into the Eureqa Formulize software, and the least square algorithm implemented into the Statistica 10.0. software. The estimated values of model parameters are presented in Table 2, Table 3, Table 4 and Table 5 and results of the dispersion of color components in comparison to model predictions are presented in Figure 1, Figure 2, Figure 3 and Figure 4.
Eureqa Formulize estimated the model parameter values using an evolutionary algorithm. Evolutionary algorithms use mechanisms inspired by biological evolution (e.g., reproduction, mutation, recombination, etc.) and depend on the performance of the individual structures. Each individual in the population receives a measure of its fitness in the environment and selection focuses attention on high fitness individuals exploiting the available fitness information. On the other hand, the least square method is based on the minimization of the sum of squared residuals, with residuals being the differences between an observed data and model predicted results. In the case of non-linear regression, the Levenberg-Marquardt (LM) algorithm was applied. The Levenberg-Marquardt algorithm is an iterative technique that locates the minimum of the multivariate function that is expressed as a sum of squares of non-linear real-valued functions [26,27,28].
The non-linear regression model coefficients describing the color components change during storage of the L1KMK coffee sample packed in tin can are presented in Table 2 and Table 3. Results presented in Table 2 were obtained using evolutionary algorithm implemented into Eureqa Formulize. By comparison of the obtained R2 values, it was noticed that the best agreement between experimental data and model was obtained for the a* color component with R2 = 0.842. The smallest value of R2 was obtained for the Hue angle R2 = 0.488. Eureqa Formulize works on a concept of development of the best possible fit to describe the defined set of the experimental data. In most cases obtained models are over parameterized and applicable only on the tested data set. Due to that, in this work predefined expressions (non-linear and linear) were used to describe the color components change during storage. When using the Eureqa Formulize software it is not possible to get information about the error of the estimation of the parameters and their significance. To overcome the mentioned limitations Stataistica 10.0 was used.
Parameters of the non-linear regression model for the color change during storage of L1KMK coffee sample packed in tin can were estimated using Statistica 10.0, are given in Table 3. By analyzing the obtained p-values, it can be seen that all estimated parameters were significant for models describing L*, b*, Chroma and Hue angle. In case of model describing a*, p-value indicated that the b2 parameter value was not significant. This parameter was connected to the relative air humidity in the model. Interestingly, in the case of ΔE there was only one significant parameter, b1, connected to sample moisture content. By comparing the estimated parameters values obtained using two algorithms presented in Table 2 and Table 3, it can be seen that the largest differences were obtained for the estimation of the b0 parameter for all six color characteristics.
Results presented in Figure 1 and Figure 2, showed that the dispersion of color components comparing to model predictions was quite uniform with only few outlayers, especially evident for the Hue angle description. Using Levenberg–Marquardt algorithm for model parameters estimation very good agreement between model and experimental data was obtained. The estimated R2 values were R2 (L*) = 0.918, R2 (a*) = 0.936, R2 (b*) = 0.783, R2E) = 0.819, R2 (Chroma) = 0.794, R2 (Hue angle) = 0.843, what represented a significant improvement in comparison to those obtained using Eureqa Formulize (Table 2 and Figure 1).
The effect of storage conditions on the coffee colour components change was also analysed for the V1KMK coffee sample packed in the triplex bag. Parameters of the non-linear model were first estimated using the Eureqa Formulize. Results are presented in Table 4. The evolutionary algorithm used in the Eureqa Formulize was not able to estimate the optimal values of the parameters describing the change of the L* colour component, probably due to numerical instability. Regarding the R2 value, the best agreement between experimental data and model was obtained for description of the change of the a* colour component with R2 = 0.977, while the smallest value of R2 was obtained for the Hue angle R2 = 0.642 which was in analogy with the results obtained for the L1KMK sample (Table 2). Comparing the R2 values for both packaging, it was noticed that the proposed non-linear models described colour components change in triplex packaging (V1KMK) much better. As for the tin can packaging (L1KMK), parameters of the non-linear models for description of the colour components change during storage in V1KMK were also estimated using Statistica 10.0. Results are given in Table 5.
The number or significant parameters based on p-value is reduced compared to the models developed for the coffee sample packed in the tin can. In the case of the L* colour component there was no significant parameter, while in case of ΔE, only b1 was shown to be significant. Only for description of the Hue angle change all parameters were significant. The proposed model described the experimental data very well (Figure 4), R2 (a*) = 0.990, R2 (b*) = 0.974, R2E) = 0.918, R2 (Chroma) = 0.978, R2 (Hue angle) = 0.918. The smallest value of R2 was obtained for the L* colour component with R2= 0.471. As mentioned before, the evolutionary algorithm was not able to estimate the parameters of the proposed model, so the results obtained by the Levenberg–Marquardt algorithm presented a significant improvement. The dispersion of colour components compared to model predictions (Figure 3 and Figure 4) was quite uniform, except for the L* component visible in Figure 4.

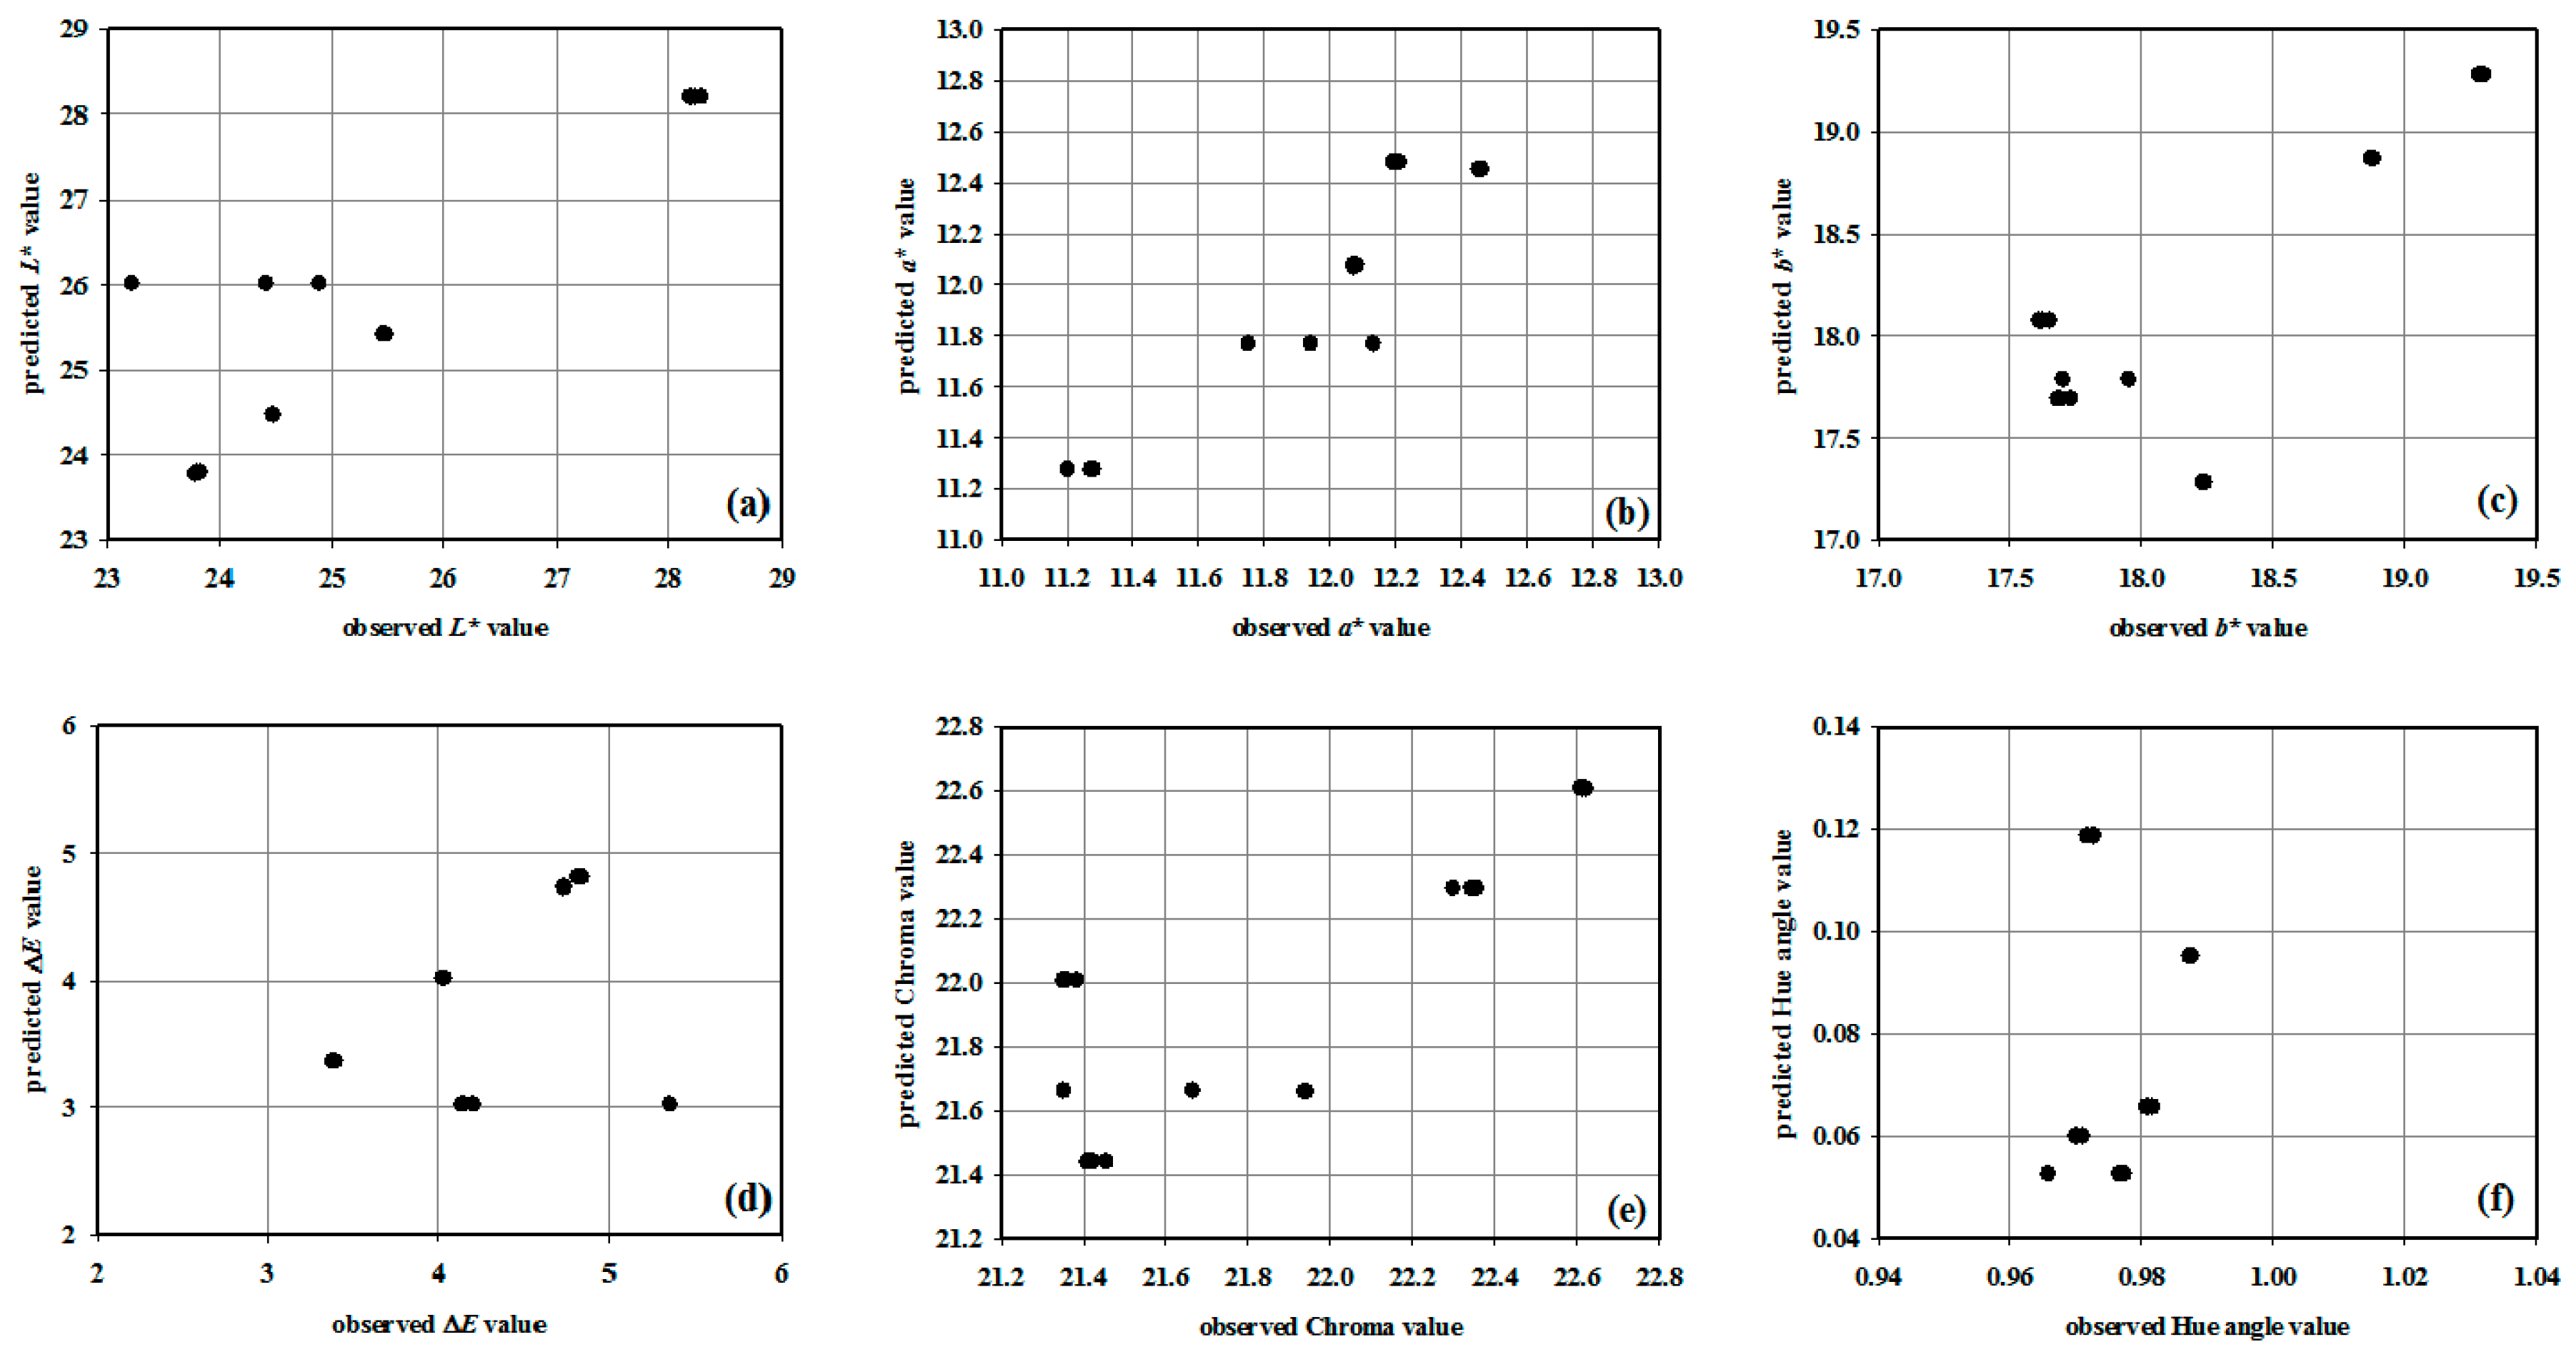
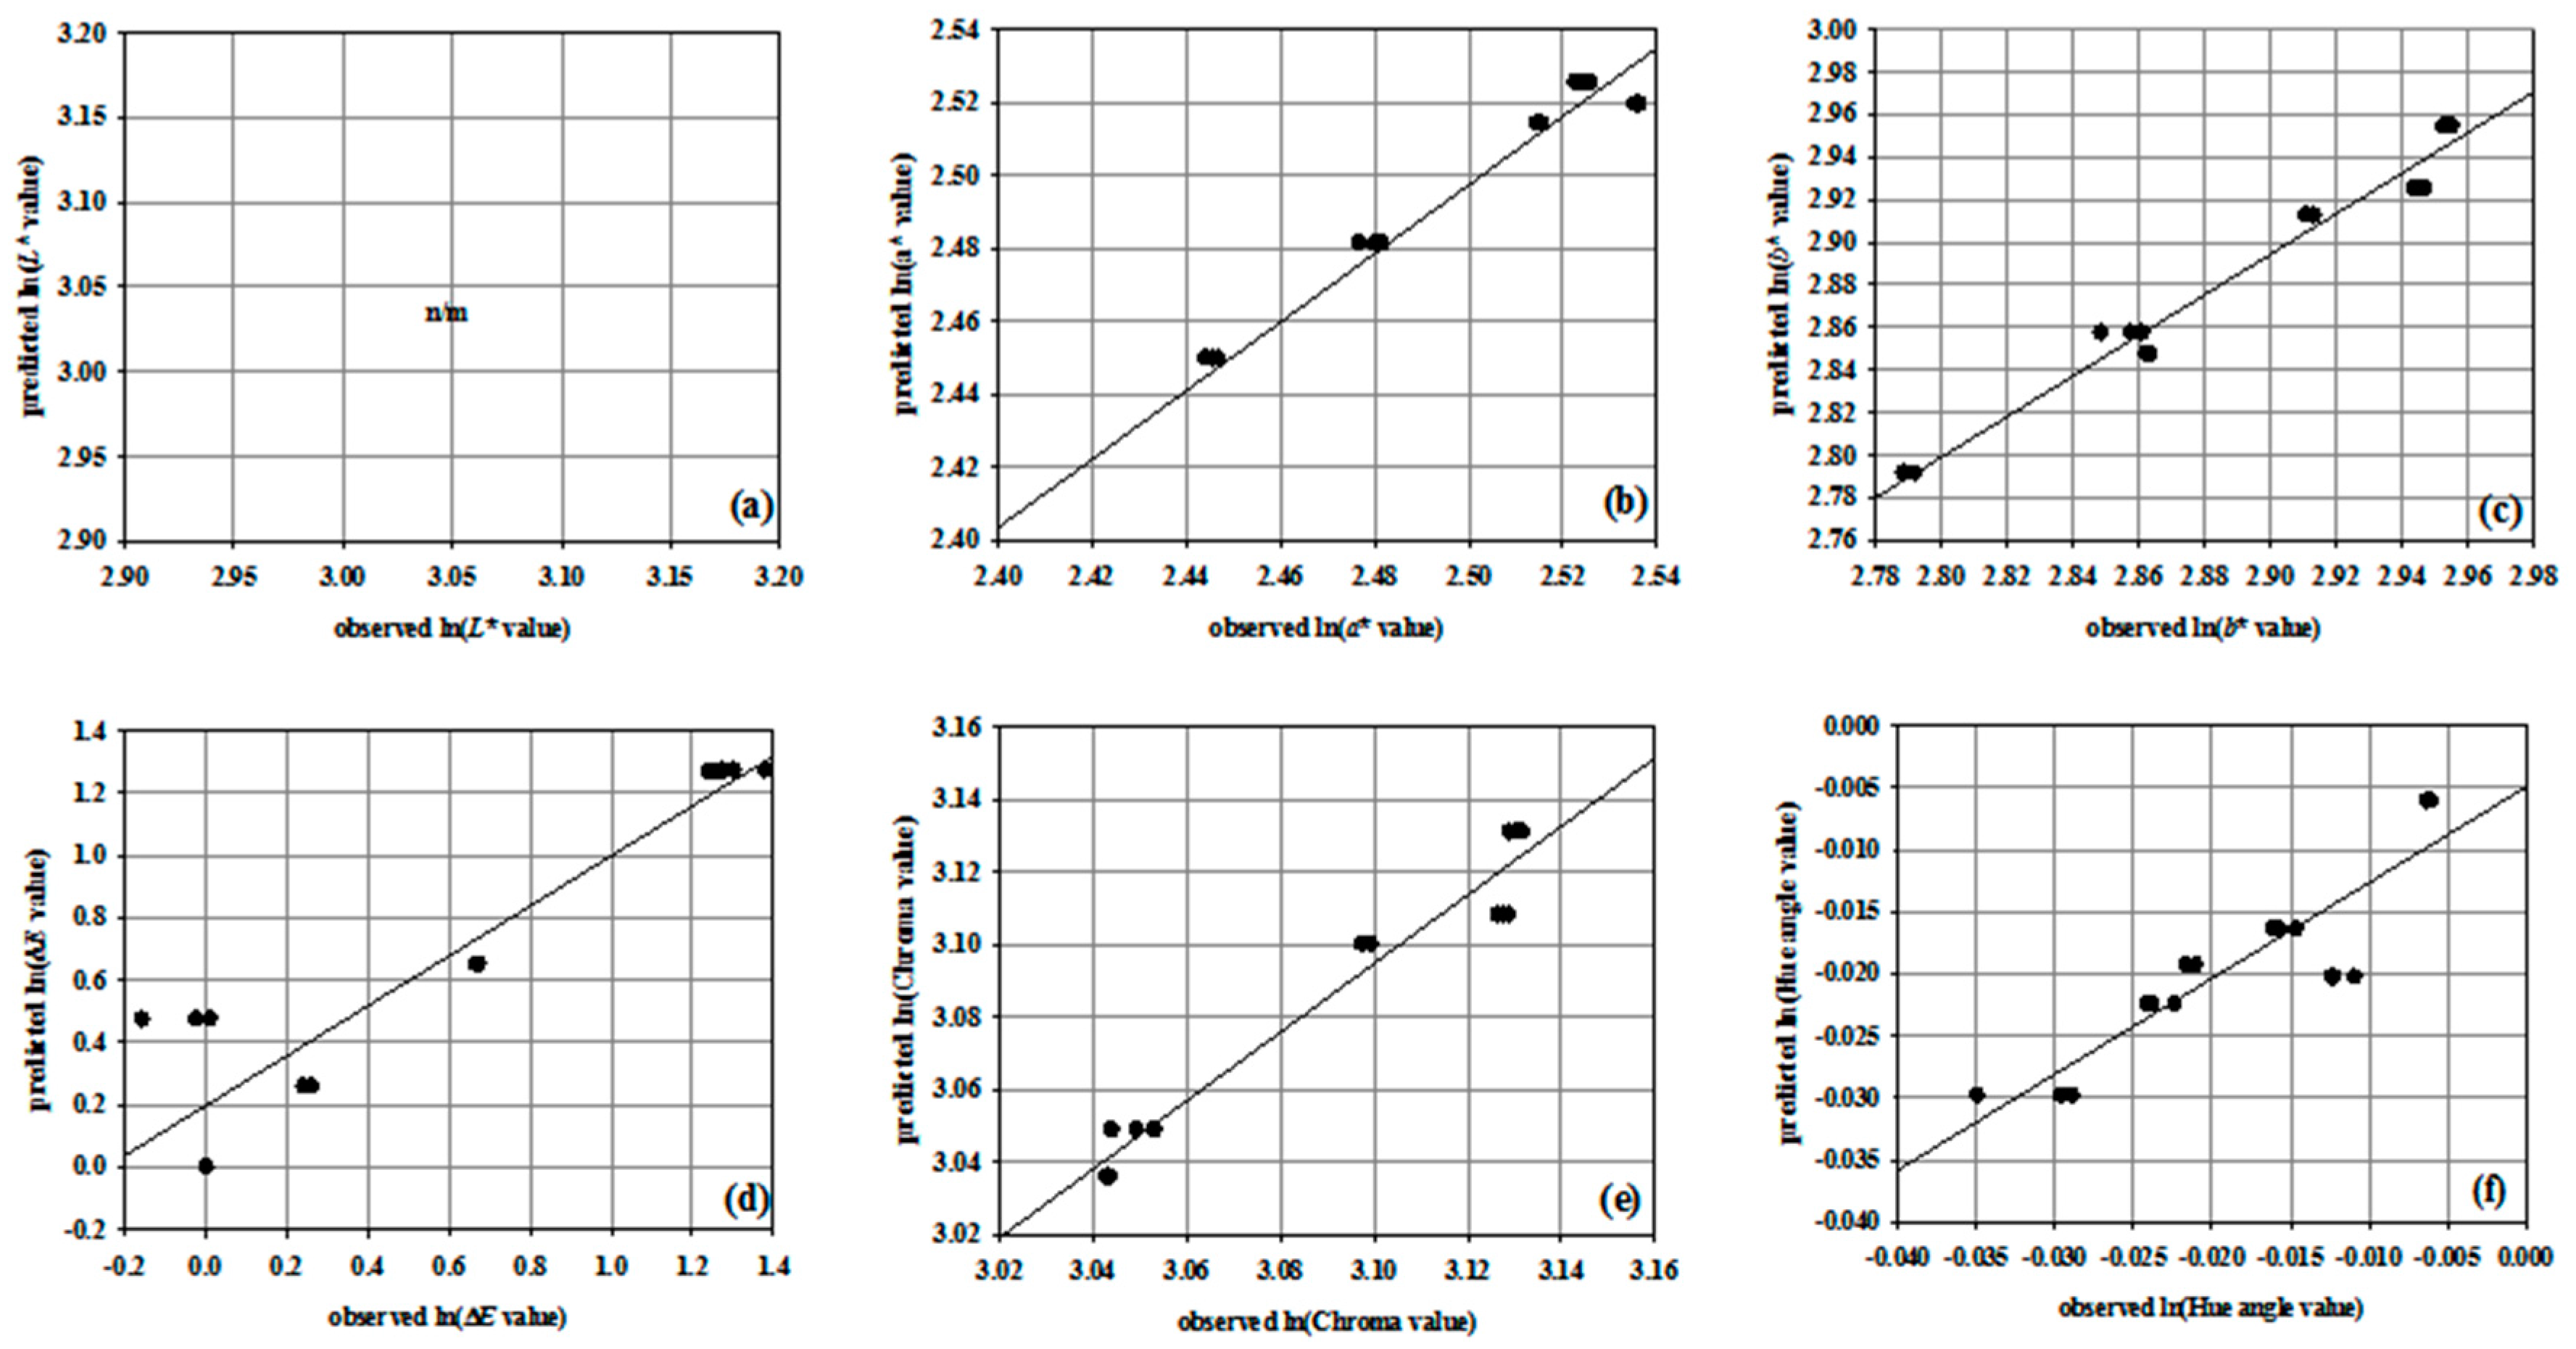
3.3. Linear Regression Models

To test the relationship between storage conditions (sample moisture content, relative air humidity, and air temperature) and coffee colour components change during storage linear regression models were proposed and the logarithmic linearization was used (Equation (6)). Parameters of the models were estimated using the evolutionary algorithm and variance minimization (least square method) (Table 6, Table 7, Table 8 and Table 9). Linear regression models were developed for both packaging materials separately.
Coefficients of linear regression models for description of colour parameters change during the storage of L1KMK estimated using Eureqa Formulize software are given in Table 6.
The best agreement between model and experimental data was obtained for the a* component with R2 = 0.856. The smallest value of R2 was obtained for the b* component with R2 = 0.400. In the case of non-linear regression models (Table 2), the best agreement between model and experiment was also obtained for a* colour component and the smallest value of R2 was obtained for the Hue angle. As mentioned before, parameters of the linear regression model were also estimated using variance minimization method implemented into Statistica 10.0. Results are given in Table 7.
It can be noticed that for the change of the L*, b* and Chroma, all four parameters are significant (p < 0.05). In case of the a* component, all parameters except β2 (combined with relative air humidity) are significant, while in the case of Hue angle, all parameters except β3 (combined with air temperature) are significant. Interestingly, p-value analysis revealed that in case of ΔE only parameter β3 proved to be significant, which meant that temperature was the key factor affecting total colour difference. Cardelli and Labudza [29] also showed that storage temperature affects shelf-life of roasted and ground coffee. The best agreement between model and experimental data regarding R2 value was obtained for the a* colour component with R2 = 0.937, while the smallest value of R2 was obtained for the ΔE component, with R2 = 0.457. As in the case of non-linear model for coffee sample L1KMK packed in tin can, models developed using Statistica 10.0 described experimental data more precisely than models developed using Eureqa Formulize.
By analysing the results presented in Figure 5 and Figure 6, it can be seen that the dispersion of observed colour component values compared to the model predictions followed a linear trend with few outliers. Outliers are mostly evident for regression models describing the change of a* and Chroma colour components estimated using the Eureqa Formulize, and for regression models describing ΔE and Chroma change estimated using the Statistica 10.0.
As in the case of non-linear regression models (Table 4), the Eureqa Formulize was not able to estimate the parameters of the linear regression model for description of L* colour component change during storage for coffee sample V1KMK in triplex packaging (Table 8).
The best agreement between model and experimental data was obtained for the a* colour component with R2 = 0.979 and the smallest R2 value was obtained for Hue angle (R2 = 0.786). Comparing the R2 values of both non-linear and linear regression models for colour components change during storage of V1KMK sample, it can be noticed that non-linear models could be selected as more suitable for the colour change description.
Linear regression model parameters for V1KMK were also estimated using Statistica 10.0 (Table 9). All parameters describing the change of b*, ΔE and Chroma were significant. In case of the L* colour component all parameters except β2 (connected to relative air humidity) were significant while in the case of the L* colour component parameters β0 and β2 were significant. Interestingly, p-value analysis revealed that in the case of the Hue angle there were no significant parameters, while in the case on non-linear regression model for description of the Hue angle change all parameters were significant. The phenomena could be explained by the fact that model linearization was performed using logarithm values of the experimental data. By introducing logarithmic values, disruption between orders of magnitude of the measured data can occur. The best agreement between model and experimental data was obtained for the a* component (R2 = 0.984) and the smallest value of R2 was obtained for the L* component (R2 = 0.504). Dispersion of colour components comparing to model predictions followed a linear trend (Figure 7 and Figure 8). The largest data dispersion was evident for models describing the change of the Hue angle estimated using the Eureqa Formulize and for models describing the L* component estimated using the Statistica 10.0.
Both non-linear and linear models used in this study, pointed to a significant influence of intrinsic (sample moisture content) and external (RH and temperature) factors mostly on L*, b*, Chroma and Hue values. Previous research has also shown a significant influence of storage conditions (e.g., temperature, headspace volume, water activity) on coffee quality [25,29]. Furthermore, it is important to emphasize that, in home storage conditions, models should be created for all influences combined together, rather than separately. The nature of the relationship between variables for description of the colour change during storage is non-linear, so non-linear model were the most suitable for process description. Further, non-linear model used in this study uses raw experimental data for parameter prediction, while the linear one introduces ln value to calculation, which causes disturbance between orders of magnitudes of measured data. On the other hand, result of the linear form of the model can usually be much easier to interpret. Based on the obtained result it can be concluded that due to its numerical stability Statistica 10.0 was a better choice for estimation of the parameter of both non-linear and linear models. The difference between packaging materials could only be estimated based on sample moisture content—the coffee sample packed in tin can (L1KMK) absorbed more moisture due to a larger amount of air entrapped in the tin can. Since moisture is well known to cause a deterioration in food powder properties [30], triplex bag is proposed as the more suitable packaging type for roasted ground coffee.

4. Conclusions

Both non-linear and linear models used in this study, pointed to a significant influence of intrinsic (sample moisture content) and external (RH and temperature) factors on ground roasted coffee color change. Based on lower moisture sorption of the sample packed in triplex bag, triplex packaging is proposed as more suitable. The nature of the relationship between variables for description of the color change during storage is non-linear, so non-linear model were the most suitable for process description. Due to numerical stability, Statistica 10.0 was a better choice for estimation of parameter of both non-linear and linear models.

Acknowledgments

The authors would like to thank Frank d.o.o. Zagreb for supplying coffee samples used in this research and Croatian Ministry of Science, Education and Sport for financial support.

Author Contributions

Maja Benković performed the experiments. Ana Jurinjak Tušek was responsible for linear and non-linear modelling. Both Authors equally participated paper writing.

Conflicts of Interest

The authors declare no conflict of interest.

References

  1. Bae, J.H.; Park, J.H.; Im, S.S.; Song, D.K. Coffee and health. Integr. Med. Res. 2014, 3, 189–191. [Google Scholar] [CrossRef] [PubMed]
  2. Tajik, N.; Tajik, M.; Mack, I.; Enck, P. The potential effects of chlorogenic acid, the main phenolic components in coffee, on health: A comprehensive review of the literature. Eur. J. Nutr. 2017, 56, 2215–2244. [Google Scholar] [CrossRef] [PubMed]
  3. Franca, A.S.; Oliveira, L.S.; Mendonça, J.C.F.; Silva, X.A. Physical and chemical attributes of defective crude and roasted coffee beans. Food Chem. 2005, 90, 89–94. [Google Scholar] [CrossRef]
  4. Bicho, N.C.; Leitao, A.E.; Ramalho, J.C.; Lidon, F.C. Use of color parameters for roasted coffee assessment. Food Sci. Technol. (Campinas) 2012, 32, 436–442. [Google Scholar] [CrossRef]
  5. Anese, M.; Manzocco, L.; Nicoli, M.C. Modelling the secondary shelf life of ground roasted coffee. J. Agric. Food Chem. 2006, 54, 5571–5576. [Google Scholar] [CrossRef] [PubMed]
  6. Esteban-Diez, I.; Gonzalez-Saiz, J.M.; Pizzaro, C. Prediction of sensory properties of espresso from roasted coffee samples by near-infrared spectroscopy. Anal. Chim. Acta 2004, 525, 171–182. [Google Scholar] [CrossRef]
  7. Šimunac, D. Knjiga o Kavi. Grafen: Zagreb; Grafen: Zagreb, Croatia, 2004. (In Croatian) [Google Scholar]
  8. Demiray, E.; Thulek, Y.; Yilmaz, Y. Degradation kinetics of lycopene, β-carotene and ascorbic acid in tomatoes during hot air drying. LWT-Food Sci. Technol. 2013, 50, 172–176. [Google Scholar] [CrossRef]
  9. Topuz, A. A novel approach for color degradation kinetics of paprika as a function of water activity. LWT Food Sci. Technol. 2008, 41, 1672–1677. [Google Scholar] [CrossRef]
  10. Corzo, O.; Álvarez, C. Color change kinetics of mango at different maturity stages during air drying. J. Food Process. Preserv. 2012, 38, 208–517. [Google Scholar] [CrossRef]
  11. Shahabi, M.; Rafiee, S.; Mohtasebi, S.S.; Hosseinpour, S. Image analysis and green tea color change kinetics during thin-layer drying. Food Sci. Technol. Int. 2014, 20, 465–476. [Google Scholar] [CrossRef] [PubMed]
  12. Ochoa, M.R.; Kesseler, A.G.; De Michelis, A.; Mugridge, A.; Chaves, A.R. Kinetics of color change of raspberry, sweet (Prunus avium) and sour (Prunus cerasus) cherries preserves packed in glass containers: Light and room temperature effects. J. Food Eng. 2001, 49, 55–62. [Google Scholar] [CrossRef]
  13. Ren, K.; Tu, K.; Pan, L.; Chen, Y. Kinetic modelling of broccoli color changes during chilled storage. J. Food Process. Preserv. 2006, 30, 180–193. [Google Scholar] [CrossRef]
  14. Haugaard Sørensen, I.; Krag, J.; Pisecky, J.; Westergaard, V. Analytical Methods for Dry Milk Products; Niro Atomizer: Copenhagen, Denmark, 1978. [Google Scholar]
  15. McGuire, R.G. Reporting of objective color measurements. HortScience 1992, 27, 1254–1255. [Google Scholar]
  16. Serpen, A.; Gökmen, V. Evaluation of the Maillard reaction in potato crisps by acrylamide, antioxidant capacity and color. J. Food Comp. Anal. 2009, 22, 589–595. [Google Scholar] [CrossRef]
  17. Benković, M.; Belščak-Cvitanović, A.; Komes, D.; Bauman, I. Physical properties of non-agglomerated cocoa drink powder mixtures containing various types of sugars and sweeteners. Food Bioprocess Technol. 2013, 6, 1044–1058. [Google Scholar] [CrossRef]
  18. Maskan, M. Kinetics of color change of kiwifruits during hot air and microwave drying. J. Food Eng. 2001, 48, 169–175. [Google Scholar] [CrossRef]
  19. Duboz, R.; Versmisse, D.; Travers, M.; Ramat, E.; Shin, Y. Application of an evolutionary algorithm to the inverse parameter estimation of an individual-based model. Ecol. Model. 2010, 221, 840–849. [Google Scholar] [CrossRef]
  20. Cirilo, M.P.G.; Coelho, A.F.S.; Araujo, C.M.; Goncalves, F.R.B.; Nogueira, F.D.; Gloria, M.B.A. Profile and levels of bioactive amines in green and roasted coffee. Food Chem. 2003, 82, 397–402. [Google Scholar] [CrossRef]
  21. Sacchetti, G.; Di Mattia, C.; Pittia, P.; Mastrocola, D. Effect of roasting degree, equivalent thermal effect and coffee type on the radical scavenging activity of coffee brews and their phenolic fraction. J. Food Eng. 2009, 90, 74–80. [Google Scholar] [CrossRef]
  22. Kreuml, M.T.; Majchrzak, D.; Ploederl, B.; Koenig, J. Changes in sensory quality characteristics of coffee during storage. Food Sci. Nutr. 2014, 1, 267–272. [Google Scholar] [CrossRef] [PubMed]
  23. Rendon, M.Y.; Garcia Salva, T.; Bragagnolo, N. Impact of chemical changes on the sensory characteristics of coffee beans during storage. Food Chem. 2014, 147, 279–286. [Google Scholar] [CrossRef] [PubMed]
  24. Kallio, H.; Leino, M.; Koullias, K.; Kallio, S.; Kaitaranta, J. Headspace of roasted coffee as an indicator of storage time. Food Chem. 1990, 36, 135–148. [Google Scholar] [CrossRef]
  25. Marin, K.; Požrl, T.; Zlatić, E.; Plestenjak, A. A new aroma index to determine the aroma quality to roasted and ground coffee during storage. Food Technol. Biotechnol. 2008, 46, 442–447. [Google Scholar]
  26. Lampton, M. Damping-undamping strategies for the Levenberg-Marquart non-linear least-squares method. Comput. Phys. J. 1997, 11, 110–115. [Google Scholar] [CrossRef]
  27. Levenberg, K. A method for the solution of certain non-linear problems in least squares. Q. Appl. Math. 1944, 2, 164–168. [Google Scholar] [CrossRef]
  28. Marquardt, D.W. An algorithm for least squares estimation of non-linear parameters. SIAM J. Appl. Math. 1963, 11, 431–441. [Google Scholar] [CrossRef]
  29. Cardelli, C.; Labudza, T.P. Application of Weibull hazard analysis to the determination of the shelf life of roasted and ground coffee. LWT-Food Sci. Technol. 2001, 34, 273–278. [Google Scholar] [CrossRef]
  30. Teunou, E.; Fitzpatrick, J.J. Effect of relative humidity and temperature on food powder flowability. J. Food Eng. 1999, 42, 109–116. [Google Scholar] [CrossRef]
Figure 1. Non-linear regression models for description of color component change during storage of L1KMK estimated using Eureqa Formulize: (a) L*, (b) a*, (c) b*, (d) ΔE, (e) Chroma, (f) Hue angle (R2 = 0.737, 0.842, 0.258, 0.611, 0.519, 0.488).
Beverages 04 00016 g001
Figure 2. Non-linear regression models for description of color component change during storage of L1KMK estimated using Statistica 10.0.: (a) L*, (b) a*, (c) b*, (d) ΔE, (e) Chroma, (f) Hue angle (R2 = 0.918, 0.936, 0.783, 0.819, 0.794, 0.843).
Beverages 04 00016 g002
Figure 3. Non-linear regression models for description of colour component change during storage of V1KMK estimated using Eureqa Formulize: (a) L* (not determined), (b) a*, (c) b*, (d) ΔE, (e) Chroma, (f) Hue angle (R2 = n/m, 0.977, 0.965, 0.738, 0.973, 0.642).
Beverages 04 00016 g003
Figure 4. Non-linear regression models for description of colour component change during storage of V1KMK estimated using Statistica 10.0.: (a) L*, (b) a*, (c) b*, (d) ΔE, (e) Chroma, (f) Hue angle (R2 = 0.471, 0.990, 0.974, 0.918, 0.978, 0.918).
Beverages 04 00016 g004
Figure 5. Linear regression models for description of colour component change during storage of L1KMK estimated using the Eureqa Formulize: (a) L*, (b) a*, (c) b*, (d) ΔE, (e) Chroma, (f) Hue angle (R2 = 0.714, 0.856, 0.400, 0.724, 0.509, 0.561).
Beverages 04 00016 g005
Figure 6. Linear regression models for description of colour components change during storage of L1KMK estimated using Statistica 10.0.: (a) L*, (b) a*, (c) b*, (d) ΔE, (e) Chroma, (f) Hue angle (R2 = 0.825, 0.937, 0.774, 0.457, 0.622, 0.696).
Beverages 04 00016 g006
Figure 7. Linear regression models for description of colour components change during storage of V1KMK estimated using the Eureqa Formulize: (a) L*, (b) a*, (c) b*, (d) ΔE, (e) Chroma, (f) Hue angle (R2 = 0.714, 0.856, 0.400, 0.724, 0.509, 0.561).
Beverages 04 00016 g007
Figure 8. Linear regression models for description of colour components change during storage of V1KMK estimated using Statistica 10.0.: (a) L*, (b) a*, (c) b*, (d) ΔE, (e) Chroma, (f) Hue angle (R2 = 0.504, 0.984, 0.975, 0.993, 0.981, 0.842).
Beverages 04 00016 g008
Table 1. Color components of roasted ground coffee samples during 6 months of storage. Results are shown as average ± SD.
SampleParameterStorage Time (Days)
306090120150180
V1KMKL*24.74 ± 0.0325.62 ± 0.0925.73 ± 0.0021.45 ± 0.2424.19 ± 0.0126.13 ± 0.07
a*12.48 ± 0.0212.62 ± 0.0112.37 ± 0.0111.93 ± 0.0311.54 ± 0.0111.00 ± 0.02
b*19.18 ± 0.0219.01 ± 0.0318.40 ± 0.0217.39 ± 0.1117.51 ± 0.0116.29 ± 0.03
ΔE/0.91 ± 0.081.27 ± 0.013.78 ± 0.211.99 ± 0.013.52 ± 0.05
Chroma22.88 ± 0.0322.82 ± 0.0222.17 ± 0.0221.09 ± 0.0920.97 ± 0.0119.66 ± 0.03
Hue0.99 ± 0.010.98 ± 0.000.98 ± 0.000.97 ± 0.000.99 ± 0.000.98 ± 0.00
Moisture content1.28 ± 0.011.46 ± 0.011.68 ± 0.021.82 ± 0.011.87 ± 0.011.97 ± 0.02
RH64 ± 1.0032 ± 1.0058 ± 1.0045 ± 1.0032 ± 1.0020 ± 1.00
T18 ± 0.2018 ± 0.2017 ± 0.1017 ± 0.2015 ± 0.0014 ± 0.00
L1KMKL*28.23 ± 0.0424.17 ± 0.8525.46 ± 0.0123.78 ± 0.0024.48 ± 0.0123.81 ± 0.02
a*11.25 ± 0.0411.94 ± 0.1912.07 ± 0.0012.20 ± 0.0112.46 ± 0.0112.08 ± 0.01
b*19.29 ± 0.0117.55 ± 0.5017.63 ± 0.0218.23 ± 0.0118.87 ± 0.0117.70 ± 0.03
ΔE/1.81 ± 0.681.76 ± 0.011.37 ± 0.000.40 ± 0.011.79 ± 0.01
Chroma22.33 ± 0.0321.22 ± 0.5121.36 ± 0.0221.94 ± 0.0022.61 ± 0.0121.43 ± 0.02
Hue1.04 ± 0.000.97 ± 0.010.97 ± 0.000.98 ± 0.000.99 ± 0.000.97 ± 0.00
Moisture content1.01 ± 0.011.41 ± 0.011.66 ± 0.012.25 ± 0.012.21 ± 0.102.27 ± 0.02
RH58 ± 1.0064 ± 1.0053 ± 1.0044 ± 1.0028 ± 1.0020 ± 1.00
T18 ± 0.0018 ± 0.0016 ± 0.2016 ± 0.1014 ± 0.1020 ± 0.10
Table 2. Non-linear regression models coefficients for description of color component change during storage for L1KMK (α = 95%) estimated using Eureqa Formulize software.
ParameterCoefficientR2Correlation CoefficientMaximum ErrorMean Squared ErrorMean Absolute Error
L*b0
b1
b2
b3
40.590
−0.236
−0.028
−0.085
0.7370.8832.8100.6580.326
a*b0
b1
b2
b3
12.82
0.134
0.022
−0.075
0.8420.9340.3600.0220.084
b*b0
b1
b2
b3
64.140
−0.213
−0.107
−0.265
0.5280.7700.9570.2210.296
ΔEb0
b1
b2
b3
0.225
1.208
0.147
0.5442
0.6110.8172.3251.1150.596
Chromab0
b1
b2
b3
43.780
−0.076
−0.038
−0.179
0.5190.7591.0070.1440.237
Hue angleb0
b1
b2
b3
1.925
−0.175
−0.780
−0.102
0.4880.8360.0440.00030.009
Table 3. Non-linear regression models coefficients for description of color component change during storage for tin can packaging (L1KMK) (α = 95%) estimated using Statistica 10.0. marked values are significant at p < 0.05.
L*a*b*
ParameterValuep-ValueValuep-ValueValuep-Value
b068.793 ± 18.421 0.00213.259 ± 1.541 053.819 ± 13.173 0.001
b1−0.284 ± 0.038 00.098 ± 0.017 0−0.156 ± 0.036 0
b2−0.085 ± 0.027 0.0070.012 ± 0.0120.305−0.084 ± 0.025 0.004
b3−0.192 ± 0.069 0.015−0.071 ± 0.029 0.031−0.242 ± 0.063 0.002
ΔEChromaHue Angle
ParameterValuep-ValueValuep-ValueValuep-Value
b00.006 ± 0.0170.74147.904 ± 7.659 01.567 ± 0.231 0
b11.865 ± 0.501 0.002−0.080 ± 0.024 0.004−0.117 ± 0.021 0
b20.519 ± 0.2690.075−0.055 ± 0.016 0.004−0.045 ± 0.015 0.008
b31.214 ± 0.7130.111−0.190 ± 0.041 0−0.081 ± 0.038 0.048
Table 4. Non-linear regression models coefficients for description of color component change during storage for triplex packing (V1KMK) (α = 95%) estimated using Eureqa Formulize.
ParameterCoefficientR2Correlation CoefficientMaximum ErrorMean Squared ErrorMean Absolute Error
L*b0
b1
b2
b3
n/m
n/m
n/m
n/m
n/mn/mn/mn/mn/m
a*b0
b1
b2
b3
9.605
−0.016
0.123
−0.085
0.9770.9900.2040.0070.053
b*b0
b1
b2
b3
32.220
−0.181
0.157
−0.390
0.9650.9870.4000.0360.1257
ΔEb0
b1
b2
b3
0.011
4.580
−0.530
1.597
0.7380.8691.7810.4780.447
Chromab0
b1
b2
b3
29.760
−0.128
0.145
−0.288
0.9730.9890.4310.0350.122
Hue angleb0
b1
b2
b3
2.301
−0.072
0.071
−0.386
0.6420.8560.0110.0000.003
Table 5. Non-linear regression models coefficients for description of colour component change during storage for V1KMK (α = 95%) estimated using Statistica 10.0. marked values are significant at p < 0.05.
L*a*b*
ParameterValuep-ValueValuep-ValueValuep-Value
b047.873 ± 72.3880.5196.274 ± 1.151 013.940 ± 4.795 0.011
b1−0.262 ± 0.1780.163−0.009 ± 0.0200.671−0.142 ± 0.039 0.003
b2−0.066 ± 0.1700.7040.087 ± 0.019 00.088 ± 0.038 0.035
b3−0.102 ± 0.7860.8980.114 ± 0.0910.223−0.004 ± 0.1740.983
ΔEChromaHue Angle
ParameterValuep-ValueValuep-ValueValuep-Value
b00.002 ± 0.0020.88913.165 ± 3.935 0.0051.676 ± 0.158 0
b17.818 ± 2.474 0.007−0.096 ± 0.034 0.013−0.077 ± 0.010 0
b20.342 ± 0.8370.6890.078 ± 0.033 0.0330.031 ± 0.009 0.006
b31.217 ± 3.0810.6990.089 ± 0.1510.567−0.219 ± 0.045 0
Table 6. Linear regression models coefficients for description of colour components change during storage of L1KMK (α = 95%) estimated using the Eureqa Formulize software.
ParameterCoefficientR2Correlation CoefficientMaximum ErrorMean Squared ErrorMean Absolute Error
L*β0
β1
β2
β3
3.710
−0.237
−0.028
−0.087
0.7140.8740.1140.0010.013
a*β0
β1
β2
β3
2.590
0.119
0.018
−0.079
0.8560.9370.0320.0000.007
b*β0
β1
β2
β3
2.631
0.022
0.039
0.033
0.4000.6360.0290.0000.009
ΔEβ0
β1
β2
β3
4.865
−0.606
−0.119
−0.978
0.7240.8590.2120.0080.051
Chromaβ0
β1
β2
β3
3.791
−0.077
−0.039
−0.182
0.5090.7500.0470.0000.011
Hue angleβ0
β1
β2
β3
0.100
0.020
−0.001
−0.047
0.5610.8060.0120.0000.002
Table 7. Linear regression models coefficients for description of colour component change during the storage of L1KMK (α = 95%) estimated using Statistica 10.0. significant at p < 0.05.
L*a*b*
ParameterValuep-valueValuep-ValueValuep-Value
β04.202 ± 0.272 02.568 ± 0.119 03.980 ± 0.253 0
β1−0.275 ± 0.039 00.102 ± 0.017 0−0.152 ± 0.036 0.001
β2−0.081 ± 0.027 0.0090.014 ± 0.0120.246−0.083 ± 0.025 0.005
β3−0.188 ± 0.069 0.017−0.068 ± 0.030 0.041−0.243 ± 0.063 0.002
ΔEChromaHue Angle
ParameterValuep-ValueValuep-ValueValuep-Value
β0−1.784 ± 1.3560.2243.871 ± 0.164 00.439 ± 0.148 0.010
β10.579 ± 0.3190.097−0.079 ± 0.024 0.005−0.116 ± 0.021 0
β20.153 ± 0.1470.319−0.055 ± 0.016 0.0045−0.044 ± 0.015 0.011
β30.816 ± 0.307 0.022−0.191 ± 0.042 0−0.081 ± 0.0380.051
Table 8. Linear regression models coefficients for description of colour component change during storage of V1KMK (α = 95%) estimated using the Eureqa Formulize.
ParameterCoefficientR2Correlation CoefficientMaximum ErrorMean Squared ErrorMean Absolute Error
L*β0
β1
β2
β3
n/m
n/m
n/m
n/m
n/mn/mn/mn/mn/m
a*β0
β1
β2
β3
2.272
−0.015
0.125
−0.090
0.9790.9910.0160.0000.004
b*β0
β1
β2
β3
3.471
−0.181
0.157
−0.389
0.9670.9870.0210.0000.007
ΔEβ0
β1
β2
β3
−28.13
2.801
−3.502
13.890
0.8430.9330.6340.0490.104
Chromaβ0
β1
β2
β3
3.530
−0.124
0.157
−0.352
0.9740.9900.0200.0000.006
Hue angleβ0
β1
β2
β3
0.340
−0.072
0.017
−0.138
0.7860.8920.0090.0000.002
Table 9. Linear regression models coefficients for description of colour components change during storage of V1KMK (α = 95%) estimated using Statistica 10.0. marked values are significant at p < 0.05.
L*a*b*
ParameterValuep-ValueValuep-ValueValuep-Value
β07.591 ± 1.343 02.077 ± 0.174 03.608 ± 0.257 0
β1−0.443 ± 0.148 0.009−0.021 ± 0.0190.287−0.185 ± 0.028 0
β20.254 ± 0.1390.0890.107 ± 0.018 00.173 ± 0.027 0
β3−1.829 ± 0.639 0.0120.004 ± 0.0830.958−0.457 ± 0.122 0.002
ΔEChromaHue Angle
ParameterValuep-ValueValuep-ValueValuep-Value
β0−29.087 ± 1.412 03.441 ± 0.215 00.516 ± 0.0940
β16.174 ± 0.267 0−0.135 ± 0.024 0−0.077 ± 0.0100
β2−2.291 ± 0.143 00.152 ± 0.022 00.031 ± 0.0090.006
β312.501 ± 0.648 0.022−0.313 ± 0.102 0.008−0.219 ± 0.0450

