Article

Nutrients Assimilation and Chlorophyll Contents for Different Grapevine Varieties in Calcareous Soils in the Somontano DO (Spain)

by
José Casanova-Gascón
,
Pablo Martín-Ramos
*,
Clara Martí-Dalmau
and
David Badía-Villas
Department of Agricultural and Environmental Sciences, EPS, Instituto Universitario de Investigación en Ciencias Ambientales de Aragón (IUCA), Universidad de Zaragoza, Carretera de Cuarte, s/n, 22071 Huesca, Spain
*
Author to whom correspondence should be addressed.
Beverages 2018, 4(4), 90; https://doi.org/10.3390/beverages4040090
Submission received: 7 October 2018 / Revised: 6 November 2018 / Accepted: 13 November 2018 / Published: 17 November 2018
(This article belongs to the Special Issue Viticulture for Wine Production)

Abstract

:
Lime-induced chlorosis (LIC) is an important abiotic constraint affecting the growth and yield of grapevines growing in calcareous soils in the Mediterranean region, and the sensory properties of the produced wine. In the work presented herein, the impact of LIC on the nutritional status and chlorophyll content was assessed for eleven varieties and a clone (Merlot, Pinot Noir, Cabernet Sauvignon, Tempranillo, Parraleta, Moristel, Aglianico, Macabeo, Sauvignon, Chardonnay, and Riesling), grafted to the same rootstock (1103 Paulsen). Macro- and micronutrient contents were determined in the fruit set and veraison stages by petiole analyses, while chlorophyll content in young leaves was monitored by SPAD. Significant differences were detected amongst varieties for all nutrients (including Fe), and inverse relationships between Fe and P contents in the petiole and chlorophyll concentration in the young leaves were found. Regarding LIC resistance, the Fe and chlorophyll contents suggest that Cabernet Sauvignon, Tempranillo and Aglianico varieties would show the best performance, while Sauvignon would be the least tolerant.

Graphical Abstract

1. Introduction

Lime-induced chlorosis is considered the most widespread abiotic stress that affects grapevines, characterized by interveinal yellowing in the leaves. It affects chlorophyll synthesis, causes millerandage, and reduces and delays grape ripening. Further, it must be systematically corrected in the vineyards in which it appears by massive applications of synthetic iron chelates, resulting in an increase in production costs and in environmental risks [1].
In terms of productivity, the low photosynthesis rate occurring in chlorotic plants remarkably depresses the yield and vigor of vineyards [2,3]: according to Bavaresco et al. [4], lime-induced chlorosis (LIC) can reduce yield per plant by 82%, cluster weight by 68%, and berry weight by 47% as compared to normal growth conditions. Moreover, LIC would lead to low bud fruitfulness for the following year [5,6].
LIC would also significantly participate to the manifestation of sensory properties of produced wine and would influence its character [7,8]. The synthesis and accumulation of sugars, acids and phenolic compounds in grapes through ripening would be greatly influenced by the photosynthetic capacity of the vines [9], as this capacity depends directly on vine-leaf biomass (canopy size, density and vigor) and leaf chlorophyll content [10]. Technological grape parameters such as soluble solids, pH and anthocyanins have been reported to depend on the severity of the disorder reached in the campaign, and also on its cumulative effects, which are manifested in the stocks in subsequent years [11].
A severe nutritional deficiency of iron can cause a drastic reduction in the quality of the grape [12], which translates into a poor quality of the musts, as a result of a reduction in the content of sugars and anthocyanins, and in an increase in total acidity [13,14]. On the other hand, under mild LIC, technological grape parameters such as soluble solids, pH and anthocyanins would be increased, whilst titratable acidity would not be affected [6]. The high sugar concentration would be a consequence of grape yield reduction, and the higher concentrations of anthocyanins and polyphenols in chlorotic vines would be ascribed to the greater proportion of skin/pulp, as a consequence of the reduction in the size of the berries. Increased anthocyanin levels would also result from improved biosynthesis in grape skins. The biochemical mechanisms involved are not clear, but Bavaresco et al. [4] speculated that, Fe being constituent of enzymes involved in lignin synthesis, its deficiency may switch the shikimate pathway towards other phenolics including anthocyanins. Stilbenes, being stress compounds [15], would also greatly increase their concentrations in grapes of chlorotic vines: by 635% for trans-resveratrol, by 1609% for trans-piceid, by 550% for piceatannol, and by 500% for ε-viniferin [4]. This increase would result from a depression of the peroxidase activity in the berries.
Calcareous soils, with a basic pH and elevated bicarbonate concentrations, induce LIC, owing to both the limited bioavailability of Fe from the soil and the depleted acquisition and translocation of Fe within the plant [16]. Other aspects, such as the excess of other elements (Mn, Cu, P, …), poor soil aeration and soil compaction, low root zone temperature, excessive nitrate-N availability or high soil moisture conditions may also favor this disorder [17]. Further, any weakness of the plant (pathogen infections, damages to the root system caused by soil tillage, grafting incompatibility between scion and rootstock, etc.) may also constrain Fe nutrition. Fundamental and applied aspects of Fe nutrition of deciduous fruit crops and grapevine are discussed in detail in the review paper by Tagliavini and Rombolà [3].
Different grapevine varieties have different behaviors in terms of nutrients absorption, provided that the limiting factors of the rootstocks are dissimilar. The different behavior of the rootstocks as related to limiting factors of the soil can facilitate the spread of this disorder if a correct choice is not made. Actually, an approach to prevent LIC relies on the use of tolerant genotypes as rootstocks, but in some cases such resistant rootstocks may have drawbacks from an agronomic point of view (e.g., they may induce excessive growth of the scion and reduce fruit yields) [3].
The occurrence of LIC in grapevine is usually predicted with tests based on soil iron forms [18], and the nutritional status of the plant is generally assessed through leaf analyses, in spite of the fact there is often no correlation between iron in leaves and degree of chlorosis [19]. Petiole analyses could pose an interesting alternative [20], provided that Benito et al. [21] reported that the petiole would be a better choice than the blade for iron determination at both complete cap-fall and fruit set and that at veraison a similar reliability would be attained for both tissues. Another approach would consist in non-destructive measurements of chlorophyll content on the basis of the absorbance in the red and infrared regions (SPAD) [22]. This technique has been successfully used in other species [23] and, in the case of grapevine, several authors have shown that it can be used to estimate N content in the leaves [24,25]. Finally, other non-destructive techniques for vigor, LIC and other phytopathologies assessment based on drones (UAVs) or satellites are also receiving increasing attention [26,27].
Although the sole Fe measurement does not provide a measurement of the LIC tolerance of a cultivar, provided that the content of a nutrient may be affect by several and contingent environmental and technical factors, the work presented herein aims to provide a first approximation to the impact of LIC by monitoring the nutritional status and chlorophyll content through petiole analysis and SPAD techniques, respectively. Eleven international and local grapevine varieties and a clone grafted to the same drought tolerant rootstock, which features a mild tolerance to calcareous soils, have been studied. The obtained information may be of interest for vineyards in the Mediterranean region, in which the soil conditions for Fe nutrition are sub-optimal (because of the calcareous soils), but the climate is favorable for maximizing fruit quality and maintaining satisfactory yields.

2. Materials and Methods

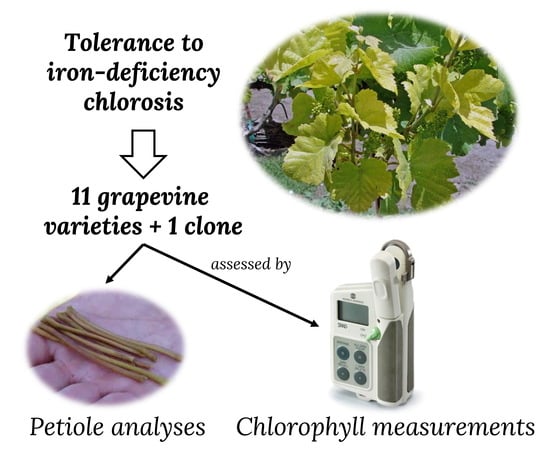
2.1. Grapevine Varieties and Rootstock

Eleven grapevine varieties and a clone were studied, out of which four were white-skinned berry varieties (Chardonnay, Macabeo, Riesling and Sauvignon) and eight were red-skinned berry viarieties (Aglianico, Cabernet Sauvignon, Merlot R-3, Merlot R-12, Moristel, Parraleta, Pinot Noir and Tempranillo). Three of these were minority cultivars (Macabeo, Parraleta and Moristel) from Somontano Designation of Origin (DO).
The chosen rootstock to which all varieties were grafted was a 1103-Paulsen (Berlandieri Resseguier no. 2 × Rupestris de Lot), a hybrid obtained in Sicily (Italy). It presents problems due to excess active limestone above 17% of soil content, which is equivalent to a chlorotic power index ( CPI = ( active   CaCo 3 , % ( Fe ,   ppm ) 2 ) · 10 4 , according to Juste–Pouget method [28]) of 30 [8]. Although its resistance to limestone would then be similar to that of the Richter 110 and 99, it is more resistant to drought (as it features a good root system development in those conditions [7]) and especially to salt. It is considered the most resistant rootstock in both these aspects, and it also features a good resistance to nematodes and a mild tolerance to calcareous soils. Since it is very vigorous, it is suitable for plantations where vines have been grown before.

2.2. Location

The plot in which the tests were conducted is located in the municipality of Salas Altas, in Aragón, Spain (UTM 31, X: 258,352; Y: 4,666,634). The plot occupies 800 m2 with a planting pattern of 3 × 1.2 m, resulting in a density of 2700 plants/ha, with a double Royat training system. The management of the plantation was the usual in the area, with three grower passes during the year (in March, June and August), pruning to 3 buds (in March), grape thinning (in July) and control of pests and diseases. Grapevines were treated against mildew with a preventive fungicide (cupric hydroxide) and a systemic fungicide (metalaxyl + mancoceb); and against powdery mildew with myclobutanil, a preventive fungicide, and with several systemic fungicides (bupirimate, tebuconazole and proquinazid).
The main processes of formation in the soils of vineyards in Salas Altas are the accumulation of pedogenic carbonates in the subsurface horizons and a light rubefaction in surface horizons. The calcification process results in the development of diagnostic calcic horizon, which classifies the soil as Haplic Calcisol [29].

2.3. Climatic Conditions

The mean annual precipitation is about 490 mm and the mean annual temperature is 13 °C; the mean annual reference evapo-transpiration (by Thornwaite method) is about 800 mm, which provokes a summer water deficit. The soil temperature regime is mesic, and the soil moisture regime xeric [29]. According to the Géoviticulture multicriteria climatic classification system proposed by Tonietto and Carbonneau [30], the Somontano DO belongs to the HI+2; CI+1; DI+1 climatic group (where HI, CI and DI stand for heliothermal index, cool night index and dryness index, respectively) [31]. The HI is warm (2427 °C), the CI corresponds to cool nights (13.9 °C) and the DI would be associated with a moderately dry class of viticultural climate (−50 mm). Basic weather information for the months in which the study was conducted is provided in Table 1.

2.4. Soil Analyses

Composite samples were taken at two depths (0–30 cm and 30–60 cm) and were analyzed according to the official methods of analysis in Spain [32]. Particle size analysis was conducted on <2-mm air-dried samples using the pipette method. Soil pH was determined potentiometrically in a 1:2.5 ratio in H2O [33]. Total carbonate content was measured volumetrically (with a calcimeter) after treating with 6N hydrochloric acid [34]. Total soil organic C was determined by the method of wet oxidation [35]; organic matter was estimated using the van Bemmelen factor (1.724) [35]. The cation exchange capacity and exchangeable cations were determined by NH4+ retention after leaching with a solution (pH 7) of 1 N NH4OAc [36]. Soil salinity was evaluated measuring the electrolytic conductivity (ECe) of the saturation paste extract at 25 °C [37].
The results from aforementioned analyses (Table 2) indicated that it was a soil of moderately basic pH, with a loamy textural class (total sand: 41.95%; coarse silt: 13.82%; fine silt: 23.92%, clay: 20.30%) and low stoniness. The high levels of carbonates, active limestone and bicarbonates would favor the Fe assimilation problems of the rootstock in those conditions. The K/Mg ratio indicated problems of Mg absorption [12]. As regards Fe, despite its high total content, the available Fe was in a concentration range in which LIC occurs (28–45 ppm for Fe-EDTA), which was further confirmed by the high chlorotic power index value, which exceeded the limit of 30 for the chosen rootstock.

2.5. Petiole Analyses

Petiole samples were collected at fruit set (June 19) and veraison (August 13), choosing the leaves opposite to the bunches. Plant material sampling was done in three replicates for each variety (except for Parraleta and Riesling varieties, for which there were only 2 replicates), taking 40 petioles per replicate (a total of 120 petiole analyses on each date per variety). 20 samples/plant were taken from each the six plants in the center of a 10-plant row, leaving the outmost two plants on each side as guards. Samples were thoroughly washed with distilled water and diluted hydrochloric acid to eliminate residues, and were allowed to dry before crushing [38].
The petiole analyzes were performed with a Selecta Pro-Nitro S-627 (Barcelona, Spain) Kjeldahl distillation unit for N determination, and a Jenway PFP7 flame photometer (Cole-Parmer, Vernon Hills, IL, USA) for Ca and K determination. A Varian Spectra A-10 Plus (Agilent Technologies, Santa Clara, CA, USA) atomic absorption spectrophotometer (AAS) was used to determine Fe, Mg and Mn, while an ATi Unicam UV2 UV/Vis spectrometer (Upland, CA, USA) apparatus was used for P determination by molecular absorption.
The comparison of the results was conducted taking as a reference the interpretation tables of petiole nitrogen content in Hidalgo Fernández-Cano and Hidalgo Togores [39] and the tables in [40,41].

2.6. Chlorophyll Monitoring

Chlorophyll measurements were conducted every 10 days from May till the end of August on young leaves (in particular, on the fourth leaf from the apex, so as to ensure that measurements conducted on different dates correspond to leaves in a similar development stage). 25 leaves per variety were analyzed on each date. Measurements were carried out with a Minolta SPAD 502 (Chiyoda, Tokyo, Japan) portable spectrophotometer.
For calibration purposes, 25 leaves with different degrees of chlorosis were first measured with the SPAD, and then collected and grouped in 5 bags according to the green/yellow hue (all leaves in a bag would be similar). 300 mg of plant material were taken from each bag and were ground to fine powder. The photosynthetic pigments were extracted in 80% acetone (10 mL maximum) and molecular absorption was measured at two wavelengths (at 645 and 663 nm) using acetone as a blank.
The molecular absorption spectrometry results, together with the SPAD data, were used to create a calibration curve using the Amon-McKinney formula [42]:
C = ( 20.2 × A 645 + 8.02 × A 663 ) × 10 3 × V × F W 1
where C is the total chlorophyll content (in mg); A645 and A663 represent the absorption at 645 and 663 nm, respectively; V is the volume of the extract (in mL); and FW is the fresh weight of the plant material (in g).
The resulting calibration curve ( y = 0.1023 e 0.0441 x ; r = 0.9812) was in good agreement with those reported for grapevine [43] and for other species [22].

2.7. Statistical Analyses

Correlations between the mineral elements in the petiole were determined at 95% confidence level. For the petiole analyses, ANOVAs at a level of significance of 95% were conducted. Tukey’s multiple range test at 0.05 probability level (p < 0.05) was used for the post hoc comparison of means. All statistical analyses were conducted using IBM SPSS Statistics software (Armonk, NY, USA).

3. Results and Discussion

3.1. Petiole Analyses Results

The results from the petiole analyses conducted at the fruit set and veraison stages are summarized in Table 3 and Table 4, respectively. Significant differences among varieties were detected for all nutrients. Some values were slightly higher (N) or lower (P and Ca) than those reported in the literature, but Fe values were within reported ranges.
Nitrogen would influence juice chemical composition (pH, total soluble solids, total titratable acidity, anthocyanins, and total polyphenols), and organoleptic properties [44]. In particular, total polyphenols normally increase with N and contribute to color intensity, tonality, and taste characteristics of grape and wine [45]. A reduction in soluble solids as a result of excessive growth associated with high N contents may be discarded in this case (because of LIC effects). Further, the value was not high enough to result in a significantly increase in juice pH (which would result in a poorer quality end product), citrate and malate [46].
The low phosphorus values could affect total polyphenol contents and result in a reduction in berry size, berry numbers, berry weights, bunch weights and number of bunches/vine [47]. Conversely, the normal potassium values should lead to an adequate pH and a suitable content of tartaric acid in the must [48]: a stoichiometric exchange of the protons of tartaric acid and K, leading K bitartrate (a salt that precipitates and decreases the organoleptic quality of the wine) would not be expected in this case [49,50]. Other parameters influenced by K nutrition (such as soluble solids [51], technological (sugar) maturity [52] or anthocyanins in the must [53]) should not be negatively affected either.
Apropos of the differences among varieties in terms of Fe content, in the fruit set stage the lowest value corresponded to Tempranillo, followed by Cabernet Sauvignon, Macabeo, Aglianico, Merlot R-3, Merlot R-12, Moristel, Riesling, Chardonnay, Parraleta, Sauvignon and Pinor Noir. In the veraison stage the sequence was very similar: the lowest value corresponded to Tempranillo, followed by Cabernet Sauvignon, Aglianico and Macabeo (which exchanged their positions), Merlot R-3, Merlot R-12, Riesling and Moristel (which also exchanged their positions), Sauvignon, Parraleta, Chardonnay and Pinor Noir. This confirms that Fe absorption (i.e., LIC tolerance) would be genotype dependent [54].
It should be noted that caution should be taken in the interpretation of the correction, deficit or excess of the different contents of nutrients in the petiole, provided that these levels are conditioned by multiple factors, such as the location of the plantation, climatology, chosen rootstock, characteristics of the varieties, cultural practices, stage in which the samples were collected, methods of analysis, etc.
The evolution of the nutrients under study between sampling dates coincided with that already established for other varieties, with a decrease in the N, P and K contents, and an increase in Ca and Mg contents throughout the crop cycle. In the case of micronutrients, clear seasonal trends have barely been revealed, due to the high variability of the values obtained. Seasonal changes in the concentration of nutrients throughout the cycle indicated that it is necessary to establish separate reference levels for each tissue and phenological state, in agreement with Romero [55].
A positive trend in Fe bio-accumulation between periods (difference between fruit set and veraison samples) was observed for all varieties except for Sauvignon (−1.8 mg/kg) and Aglianico (−6.9 mg/kg). Such behavior should be attributed to aforementioned varietal influence, in agreement with Bavaresco [56].
Even for the same variety, differences resulting from the choice of the rootstock would occur [57]. Taking the Tempranillo variety as an example, for a similar soil and climate, differences can observed upon comparison with data reported for the same variety grafted to a R-110 rootstock [58]. Moreover, differences in the mineral content are observed for the same Tempranillo/R-110 combination upon planting in different locations [40].
Regarding the correlations among different nutrient contents, as summarized in Table 5, high correlations between the two sampling dates were only observed for N, Fe and Mn. The high correlation observed for Fe would suggest stability in its absorption, in agreement with Romero [55].
Moderate and high correlations involving Ca, Mg, N and P in the veraison stage were detected and are also highlighted in bold in Table 5. The highest (positive) correlations were found for Ca vs. Mg (in line with Garcia, et al. [59] and other authors), Mg vs. N and Mg vs. P. The high correlations for the latter two pairs of elements may be explained by their synergistic behavior: the increase in the concentration of one of them favors the absorption of the other [60]. Moderate correlations were found for Mg vs. P, Mg vs. N and Ca vs. P (the Ca vs. N correlation was weaker, 0.52). A moderate negative correlation was also found between Mn at the fruit set stage and N in the veraison stage.
The remaining possible correlations between the nutrients remained below 0.5, including all those in which Fe participated, for which no significant correlations with any of the other nutrients were obtained (while other authors found correlations between Mg and Fe contents [55]). This indicated that a higher or lower iron content in the petiole would not imply high or low petiole contents for any of the other nutrients, confirming the so-called “iron paradox” [61].

3.2. Chlorophyll Content Monitoring

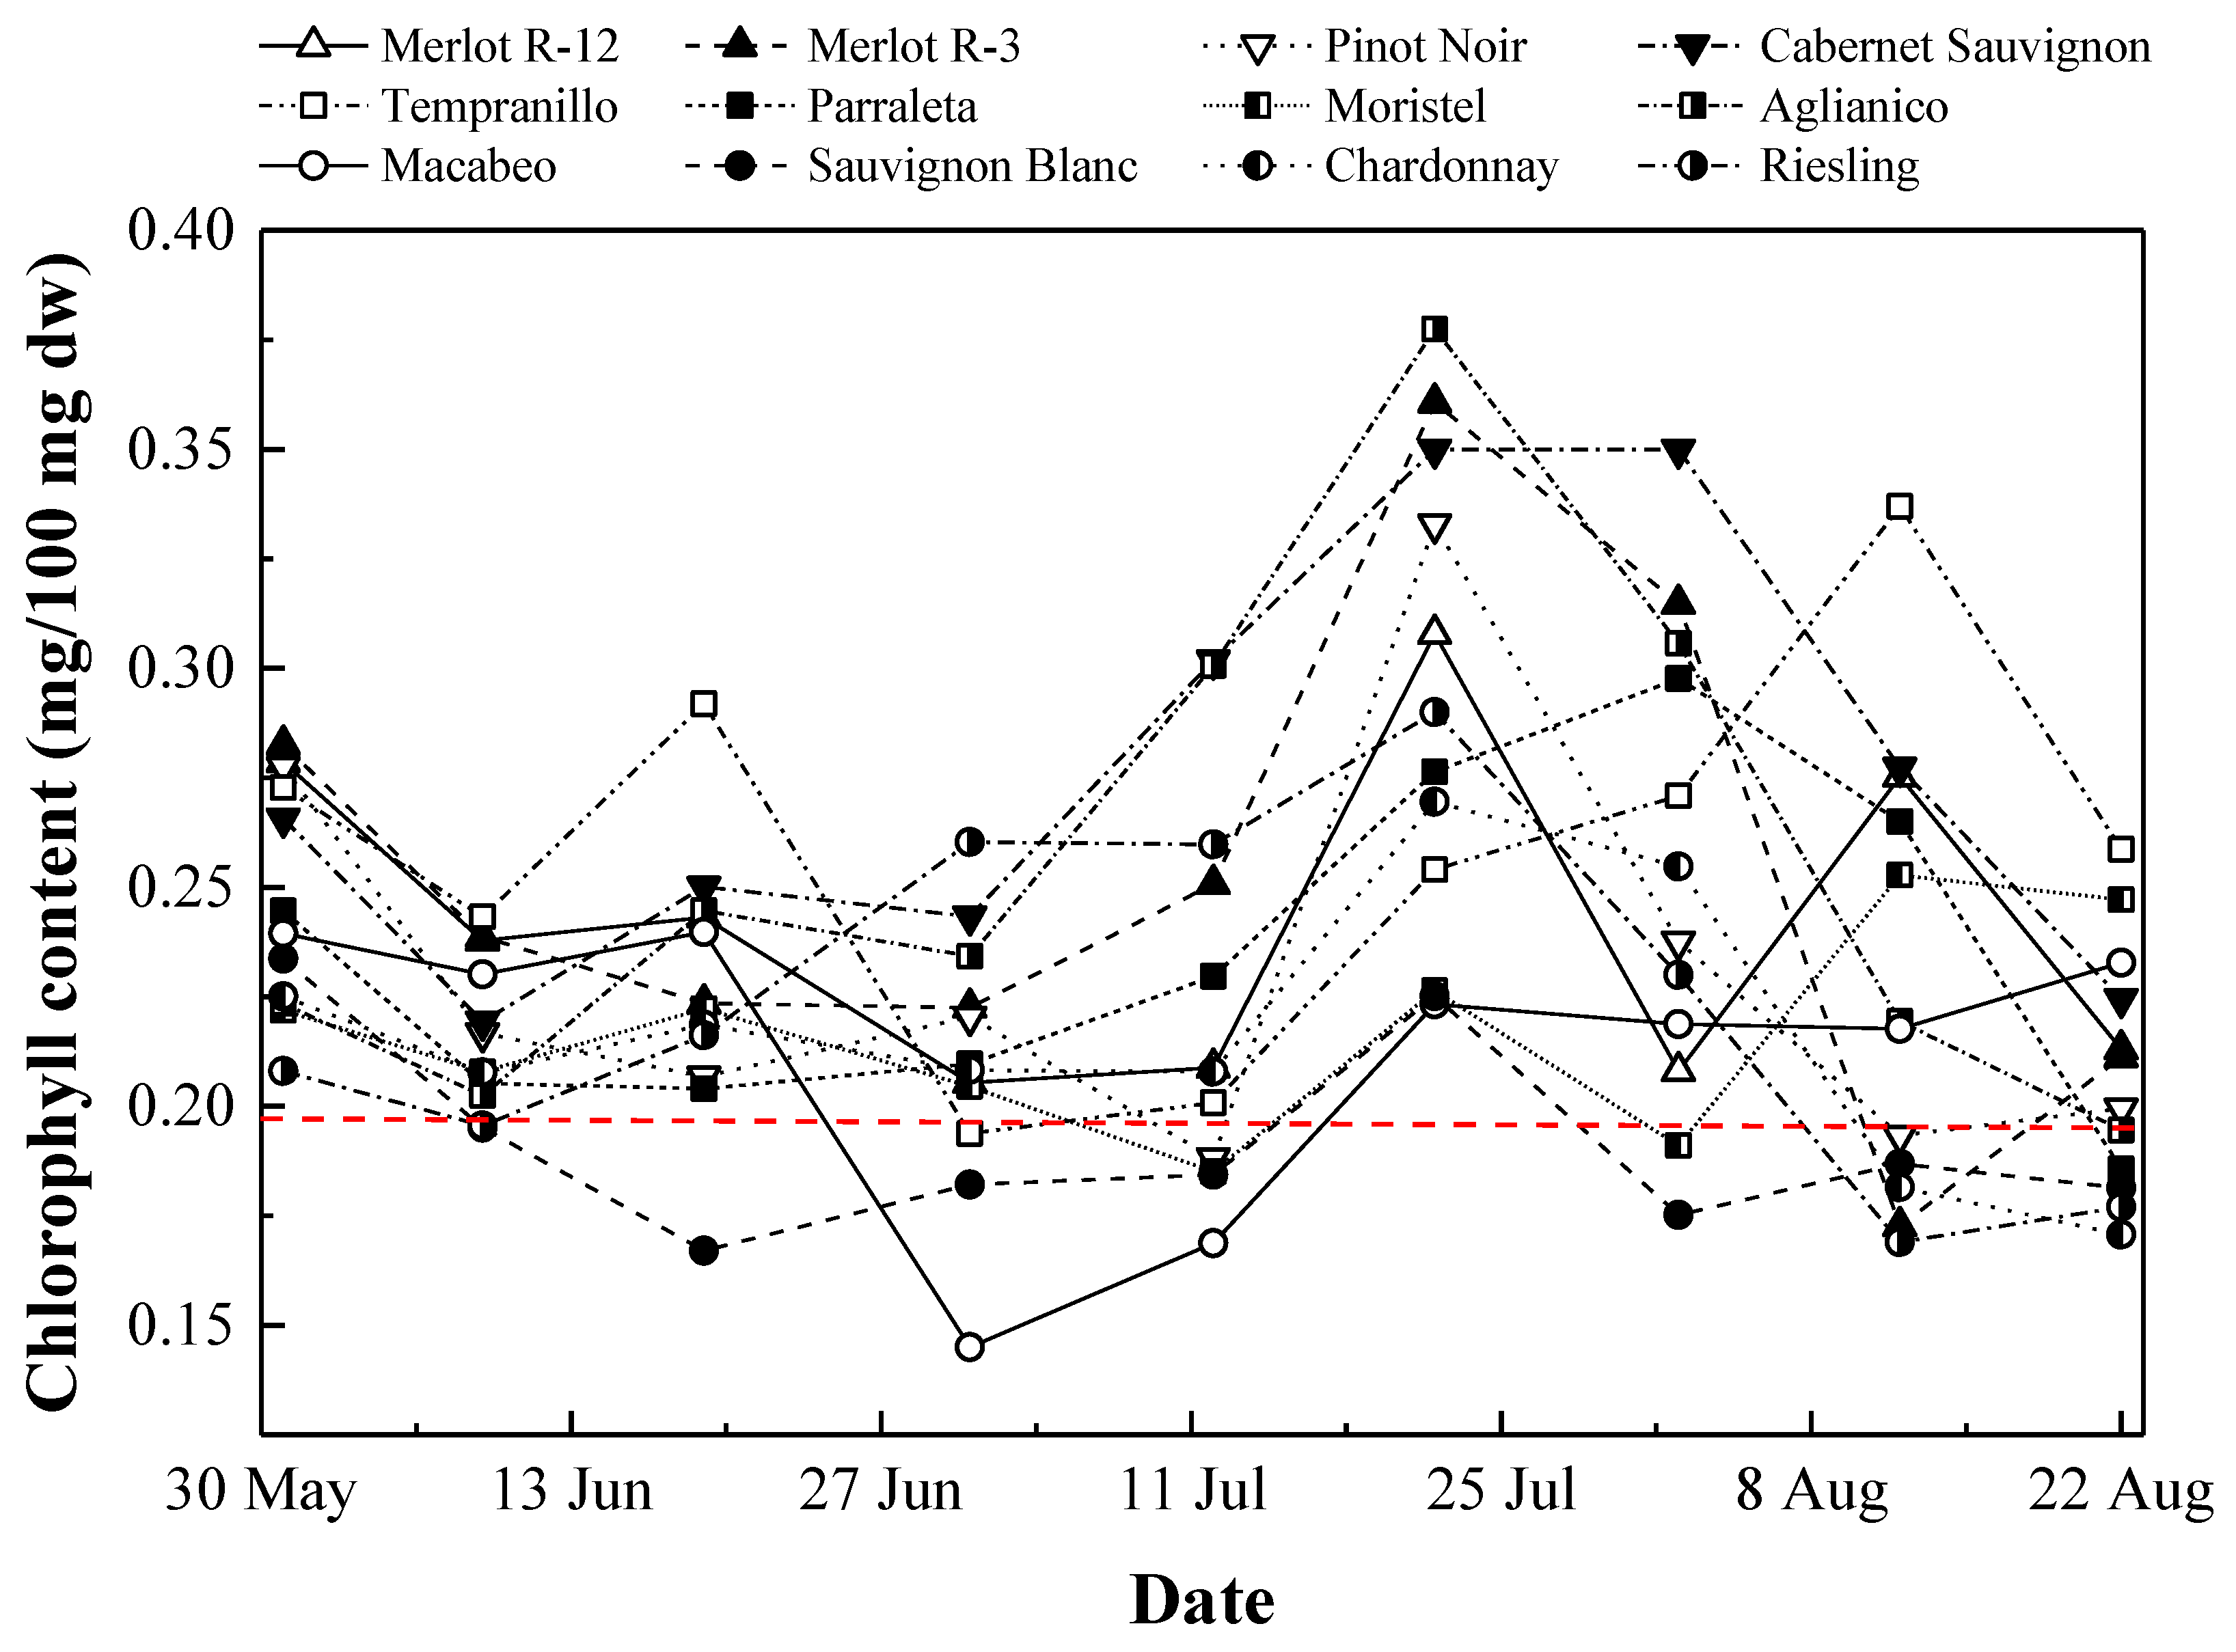
3.2.1. Temporal Evolution

The trend for all varieties (Figure 1) was to increase their chlorophyll content until a maximum was reached in July, and, from then onwards, during the month of August, a gradual decrease in the chlorophyll content occurred. This is an expected behavior according to the physiology of the plant: it can be related to parameters of summer stress or, since it is a deciduous plant, to marcescence (with degradation of pigments), or to both at the same time [62].
The Cabernet Sauvignon and Aglianico varieties stood out, as they featured a very high chlorophyll content in all measurements. Tempranillo and Merlot R-12 varieties also showed high contents at some specific sampling times and always remained above the threshold for 0.198 mg chlorophyll/100 g of leaves (used for separating leaves with a healthy hue from those that begin to present yellowing; value was estimated from visual inspection, according to [63], and the calibration curve). On the contrary, very low chlorophyll content values were observed for Sauvignon all throughout the period of study. In the case of Macabeo and Pinor Noir and—to a lesser extent—Moristel, the chlorophyll content dropped below the critical level in July, so the expected impact of LIC would be higher than in other varieties (viz. Merlot R-3, Riesling, and Chardonnay), in which the chlorophyll levels dropped at the end of August, in the grape ripening stage.
From the reported data it becomes apparent that the occurrence of LIC symptoms is the result of an interaction between scion and rootstock and not just a feature of the rootstock, in line with Bavaresco and Lovisolo [64]: even if the rootstock is lime-tolerant and does not manifest chlorosis at low Fe contents due its genotype, the grafted variety may still be susceptible to LIC. However, the impact of other factors that can aggravate the problem cannot be ruled out. For instance, studies on Riesling variety have shown the influence of drought on chlorosis, advancing the effects of this disorder [65].

3.2.2. Correlation of Chlorophyll and Nutrient Contents

Moderate correlations between chlorophyll contents and Fe content determined from petiole analyses were found (Table 5). Upon comparison of chlorophyll contents from SPAD measurements with the Fe content at the fruit set stage (19th June), the sequence discussed in Section 3.1 was almost inverted (except for Pinor Noir, which moved two positions): the higher the Fe content in the petiole analyses, the lower the chlorophyll content in the leaves (Figure 2). In the veraison stage (12 August) the inverse relationship was less clear (the effect of chlorosis manifests itself a few days later in the basal leaves, which maintain their optimal levels for a longer time, to properly feed the bunch [66]), but Tempranillo and Cabernet varieties, for which the lowest Fe contents in the petiole were determined (23.6 and 31.5 mg/kg, respectively), featured the highest chlorophyll contents in the leaves (0.337 and 0.277 mg/100 mg, respectively). These results would be in agreement with Gezgin and Er [67], who reported that the lowest total Fe content of petioles was found in the “green” leaves (i.e., with very light chlorosis).
Moreover, a moderate inverse correlation between chlorophyll content at the veraison stage and P content at the fruit set stage (−0.74) was also found. This would be in agreement with Martín et al. [11], who also found that the Cab (chlorophyll a + b) concentration correlated inversely with phosphorus levels (r = −0.69; p < 0.05) in the blades, and would also be in line with the observations of other researchers [68]. Nonetheless, since the p content values were slightly lower than those reported in the literature, a certain photo-oxidative stress [69] cannot be excluded.

4. Conclusions

The selection of LIC tolerant grapevine varieties is of particular importance for vineyards in the Mediterranean region, in which the soil conditions for Fe nutrition are sub-optimal due to calcareous soils, because of its impact on productivity and wine quality. In the context of LIC tolerance studies, its effect on nutritional status has been assessed by determining nutrient contents at two development stages (fruit set and veraison) through petiole analysis, confirming significant differences among the eleven grapevine varieties under study, grafted to the same rootstock. The lowest Fe contents corresponded to the Cabernet and Tempranillo varieties, and the highest Fe content to Sauvignon. Inverse relationships between Fe and P contents in the petiole and the chlorophyll content in the young leaves—determined by SPAD—were found. As regards LIC tolerance, the nutrient and chlorophyll content results suggest that Cabernet Sauvignon, Tempranillo and Aglianico varieties would be the preferred choices, while Sauvignon would be the least tolerant. Among the minority varieties from Somontano DO, Parraleta showed best performance.

Author Contributions

Conceptualization, J.C.-G., C.M.-D. and D.B.-V.; Formal analysis, J.C.-G. and P.M.-R.; Investigation, J.C.-G.; Methodology, J.C.-G., P.M.-R., C.M.-D. and D.B.-V.; Resources, C.M.-D. and D.B.-V.; Validation, J.C.-G., P.M.-R., C.M.-D. and D.B.-V.; Visualization, P.M.-R.; Writing—original draft, J.C.-G., P.M.-R., C.M.-D. and D.B.-V.; Writing—review & editing, P.M.-R.

Funding

This research received no external funding.

Acknowledgments

P.M.-R. would like to thank Santander Universidades for its financial support through the “Becas Iberoamérica Jóvenes Profesores e Investigadores, España” scholarship program.

Conflicts of Interest

The authors declare no conflict of interest.

References

  1. Hyvönen, H.; Orama, M.; Saarinen, H.; Aksela, R. Studies on biodegradable chelating ligands: Complexation of iminodisuccinic acid (ISA) with Cu(II), Zn(II), Mn(II) and Fe(III) ions in aqueous solution. Green Chem. 2003, 5, 410–414. [Google Scholar] [CrossRef]
  2. Chen, Y.; Barak, P. Iron nutrition of plants in calcareous soils. Adv. Agron. 1982, 35, 217–240. [Google Scholar]
  3. Tagliavini, M.; Rombolà, A.D. Iron deficiency and chlorosis in orchard and vineyard ecosystems. Eur J. Agron. 2001, 15, 71–92. [Google Scholar] [CrossRef]
  4. Bavaresco, L.; Civardi, S.; Pezzutto, S.; Vezzulli, S.; Ferrari, F. Grape production, technological parameters, and stilbenic compounds as affected by lime-induced chlorosis. Vitis 2005, 44, 63–65. [Google Scholar]
  5. Sabir, A.; Yazar, K.; Sabir, F.; Kara, Z.; Yazici, M.A.; Goksu, N. Vine growth, yield, berry quality attributes and leaf nutrient content of grapevines as influenced by seaweed extract (Ascophyllum nodosum) and nanosize fertilizer pulverizations. Sci. Hortic. 2014, 175, 1–8. [Google Scholar] [CrossRef]
  6. Bavaresco, L.; Poni, S. Effect of calcareous soil on photosynthesis rate, mineral nutrition, and source-sink ratio of table grape. J. Plant Nutr. 2007, 26, 2123–2135. [Google Scholar] [CrossRef]
  7. Pavlousek, P. Tolerance to lime-induced chlorosis and drought in grapevine rootstocks. In Abiotic Stress. Plant Responses and Applications in Agriculture; Vahdati, K., Leslie, C., Eds.; InTech: Vienna, Austria, 2013; pp. 277–306. [Google Scholar]
  8. Pavlousek, P. Tolerance to Lime-Induced Chlorosis and Drought in Grapevine Rootstocks; InTech: Vienna, Austria, 2013; pp. 277–306. [Google Scholar]
  9. Pirie, A.J.; Mullins, M.G. Concentration of phenolics in the skin of grape berries during fruit development and ripening. Am. J. Enol. Vitic. 1980, 31, 34–36. [Google Scholar]
  10. Hall, A.; Lamb, D.W.; Holzapfel, B.; Louis, J. Optical remote sensing applications in viticulture—A review. Aust. J. Grape Wine Res. 2002, 8, 36–47. [Google Scholar] [CrossRef]
  11. Martín, P.; Zarco-Tejada, P.; González, M.; Berjón, A. Using hyperspectral remote sensing to map grape quality in ’Tempranillo’ vineyards affected by iron deficiency chlorosis. Vitis 2007, 46, 7–14. [Google Scholar]
  12. Bavaresco, L.; Giachino, E.; Pezzutto, S. Grapevine rootstock effects on lime-induced chlorosis, nutrient uptake, and source–sink relationships. J. Plant Nutr. 2003, 26, 1451–1465. [Google Scholar] [CrossRef]
  13. Castino, M.; Ubigli, M.; Corino, L.; Luzzati, A.; Siragusa, N.; Nappi, P. Oenological effects of nutrients deficiencies on the grape variety Barbera cultivated in Piedmont vineyards. Vignevini Bol. 1987, 14, 37–54. [Google Scholar]
  14. Veliksar, S.; Toma, S.; Kreidman, J. Effect of Fe-containing compounds on the chlorosis manifestation and grape quality. In Proceedings of the International Workshop on Advances in Grapevine and Wine Research, Venosa, Italy, 15–17 September 2005. [Google Scholar]
  15. Tavares, S.; Vesentini, D.; Fernandes, J.C.; Ferreira, R.B.; Laureano, O.; Ricardo-Da-Silva, J.M.; Amâncio, S. Vitis vinifera secondary metabolism as affected by sulfate depletion: Diagnosis through phenylpropanoid pathway genes and metabolites. Plant Physiol. Biochem. 2013, 66, 118–126. [Google Scholar] [CrossRef] [PubMed]
  16. López-Millán, A.-F.; Grusak, M.A.; Abadía, A.; Abadía, J. Iron deficiency in plants: An insight from proteomic approaches. Front. Plant Sci. 2013, 4. [Google Scholar] [CrossRef] [PubMed] [Green Version]
  17. Covarrubias, J.I.; Pisi, A.; Rombola, A.D. Evaluation of sustainable management techniques for preventing iron chlorosis in the grapevine. Aust. J. Grape Wine Res. 2014, 20, 149–159. [Google Scholar] [CrossRef]
  18. Díaz de la Torre, I.; Del Campillo, M.D.C.; Barrón, V.; Torrent, J. Predicting the occurrence of iron chlorosis in grapevine with tests based on soil iron forms. OENO One 2010, 44. [Google Scholar] [CrossRef]
  19. Pestana, M.; de Varennes, A.; Araújo, E. Diagnosis and correction of iron chlorosis in fruit trees: A review. Food Agric. Environ. 2003, 1, 46–51. [Google Scholar]
  20. Bertoni, G.; Morard, P. Blade or petiole analysis as a guide for grape nutrition. Commun. Soil Sci. Plant Anal. 2008, 13, 593–605. [Google Scholar] [CrossRef]
  21. Benito, A.; Romero, I.; Domínguez, N.; García-Escudero, E.; Martín, I. Leaf blade and petiole analysis for nutrient diagnosis in Vitis vinifera L. cv. Garnacha tinta. Aust. J. Grape Wine Res. 2013, 19, 285–298. [Google Scholar] [CrossRef]
  22. Süß, A.; Danner, M.; Obster, C.; Locherer, M.; Hank, T.; Richter, K. Measuring Leaf Chlorophyll Content with the Konica Minolta SPAD-502Plus—Theory, Measurement, Problems, Interpretation; EnMAP: Potsdam, Germany, 2015; p. 18. [Google Scholar] [CrossRef]
  23. Ruiz-Espinoza, F.H.; Murillo-Amador, B.; García-Hernández, J.L.; Fenech-Larios, L.; Rueda-Puente, E.O.; Troyo-Diéguez, E.; Kaya, C.; Beltrán-Morales, A. Field evaluation of the relationship between chlorophyll content in basil leaves and a portable chlorophyll meter (SPAD-502) readings. J. Plant Nutr. 2010, 33, 423–438. [Google Scholar] [CrossRef]
  24. Brunetto, G.; Trentin, G.; Ceretta, C.A.; Girotto, E.; Lorensini, F.; Miotto, A.; Moser, G.R.Z.; Melo, G.W.D. Use of the SPAD-502 in estimating nitrogen content in leaves and grape yield in grapevines in soils with different texture. Am. J. Plant Sci. 2012, 03, 1546–1561. [Google Scholar] [CrossRef]
  25. Munoz-Huerta, R.F.; Guevara-Gonzalez, R.G.; Contreras-Medina, L.M.; Torres-Pacheco, I.; Prado-Olivarez, J.; Ocampo-Velazquez, R.V. A review of methods for sensing the nitrogen status in plants: Advantages, disadvantages and recent advances. Sensors 2013, 13, 10823–10843. [Google Scholar] [CrossRef] [PubMed]
  26. Gonzalez-Flor, C.; Gorchs, G.; Serrano, L. Assessing petiole iron content in Vitis vinifera ‘Chardonnay’ using reflectance based hyperspectral indices. Acta Hortic. 2013, 101–105. [Google Scholar] [CrossRef]
  27. Retzlaff, R.; Molitor, D.; Behr, M.; Bossung, C.; Rock, G.; Hoffmann, L.; Evers, D.; Udelhoven, T. UAS-based multi-angular remote sensing of the effects of soil management strategies on grapevine. J. Int. Sci. Vigne Vin 2015, 49, 85–102. [Google Scholar] [CrossRef]
  28. Huglin, P.; Schneider, C. Biologie et Écologie de la Vigne, 2nd ed.; Tec & Doc Lavoisier: Paris, France, 1998; p. 370. [Google Scholar]
  29. Badía, D.; Cuchí, J.; Martí, C.; Casanova, J. Los Suelos de los viñedos en la Denominación de Origen Somontano, Ed.; Prensas Universitarias de Zaragoza: Zaragoza, Spain, 2006; Volume 8, p. 205. [Google Scholar]
  30. Tonietto, J.; Carbonneau, A. A multicriteria climatic classification system for grape-growing regions worldwide. Agric. For. Meteorol. 2004, 124, 81–97. [Google Scholar] [CrossRef]
  31. Catania, C.D.; Martín Uliarte, E.; Monte, R.F.D.; Avagnina de del Monte, S.; Antelo Bruno, L.; Molina, J.; Mendoza, O.; Flores, N.; Kohlberg, E.J.; Tonietto, J.; et al. Clima, Zonificación y Tipicidad del vino en Regiones Vitivinícolas Iberoamericanas; CYTED: Madrid, Spain, 2012; p. 411. [Google Scholar]
  32. MAPA. Métodos Oficiales de Análisis. Tomo III; Ministerio de Agricultura, pesca y alimentación: Madrid, Spain, 1994; p. 662. [Google Scholar]
  33. McLean, E.O. Soil pH and lime requirement. In Methods of Soil Analysis. Part 2. Chemical and Microbiological Properties, 2nd ed.; Page, A.L., Miller, R.H., Keeney, D.R., Eds.; ASA-SSSA: Madison, WI, USA, 1982; pp. 199–224. [Google Scholar]
  34. Nelson, R.E. Carbonate and gypsum. In Methods of Soil Analysis. Part 2: Chemical and Microbiological Properties, 2nd ed.; Page, A.L., Miller, R.H., Keeney, D.R., Eds.; ASA-SSSA: Madison, WI, USA, 1982; pp. 181–198. [Google Scholar]
  35. Nelson, D.R.; Sommers, L.E. Total carbon and organic matter. In Methods of Soil Analysis. Part 2: Chemical and Microbiological Properties, 2nd ed.; Page, A.L., Miller, R.H., Keeney, D.R., Eds.; ASA-SSSA: Madison, WI, USA, 1982; pp. 539–557. [Google Scholar]
  36. Rhoades, J.D. Cation exchange capacity. In Methods of Soil Analysis. Part 2: Chemical and Microbiological Properties, 2nd ed.; Page, A.L., Miller, R.H., Keeney, D.R., Eds.; ASA-SSSA: Madison, WI, USA, 1982; pp. 149–158. [Google Scholar]
  37. Rhoades, J.D. Soluble salts. In Methods of Soil Analysis. Part 2: Chemical and Microbiological Properties, 2nd ed.; Page, A.L., Miller, R.H., Keeney, D.R., Eds.; ASA-SSSA: Madison, WI, USA, 1982; pp. 167–180. [Google Scholar]
  38. O.I.V. Organización Internacional de la Viña y el Vino. Resolution Viti 4/95. Diagnostic foliaire: Une méthode harmonisée. Bull. de L’O.I.V 1996, 68, 35–40. [Google Scholar]
  39. Hidalgo Fernández-Cano, L.; Hidalgo Togores, J. Tratado de Viticultura; Mundi-Prensa: Madrid, Spain, 2011; Volume 2. [Google Scholar]
  40. González, M.R.; Martín, P. Niveles de referencia para el diagnóstico nutricional de la vid. Vida Rural 2006, 1, 44–48. [Google Scholar]
  41. Reuter, D.J.; Robinson, J.B. Plant Analysis: An Interpretation Manual; CSIRO Publishing: Collingwood, Australia, 1997. [Google Scholar]
  42. Bavaresco, L. Utilization of a non-destructive chlorophyll meter to assess chlorophyll concentration in gravepine leaves. Bulletin de l’OIV 1995, 68, 404–414. [Google Scholar]
  43. Callejas, R.; Kania, E.; Contreras, A.; Peppi, C.; Morales, L. Evaluación de un método no destructivo para estimar las concentraciones de clorofila en hojas de variedades de uva de mesa. Idesia (Arica) 2013, 31, 19–26. [Google Scholar] [CrossRef] [Green Version]
  44. Chadha, K.; Shikhamany, S. The Grape: Improvement, Production and Post-Harvest Management; Malhotra Publishing House: New Delhi, India, 1999; p. 579. [Google Scholar]
  45. Brunetto, G.; Melo, G.W.B.D.; Toselli, M.; Quartieri, M.; Tagliavini, M. The role of mineral nutrition on yields and fruit quality in grapevine, pear and apple. Revista Brasileira de Fruticultura 2015, 37, 1089–1104. [Google Scholar] [CrossRef]
  46. Cooperative Research Centre for Viticulture. Grapevine Nutrition—Literature Review; Cooperative Research Centre for Viticulture: Mitcham, Australia, 2006; p. 50.
  47. Skinner, P.W.; Matthews, M.A. Reproductive development in grape (Vitis vinifera L.) under phosphorus-limited conditions. Sci. Hortic. 1989, 38, 49–60. [Google Scholar] [CrossRef]
  48. Catalina, A.; Matei, P.; González, R.; González, M.; Martín, P. Relaciones Entre Niveles de Asimilación de Nutrientes y Calidad de la uva en Viñedos cv. Tempranillo Afectados por Clorosis Férrica; IV Jornadas Fertilización SECH. Actas de Horticultura 61: Castelldefels, Spain, 2011; pp. 96–101. [Google Scholar]
  49. Mpelasoka, B.S.; Schachtman, D.P.; Treeby, M.T.; Thomas, M.R. A review of potassium nutrition in grapevines with special emphasis on berry accumulation. Aust. J. Grape Wine Res. 2003, 9, 154–168. [Google Scholar] [CrossRef]
  50. Walker, R.R.; Blackmore, D.H. Potassium concentration and pH inter-relationships in grape juice and wine of Chardonnay and Shiraz from a range of rootstocks in different environments. Aust. J. Grape Wine Res. 2012, 18, 183–193. [Google Scholar] [CrossRef]
  51. Ahlawat, V.; Yamdagni, R. Effects of various levels of nitrogen and potassium application on growth yield and petiole composition on grapes cv. Perlette. Progress. Hortic. 1988, 20, 190–196. [Google Scholar]
  52. Morris, J.R.; Cawthon, D.L.; Fleming, J.W. Effects of high rates of potassium fertilization on raw product quality and changes in pH and acidity during storage of Concord grape juice. Am. J. Enol. Vitic. 1980, 31, 323–328. [Google Scholar]
  53. Delgado, R.; Martín, P.; delÁlamo, M.; González, M.-R. Changes in the phenolic composition of grape berries during ripening in relation to vineyard nitrogen and potassium fertilisation rates. J. Sci. Food Agric. 2004, 84, 623–630. [Google Scholar] [CrossRef]
  54. Ksouri, R.; Debez, A.; Mahmoudi, H.; Ouerghi, Z.; Gharsalli, M.; Lachaâl, M. Genotypic variability within Tunisian grapevine varieties (Vitis vinifera L.) facing bicarbonate-induced iron deficiency. Plant Physiol. Biochem. 2007, 45, 315–322. [Google Scholar] [CrossRef] [PubMed]
  55. Romero, I. Análisis de limbo y peciolo para el diagnóstico nutricional de la vid (Vitis vinifera L.), cv. Tempranillo; Univeridad de La Rioja: Logroño, Spain, 2015. [Google Scholar]
  56. Bavaresco, L. Investigations on some physiological parameters involved in chlorosis occurrence in different grapevine rootstocks and a Vitis vinifera cultivar. Vitis 1990, 29, 305–317. [Google Scholar]
  57. Rustioni, L.; Grossi, D.; Brancadoro, L.; Failla, O. Characterization of iron deficiency symptoms in grapevine (Vitis spp.) leaves by reflectance spectroscopy. Plant Physiol. Biochem. 2017, 118, 342–347. [Google Scholar] [CrossRef] [PubMed]
  58. Romero, I.; García-Escudero, E.; Martín, I. Effects of leaf position on blade and petiole mineral nutrient concentration of Tempranillo grapevine (Vitis vinifera L.). Am. J. Enol. Vitic. 2010, 61, 544–550. [Google Scholar] [CrossRef] [Green Version]
  59. Garcia, M.; Daverede, C.; Gallego, P.; Toumi, M. Effect of various potassium-calcium ratios on cation nutrition of grape grown hydroponically. J. Plant Nutr. 2008, 22, 417–425. [Google Scholar] [CrossRef]
  60. Skinner, P.W.; Matthews, M.A. A novel interaction of magnesium translocation with the supply of phosphorus to roots of grapevine (Vitis vinifera L.). Plant Cell Environ. 1990, 13, 821–826. [Google Scholar] [CrossRef]
  61. Römheld, V. The chlorosis paradox: Fe inactivation as a secondary event in chlorotic leaves of grapevine. J. Plant Nutr. 2000, 23, 1629–1643. [Google Scholar] [CrossRef]
  62. Hailemichael, G.; Catalina, A.; Gonzalez, M.R.; Martin, P. Relationships between water status, leaf chlorophyll content and photosynthetic performance in Tempranillo vineyards. S. Afr. J. Enol. Vitic. 2016, 37, 149–156. [Google Scholar] [CrossRef]
  63. Montañés García, L.; Sanz Encinas, M. Diagnóstico visual de la clorosis férrica [tr. Visual diagnosis of iron deficiency]. ITEA 1997, 93, 7–22. [Google Scholar]
  64. Bavaresco, L.; Lovisolo, C. Effect of grafting on grapevine chlorosis and hydraulic conductivity. VITIS-J. Grapevine Res. 2015, 39, 89. [Google Scholar]
  65. Zulini, L.; Rubinigg, M.; Zorer, R.; Bertamini, M. Effects of drought stress on chlorophyll fluorescence and photosynthetic pigments in grapevine leaves (Vitis vinifera cv. ’White Riesling’). Acta Hortic. 2007, 289–294. [Google Scholar] [CrossRef]
  66. Almanza-Merchán, P.; González-Almanza, S.; Balaguera-Lópe, H. La posición de la hoja y su efecto sobre la calidad y producción de frutos de vid (Vitis vinifera L.) var. Riesling x Silvaner Leaf position and its effect on quality and yield of the grapevine fruit (Vitis vinifera L.)‘Riesling x Silvaner’. Rev. Colomb. Cinecias Hortíc. 2012, 6, 9–18. [Google Scholar] [CrossRef]
  67. Gezgin, S.; Er, F. Relationship between total and active iron contents of leaves and observed chlorosis in vineyards in Konya-Hadmalada region of Turkey. Commun. Soil Sci. Plant Anal. 2007, 32, 1513–1521. [Google Scholar] [CrossRef]
  68. Jones, J.B.; Wallace, A. Sample preparation and determination of iron in plant tissue samples. J. Plant Nutr. 2008, 15, 2085–2108. [Google Scholar] [CrossRef]
  69. Hernández, I.; Munné-Bosch, S. Linking phosphorus availability with photo-oxidative stress in plants. J. Exp. Bot. 2015, 66, 2889–2900. [Google Scholar] [CrossRef] [PubMed] [Green Version]
Figure 1. Evolution of chlorophyll content for the different grapevine varieties under study. Only average values are shown for clarity purposes. The level at which LIC occurs (0.198 mg/100 mg, dw) is indicated with a red dashed line.
Beverages 04 00090 g001
Figure 2. Chlorophyll content vs. Fe content at the fruit set stage.
Beverages 04 00090 g002
Table 1. Rainfall and temperature in the three months during in the grapevines were monitored (June, July and August 2015).
Climatic conditionsJuneJulyAugust
Rainfall (mm)30.677.639.8
Mean maximum temperature (°C)39.542.036.7
Mean minimum temperature (°C)10.711.410.2
Average daily temperature (°C)22.926.323.7
Table 2. Soil analyses results at two depths (0–30 cm and 30–60 cm).
ParameterDepth
0–30 cm30–60 cm
Coarse fraction (%)2.150.88
pH (H2O)8.78.8
pH (KCl)7.98.0
Total carbonates (% CaCO3 eq.)32.431.7
Active limestone (% CaCO3)21.922.1
Bicarbonate (meq/L, saturated paste extract)3.152.86
Organic matter (%)1.121.19
Total N (%)0.0890.079
C/N ratio7.38.7
ECe (dS/m, 25 °C)1.011.05
K (ammonium acetate, mg/kg)457.79378.35
P (Olsen-Watanabe, mg/kg)7.477.16
Mg (ammonium acetate, mg/kg)112.11148.62
Total Fe (mg/kg)10,289.5414,576
Fe-EDTA (mg/kg)42.6451.76
Fe (ammonium oxalate, mg/kg)68.4374.99
Mn-DTPA (mg/kg)1.552.17
K/Mg ratio1.270.78
Chlorotic power index46.8340.63
Table 3. Petiole analyses results (on dry weight) at the fruit set stage for the different grapevine varieties.
VarietyN (%)K (%)P (%)Mg (%)Ca (%)Fe (mg/kg)Mn (mg/kg)
Merlot R-121.25 ± 0.09 a3.76 ± 0.72 a0.27 ± 0.005 ** c1.29 ± 0.08 a1.21 ± 0.06 e55.33 ± 2.83 ef34.55 ± 18.17 bcd
Merlot R-31.37 ± 0.01 * abc3.84 ± 0.32 a0.19 ± 0.020 ** b1.48 ± 0.09 ab1.05 ± 0.11 de51.05 ± 1.16 de52.74 ± 10.33 d
Pinot Noir1.32 ± 0.02 * ab2.85 ± 0.12 a0.07 ± 0.010 a1.21 ± 0.11 a1.03 ± 0.16 cde83.38 ± 4.00 i40.01 ± 9.58 cd
Cabernet S.1.82 ± 0.09 * de2.73 ± 0.12 a0.14 ± 0.005 b1.76 ± 0.03 b0.83 ± 0.03 abcd28.63 ± 7.04 ab37.28 ± 4.16 cd
Tempranillo1.55 ± 0.05 * bcd3.47 ± 0.88 a0.09 ± 0.020 ** a1.06 ± 0.25 a0.76 ± 0.14 ab19.96 ± 2.89 a7.95 ± 1.03 a
Parraleta2.74 ± 0.01 * h3.34 ± 0.87 a0.38 ± 0.000 ** fg1.49 ± 0.08 ab0.81 ± 0.01 abcd74.53 ± 1.86 hi12.61 ± 1.44 ab
Moristel1.79 ± 0.07 * de5.81 ± 0.47 b 0.24 ± 0.005 ** c1.30 ± 0.16 a0.80 ± 0.01 abcd57.51 ± 4.78 efg16.82 ± 1.04 abc
Aglianico1.90 ± 0.15 * ef4.00 ± 0.35 a0.32 ± 0.005 ** de1.51 ± 0.08 ab0.78 ± 0.02 abc43.72 ± 2.40 cd35.46 ± 7.21 bcd
Macabeo2.14 ± 0.10 * fg3.47 ± 0.12 a0.36 ± 0.005 ** ef1.75 ± 0.05 b0.91 ± 0 06 bcd34.25 ± 3.00 bc12.95 ± 0.68 ab
Sauvignon2.32 ± 0.07 * g3.27 ± 0.28 a0.45 ± 0.005 ** h1.77 ± 0.27 b0.71 ± 0.06 ab77.62 ± 3.12 hi17.73 ± 2.97 abc
Chardonnay1.62 ± 0.12 * cde2.69 ± 0.06 a0.28 ± 0.040 ** cd1.26 ± 0.17 a0.63 ± 0.02 a67.89 ± 2.57 gh19.77 ± 3.12 abc
Riesling1.76 ± 0.22 * de3.10 ± 1.04 a0.43 ± 0.007 ** gh1.15 ± 0.18 a0.91 ± 0.02 abcd65.32 ± 5.52 fgh7.50 ± 0.96 a
* Values higher than those in the reference tables in [39,40,41]; ** values lower than those in the reference tables in [39,40,41]. Values followed by the same letter within each column are not significantly different at p < 0.05.
Table 4. Petiole analyses results (on dry weight) at the veraison stage for the different grapevine varieties.
VarietyN (%)K (%)P (%)Mg (%)Ca (%)Fe (mg/kg)Mn (mg/kg)
Merlot R-120.57 ± 0.02 a3.80 ± 0.25 bc0.10 ± 0.01 ** abc2.91 ± 0.18 a1.42 ± 0.07 a57.61 ± 3.87 d93.67 ± 11.36 a
Merlot R-30.70 ± 0.03 ab3.27 ± 0.72 ab0.15 ± 0.005 de3.22 ± 0.17 a1.41 ± 0.07 a55.10 ± 1.94 d452.93 ± 109.24 c
Pinot Noir0.76 ± 0.03 ab2.37 ± 0.75 ab0.15 ± 0.01 de2.73 ± 0.34 a1.59 ± 0.11 a92.65 ± 1.23 g242.83 ± 69.61 abc
Cabernet S.0.82 ± 0.17 ab2.73 ± 0.32 ab0.12 ± 0.00 ** bcd3.63 ± 0.78 ab1.40 ± 0.13 a31.52 ± 1.63 ab398.35 ± 87.44 bc
Tempranillo1.02 ± 0.06 * bc3.31 ± 0.25 abc0.08 ± 0.03 ** ab3.08 ± 0.55 a1.00 ± 0.03 ** a23.61 ± 1.96 ** a14.09 ± 6.86 ** a
Parraleta1.69 ± 0.45 * d2.43 ± 0.26 ab0.27 ± 0.000 f5.55 ± 2.31 b2.79 ± 0.78 b83.73 ± 3.66 fg271.48 ± 198.72 abc
Moristel1.04 ± 0.07 * bc2.86 ± 1.24 ab0.06 ± 0.03 ** a2.77 ± 0.52 a1.13 ± 0.23 ** a72.02 ± 0.40 e102.77 ± 15.98 a
Aglianico1.21 ± 0.10 * c5.04 ± 0.91 c0.18 ± 0.005 e2.91 ± 0.05 a1.05 ± 0.10 ** a36.83 ± 5.14 bc351.97 ± 89.83 bc
Macabeo1.25 ± 0.04 * c1.83 ± 0.39 a0.14 ± 0.02 ** cd3.35 ± 0.64 a1.49 ± 0.42 a45.55 ± 3.04 c199.17 ± 71.56 ab
Sauvignon1.05 ± 0.01 * bc3.92 ± 0.07 bc0.09 ± 0.005 ** ab3.64 ± 0.21 ab1.05 ± 0.03 ** a75.94 ± 4.97 ef231.01 ± 13.99 abc
Chardonnay1.05 ± 0.03 * bc2.74 ± 0.12 ab0.24 ± 0.005 f3.80 ± 0.13 ab1.45 ± 0.05 a86.36 ± 2.58 g346.51 ± 94.40 bc
Riesling1.23 ± 0.03 * c2.24 ± 0.18 ab0.11 ± 0.007 ** bcd2.98 ± 0.37 a1.45 ± 0.14 a68.76 ± 0 63 e72.30 ± 21.22 a
* Values higher than those in the reference tables in [39,40,41]; ** values lower than those in the reference tables in [39,40,41]. Values followed by the same letter within each column are not significantly different at p < 0.05.
Table 5. Correlations among different nutrient contents in the petiole analyses in the two stages under study, and the chlorophyll contents (Chl) in those two stages. Subscripts f and v stand for fruit set and veraison, respectively. Statistically significant values (p < 0.05) are highlighted in bold.
KfKvCafCavMgfMgvNfNvPfPvFefFevMnfMnvChlfChlv
Kf1
Kv0.251
Caf0.06−0.071
Cav−0.26−0.480.121
Mgf−0.100.08−0.140.071
Mgv−0.31−0.24−0.340.810.331
Nf−0.02−0.12−0.520.490.550.751
Nv0.00−0.22−0.550.520.140.650.861
Pf0.030.05−0.230.200.350.360.650.591
Pv−0.35−0.07−0.290.680.150.750.440.550.291
Fef0.03−0.070.240.39−0.030.160.210.120.340.011
Fev−0.08−0.33−0.010.45−0.180.270.130.150.270.270.801
Mnf−0.040.340.52−0.110.19−0.27−0.52−0.67−0.47−0.010.06−0.071
Mnv−0.280.15−0.110.180.540.300.09−0.08−0.080.54−0.040.040.671
Chlf0.190.11−0.020.02−0.140.120.030.01−0.41−0.19−0.47−0.55−0.22−0.411
Chlv−0.020.000.22−0.25−0.41−0.41−0.53−0.30−0.74−0.24−0.66−0.650.12−0.230.611

