Article

Coffee Label Assessment Using Sensory and Biometric Analysis of Self-Isolating Panelists through Videoconference

1
Digital Agriculture, Food and Wine Group, School of Agriculture and Food, Faculty of Veterinary and Agricultural Sciences, University of Melbourne, Parkville, VIC 3010, Australia
2
London College of Fashion, University of the Arts London, London WC1V 7EY, UK
*
Author to whom correspondence should be addressed.
Beverages 2021, 7(1), 5; https://doi.org/10.3390/beverages7010005
Submission received: 30 December 2020 / Revised: 15 January 2021 / Accepted: 19 January 2021 / Published: 21 January 2021
(This article belongs to the Special Issue Coffee and its Consumption: Benefits and Risks)

Abstract

:
Label concepts, information, logos, figures, and colors of beverages are critical for consumer perception, preference, and purchase intention. This is especially relevant for new beverage products. During social isolation, many sensory laboratories were unable to provide services, making virtual sensory sessions relevant to studying different label concepts and design preferences among consumers. This study proposed a novel virtual sensory system to analyze coffee labels using videoconference, self-reported, and biometric analysis software from video recordings to obtain sensory and emotional responses from 69 participants (power analysis: 1 − β > 0.99) using six different label concepts: (i) fun, (ii) bold, (iii) natural, (iv) everyday, (v) classic, and (vi) premium. The results show that the label concept rated as having the highest perceived quality was premium, presenting significant differences (p < 0.05) compared to all of the other concepts. The least perceived quality score was attributed to the bold concept due to the confronting aroma lexicon (cheese dip), which is supported by previous studies. Furthermore, even though graphics, colors, and the product name can be considered positive attributes, they do not determine perceived quality or purchase intention, which was found for the bold, everyday, and classic concepts. The findings from this study were as expected and are consistent with those from similar publications related to labels, which shows that the proposed virtual method for sensory sessions and biometrics is reliable. Further technology has been proposed to use this system with multiple participants, which could help beverage companies perform virtual sensory analysis of new products’ labels.

1. Introduction

Packaging and the information presented on labels are the first points of contact between products and consumers, especially for new products and those unfamiliar to consumers. Therefore, packaging and labels play a significant role in determining preference, liking, and purchase intention [1,2]. Sensory analysis of packaging, labels, and label information is the easiest assessment that can be conducted in social isolation and when products are not as physically available for other sensory assessments. Packaging, labels, and label information can be presented to panelists and consumers through images as stimuli, which have been shown to render similar results statistically compared to those when the packaging is physically available [3] and compared to the sensory characteristics of other products, such as chocolate [4], yogurt [5], beef [6], and baby formula [3]. Furthermore, label designs are one of the most important factors defining the preference and purchase intention of consumers toward wines in general [7], consumers with low involvement [8], and millennials [9], especially when assessing labels with recognizable features, such as animals, novelty designs [7], and colors [10].
There are many other sensory assessments of labels of products for specific purposes, such as the investigation of the effects on the preference of product designation of origin (PDO) [11], the influence of the lexicon used on labels [12], and the sensory perception of labels of different products [1]. Many studies have also found that the preferred information on labels is related to health implications, such as for organic products, which are more related to quality perception [13]. In coffee labels and sensory perception, a study found that aroma descriptors on labels are more associated with positive perception and liking than taste descriptors [14]. The latter is different from other studies in which labels influence taste perception [15], preference, and purchase intention [4].
During the pandemic of 2020 (COVID-19), many sensory laboratories around the world had to cease operations during lockdown periods, and in 2021, many may not be able to resume normal sensory sessions or will be restricted due to social distancing. Hence, there is a requirement for the implementation of digital tools to perform sensory tests remotely. Many commercial software manufacturers started developing online tools for sensory analysis, such as Affectiva (Affectiva, Boston, MA, USA), Noldus (Face Reader, Noldus Information Technology, Wageningen, Netherlands), and MorphCast® (MorphCast, Florence, Italy), among others. The Digital Agriculture, Food and Wine (DAFW) research group, belonging to the University of Melbourne, has been developing these tools since 2012, which has resulted in the BioSensory computer application (app) [16]. This app allows incorporating self-reported sensory assessments and biometrics, using videos from panelists recorded automatically for different questions that are customizable to fit different tests, such as in-app assessment of images, sound, and videos, in which hedonic, continuous line, check all that apply using either words or emojis, and ranking scales can be used. The technology and algorithms developed within the BioSensory app are based on artificial intelligence and machine learning to obtain biometrics from video analysis, such as heart rate changes, blood pressure, emotional response based on facial expressions, and posture changes. Hence, this system is versatile enough to be implemented using online communication through synchronous media with Zoom (Zoom Video Communications, Inc., San Jose, CA, USA), WebEx (Cisco Systems, Milpitas, CA, USA), Google Meetings (Google, LLC, Mountain View, CA, USA), or Hangouts (Google, LLC, Mountain View, CA, USA), and data gathering with, for example, Google Forms (Google, LLC, Mountain View, CA, USA), Microsoft Forms (Microsoft Corporation, Redmond, WA, USA), Compusense (Compusense Inc., Guelph, ON, Canada), RedJade (RedJade Sensory Solutions, LLC, Martinez, CA, USA), and Fizz (Biosystemes, Couternon, France), among others.
This research was based on the working hypothesis that by implementing online freeware resources and novel biometric methods that are comparable to more traditional techniques performed in sensory laboratories requiring the participants’ attendance, it is possible to perform sensory analysis of new product coffee labels in social isolation. Therefore, this study aimed to implement accessible digital tools, such as Zoom, Google Forms, and Affectiva, to remotely assess the sensory, emotional, and biometric responses of panelists to newly designed coffee labels using virtual sensory sessions.

2. Materials and Methods

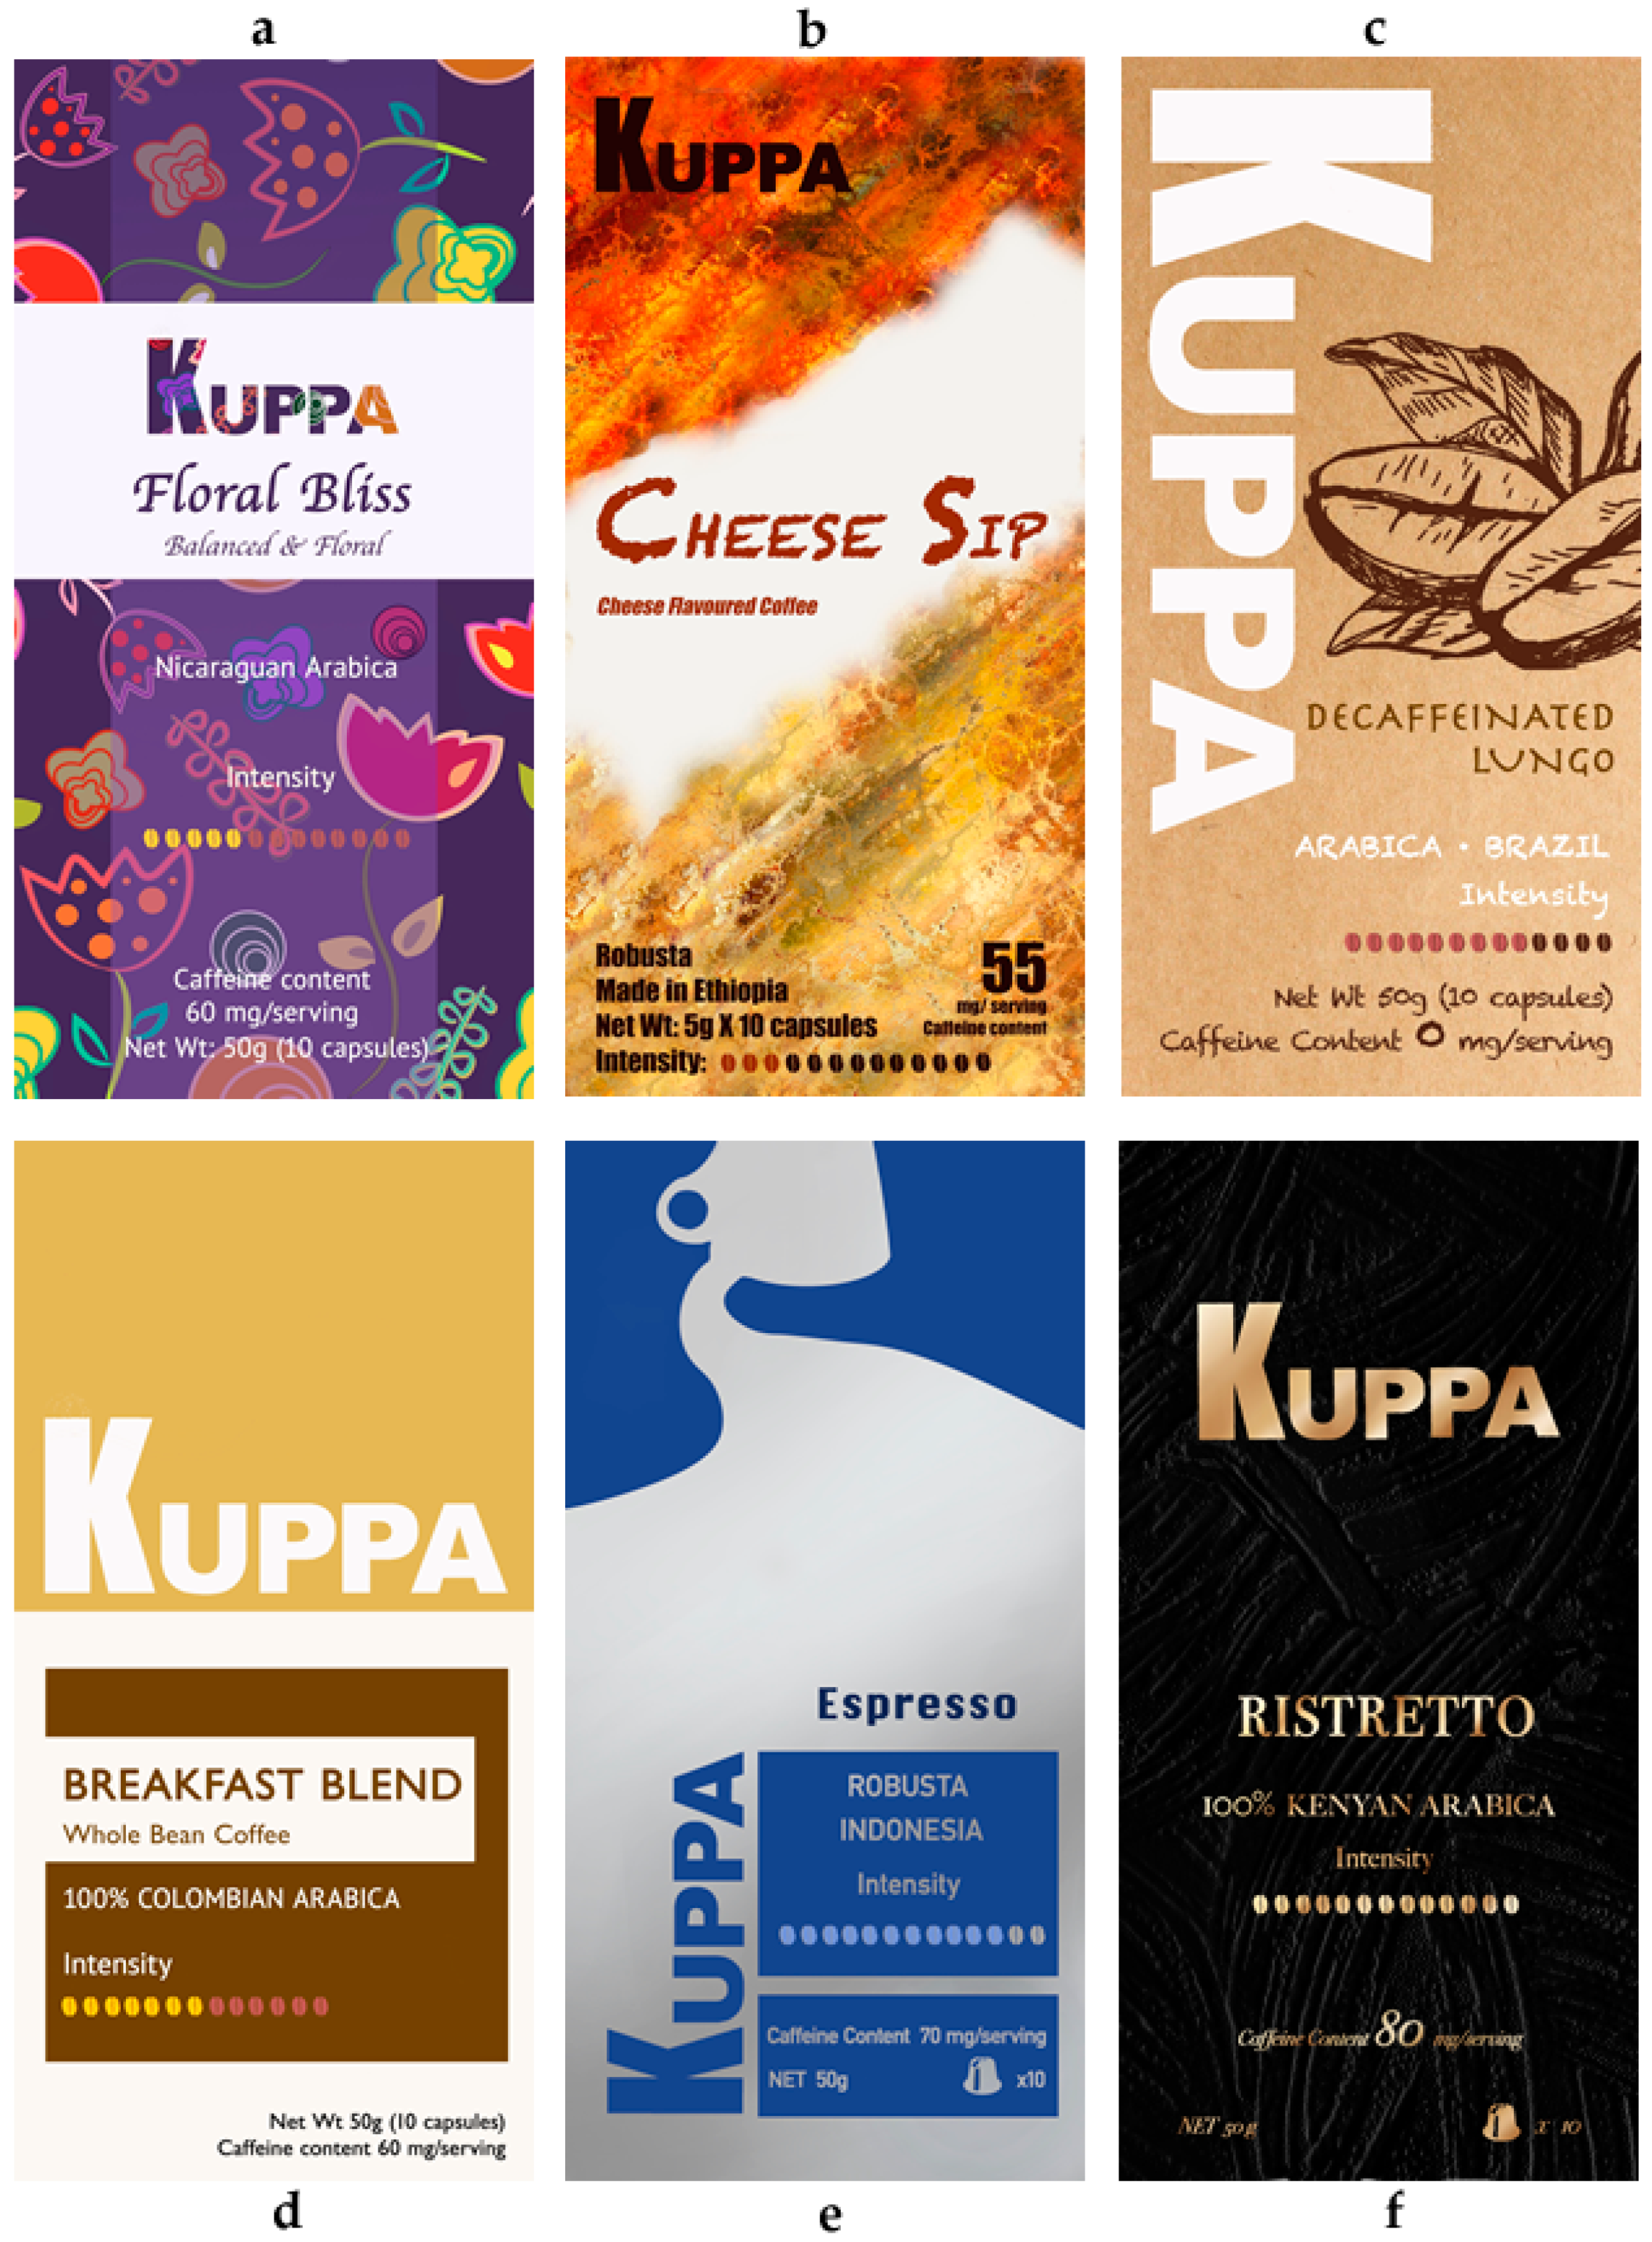
2.1. Label Sample Description

Six labels for coffee pods with different intensity levels and caffeine content were designed based on the TNS NeedScope model™ (NeedScope International, Auckland, New Zealand) segments. These concepts had different market classifications: (i) fun, (ii) bold, (iii) everyday, (iv) natural, (v) classic, and (vi) premium (Figure 1a–f, respectively) [2,17,18]. The elements considered for the label design to meet each concept’s layers (archetypes, needs, and emotions) involved colors, the layout of the different components, fonts, patterns/textures, graphics, the brand, the logo, the intensity scale, and the product name. All labels were developed using Photoshop (Adobe Inc., San Jose, CA, USA) and Procreate (Savage Interactive, North Hobart, Tas, Australia).

2.2. Consumer Sensory Session

A virtual sensory session was conducted with 69 participants (Age: 21–53 years old; 78% female, 22% male) recruited from the staff and students from The University of Melbourne (UoM), Australia, and e-mails to personal contacts; participants were regular coffee consumers (at least once a week). According to the Power analysis conducted using SAS® v. 9.4 (SAS Institute, Cary, NC, USA), the number of participants was statistically sufficient to find significant differences between samples (1 − β > 0.99). The sessions lasted 10–15 min per participant and were conducted via Zoom (Zoom Video Communications, Inc., San Jose, CA, USA) using Google Forms (Google, LLC, Mountain View, CA, USA) to display the questionnaire and labels. This setup allowed a host to monitor the session in the background and record videos of the participants while looking at the label (15 s) to obtain their biometrics through facial recognition to further assess their emotional subconscious responses [16,19]. Before the session, the participants were asked to read the plain language statement explaining the experiment and sign a consent form, both approved by the Human Ethics Advisory Group from the UoM (ID: 1953926.4). They were also instructed to take the session in a quiet place with uniform lighting and a neutral background to avoid any interruptions and potential bias. Besides the written instructions, a video was presented to each participant before the session explaining these instructions with subtitles for non-native English speakers. The testing setting of each participant was verified before the researcher started the sessions to initiate the test.
The labels were randomized once (prior to the questionnaire development) and presented in a fixed order for all participants; the order presented is shown in Figure 1. The questionnaire consisted of the assessment of acceptability based on different attributes, such as perceived strength, pleasantness (valence) [20], arousal [21,22], FaceScale (emotional response), perceived quality, and willingness to purchase (Table 1), as well as check all that apply (CATA) questions for emojis and preferred areas of interest from label elements (Table 2).

2.3. Video Analysis to Obtain Biometrics

All videos from participants recorded per sample were analyzed in batch using an automatic computer application developed by the Digital Agriculture Food and Wine (DAFW) group based on the Affectiva (Affectiva, Boston, MA, USA) software development kit (SDK). This application is able to assess participants’ facial expressions from videos using a histogram of the oriented gradient algorithms, which are automatically translated into emotions and related emojis (Table 3) using support vector machine modeling algorithms in a batch analysis fashion [19,23].

2.4. Statistical Analysis

All quantitative data (Table 1 and Table 3) were analyzed through ANOVA to assess significant differences among samples (p < 0.05), with the least significant differences post hoc test (α = 0.05) using XLSTAT ver. 2020.3.1 (Addinsoft, New York, NY, USA). Frequency data were analyzed using Cochran’s Q test (p < 0.05) and McNemar with Bonferroni correction post hoc test for pairwise comparison using XLSTAT.
The XLSTAT software was also used to conduct multivariate data analysis as multiple factor analysis (MFA) with mixed data (quantitative and frequencies) based on correlations between variables and factors using all parameters assessed in the sensory session (Table 1, Table 2 and Table 3) and eliminating those whose correlation coefficient (r) did not contribute much to both factors (r < 0.35 in both F1 and F2). Furthermore, a customized Matlab® R2020b (Mathworks Inc., Natick, MA, USA) code was used to develop a matrix using the quantitative data (Table 1 and Table 3) to assess only the significant correlations (p < 0.05) between the self-reported and biometric responses.

3. Results

3.1. Biometrics for Emotional Responses

Non-significant differences (p > 0.05) were found between the six coffee labels for any of the biometric emotional responses from participants; the means and standard error are shown in Supplementary Material Table S1. On the other hand, Table 4 shows that all attributes from the acceptance test self-reported responses had significant differences (p < 0.05) between samples. The bold label was rated as the lowest in perceived strength (4.27), pleasantness (4.20), FaceScale (4.19), perceived quality (PQuality) (4.55), and willingness to purchase (WPurchase) (3.70), while the natural label was rated as the lowest in arousal (3.75). On the other hand, the premium label was rated the highest in strength (8.48), arousal (6.27), and PQuality (7.95). Furthermore, premium was non-significantly different to natural in pleasantness (6.77 and 7.31, respectively), FaceScale (6.94 and 7.09, respectively), and WPurchase (6.61 and 6.80, respectively).

3.2. Emotional Responses Based on Emojis

Table 5 shows that there were non-significant differences (p > 0.05) between samples in the selection of emojis, such as Beverages 07 00005 i004, Beverages 07 00005 i006, Beverages 07 00005 i007, Beverages 07 00005 i009, Beverages 07 00005 i010, Beverages 07 00005 i011, Beverages 07 00005 i012, Beverages 07 00005 i016, and Beverages 07 00005 i018. The premium label presented a high frequency of selections for positive emojis, such as Beverages 07 00005 i002, Beverages 07 00005 i013, Beverages 07 00005 i014, Beverages 07 00005 i015, and Beverages 07 00005 i005, and shared the emojis Beverages 07 00005 i002, Beverages 07 00005 i013, and Beverages 07 00005 i014 with everyday and bold, presenting non-significant differences among these three labels. On the other hand, classic had the highest frequency of selections for doubtful/pensive emojis such as Beverages 07 00005 i003, Beverages 07 00005 i008, and Beverages 07 00005 i019. The neutral emoji Beverages 07 00005 i017 was most selected for fun and natural labels.

3.3. Sensory Perception of Label Features

Table 6 shows non-significant differences (p < 0.05) between samples for the selection of logo, intensity scale, and product name. In premium, the most selected areas of interest (AOI) were colors, layout, and pattern/texture, showing significant differences with fun and classic. The latter was the lowest in the frequency of selections for all AOI.

3.4. Multivariate Data Analysis
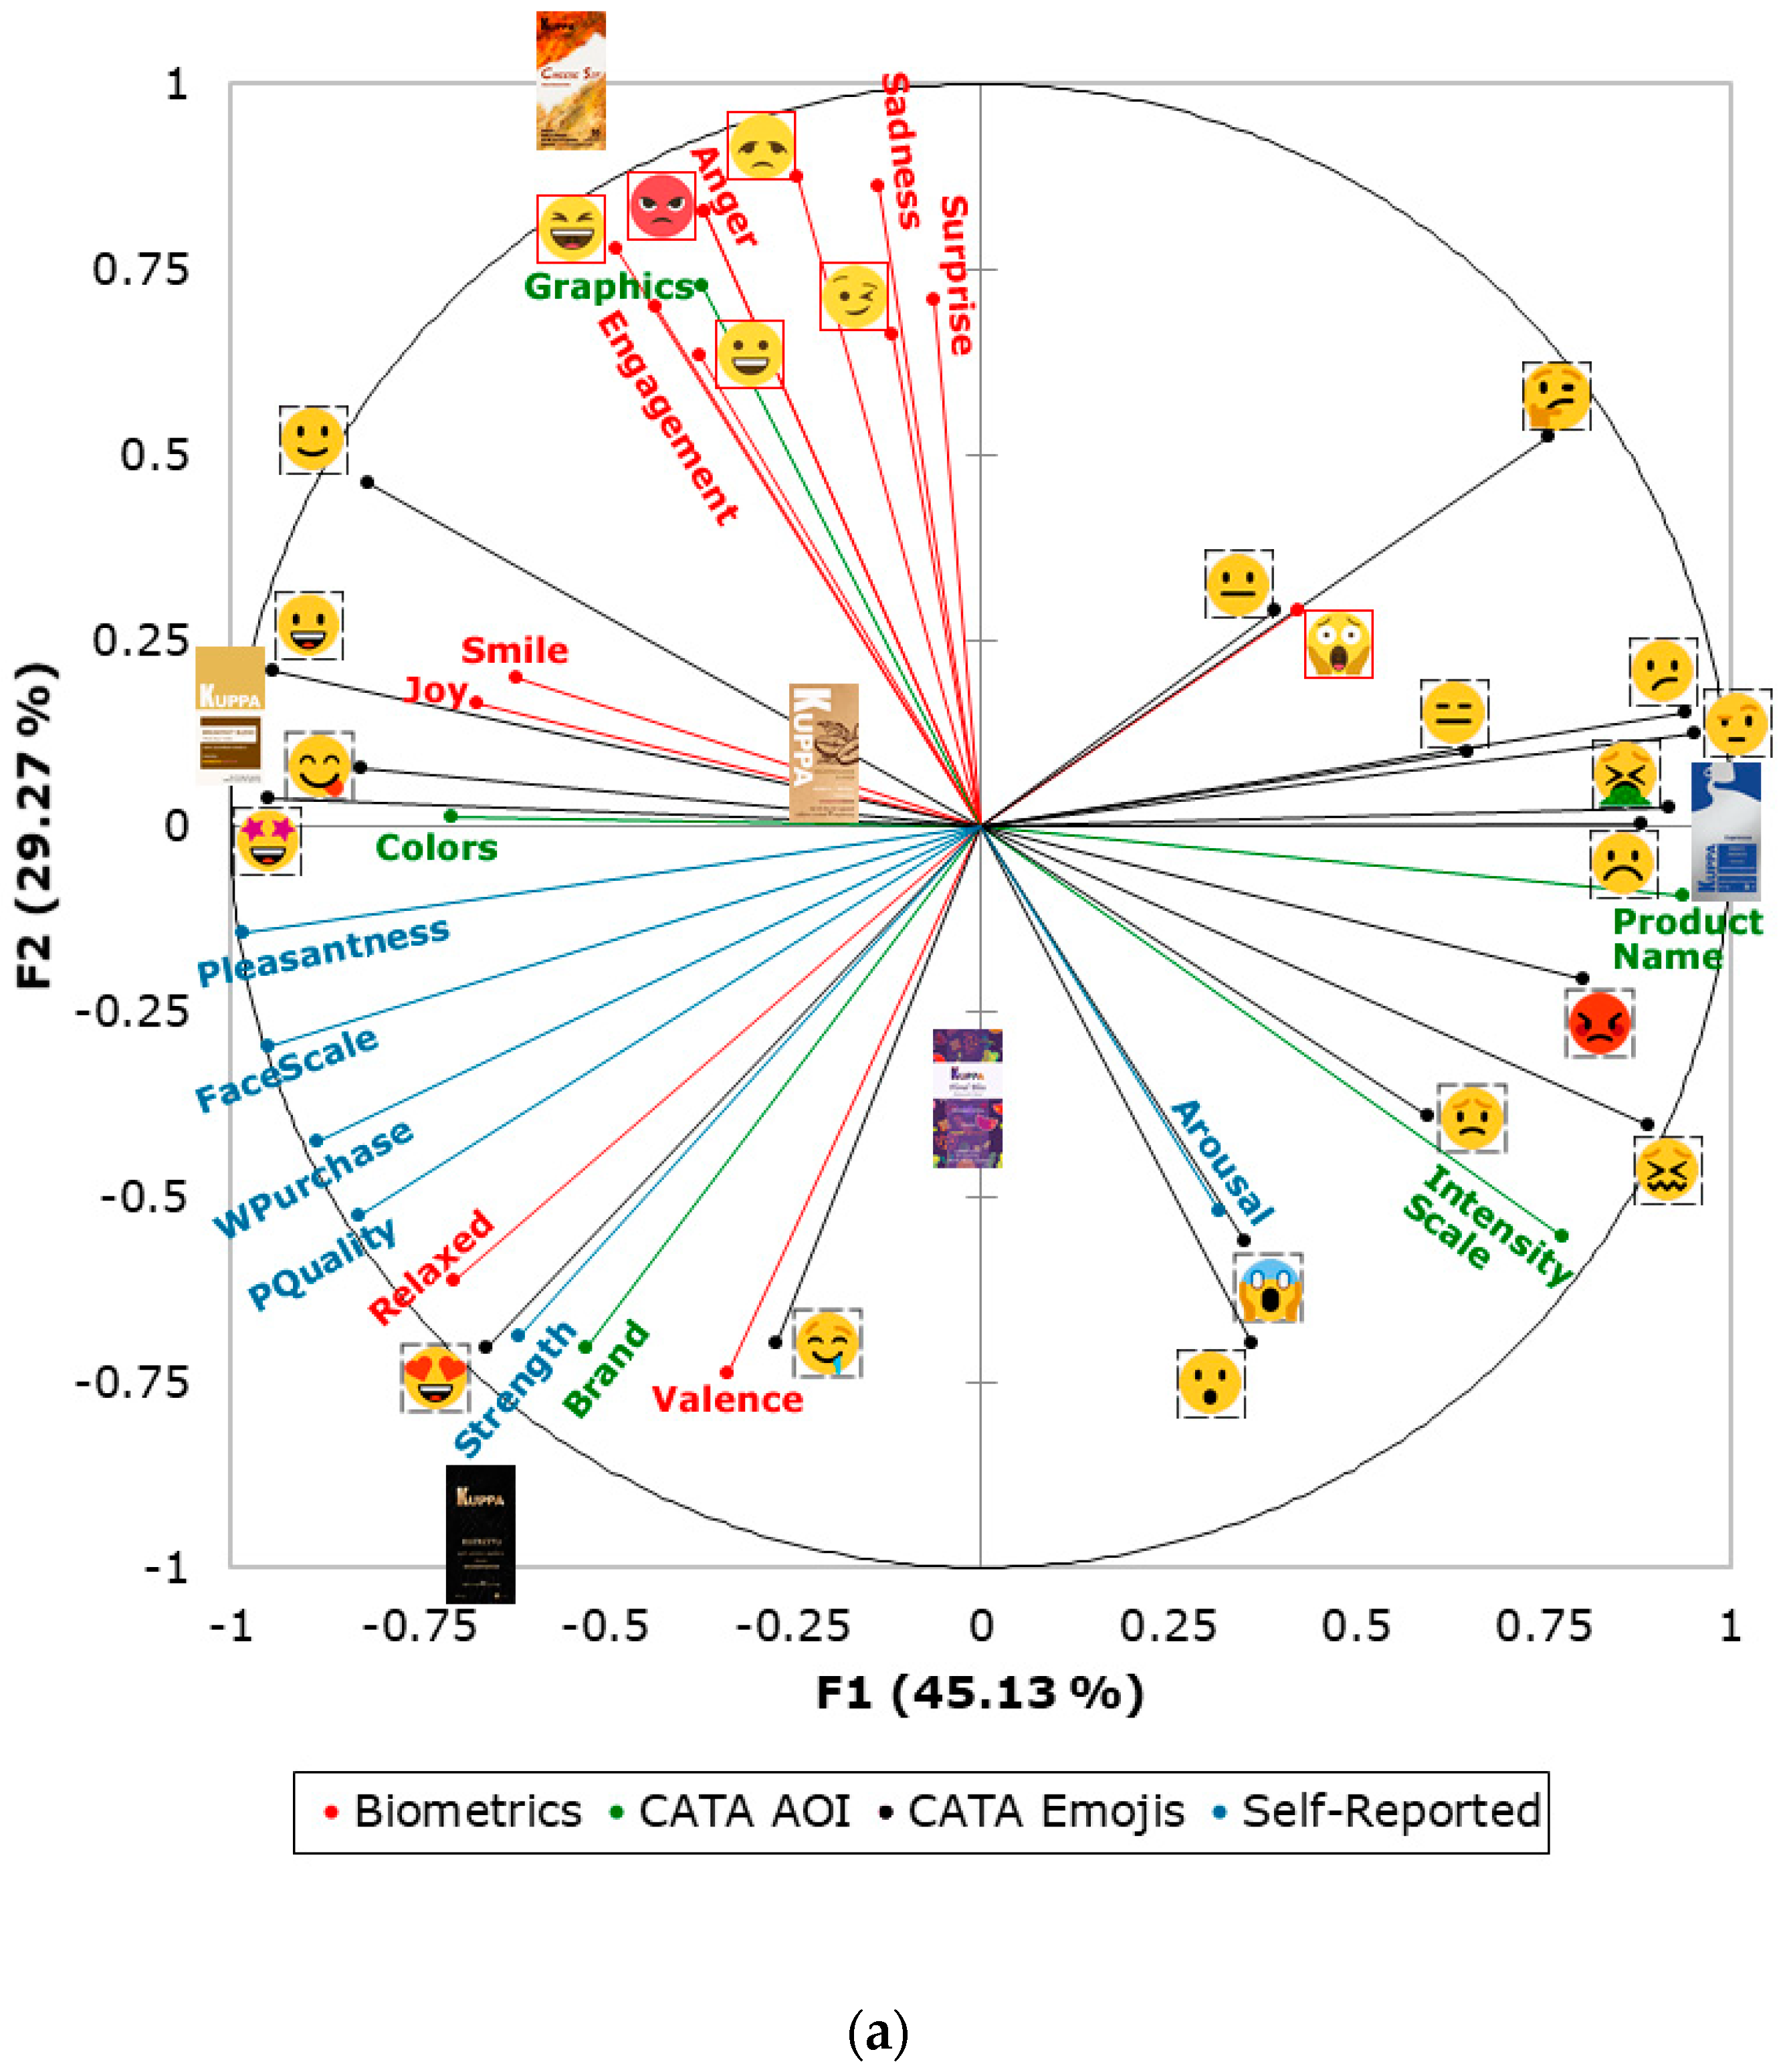
Figure 2a shows the MFA in which the factors represent a total of 74.41% of data variability (factor one: F1 = 45.13%; factor two: F2 = 29.27%). It can be observed that based on the correlation coefficients (r) between variables and factors, F1 was mainly represented by Beverages 07 00005 i019 (r = 0.95), and Beverages 07 00005 i008 (r = 0.94) on the positive side of the axis, and by pleasantness (r = −0.98), FaceScale (r = −0.95), and Beverages 07 00005 i013 (r = −0.95) on the negative side. On the other hand, F2 was mainly characterized by Beverages 07 00005 i026 (r = 0.87), and sadness (r = 0.86) on the positive side, and by valence (r = −0.74), and brand (r = −0.70) on the negative side of the axis. The bold label was associated with the selection of graphics as the best AOI and subconscious responses from biometrics, such as engagement, Beverages 07 00005 i027, anger, Beverages 07 00005 i028, Beverages 07 00005 i026, and sadness. The everyday label concept was associated with the selection of colors as the best AOI; biometric responses, such as joy and smile; self-reported responses, such as pleasantness; and a selection of emojis, such as Beverages 07 00005 i002, Beverages 07 00005 i011, and Beverages 07 00005 i013. Furthermore, the premium label was more associated with the self-reported responses, such as perceived strength; the selection of brand as the best AOI; PQuality; a selection of emojis, such as Beverages 07 00005 i015 and Beverages 07 00005 i006; and biometric responses, such as relaxed and valence. On the other hand, the classic label was associated with the self-reported responses for the selection of product names as the best AOI and most neutral to negative emojis, such as Beverages 07 00005 i019, Beverages 07 00005 i018, Beverages 07 00005 i016, Beverages 07 00005 i008, and Beverages 07 00005 i004. The natural and fun labels were located closer to the MFA center, with the former being located on the positive emotion side of the graph and the latter presenting negative associations with the bold label’s characteristics.
Figure 2b shows the matrix with significant correlations between the self-reported acceptability and biometric responses. It can be observed that, despite being low, there were negative and significant correlations (p < 0.05) between Beverages 07 00005 i023 
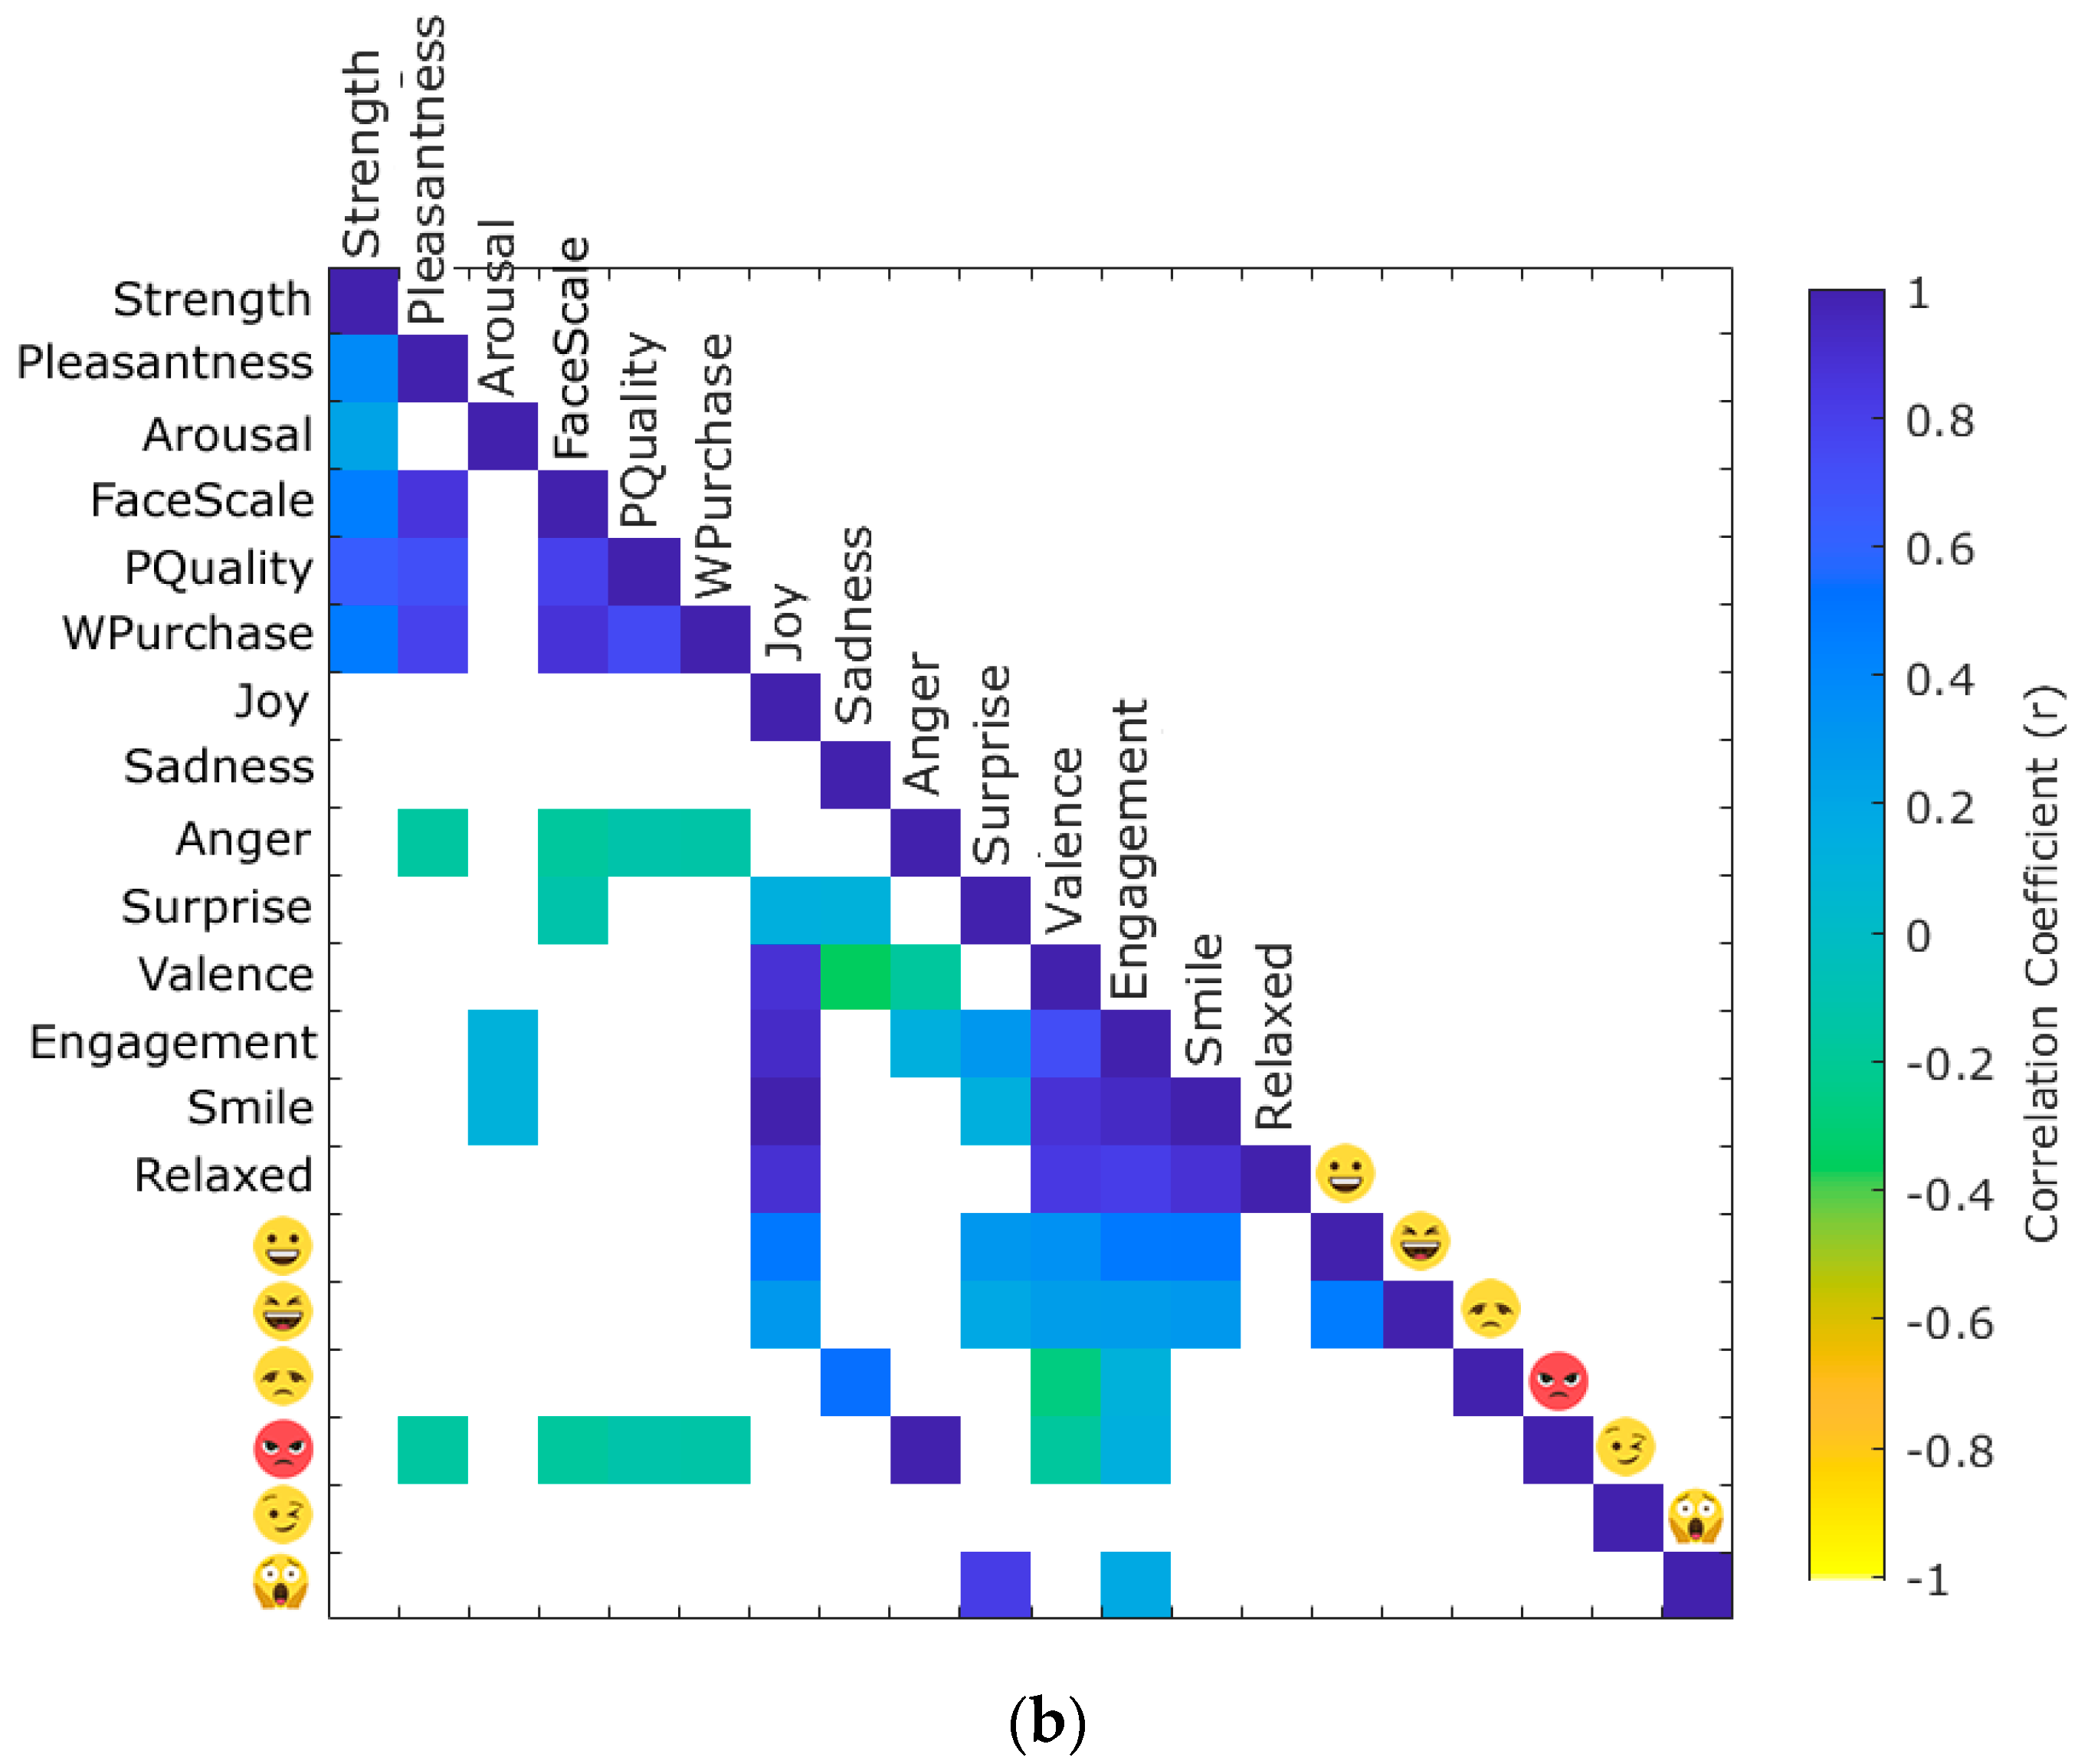
and pleasantness (r = −0.16), PQuality (r = −0.17), FaceScale (r = −0.12), and WPurchase (r = −0.17). Similar correlations were found between anger facial expression and the aforementioned self-reported responses. Furthermore, there was a negative low but significant correlation between surprise and FaceScale (r = −0.12), and positive correlations between self-reported arousal and engagement and smile (r = 0.11). On the other hand, PQuality was positively correlated with strength (r = 0.63), pleasantness (r = 0.71) and FaceScale (r = 0.79).

4. Discussion

4.1. Virtual Sensory Sessions

The virtual sensory sessions for individual participants ran smoothly, and data gathering and analysis were completed within three weeks, with only one person required for data collection and one for data analysis. The time of virtual sessions and data analysis can be reduced by having multiple participants in one session through Zoom, in which they can all be added to a single screen that is recorded. New video analysis algorithms developed by the DAFW group can crop each participant, thereby allowing them to be analyzed automatically through the batch code described in this study using Affectiva algorithms. An advantage of sensory tests during social isolation, using the available digital tools, is that potential panelists are in familiar environments, such as their homes, places dedicated to work, or where social interactions may occur when doing the test with family members or friends [24]. In places dedicated to work, consumers are more likely to test different products. To date, there are no published papers using or proposing virtual sensory sessions that include biometrics recording to be used in emergency situations, such as extensive lockdown during pandemics, in which participants may be presented with conditions that do not allow them to attend a sensory laboratory or to reach more participants in other cities or countries.

4.2. Emotional Responses from Biometrics and Emoji Selection

The most accepted label from this study with positive emotional responses and positive emojis was the premium concept, which is in accordance with other label studies for chocolates [4]. The opposite responses were obtained for the bold label with the cheese dip concept, which could have been associated with cheesy aroma in the coffee (Table 4 and Table 5). It has been shown that smell and positive aroma descriptors are determinants of consumer perception [15], which could explain this study’s results. Furthermore, the second-highest scores were for the natural concept, which incorporated grains of coffee and more earthy colors associated with a healthy option in the imagery, which is also in accordance with other studies involving healthy and organic concepts within labels [13,25,26].

4.3. Analysis of Areas of Interest within Labels

Following the results from the emotional and emoji responses, the premium label was highlighted with statistically higher areas of interest selection, such as colors, layout, and pattern/texture, with layout being the highest area of interest for the natural concept and color for the bold concept (Table 6). However, analysis of features was limited in this study; more specific assessments can be conducting when analyzing label features using eye-trackers [2,3,27,28,29] or more practically for virtual sensory sessions when using digital tools (from video analysis) for eye tracking to assess fixation number and duration that the panelists spend at each component [30,31]. The DAFW group has developed algorithms to analyze eye-tracking parameters and the emotional response based on facial expressions from the different features of labels [32]. Hence, further studies using the methodologies proposed here will enrich the number of parameters to be analyzed and find different patterns within the data or apply machine learning algorithms for artificial intelligence application to label analysis.

4.4. Multivariate Data Analysis

The multivariate data analysis (Figure 2a), including the emotional response, emoji selection, and analysis of label areas of interest, offered a more comprehensive analysis of the relationships and patterns among the different labels and concepts. The main addressable features with this analysis are the positive selection of graphics with the least preferred concept (bold), which shows that even if the graphics are preferred, the concepts within the label related to the specific product are more important for consumers. Similar assessment can be conducted for the concept of fun, which was closely related to the panelists’ color interests. Furthermore, it was also found that the name was mostly associated with positive and negative emojis, with the classic concept offering more interest but without correlated results for preference.
In the case of the correlations among the self-reported and subconscious responses (Figure 2b), it was found that consumers rate labels as higher quality when they perceive coffee as higher strength, when labels are more pleasant, and when they elicit more positive emotions; the latter is consistent with findings from Gunaratne et al. [2] for chocolate label assessment. Furthermore, the willingness to purchase is directly influenced by the perceived quality, as found in other research [33].
One of the limitations of this study with the methodology proposed was the requirement of testing one participant at a time due to video recording using the available meeting software capabilities. However, this was solved after the study was conducted by assessing a video of multiple participants in a single screen recording and automatically cropping participants for further analysis. This was achieved by coding video cropping using computer vision algorithms in Matlab®. Furthermore, this study was based on online easy-to-access and free tools, such as Zoom (free sessions for up to 1 h), Google Forms, and Affectiva SDK. More information can be accessed using more specific self-reported software packages specific for sensory analysis, such as RedJade [34,35], Compusense [36,37], and Fizz [38], among others. However, these packages may be cost prohibitive for small and medium food and beverage companies.
Further research should be conducted using more specialized software to obtain more information that can be relevant to companies’ decision making regarding product and package development.

5. Conclusions

Social isolation during the pandemic of 2020 served as an incentive for many software companies to develop virtual or remote sensory tests to comply with social distancing and lockdowns. This study implemented new and emerging sensory tools to analyze coffee labels, thereby obtaining results consistent with previous studies for coffee and other beverage labels using normal sensory analysis with panelists attending physically sensory sessions. This research showed that free online software resources, such as remote meeting applications, video capture, and self-reported forms, are effective tools to carry out sensory analysis of labels outside the laboratory when social isolation and distancing are required, with results comparable to other more established methods. These techniques can also be applied to other food and beverage products by sending them to consumers via courier/mail to be tested using sensory techniques. The tools proposed in this study are free and open-source software tools, such as Google Forms, Affectiva, and Zoom, the latter with free usage for multiple 1 h sessions. These software packages are advantageous to conduct label and even food and beverage product sensory analysis compared to commercial software that can do similar sensory studies as described in this paper by incorporating facial expressions and emotional responses. However, they are cost-prohibitive, especially for small and medium food and beverage companies. Furthermore, this study proposed more efficient ways to conduct these sessions with multiple participants on single videos and incorporate eye-tracking software from videos to analyze the emotional response to specific features from different beverage products’ labels. The system proposed in this study could be of great benefit to food and beverage companies not only in the context of isolation conditions but by increasing the reach of the sensory trials to other countries, thereby incorporating a higher number of participants unrestricted by sensory laboratory space, different cultural backgrounds, or age and without international or language boundaries.

Supplementary Materials

The following are available online at https://www.mdpi.com/2306-5710/7/1/5/s1, Table S1. Mean ± standard error values from the biometric emotional responses for the six different label samples (Figure 1).

Author Contributions

Conceptualization, C.G.V., H.Z., and S.F.; data curation, C.G.V., H.Z., and S.F.; formal analysis, C.G.V.; investigation, C.G.V., H.Z. and S.F.; methodology, C.G.V., H.Z., A.K., Y.X., and S.F.; project administration, C.G.V., and S.F.; software, C.G.V., and S.F.; supervision, S.F.; validation, C.G.V., and S.F.; visualization, C.G.V., Y.X. and S.F.; writing—original draft, C.G.V., and S.F.; writing—review and editing, C.G.V., H.Z., A.K. and S.F. All authors have read and agreed to the published version of the manuscript.

Funding

This research received no external funding.

Institutional Review Board Statement

The study was conducted according to the guidelines of the National Statement on Ethical Conduct in Human Research (2007)-Updated 2018 and approved by the Human Ethics Advisory Group from the University of Melbourne (ID: 1953926.4; approved: July 2020).

Informed Consent Statement

All subjects involved in the study signed a consent form prior to the sensory session.

Data Availability Statement

Data and intellectual property belong to The University of Melbourne; any sharing needs to be evaluated and approved by the University.

Acknowledgments

This study received internal funds from the Digital Agriculture and Wine research group, School of Agriculture and Food, Faculty of Veterinary and Agricultural Sciences, University of Melbourne.

Conflicts of Interest

The authors declare no conflict of interest.

References

  1. Swahn, J.; Mossberg, L.; Öström, Å.; Gustafsson, I.B. Sensory description labels for food affect consumer product choice. Eur. J. Mark. 2012, 46, 1628–1646. [Google Scholar] [CrossRef] [Green Version]
  2. Gunaratne, N.M.; Fuentes, S.; Gunaratne, T.M.; Torrico, D.D.; Ashman, H.; Francis, C.; Gonzalez Viejo, C.; Dunshea, F.R. Consumer acceptability, eye fixation, and physiological responses: A study of novel and familiar chocolate packaging designs using eye-tracking devices. Foods 2019, 8, 253. [Google Scholar] [CrossRef] [PubMed] [Green Version]
  3. Torrico, D.D.; Fuentes, S.; Viejo, C.G.; Ashman, H.; Gurr, P.A.; Dunshea, F.R. Analysis of thermochromic label elements and colour transitions using sensory acceptability and eye tracking techniques. LWT Food Sci. Technol. 2018, 89, 475–481. [Google Scholar] [CrossRef]
  4. Gunaratne, N.M.; Viejo, C.G.; Gunaratne, T.M.; Torrico, D.D.; Ashman, H.; Dunshea, F.R.; Fuentes, S. Effects of imagery as visual stimuli on the physiological and emotional responses. J. Multidiscip. Sci. J. 2019, 2, 206–225. [Google Scholar] [CrossRef] [Green Version]
  5. Farah, J.S.; Araujo, C.B.; Melo, L. Analysis of yoghurts’, whey-based beverages’ and fermented milks’ labels and differences on their sensory profiles and acceptance. Int. Dairy J. 2017, 68, 17–22. [Google Scholar] [CrossRef]
  6. Meyerding, S.G.; Gentz, M.; Altmann, B.; Meier-Dinkel, L. Beef quality labels: A combination of sensory acceptance test, stated willingness to pay, and choice-based conjoint analysis. Appetite 2018, 127, 324–333. [Google Scholar] [CrossRef]
  7. Sherman, S.; Tuten, T. Message on a bottle: The wine label’s influence. Int. J. Wine Bus. Res. 2011, 23, 221–234. [Google Scholar] [CrossRef]
  8. Barber, N.; Ismail, J.; Dodd, T. Purchase attributes of wine consumers with low involvement. J. Food Prod. Mark. 2007, 14, 69–86. [Google Scholar] [CrossRef]
  9. Henley, C.D.; Fowler, D.C.; Yuan, J.J.; Stout, B.L.; Goh, B.K. Label design: Impact on millennials’ perceptions of wine. Int. J. Wine Bus. Res. 2011, 23, 7–20. [Google Scholar] [CrossRef]
  10. Lick, E.; König, B.; Kpossa, M.R.; Buller, V. Sensory expectations generated by colours of red wine labels. J. Retail. Consum. Serv. 2017, 37, 146–158. [Google Scholar] [CrossRef]
  11. Savelli, E.; Bravi, L.; Francioni, B.; Murmura, F.; Pencarelli, T. PDO labels and food preferences: Results from a sensory analysis. Br. Food J. 2020. [Google Scholar] [CrossRef]
  12. Dubois, D.; Giboreau, A. Descriptors: Attributes? labels? terms? names. Food Qual. Prefer. 2006, 17, 671–672. [Google Scholar]
  13. Hemmerling, S.; Obermowe, T.; Canavari, M.; Sidali, K.L.; Stolz, H.; Spiller, A. Organic food labels as a signal of sensory quality—insights from a cross-cultural consumer survey. Org. Agric. 2013, 3, 57–69. [Google Scholar] [CrossRef]
  14. Barahona, I.; Sanmiguel Jaimes, E.M.; Yang, J.B. Sensory attributes of coffee beverages and their relation to price and package information: A case study of Colombian customers’ preferences. Food Sci. Nutr. 2020, 8, 1173–1186. [Google Scholar] [CrossRef]
  15. Imm, B.-Y.; Lee, J.H.; Lee, S.H. Effects of sensory labels on taste acceptance of commercial food products. Food Qual. Prefer. 2012, 25, 135–139. [Google Scholar] [CrossRef]
  16. Fuentes, S.; Gonzalez Viejo, C.; Torrico, D.D.; Dunshea, F.R. Development of a biosensory computer application to assess physiological and emotional responses from sensory panelists. Sensors 2018, 18, 2958. [Google Scholar] [CrossRef] [Green Version]
  17. Gunaratne, N.M.; Fuentes, S.; Gunaratne, T.M.; Torrico, D.D.; Francis, C.; Ashman, H.; Viejo, C.G.; Dunshea, F.R. Effects of packaging design on sensory liking and willingness to purchase: A study using novel chocolate packaging. Heliyon 2019, 5, e01696. [Google Scholar] [CrossRef] [Green Version]
  18. NeedScope International. How NeedScope Works. Available online: https://www.needscopeinternational.com/about-1 (accessed on 20 December 2020).
  19. Gonzalez Viejo, C.; Torrico, D.; Dunshea, F.; Fuentes, S. Emerging Technologies Based on Artificial Intelligence to Assess the Quality and Consumer Preference of Beverages. Beverages 2019, 5, 62. [Google Scholar] [CrossRef] [Green Version]
  20. Toet, A.; Kaneko, D.; Ushiama, S.; Hoving, S.; de Kruijf, I.; Brouwer, A.-M.; Kallen, V.; van Erp, J.B. EmojiGrid: A 2D pictorial scale for the assessment of food elicited emotions. Front. Psychol. 2018, 9, 2396. [Google Scholar] [CrossRef] [Green Version]
  21. Zhou, C.; Yamanaka, T. How does Congruence of Scent and Music Affect People’s Emotions. Int. J. Affect. Eng. 2017, 17, 127–136. [Google Scholar] [CrossRef] [Green Version]
  22. Yüksel, A. Tourist shopping habitat: Effects on emotions, shopping value and behaviours. Tour. Manag. 2007, 28, 58–69. [Google Scholar] [CrossRef]
  23. McDuff, D.; Mahmoud, A.; Mavadati, M.; Amr, M.; Turcot, J.; Kaliouby, R.E. AFFDEX SDK: A cross-platform real-time multi-face expression recognition toolkit. In Proceedings of the 2016 CHI Conference Extended Abstracts on Human Factors in Computing Systems; Association for Computing Machinery: New York, NY, USA, 2016; pp. 3723–3726. [Google Scholar]
  24. Torrico, D.D.F.S.; Gonzalez Viejo, C.; Ashman, H.; Dunshea, F.R. Pair social interaction on the sensory and facial expression responses of consumers towards snack products. In Proceedings of the 13th Pangborn Sensory Science Symposium, Edinburgh, UK, 28 July–2 August 2019. [Google Scholar]
  25. Schouteten, J.J.; de Steur, H.; De Pelsmaeker, S.; Lagast, S.; Gellynck, X.; de Bourdeaudhuij, I. Emotional and Sensory Evaluation of Cheese: The Effect of Health Labels. In Dairy in Human Health and Disease Across the Lifespan; Elsevier: Amsterdam, The Netherlands, 2017; pp. 295–311. [Google Scholar]
  26. Schouteten, J.J.; de Steur, H.; de Pelsmaeker, S.; Lagast, S.; de Bourdeaudhuij, I.; Gellynck, X. Impact of health labels on flavor perception and emotional profiling: A consumer study on cheese. Nutrients 2015, 7, 10251–10268. [Google Scholar] [CrossRef] [PubMed] [Green Version]
  27. Antúnez, L.; Vidal, L.; Sapolinski, A.; Giménez, A.; Maiche, A.; Ares, G. How do design features influence consumer attention when looking for nutritional information on food labels? Results from an eye-tracking study on pan bread labels. Int. J. Food Sci. Nutr. 2013, 64, 515–527. [Google Scholar] [CrossRef] [PubMed]
  28. Ares, G.; Giménez, A.; Bruzzone, F.; Vidal, L.; Antúnez, L.; Maiche, A. Consumer visual processing of food labels: Results from an eye-tracking study. J. Sens. Stud. 2013, 28, 138–153. [Google Scholar] [CrossRef]
  29. Piqueras-Fiszman, B.; Velasco, C.; Salgado-Montejo, A.; Spence, C. Using combined eye tracking and word association in order to assess novel packaging solutions: A case study involving jam jars. Food Qual. Prefer. 2013, 28, 328–338. [Google Scholar] [CrossRef]
  30. Gonzalez Viejo, C.; Fuentes, S.; Howell, K.; Torrico, D.; Dunshea, F.R. Robotics and computer vision techniques combined with non-invasive consumer biometrics to assess quality traits from beer foamability using machine learning: A potential for artificial intelligence applications. Food Control 2018, 92, 72–79. [Google Scholar] [CrossRef]
  31. Shanmuga Vadivel, K.; Ngo, T.; Eckstein, M.; Manjunath, B. Eye tracking assisted extraction of attentionally important objects from videos. In Proceedings of the IEEE Conference on Computer Vision and Pattern Recognition; IEEE: New York, NY, USA; pp. 3241–3250.
  32. Gunaratne, M. Implementation of Non-Invasive Biometrics to Identify Effects of Chocolate Packaging Towards Consumer Emotional and Sensory Responses; University of Melbourne: Melbourne, Australia, 2019. [Google Scholar]
  33. Yan, L.; Xiaojun, F.; Li, J.; Dong, X. Extrinsic cues, perceived quality, and purchase intention for private labels: Evidence from the Chinese market. Asia Pac. J. Mark. Logist. 2019, 31, 714–727. [Google Scholar] [CrossRef]
  34. Cimino, A.E.; Cowell, A.C.; Nieschwitz, N.C.; Kershaw, J.C. Subtle sensory and labeling modifications have minimal impact on expected appetitive sensations in chewy bars. Food Res. Int. 2020, 137, 109386. [Google Scholar] [CrossRef]
  35. Li, T.; Dando, R. Impact of common food labels on consumer liking in vanilla yogurt. Foods 2019, 8, 584. [Google Scholar] [CrossRef] [Green Version]
  36. Samant, S.S.; Seo, H.-S. Quality perception and acceptability of chicken breast meat labeled with sustainability claims vary as a function of consumers’ label-understanding level. Food Qual. Prefer. 2016, 49, 151–160. [Google Scholar] [CrossRef]
  37. Hartley, I.E.; Keast, R.S.; Liem, D.G. Physical activity-equivalent label reduces consumption of discretionary snack foods. Public Health Nutr. 2018, 21, 1435–1443. [Google Scholar] [CrossRef] [PubMed] [Green Version]
  38. Delgado, C.; Gómez-Rico, A.; Guinard, J.-X. Evaluating bottles and labels versus tasting the oils blind: Effects of packaging and labeling on consumer preferences, purchase intentions and expectations for extra virgin olive oil. Food Res. Int. 2013, 54, 2112–2121. [Google Scholar] [CrossRef]
Figure 1. Labels developed based on the TNS Needscope model ™ for the six segments: (a) fun, (b) bold, (c) natural, (d) everyday, (e) classic, and (f) premium.
Beverages 07 00005 g001
Figure 2. Multivariate data analysis showing (a) the multiple factor analysis using all quantitative and frequency data, and (b) matrix showing only the significant correlations (p < 0.05) for the quantitative self-reported and biometric responses. The color bar represents the positive correlations on the blue side and negative on the yellow side. Abbreviations of self-reported responses are shown in Table 1; CATA: check all that apply; AOI: area of interest; F1 and F2: factors one and two, respectively.
Beverages 07 00005 g002aBeverages 07 00005 g002b
Table 1. Attributes assessed for acceptability of the coffee pod label samples.
AttributeAbbreviationScaleAnchors
StrengthStrength9-point scale1: Extremely mild–9: Extremely strong
Pleasantness (Valence)Pleasantness9-point hedonic scale1: Unpleasant–9: Pleasant
ArousalArousal9-point scale1: Relaxed–9: Stimulated
FaceScale (Emotional response)FaceScale9-point hedonic scale Beverages 07 00005 i001
Perceived qualityPQuality9-point scale1: Extremely low–9: Extremely high
Willingness to purchaseWPurchase9-point scale1: Extremely unlikely–9: Extremely likely
Table 2. Options provided for the check all that apply (CATA) questions for assessment of the coffee pod label samples.
CATA Emojis
Beverages 07 00005 i002 Beverages 07 00005 i003 Beverages 07 00005 i004 Beverages 07 00005 i005
Beverages 07 00005 i006 Beverages 07 00005 i007 Beverages 07 00005 i008 Beverages 07 00005 i009
Beverages 07 00005 i010 Beverages 07 00005 i011 Beverages 07 00005 i012 Beverages 07 00005 i013
Beverages 07 00005 i014 Beverages 07 00005 i015 Beverages 07 00005 i016 Beverages 07 00005 i017
Beverages 07 00005 i018 Beverages 07 00005 i019
CATA Area of Interest
ColorsLayoutFontPattern/Texture
GraphicsBrandLogoIntensity Scale
Product name
Table 3. Attributes obtained from the participants’ video analysis for emotional responses.
AttributeType of ResponseAttributeType of Response
SadnessEmotionValenceEmotional dimension
AngerEmotion Beverages 07 00005 i020Emoji (Smiley)
SurpriseEmotion Beverages 07 00005 i021Emoji (Laughing)
FearEmotion Beverages 07 00005 i022Emoji (Disappointed)
DisgustEmotion Beverages 07 00005 i023Emoji (Rage)
JoyEmotion Beverages 07 00005 i024Emoji (Wink)
EngagementEmotional dimension Beverages 07 00005 i025Emoji (Scream)
RelaxedEmotional dimension
Table 4. Mean ± standard error values from the acceptance test for the six different label samples (Figure 1).
Sample/AttributeStrengthPleasantnessArousalFaceScalePQualityWPurchase
Fun4.69 d6.23 b,c4.89 b5.86 b5.66 d4.84 b
±0.22±0.23±0.25±0.23±0.23±0.26
Bold4.27 d4.20 d5.63 a4.19 c4.55 e3.70 c
±0.10±0.20±0.23±0.21±0.14±0.24
Natural6.41 b7.31 a3.75 c7.09 a7.20 b6.80 a
±0.25±0.21±0.19±0.24±0.24±0.28
Everyday5.53 c6.00 c4.39 b,c5.95 b5.88 c,d5.50 b
±0.19±0.22±0.20±0.23±0.22±0.26
Classic6.86 b5.78 c4.64 b5.64 b6.44 c5.31 b
±0.23±0.14±0.26±0.17±0.16±0.20
Premium8.48 a6.77 a,b6.27 a6.94 a7.95 a6.61 a
±0.20±0.15±0.22±0.14±0.17±0.28
Different letters denote significant differences between samples (labels) according to the least significant difference (LSD) post hoc test (α = 0.05). NS: non-significant. Abbreviations: PQuality: perceived quality; WPurchase: willingness to purchase.
Table 5. McNemar test values from the emoji check all that apply test for the six different label samples (Figure 1).
Emojis/SamplesFunBoldNaturalEverydayClassicPremium
    Beverages 07 00005 i0020.26 b,c0.49 a,b0.25 b,c0.51 a0.13 c0.44 a,b
    Beverages 07 00005 i0030.17 a,b0.29 a,b0.29 a,b0.12 b0.41 a0.13 b
NS Beverages 07 00005 i0040.000.000.010.000.040.01
    Beverages 07 00005 i0050.12 b0.09 b0.23 a,b0.12 b0.38 a0.42 a
NS Beverages 07 00005 i0060.060.000.090.130.090.13
NS Beverages 07 00005 i0070.030.000.010.000.070.03
    Beverages 07 00005 i0080.06 b0.04 b0.10 ab0.01 b0.28 a0.00 b
NS Beverages 07 00005 i0090.000.010.030.000.070.09
NS Beverages 07 00005 i0100.230.130.070.060.200.06
NS Beverages 07 00005 i0110.170.170.070.260.060.16
NS Beverages 07 00005 i0120.090.010.070.010.070.04
    Beverages 07 00005 i0130.09 b0.23 a,b0.15 a,b0.30 a0.07 b0.28 a,b
    Beverages 07 00005 i0140.39 a,b,c0.52 a,b0.39 a,b,c0.61 a0.20 c0.32 a,b
    Beverages 07 00005 i0150.12 a,b0.07 b0.06 b0.16 ab0.03 b0.32 a
NS Beverages 07 00005 i0160.010.000.030.060.040.00
    Beverages 07 00005 i0170.32 a0.17 a,b0.25 a0.16 a,b0.23 a,b0.04 b
    Beverages 07 00005 i0180.010.00 NS0.040.000.150.00
    Beverages 07 00005 i0190.17 a,b,c0.19 a,b0.15 b,c0.03 c0.38 a0.13 b,c
Different letters denote significant differences between samples (labels/columns) according to the McNemar (Bonferroni) post hoc test (p < 0.05). NS: non-significant.
Table 6. McNemar test values from the area of interest (AOI) check all that apply test for the six different label samples (Figure 1).
AOI/SamplesFunBoldNaturalEverydayClassicPremium
Colors0.48 b,c0.57 a,b0.39 b,c0.75 a0.25 c0.75 a
Layout0.41 b,c0.39 b,c0.52 a,b,c0.77 a0.35 c0.62 a,b
Font0.48 a0.29 a,b0.25 a,b0.45 a,b0.22 b0.42 a,b
Pattern/Texture0.22 b0.30 a,b0.26 b0.55 a0.26 b0.45 a,b
Graphics0.15 b0.35 b0.36 a,b0.60 a0.17 b0.26 b
* Brand0.09 c0.07 c0.12 b,c0.26 a,b0.07 c0.29 a
NS Logo0.260.250.290.320.120.35
NS Intensity scale0.360.260.360.440.330.51
NS Product name0.280.190.190.20.290.26
Different letters denote significant differences between samples (labels/columns) according to the McNemar (Bonferroni) post hoc test (p < 0.05). NS: non-significant. * Brand was assessed using the critical difference Sheskin post hoc test due to a problem of transitivity using the McNemar test for this specific area of interest.
Publisher’s Note: MDPI stays neutral with regard to jurisdictional claims in published maps and institutional affiliations.

