Article

Characterization of Musts, Wines, and Sparkling Wines Based on Their Elemental Composition Determined by ICP-OES and ICP-MS

by
Biel Granell
1,
Anaïs Izquierdo-Llopart
1,
Àngels Sahuquillo
1,
José F. López-Sánchez
1 and
Javier Saurina
1,2,*
1
Department of Chemical Engineering and Analytical Chemistry, University of Barcelona, Martí i Franquès 1-11, E08028 Barcelona, Spain
2
Research Institute in Food Nutrition and Food Safety, University of Barcelona, Av. Prat de la Riba 171, Edifici Recerca (Gaudí), E08921 Santa Coloma de Gramenet, Spain
*
Author to whom correspondence should be addressed.
Beverages 2022, 8(1), 3; https://doi.org/10.3390/beverages8010003
Submission received: 29 November 2021 / Revised: 21 December 2021 / Accepted: 27 December 2021 / Published: 4 January 2022
(This article belongs to the Section Wine, Spirits and Oenological Products)

Abstract

:
Samples from the different processing stages in the elaboration of sparkling wine (cava)—including must, base wine, and sparkling wine—of Pinot Noir and Xarel·lo grape varieties from different vineyard qualities (A, B, C, D) have been analyzed by inductively coupled plasma (ICP) techniques to determine their elemental composition. The resulting data has been used to characterize these products according to oenological features and product qualities. For this purpose, box plot diagrams, bar charts, and principal components analysis (PCA) have been used. The study of the behavior of each given species has pointed out the relevance of some elements as markers or descriptors of winemaking processes. Among others, Cu and K are abundant in musts and their concentrations progressively decrease through the cava production process. S levels suddenly increase at the base wine step (and further decay) due to the addition of sulfites as preserving agents. Finally, concentrations of Na, Ca, Fe, and Mg increase from the first fermentation due to the addition of clarifying agents such as bentonite. PCA has been applied to try to extract solid and global conclusions on trends and chemical markers within the groups of samples more easily and efficiently than more conventional approaches.

Graphical Abstract

1. Introduction

The current cultivation of the vine in the world has spread to two strips where wine is currently made. France, Spain, Germany, Portugal, and the United States are located in the northern hemisphere, while Argentina, Chile, Australia, South Africa, and New Zealand are located in the southern hemisphere. However, the main focus has been and continues to be Europe. More specifically, cava is a highly popular sparkling wine with Protected Designation of Origin (PDO) produced in various Spanish regions following the traditional Champenoise method [1,2]. The Spanish provinces of Catalonia, La Rioja, Zaragoza, Álava, Navarra, Badajoz (Almendralejo), and Valencia (Requena) are Cava producers. The grape varieties authorized for the PDO Cava for cava’s elaboration are Macabeu, Xarel·lo, Parellada, Garnatxa negra, Subirat parent, Trepat, Pinot Noir, and Monastrell [1,2,3].
For cava production, the alcoholic fermentation is carried out after the must clarification inside stainless steel or cement tanks by the addition of proteins. Then selected yeasts are added to transform the free sugars (glucose and fructose) into ethanol, CO2, and secondary products. After alcoholic fermentation, to reduce the vegetable and herbal notes and the feeling of astringency and bitterness, the so-called base wines can be subjected to malolactic fermentation (MLF) to transform malic acid into lactic acid providing a more pleasant mouthfeel [4]. At the end of this step, base wines are ready to be mixed and stabilized to create the desired coupages or blends. Subsequently, wines are subjected to a second fermentation inside their own bottle, a key step to create the characteristic bubbles. Finally, cavas are aged in the cellar, for a minimum 9 months according to the cava’s legislation [1,2].
A wide range of compounds can be used as tentative biomarkers for characterization and authentication purposes, with the elemental composition being one of the most successful sources of information, especially for dealing with the geographical origin and varietal issues [5,6,7,8,9]. In this regard, chemometric methods are commonly exploited to achieve a more efficient and comprehensive characterization of wines as well as to address classification and adulteration issues [10,11,12,13,14]. Currently, inductively coupled plasma with optical emission spectrometry (ICP-OES) and inductively coupled plasma mass spectrometry (ICP-MS) are the techniques of choice to determine the multi-elemental composition of this kind of beverage in a rapid and simple way [15,16].
The elemental composition of wines and sparkling wines depends on natural and anthropogenic sources [17,18,19]. Endogenous elements come from the absorption of minerals from the soil and can be found in different parts of the plant, including the grapes. Since the composition of the soils from the vineyards, usually calcareous and clayey, grapes are rich in metals like Ca, Mg, Fe, Al, or Mn. Anthropogenic elements come from agricultural practices in the vineyard as well as from winemaking processes [17,18,19]. Typically, the addition of fertilizers to the vines increases its content in Cu, S, K, or Zn, but it must to be controlled since high amounts of mineral concentrations can develop toxicity in the vineyard. Also, the variations in the metal content during the winemaking process are more complex, due to the addition of different substances such as yeasts, bentonite, additives, or the expedition liqueur.
The determination of the elemental composition of wines, as in other food products, is essential to ensure that the quantities of different metals are below the limits established, especially those that may suppose a health risk. The maximum amounts of these metals in wines are defined by the International Code of Oenological Practices [20], which also regulates other factors like the pH, the quantity of ashes, or the concentration of organic compounds such as tartaric and gluconic acids. The maximum levels fixed for some elements are as follows: 0.01 mg L−1 Cd, 0.1 mg L−1 Pb, 0.2 mg L−1 As, 1 mg L−1 Cu, 5 mg L−1 Zn, 80 mg L−1 B (as H3BO3), 1 mg L−1 Sn (canned products), 35–140 mg L−1 Ca, and 80 mg L−1 Na. Apart from environmental and toxicological issues, compositional data can also be used as a representative “fingerprint” with information on the quality and other important features. As a result, the elemental composition is often exploited to detect and prevent frauds, and guarantee the origin and quality of the bottles [21,22].
A wide variety of analytical techniques have been used for the qualitative and quantitative determination of metals in wine and sparkling wine, among which ICP-OES and ICP-MS are currently the techniques of choice [22,23]. The elementary composition of wines, and sparkling wines has been exploited to carry out their characterization, classification and authentication according to geographical, varietal, and enological factors based on chemometric methods [24,25,26,27,28,29,30,31,32]. Elements such as Al, B, Ca, Cu, Fe, K, Mg, Mn, Na, and Zn have been often chosen as potential descriptors of wine types.
This paper aims at the characterization of musts, wines, and sparkling wines according to their elemental composition, trying to find markers and trends dealing with their discrimination according to product type, quality, and variety. The principal novelty is the focus of the application, dealing with the study of different oenological samples and the exploration of quality issues. Samples have been analyzed by ICP-OES and ICP-MS to determine the composition of 38 elements to be used as the source of analytical information. The interpretation of the resulting data based on box plots and principal component analysis (PCA) has revealed interesting conclusions on product features and quality.

2. Materials and Methods

2.1. Chemicals and Solutions

All reagents used were of analytical grade. Nitric acid (65% (w/w), PanReac AppliChem, Castellar del Vallès, Spain), and Milli-Q water (Elix3, Millipore, Bedford, MA, USA) were used to prepare the diluted wine samples. 1% (v/v) HNO3 was used for further sample dilutions.
Calibration standards for the ICP-MS and ICP-OES measurements were prepared by proper dilution of certified ICP grade single 1000 ppm element standards (Inorganic Ventures, Christiansburg, VA, USA) in 1% (v/v) HNO3.

2.2. Must, Wine, and Sparkling Wine Samples

Samples corresponding to five different steps of the winemaking process—from musts to sparkling wines—were kindly provided by Codorniu S.A (Sant Sadurni d’Anoia, Spain). They corresponded to an industrial scale production with the final objective of the commercialization of the resulting sparkling wines. Then, various bottles from the different stages/qualities/varieties were kept for this study. It should be indicated that the final cava samples were not yet available for characterization since were still under aging in the cellar for a minimum of 18 months (and more than 36 months for those of quality A). They were elaborated with a type of white grape (Xarel·lo) produced in Penedès (Catalonia, Spain) and a black grape (Pinot Noir) produced in Conca de Barberà and Costers del Segre regions (both from Catalonia, Spain), respectively. For each variety, 4 musts, 4 monovarietal base wines, 4 stabilized wines, 4 sparkling wines aged for 3 and 7 months in rhyme were available. Within each sample type, the products were classified into 4 quality labeled as A, B, C, and D, with A referring to the highest and D to the lowest quality products. The quality was defined by the manufacturer depending on factors such as soil, ecological or conventional grape production, manual or mechanized harvest and transport, grape yield, the pressure exerted on the press, yeast strain, grape acidity, malolactic fermentation, and tartaric stabilization process. For grapes of C and D qualities, malolactic fermentation was applied to reduce the wine acidity and herbal and vegetable notes and make the wine microbiologically more stable. This process was developed using starters under specific confidential conditions under specific conditions kept confidential by the company. Additional information on the codes of samples according to classes, qualities, and varieties are given in Table 1. Specific details on vineyard features, including geographical and agricultural data, are given in Tables S1 and S2 included as the Supplementary Material.

2.3. Analytical Procedure

Measurements were performed by ICP-OES with an Optima 3200RL instrument and by ICP-MS with a Nexlon 350D spectrometer (both from Perkin Elmer, Waltham, MA, USA) equipped with an Ar plasma. ICP-OES operated under standard conditions while ICP-MS measurements were carried out adding Rh as the internal standard to correct for instrumental drift, and a He collision cell to avoid interferences (He flow rate was 4 mL min−1).
Musts, wines, and sparkling wines were diluted in a 1/10 ratio to avoid interferences from the organic matrix, especially from ethanol. Hence, 1 mL of each sample was added to a 15-mL ICP tube and diluted with 9 mL of 1% HNO3. If necessary, samples were filtered through 0.45-µm membrane filters. A blank solution consisting of 1% HNO3 and global Quality Controls (QCs) were prepared as well to check the occurrence of possible cross-contaminations, to evaluate the overall repeatability of the analytical procedure and the robustness and soundness of the statistic results. The QC was prepared by mixing 1 mL of each one of must/wine/sparkling wine sample. Furthermore, specific QCs for Xarel·lo and Pinot Noir samples were prepared as well in a similar way.
Samples were analyzed randomly in triplicate. QCs and blanks were measured every 10 samples.

2.4. Data Analysis

Multi-elemental profiles resulting from the analysis of must, base wine, and sparkling wine samples using both ICP-OES and ICP-MS platforms were treated statistically with Microsoft Excel 2019 (Microsoft, Redmon WA, USA). Student’s t-tests and analysis of variance (ANOVA) were applied to assess the significance of compositional differences among winemaking, quality or variety. In any case, if p ≤ 0.05, differences were considered statistically significant.
Other multivariate methods such as PCA were used with SOLO (Eigenvector Research, Inc. Manson, WA, USA). The chemometric approach allowed a more efficient recovery of compositional patterns related to oenological steps and product qualities. A detailed description of PCA, with theoretical aspects and applications to food analysis, can be found elsewhere [33,34].
For PCA, a raw dataset (X-matrix) was created consisting of concentrations of the different elements under study in which each column corresponded to a given analyte and each row referred to a sample. Hence, dimensions of the X matrix were 49 × 36, with 49 being for 40 samples plus 9 QCs and 36 elements studied.
PCA is a highly powerful and versatile method for unsupervised exploration of samples. Here, the scatter plot of scores of principal components (PCs) is used to investigate patterns dealing with vinification steps and qualities while the scatter plot of loadings is used to reveal correlations and lack of correlations among the metals under study. The simultaneous evaluation of scores and loadings may provide information on descriptors or biomarkers of the different sample classes or qualities.

3. Results and Discussion

A preliminary study of multi-elemental analysis by ICP-OES and ICP-MS was performed to find out the best sample dilution ratio using 1% HNO3. The study was focused on reaching a compromise among plasma stability, matrix effects, and sensitivity. Various sample-to-nitric acid dilution ratios (1:5, 1:10, and 1:20) were tested using four representative sparkling wines. For each ratio, the corresponding blank was also analyzed.
Semi-quantitative determinations of a wide range of elements measurements were performed by ICP-MS and ICP-OES. It was found that 1:5 dilutions strongly affected the plasma stability (even switched off the plasma of the ICP-MS) since the ethanol content was too high. Hence, this set of diluted samples could not be properly measured. Measurements of samples diluted in the ratio 1:10 and 1:20 were successful and the resulting concentration did not differ significantly. Finally, the 1:10 dilution (i.e., 1 mL of sample and 9 mL of 1% HNO3) was preferred since better detection limits were achieved. Therefore, this ratio was chosen as the sample pretreatment of musts, wines, and sparkling wines.
ICP-OES allowed to determine properly 13 elements, namely: B, Ba, Ca, Cu, Fe, K, Mg, Mn, P, S, Si, Sr, and Zn. ICP-MS provided a higher performance since 24 analytes could be determined, with concentrations above the quantification limits of the instrument (B, Ba, Ca, Co, Cr, Cs, Cu, Fe, Ga, K, Li, Mg, Mn, Na, Ni, P, Rb, S, Sc, Si, Sr, Ti, Zn, and Zr). Besides, another 14 elements were also detectable (Al, As, Cd, Ce, La, Mo, Nd, Pb, Sb, Sn, U, V, W, and Y) so they were also included in the study, thus making a preliminary list of 36 elements.
From these studies, we concluded that elements such as Ca, K, Na, Mg, P, S, and Si, occurring at concentrations in the order of magnitude of mg L−1 and higher, could be better measured by ICP-OES since this technique was less affected by matrix effect while the rest of elements should be determined by ICP-MS. As a result, the combination of both techniques in a complementary way for profiling trace and sub-trace elements was the option of choice for further quantitative analysis.

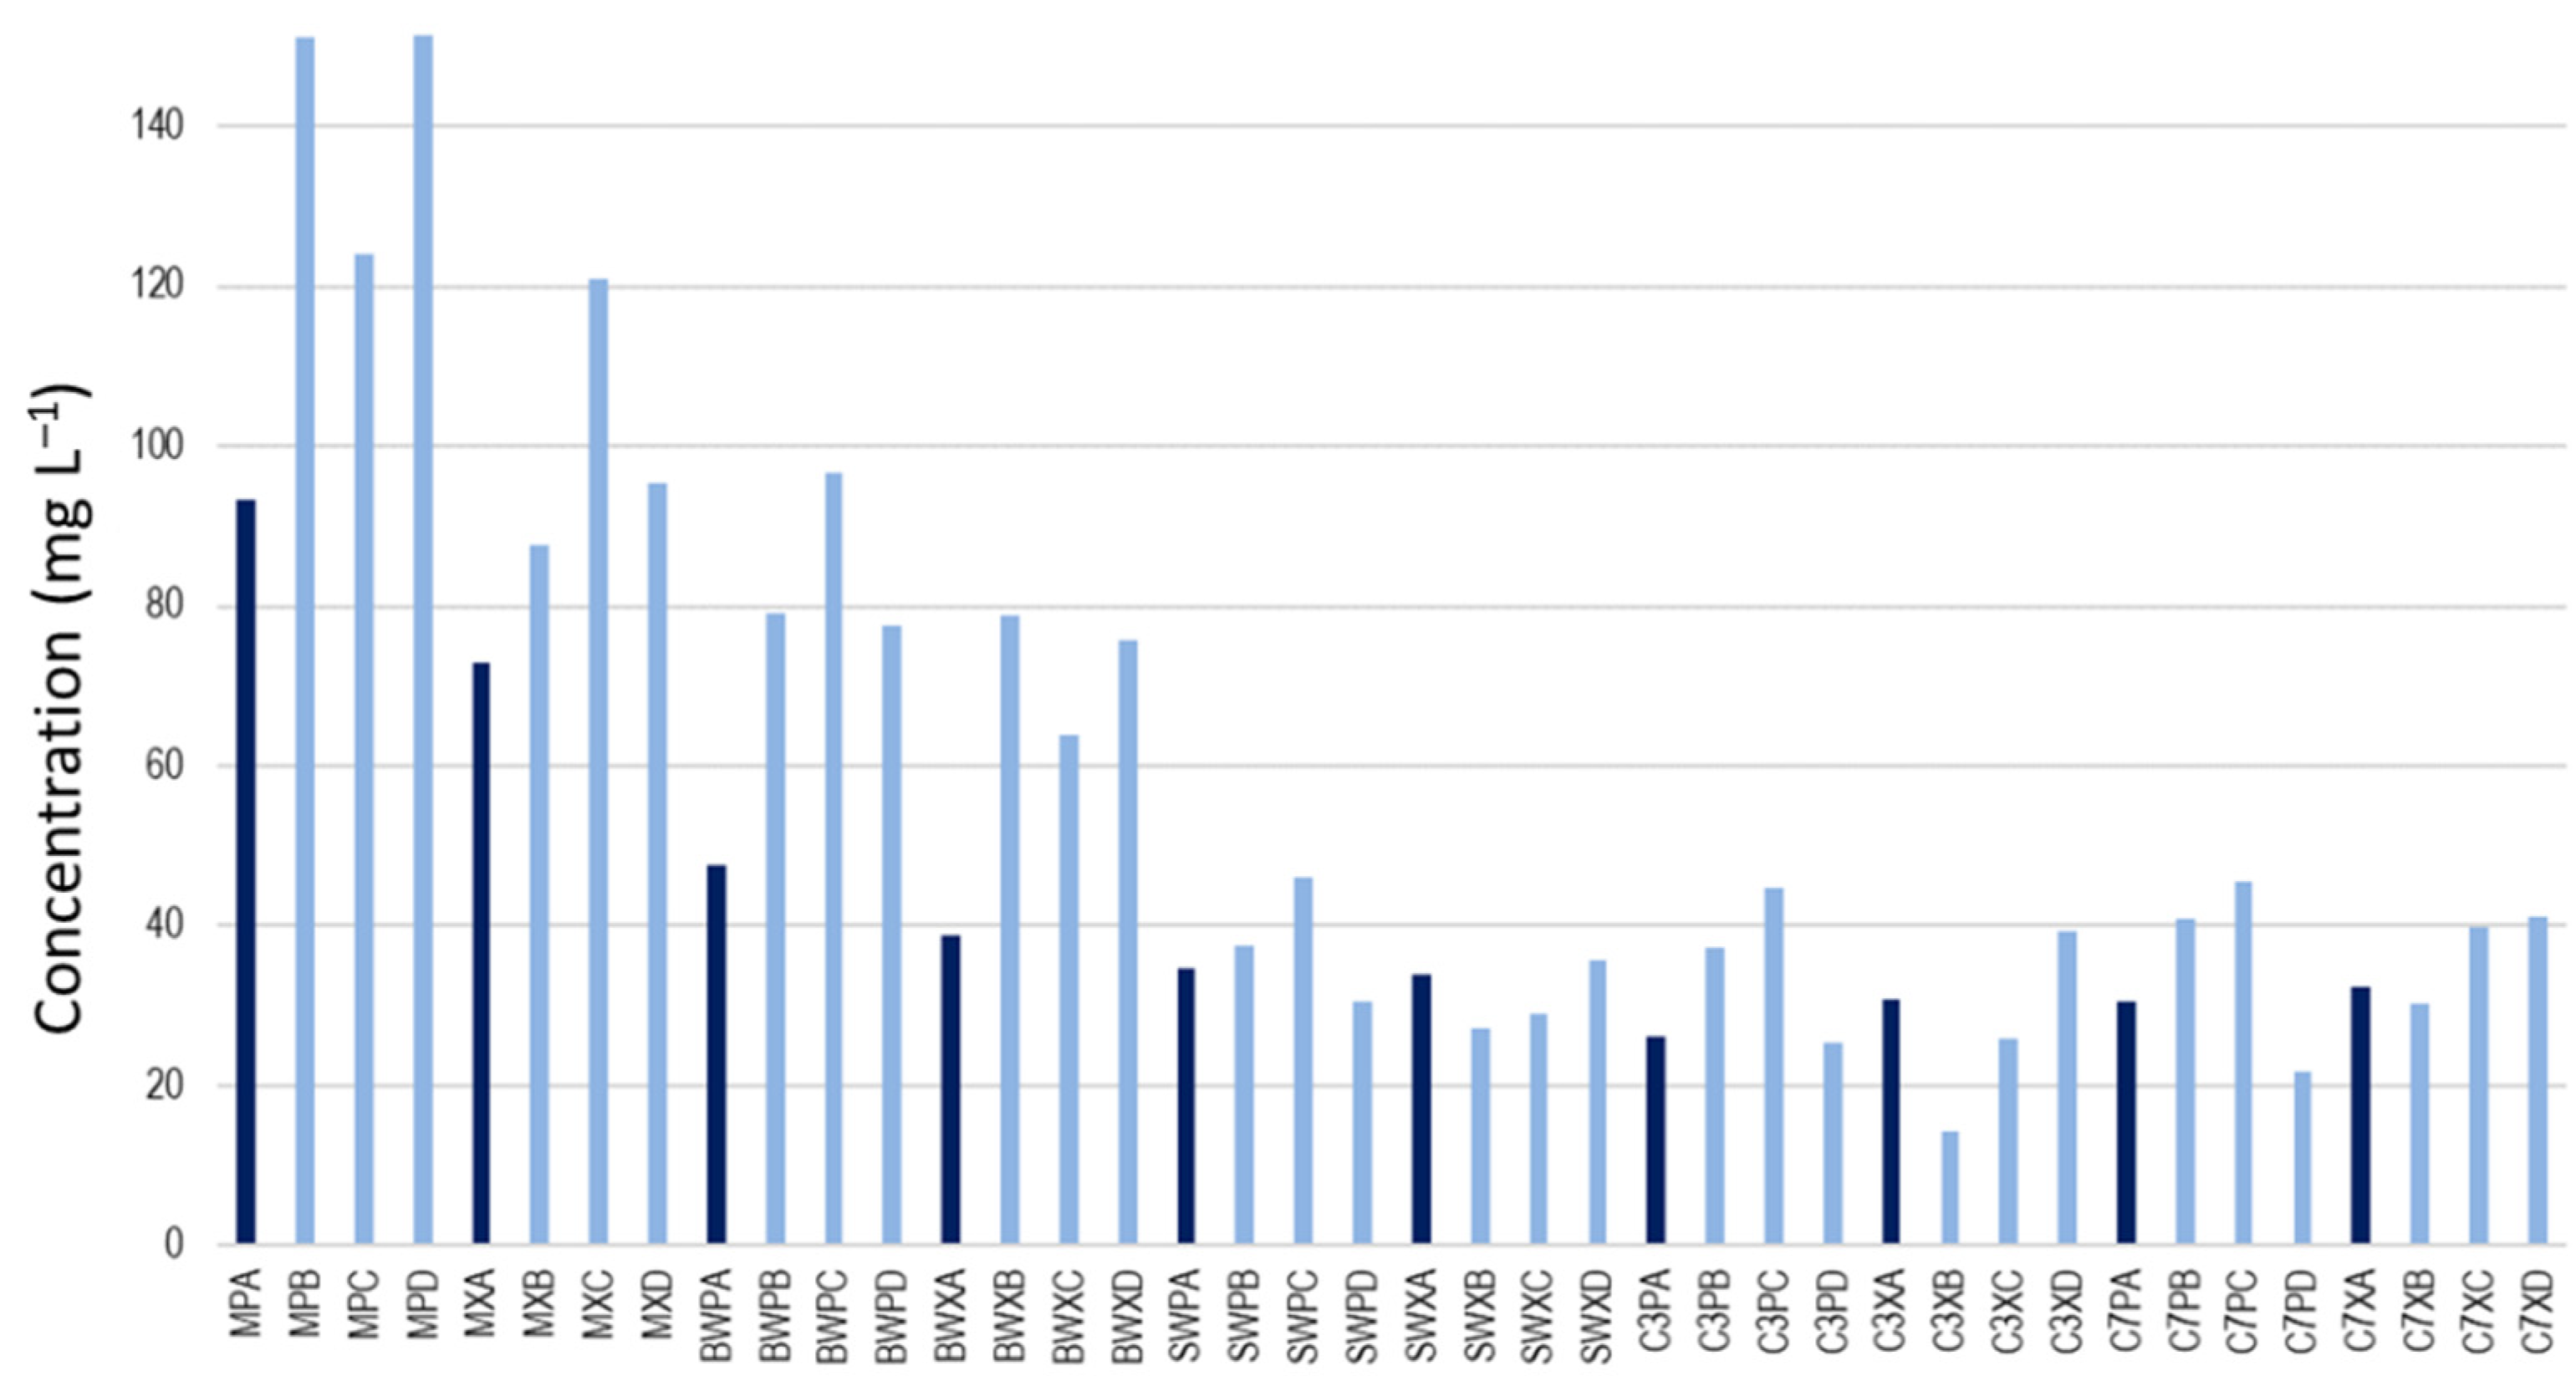
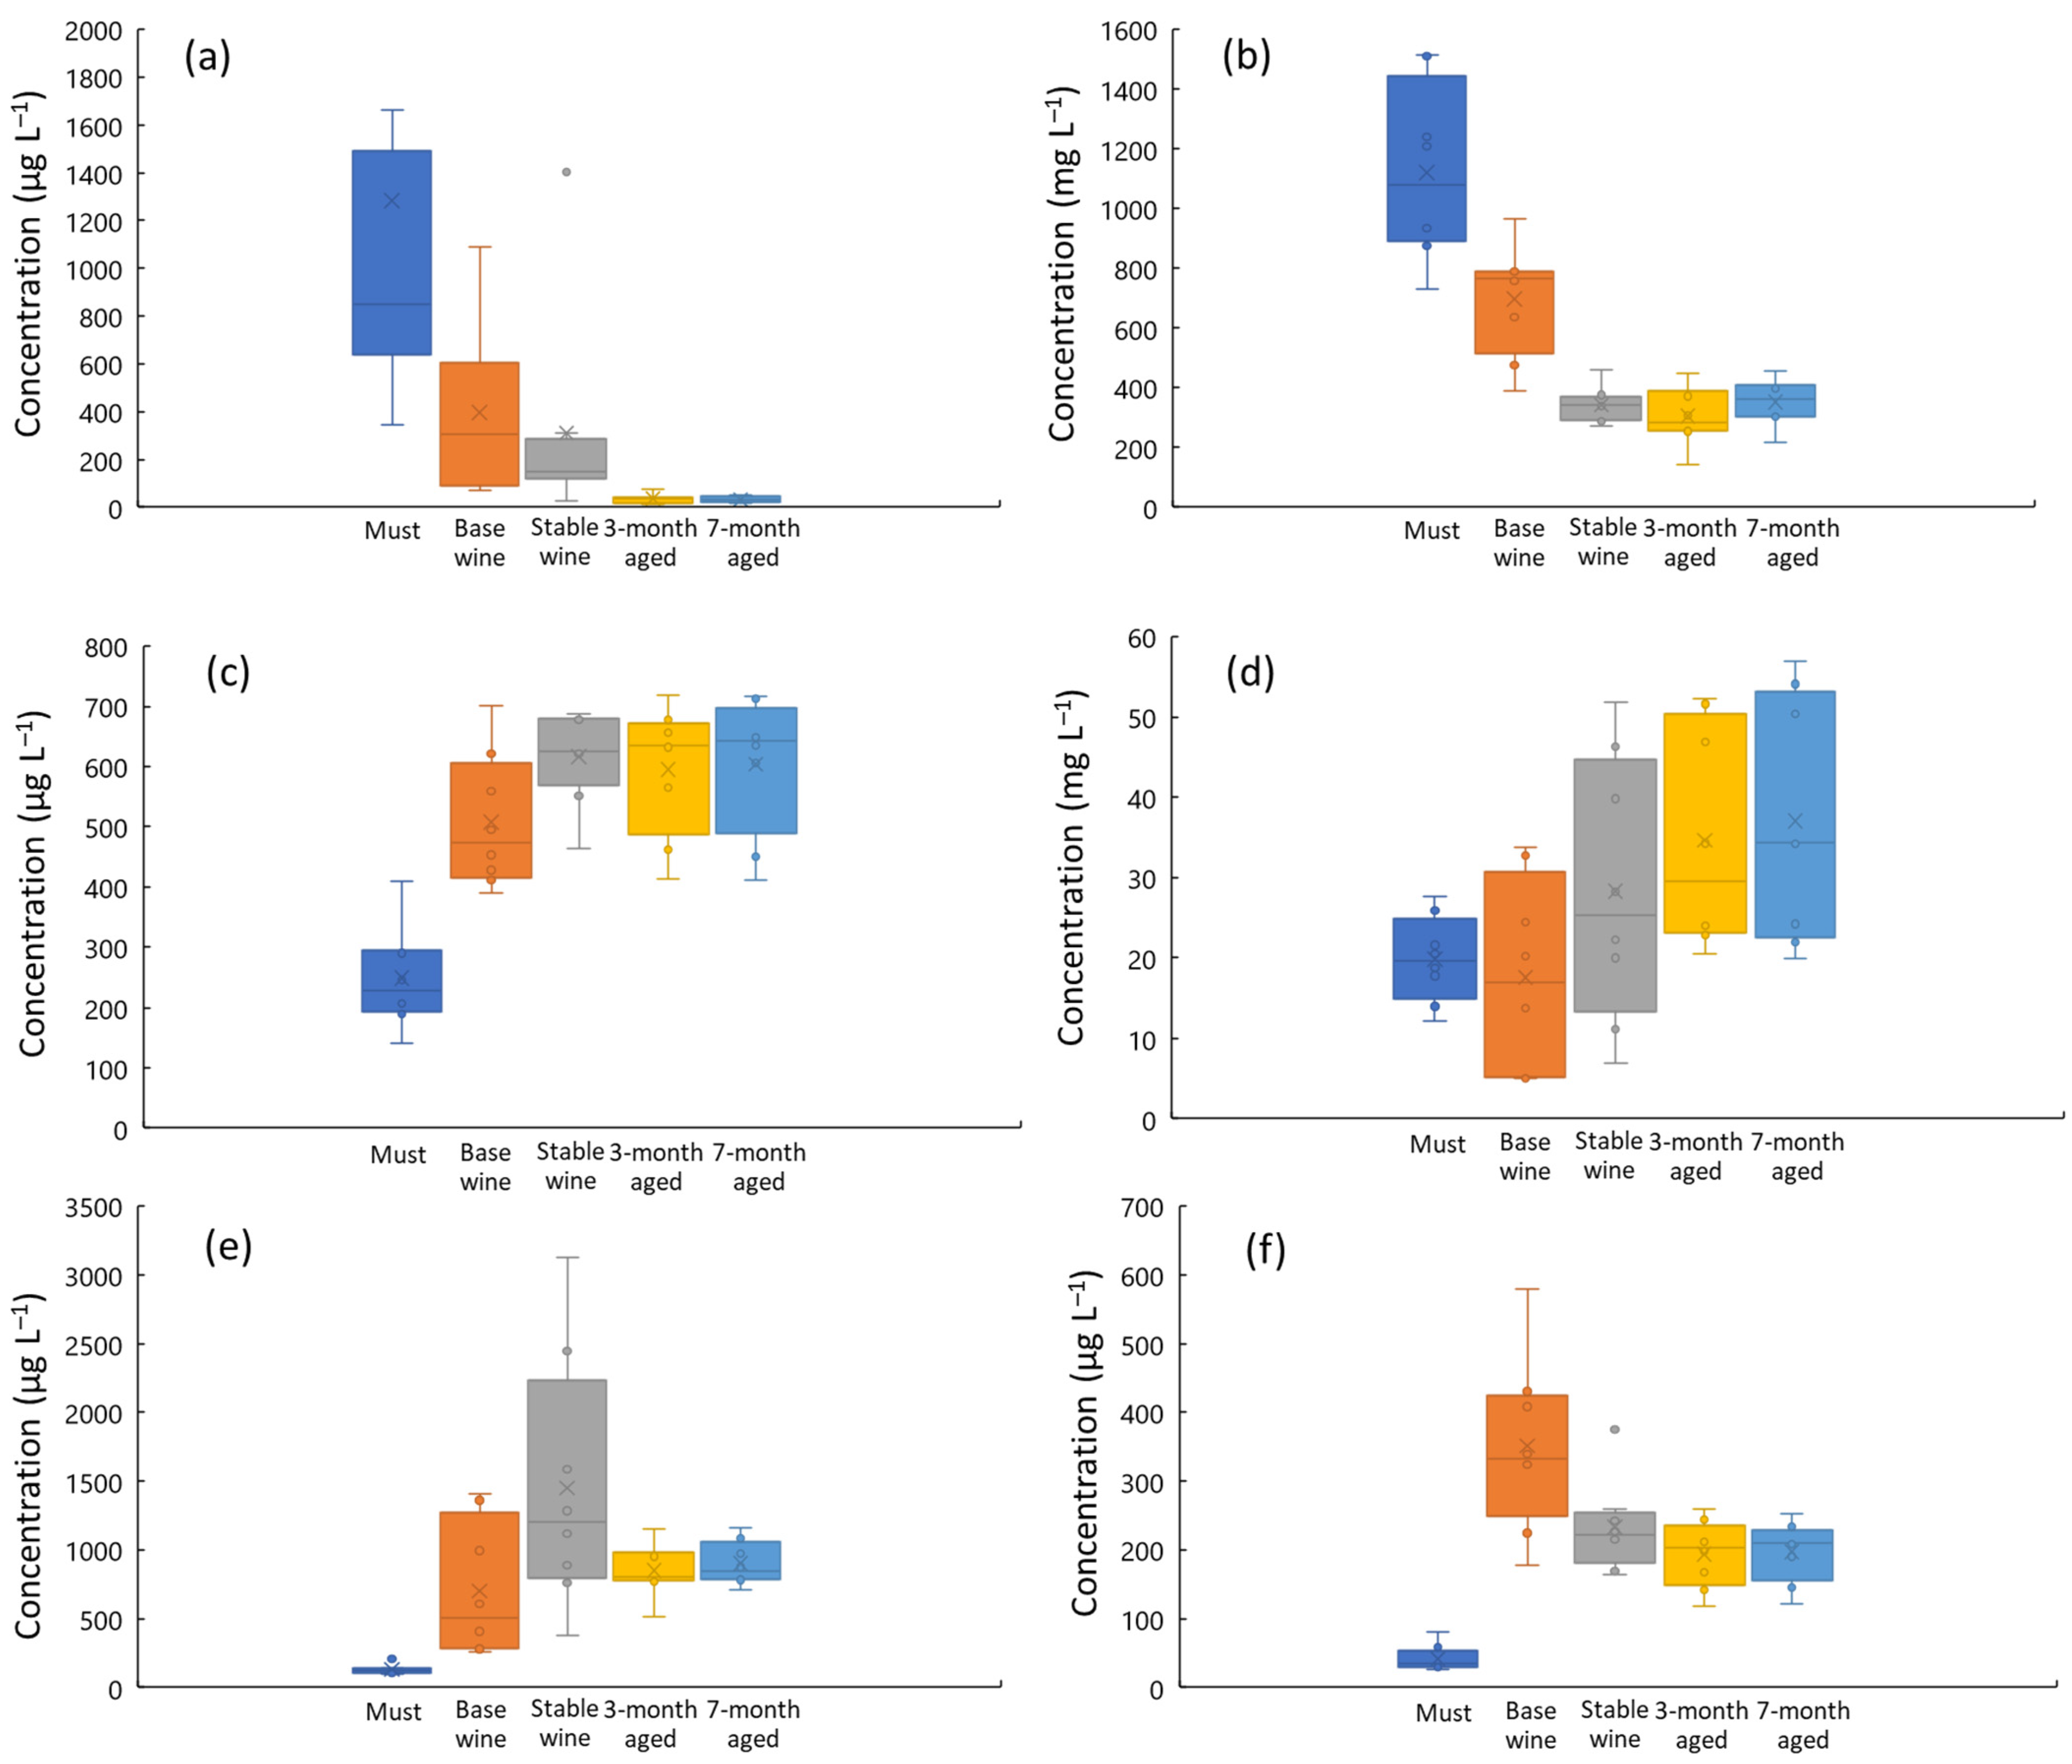
3.1. Must, Wine, and Cava Analysis

The set of samples diluted in the ratio 1:10 were analyzed by ICP-OES and ICP-MS as indicated in the experimental section. A first insight in the characterization of the set of 40 samples according to compositional data relied on boxplots and bar charts. Figure 1 shows the variation of some representative elements in the five types of samples (must, base wine, stabilized wine, and 3-month and 7-month aged sparkling wine) from both Pinot Noir and Xarel·lo varieties. As a general pattern, it was found that metals such as Cu or K displayed the highest levels at the must stage. These elements are abundant in musts since they come from agricultural practices when added as nutrients or anti-fungal agents to prevent illnesses like mildew in the Cu case and from the own grape skins or seeds in the K case. As a result, their contents progressively decreased along with the cava production process due to the interaction with lees and progressive precipitation of sediments. This decay was statistically significant, with p-values of 4.8 × 10⁻⁴ and 5.2 × 10⁻¹² for Cu and K, respectively. Differences were also significant when grape variety products were analyzed separately (Cu: p = 0.037 and 7.2 × 10⁻⁴; K; p = 1.4 × 10⁻⁶ and 2.6 × 10⁻⁵, for Xarel·lo and Pinot Noir, respectively). In the case of Cu, this deposition helps to comply legislation limit of 1 mg L−1 in wines, sparkling wines, and cavas.
Other elements were introduced during some steps of the vinification process due to the addition of products such as yeasts, bentonite, and expedition liquor. For instance, in the case of bentonite, which is added as a clarifying agent to remove the excess of protein matter, it consists of an aluminosilicate that can also contain Na, Ca, Fe, and Mg. Hence, an increase in the concentration of these elements can be found after wine clarification with bentonite. This pattern can be observed in the case of Al, with a remarkable increase in concentrations from base wines to stabilized wines. This finding was confirmed statistically (p = 0.012) for both Xarel·lo and Pinot Noir musts and wines.
After the clarification, the base wine is stabilized in cold at –2.5 °C through the precipitation of an excess of tartaric acid in musts in form of potassium bi-tartrate and calcium tartrate in the case of qualities B, C, and D in both grape varieties. Quality A is stabilized using the electrodialysis methodology to extract only the ions Ca and K and preserve the maximum quantity of the natural tartaric acid which came from the own grape. This process agreed with the noticeable decrease in K content from base wines to the stabilized ones (p = 0.037). In the case of S, the rise from the must to the base wine is due to the addition of SO2 to prevent undesired reactions dealing with the activity of some microorganisms such as acetic bacteria. Subsequently, S content decayed in stabilized wines because of its progressive volatilization before the second fermentation. It is important the SO2 concentration due to second fermentation does not work properly with values of free SO2 higher than 25–30 mg L−1. The remarkable change in S levels was also confirmed statistically (p = 6.5 × 10⁻⁹). The influence of other additives on the elemental composition is more difficult to explain due to some confidentiality issues. Anyway, contents of Mn, Na, Fe, Ti, or V clearly varied from must to wine stages (see Figure 1c,d for Mn and Fe; the same behavior was exhibited by the other elements), and these changes were always statistically sound (p < 0.0012 at least).
Apart from changes in the elemental composition depending on the sample type, other patterns dealing with the influence of product quality on the concentration of some elements were also encountered. For instance, a clear difference among the elemental composition of samples of the highest quality (A samples) and lower qualities (B, C, and D samples) was observed. As shown in Figure 2, A quality displayed lower contents of some elements such as K. This finding was attributed to conditions for the production of wines and cavas of A quality, in which a soft pressing was applied to obtain the must, and was statistically proven (p = 0.0036). In contrast to the much higher pressures (ca. 40–45% higher) applied to the other qualities. Thus, under mild pressing conditions, potassium, calcium, and other minor cations are not so efficiently extracted so that their concentrations in the A quality musts are lower. Moreover, in further vinification steps, the base wines of higher qualities are treated by electrodialysis before the tirage to remove the maximum possible amount of these ions, while those of lower qualities do not follow this procedure. Other elements such as Fe, Mg, Mn, Na, Ni, V, and Zn followed an analogous behavior regarding the difference between the top quality (A samples) and the others (B, C, and D). The significance of these findings was statistically verified (e.g., Na, p = 1.1 × 10⁻⁶; V, p = 3.2 × 10⁻⁴; Fe, p = 0.0025; Mn, p = 0.016).

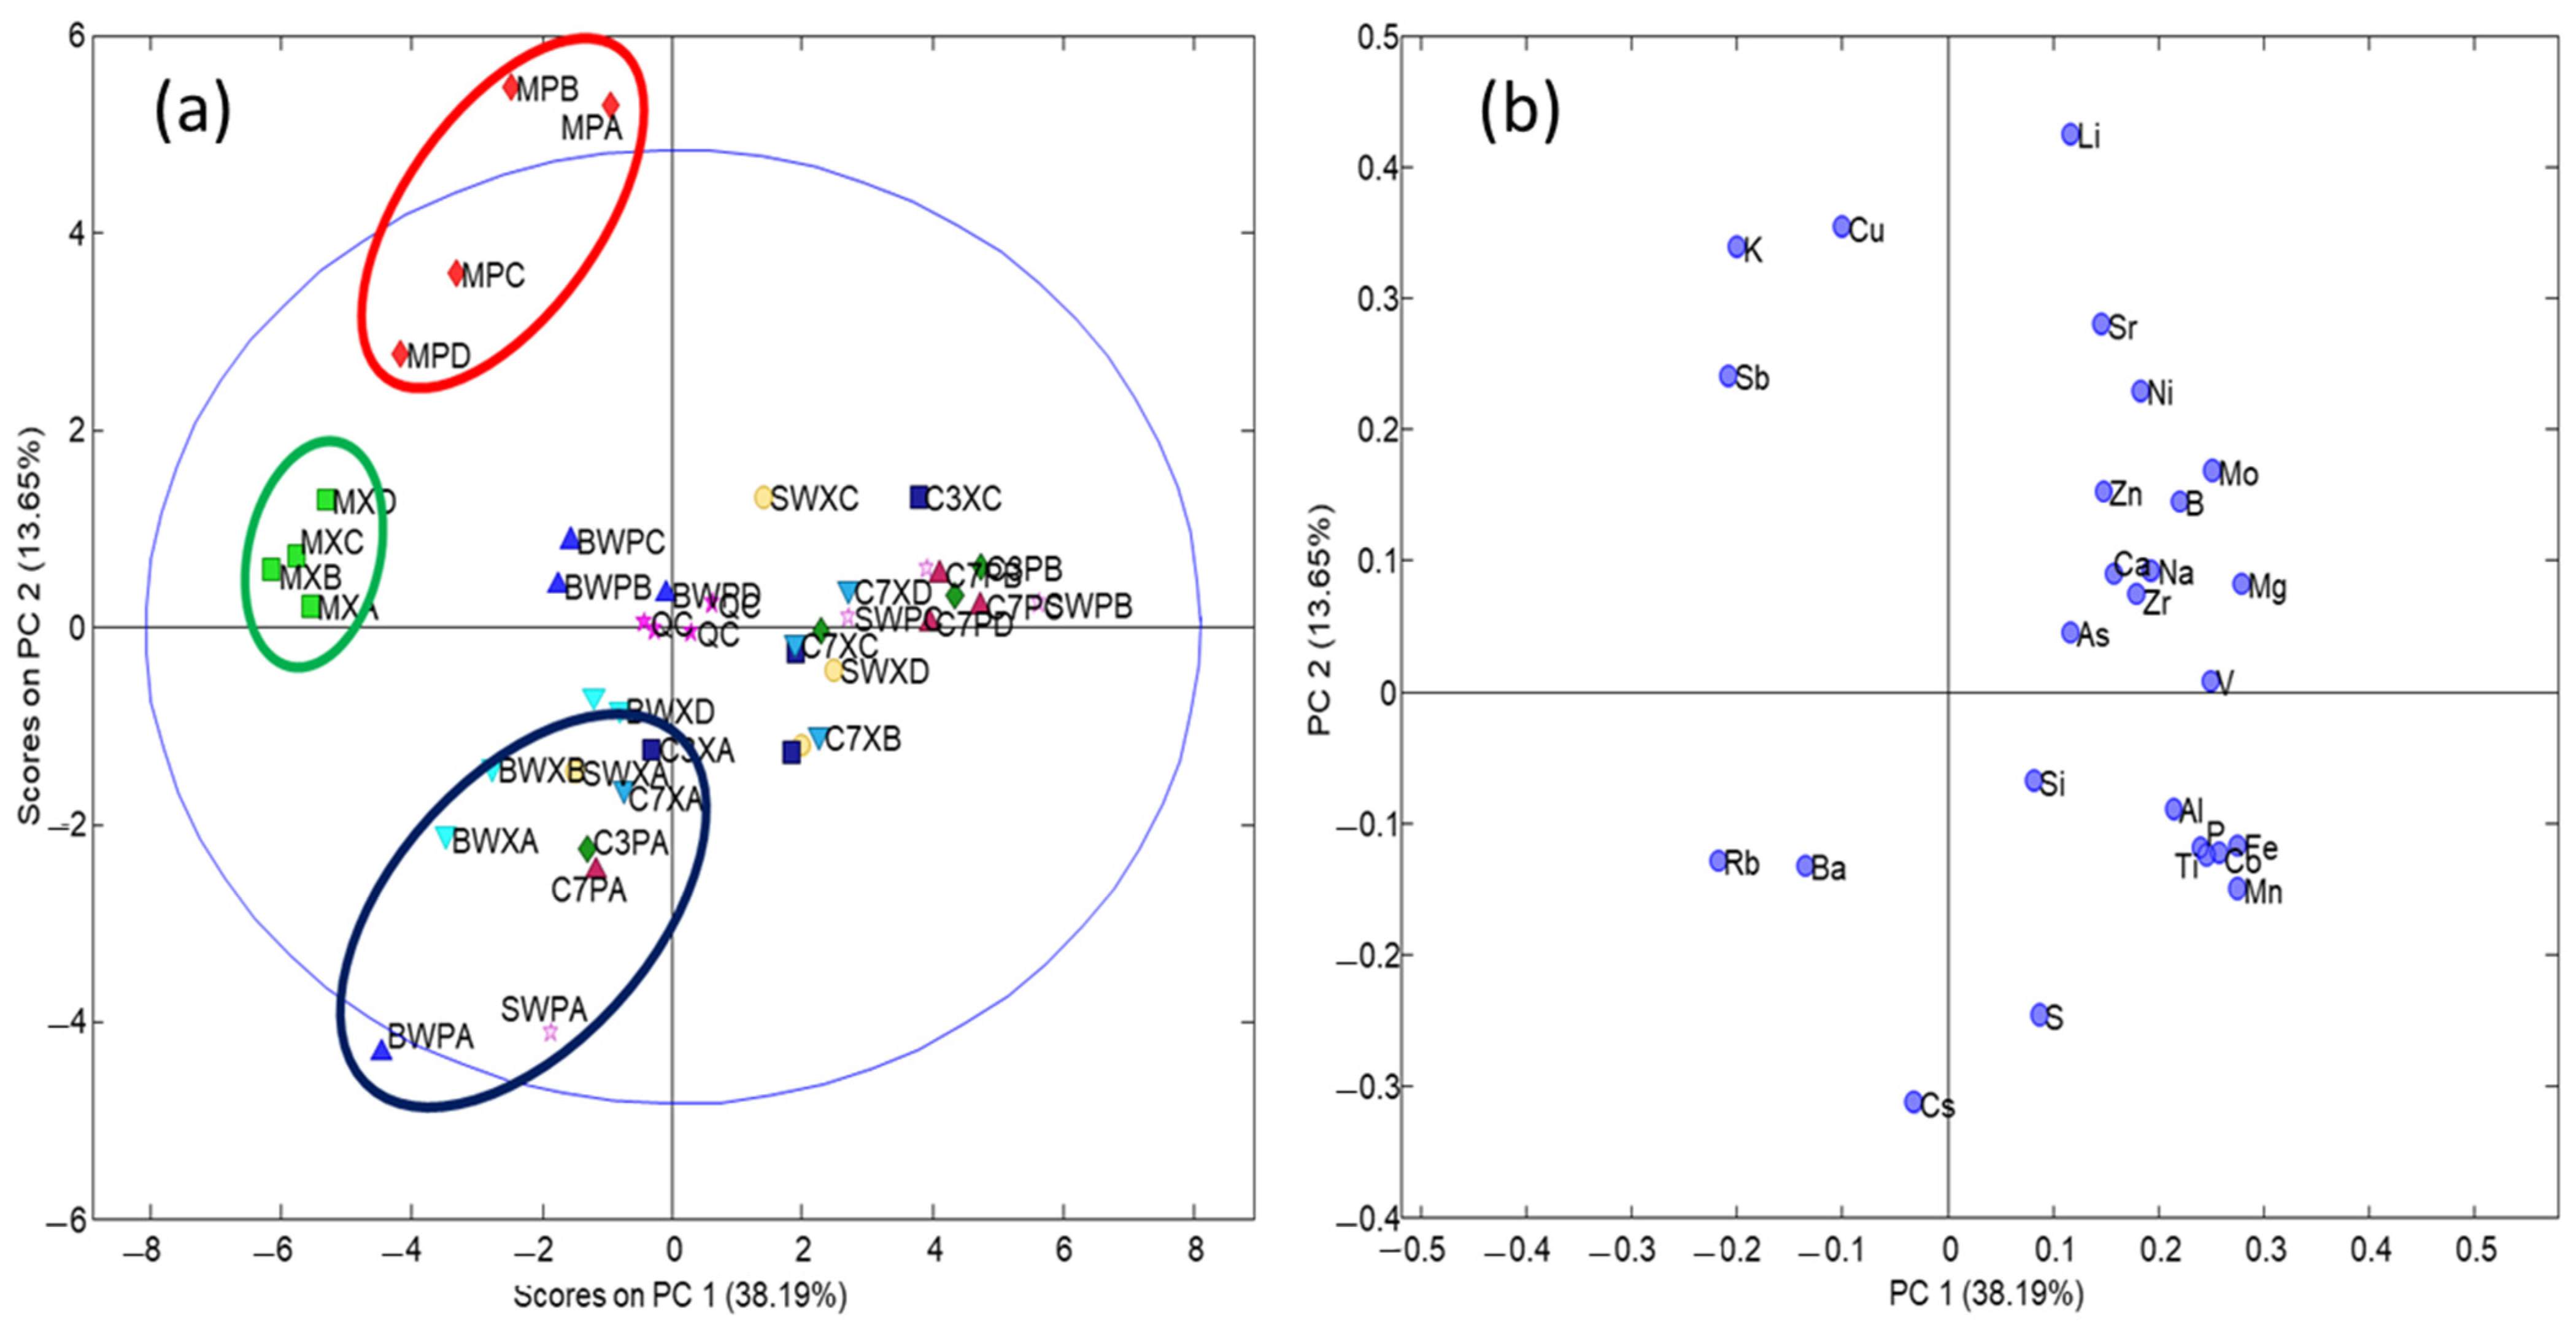
3.2. Chemometric Evaluation of Samples by PCA

The PCA model was built considering those elements exhibiting good reproducibility in the results while others displaying high dispersion were removed from the data set as they mainly contributed to the noise. A threshold filter was established at RSD > 20% so that those elements with remarkable variability in the emission intensity—higher than this limit—were discarded. As a result, 26 elements were eventually retained for further chemometric analysis, namely: Al, As, B, Ba, Ca, Co, Cu, Cs, Fe, K, Li, Mg, Mn, Mo, Na, Ni, P, Rb, S, Sb, Si, Sr, Ti, V, Zn, and Zr. Prior to PCA, data was autoscaled to equalize the contribution of trace and sub-trace elements in the model.
The PCA model was able to retain 52% of the data variance with two PCs and a summary of results is depicted in Figure 3. The plot scores of PC1 vs. PC2 showed clear segregation of must—located in the upper left quadrant—from the other type of samples. Besides, musts from Pinot Noir and Xarel·lo appeared in separated clusters regardless of their qualities (see Figure 3a). This finding was attributed to the strong influence of agricultural and soil features on elemental composition of musts. Conversely, the weight of these factors in post-fermented samples was less evident because of the bigger impact of winemaking operations on the elemental composition, so that the separation according to varieties was hindered. Another general trend that was also identified showed that fermented samples, including base wines and sparkling wines, of the highest quality (quality A, in the lower-left quadrant) were distinguishable from the other qualities (B, C, and D), being the difference greater in the case of Pinot Noir. For A-class samples, the products are preserved as much as possible with a minimum introduction of external additives so that they appear in a quite compact area. In contrast, for the other qualities (B to D), the elemental composition was affected by the set of additives used in the different stages of the process.
The interpretation of the plot of loading of PC1 vs. PC2 revealed that Cu, K, and Sb were in high concentrations in the musts, and their concentrations progressively decreased in the following stages, from base wines to stabilized wines and sparkling wines aged for 3 and 7 months in rhyme (see Figure 3b). In contrast, musts have low concentrations of Al, Fe, Mn, S, and Ti (some of these patterns were statistically confirmed as given in Section 3.1). Both musts and base wines have low concentrations of Na, V, and Zr. Regarding to product quality, the concentrations of K, Mg, Mn, Ni, Sr, and Zn in the best wines and cavas were lower than in the rest of the qualities. It was also inferred that Ba and Cs were richer and quite characteristic of Pinot Noir samples of high quality.
Results from our study are here with those from some recent scientific papers. A summary of publications in the last 10 years is in Table 2. The elemental composition of wines has been exploited to carry out their characterization, classification, and authentication based on chemometric methods [24,25,26,27,28,29,30,31,32,35,36,37,38,39,40]. Elements such as Al, B, Ca, Cu, Fe, K, Mg, Mn, Na, and Zn have been identified as discriminant descriptors of wine origins. Anyway, specific elements have been occasionally considered, including rare earth and others, especially for geographical authentication. Pb and Sr isotope ratios have also been introduced to enhance geographical discrimination. For the chemometric treatment, PCA is the method of choice for preliminary data exploration, to find out natural patterns of samples without imposing any preconceived assumption. For classification purposes, linear discriminant analysis (LDA) and partial least squares-discriminant analysis (PLS-DA) are mainly used. In some cases, other methods such as k-nearest neighbors, neural network, and support vector machine approaches are applied to improve the classification and authentication performance.
In general, the studies included in the afore-mentioned table exploit the elemental composition as geographical descriptions, mainly facing the authentication of wine origins. In this work, however, we focus on the characterization of the oenological samples according to the winemaking process and the exploration of quality issues. In this context, we have assessed the evolution of some elements throughout the vinification due to the addition of some agents. Regarding quality issues, we have demonstrated that the elemental composition may address the product quality, a relevant matter from the point of view of wine producers and consumers.

4. Conclusions

The paper relies on elemental data to gain information regarding to the oenological practices and quality of wines. Must, wine, and sparkling wine samples have been successfully characterized according to the content of some relevant elements occurring naturally or added via agricultural and oenological practices. Concentrations of 38 analytes have been determined by multi-elemental analysis by ICP-OES and ICP-MS after sample dilutions in a 1/10 ratio using 1% nitric acid as the solvent. The evolution of these elements from must to sparkling wines has been assessed preliminarily by boxplots. Results have shown interesting patterns concerning the changes in the composition of elements such as K, Cu, Ca, S, Mg, etc. Regarding product quality, significant differences have been encountered in the levels of these elements among the products of higher quality and the others. A more comprehensive study has been carried out relying on PCA. As a result, chemical markers of vinification practices and qualities have been recognized. Finally, the overall approach, combining multi-elemental analysis and chemometrics for the data treatment seems to be an excellent choice to deal with the characterization of wines depending on the winemaking processes and product qualities. Hence, the elemental composition could be putatively used to assess the product quality, a relevant matter from the point of view of both wine producers and consumers. Apart from descriptive issues, the concentrations of the metals obtained were always below the established legal limits.

Supplementary Materials

The following are available online at https://www.mdpi.com/article/10.3390/beverages8010003/s1, Table S1: Main geographical and agricultural characteristics of vineyards of Xarel lo samples. Table S2: Main geographical and agricultural characteristics of vineyards of Pinot Noir samples.

Author Contributions

B.G.: methodology, formal analysis, investigation, writing—original draft preparation, A.I.-L.: investigation, writing—review and editing, À.S.: conceptualization; supervision, J.F.L.-S.: conceptualization; supervision, writing—review and editing, J.S.: data curation, writing—original draft preparation, conceptualization; supervision, writing—review and editing. All authors have read and agreed to the published version of the manuscript.

Funding

This research has been funded by the “Agencia Estatal de Investigación” of the Spanish Ministry of Science and Innovation, grant number PID2020-114401RB-C22.

Institutional Review Board Statement

Not applicable.

Informed Consent Statement

Not applicable.

Data Availability Statement

Data is contained within the article or Supplementary Material.

Acknowledgments

The authors thank Codorníu SA for providing the samples.

Conflicts of Interest

The authors declare no conflict of interest.

References

  1. D.O. Cava. The Traditional Method or Méthode Champenoise. Available online: https://www.cava.wine/en/origin-cava/traditional-method-champenoise/ (accessed on 15 November 2021).
  2. Izquierdo-Llopart, A.; Saurina, J. Multi-Sensor Characterization of Sparkling Wines Based on Data Fusion. Chemosensors 2021, 9, 200. [Google Scholar] [CrossRef]
  3. Izquierdo-Llopart, A.; Saurina, J. Liquid Chromatographic Approach for the Discrimination and Classification of Cava Samples Based on the Phenolic Composition Using Chemometric Methods. Beverages 2020, 6, 54. [Google Scholar] [CrossRef]
  4. Izquierdo-Llopart, A.; Carretero, A.; Saurina, J. Organic Acid Profiling by Liquid Chromatography for the Characterization of Base Vines and Sparkling Wines. Food Anal. Methods 2020, 13, 1852–1866. [Google Scholar] [CrossRef]
  5. Kamiloglu, S. Authenticity and traceability in beverages. Food Chem. 2018, 277, 12–24. [Google Scholar] [CrossRef] [PubMed]
  6. Wang, L.; Sun, D.-W.; Pu, H.; Cheng, J.-H. Quality analysis, classification, and authentication of liquid foods by near-infrared spectroscopy: A review of recent research developments. Crit. Rev. Food Sci. Nutr. 2017, 57, 1524–1538. [Google Scholar] [CrossRef]
  7. Merkytė, V.; Longo, E.; Windisch, G.; Boselli, E. Phenolic Compounds as Markers of Wine Quality and Authenticity. Foods 2020, 9, 1785. [Google Scholar] [CrossRef]
  8. Danezis, G.P.; Tsagkaris, A.S.; Camin, F.; Brusic, V.; Georgiou, C.A. Food authentication: Techniques, trends & emerging approaches. Trends Anal. Chem. 2016, 85, 123–132. [Google Scholar] [CrossRef] [Green Version]
  9. Lucci, P.; Saurina, J.; Nuñez, O. Trends in LC-MS and LC-HRMS analysis and characterization of polyphenols in food. Trends Anal. Chem. 2017, 88, 1–24. [Google Scholar] [CrossRef] [Green Version]
  10. Esteki, M.; Simal-Gandara, J.; Shahsavari, Z.; Zandbaaf, S.; Dashtaki, E.; Heyden, Y.V. A review on the application of chro-matographic methods, coupled to chemometrics, for food authentication. Food Control 2018, 93, 165–182. [Google Scholar] [CrossRef]
  11. Callao, M.P.; Ruisánchez, I. An overview of multivariate qualitative methods for food fraud detection. Food Control 2018, 86, 283–293. [Google Scholar] [CrossRef]
  12. Versari, A.; Laurie, F.; Ricci, A.; Laghi, L.; Parpinello, G.P. Progress in authentication, typification and traceability of grapes and wines by chemometric approaches. Food Res. Int. 2014, 60, 2–18. [Google Scholar] [CrossRef]
  13. Serrano-Lourido, D.; Saurina, J.; Hernández-Cassou, S.; Checa, A. Classification and characterisation of Spanish red wines according to their appellation of origin based on chromatographic profiles and chemometric data analysis. Food Chem. 2012, 135, 1425–1431. [Google Scholar] [CrossRef] [PubMed]
  14. Saurina, J. Characterization of wines using compositional profiles and chemometrics. Trends Anal. Chem. 2010, 29, 234–245. [Google Scholar] [CrossRef]
  15. Drivelos, S.A.; Georgiou, C.A. Multi-element and multi-isotope-ratio analysis to determine the geographical origin of foods in the European Union. Trends Anal. Chem. 2012, 40, 38–51. [Google Scholar] [CrossRef]
  16. Husted, S.; Persson, D.P.; Laursen, K.H.; Hansen, T.H.; Pedas, P.; Schiller, M.; Hegelund, J.N.; Schjoerring, J.K. Review: The role of atomic spectrometry in plant science. J. Anal. At. Spectrom. 2010, 26, 52–79. [Google Scholar] [CrossRef]
  17. Gómez-Armesto, A.; Carballeira-Díaz, J.; Pérez-Rodríguez, P.; Fernández-Calviño, D.; Arias-Estévez, M.; Muñoz, J.C.N.; Álvarez-Rodríguez, E.; Fernández-Sanjurjo, M.J.; Núñez-Delgado, A. Copper content and distribution in vineyard soils from Betanzos (A Coruña, Spain). Span. J. Soil Sci. 2015, 5, 60. [Google Scholar] [CrossRef]
  18. Herrero-Hernández, E.; Andrades, M.S.; Rodríguez-Cruz, M.S.; Arienzo, M.; Sánchez-Martín, M.J. Long-term variability of metals from fungicides applied in amended young vineyard fields of La Rioja (Spain). Environ. Monit. Assess. 2011, 184, 3359–3371. [Google Scholar] [CrossRef] [Green Version]
  19. Orescanin, V.; Katunar, A.; Kutle, A.; Valkovic, V. Heavy metals in soil, grape, and wine. J. Trace Microprobe Tech. 2003, 21, 171–180. [Google Scholar] [CrossRef]
  20. International Code of Oenological Practices. International Organization of Vine and Wine. Annex: Maximum Acceptable Limits. 2021. Available online: https://www.oiv.int/public/medias/7713/en-oiv-code-2021.pdf (accessed on 15 November 2021).
  21. Katerinopoulou, K.; Kontogeorgos, A.; Salmas, C.E.; Patakas, A.; Ladavos, A. Geographical Origin Authentication of Agri-Food Products: A Review. Foods 2020, 9, 489. [Google Scholar] [CrossRef] [PubMed]
  22. Suhaj, M.; Korenovska, M. Application of elemental analysis for identification of wine origin—A review. Acta Aliment. 2005, 34, 393–401. [Google Scholar] [CrossRef]
  23. Cubadda, F. Inductively Coupled Plasma-Mass Spectrometry for the Determination of Elements and Elemental Species in Food: A Review. J. AOAC Int. 2004, 87, 173–204. [Google Scholar] [CrossRef] [Green Version]
  24. Gonzálvez, A.; Llorens, A.; Cervera, M.; Armenta, S.; de la Guardia, M. Elemental fingerprint of wines from the protected designation of origin Valencia. Food Chem. 2009, 112, 26–34. [Google Scholar] [CrossRef]
  25. Šelih, V.S.; Šala, M.; Drgan, V. Multi-element analysis of wines by ICP-MS and ICP-OES and their classification according to geographical origin in Slovenia. Food Chem. 2014, 153, 414–423. [Google Scholar] [CrossRef] [PubMed]
  26. Horii, S.; Hashiguchi, T.; Izu, H.; Sudo, S. Analysis of element composition of Japanese and other wine and their classifica-tion. J. Jap. Soc. Horticul. Sci. 2011, 80, 506–511. [Google Scholar] [CrossRef] [Green Version]
  27. Di Paola-Naranjo, R.D.; Baroni, M.V.; Podio, N.S.; Rubinstein, H.R.; Fabani, M.P.; Badini, R.G.; Inga, M.; Ostera, H.A.; Cagnoni, M.; Gallegos, E.; et al. Fingerprints for Main Varieties of Argentinean Wines: Terroir Differentiation by Inorganic, Organic, and Stable Isotopic Analyses Coupled to Chemometrics. J. Agric. Food Chem. 2011, 59, 7854–7865. [Google Scholar] [CrossRef] [PubMed]
  28. Geana, I.; Iordache, A.; Ionete, R.; Marinescu, A.; Ranca, A.; Culea, M. Geographical origin identification of Romanian wines by ICP-MS elemental analysis. Food Chem. 2013, 138, 1125–1134. [Google Scholar] [CrossRef]
  29. Azcarate, S.; Martinez, L.D.; Savio, M.; Camiña, J.M.; Gil, R.A. Classification of monovarietal Argentinean white wines by their elemental profile. Food Control 2015, 57, 268–274. [Google Scholar] [CrossRef]
  30. Soares, F.; Anzanello, M.J.; Fogliatto, F.S.; Marcelo, M.C.; Ferrão, M.F.; Manfroi, V.; Pozebon, D. Element selection and concentration analysis for classifying South America wine samples according to the country of origin. Comput. Electron. Agric. 2018, 150, 33–40. [Google Scholar] [CrossRef]
  31. Yamashita, G.H.; Anzanello, M.J.; Soares, F.; Rocha, M.K.; Fogliatto, F.S.; Rodrigues, N.P.; Rodrigues, E.; Celso, P.G.; Manfroi, V.; Hertz, P.F. Hierarchical classification of sparkling wine samples according to the country of origin based on the most informative chemical elements. Food Control 2019, 106, 106737. [Google Scholar] [CrossRef]
  32. Rodrigues, N.P.; Rodrigues, E.; Celso, P.G.; Kahmann, A.; Yamashita, G.H.; Anzanello, M.J.; Manfroi, V.; Hertz, P.F. Dis-crimination of sparkling wines samples according to the country of origin by ICP-OES coupled with multivariate analysis. Food Sci. Technol. 2020, 131, 109760. [Google Scholar]
  33. Kozak, M.; Scaman, C.H. Unsupervised classification methods in food sciences: Discussion and outlook. J. Sci. Food Agric. 2008, 88, 1115–1127. [Google Scholar] [CrossRef]
  34. Granato, D.; Putnik, P.; Kovačević, D.B.; Santos, J.S.; Calado, V.; Rocha, R.S.; Da Cruz, A.G.; Jarvis, B.; Rodionova, O.Y.; Pomerantsev, A. Trends in Chemometrics: Food Authentication, Microbiology, and Effects of Processing. Compr. Rev. Food Sci. Food Saf. 2018, 17, 663–677. [Google Scholar] [CrossRef] [Green Version]
  35. Cruz, T.L.E.; Esperanza, M.G.; Wrobel, K.; Barrientos, E.Y.; Aguilar, F.J.A.; Wrobel, K. Determination of major and minor elements in Mexican red wines by microwave-induced plasma optical emission spectrometry, evaluating different calibration methods and exploring potential of the obtained data in the assessment of wine provenance. Spectrochim. Acta Part B Atom. Spectrosc. 2019, 164, 105754. [Google Scholar] [CrossRef]
  36. Khalafyan, A.A.; Temerdashev, Z.A.; Kaunova, A.A.; Abakumov, A.G.; Titarenko, V.O.; Akin’shina, V.A.; Ivanovets, E.A. Determination of the Wine Variety and Geographical Origin of White Wines Using Neural Network Technologies. J. Anal. Chem. 2019, 74, 617–624. [Google Scholar] [CrossRef]
  37. Da Costa, N.L.; Ximenez, J.P.B.; Rodrigues, J.L.; Barbosa, F.; Barbosa, R. Characterization of Cabernet Sauvignon wines from California: Determination of origin based on ICP-MS analysis and machine learning techniques. Eur. Food Res. Technol. 2020, 246, 1193–1205. [Google Scholar] [CrossRef]
  38. Bora, F.D.; Donici, A.; Rusu, T.; Bunea, A.; Popescu, D.; Bunea, C. Elemental Profile and Pb-207/Pb-206, Pb-208/Pb-206, Pb-204/Pb-206, Sr-87/Sr-86 Isotope Ratio as Fingerprints for Geographical Traceability of Romanian Wines. Not. Bot. Horti Agrobo. 2018, 46, 223–239. [Google Scholar] [CrossRef] [Green Version]
  39. Geana, E.I.; Sandru, C.; Stanciu, V.; Ionete, R.E. Elemental Profile and Sr-87/Sr-86 Isotope Ratio as Fingerprints for Geo-graphical Traceability of Wines: An Approach on Romanian Wines. Food Anal. Methods 2017, 10, 63–73. [Google Scholar] [CrossRef]
  40. Ivanova-Petropulos, V.; Balabanova, B.; Bogeva, E.; Frentiu, T.; Ponta, M.; Senila, M.; Gulaboski, R.; Irimie, F.D. Rapid De-termination of Trace Elements in Macedonian Grape Brandies for Their Characterization and Safety Evaluation. Food Anal. Methods 2017, 10, 459–468. [Google Scholar] [CrossRef] [Green Version]
Figure 1. Boxplot diagrams with the concentrations of Cu (a), K (b), Mn (c), Na (d), Al (e), and S (f), for the different type of samples.
Beverages 08 00003 g001
Figure 2. Bar chart of the potassium (K) concentration in the different samples. Quality A for each type of sample has been marked in darker blue to be distinguishable.
Beverages 08 00003 g002
Figure 3. Plots of Scores (a) and Loadings (b) from the principal component analysis model. The red ellipse encompasses the musts of Pinot Noir, the green one the musts of Xarel·lo and the blue one the A qualities of wines and sparkling wines from both grape varieties. The thin blue ellipse is the confidence interval at 95%.
Beverages 08 00003 g003
Table 1. Set of samples provided for the study. Sample codes are as follows: M, must; BW, base wine; SW, stabilized wine; C3, 3 months in rhyme sparkling wine (sparkling wine); C7, 7 months in rhyme sparkling wine (sparkling wine); P, Pinot Noir; X, Xarel·lo; A, quality A; B, quality B; C, quality C; D, quality D.
Grape
Variety
QualityMustBase WineStabilized Wine3 Months Sparkling Wine7 Months Sparkling Wine
Pinot NoirAMPABWPASWPAC3PAC7PA
BMPBBWPBSWPBC3PBC7PB
CMPCBWPCSWPCC3PCC7PC
DMPDBWPDSWPDC3PDC7PD
Xarel·loAMXABWXASWXAC3XAC7XA
BMXBBWXBSWXBC3XBC7XB
CMXCBWXCSWXCC3XCC7XC
DMXDBWXDSWXDC3XDC7XD
Table 2. Summary of papers published from 2011 to 2021 on the chemometric characterization and authentication of wines and related samples based on elemental composition.
Sample OriginInstrumental TechniqueSample
Pretreatment
DilutionMeasured ElementsChemometric
Method
Ref.
Japan, Chile, United States, France and ItalyICP-OESAcid digestion2:5:1 (v/v/v) with 60% HNO3 and 30% H2O2
Final 1:5 dilution with 1% HNO3
Al, B, Ba, Ca, Cd, Cr, Cs, Cu, Fe, K, Li, Mg, Mn, Mo, Na, Ni, P, Pb, Sr, V, Y and ZnPCA and LDA[25]
ArgentinaICP-MSMineralization followed by acid digestion5:6 (v/v) with HNO3(cc)
Final 1:5 dilution with H2O
Al, B, Ba, Ca, Cd, Ce, Co, Cs, Cu, Eu, Ga, K, La, Li, Lu, Mg, Mn, Mo, Na, Ni, Nd, Pb, Rb, Se, Sm, Sr, Tl, U, V, Yb, and ZnDA[26]
RomaniaICP-MSAcid digestion1:1 (v/v) with HNO3(cc)
Final 1:20 dilution with H2O
Ag, Be, Co, Cr, Cu, Mn, Ni, Pb, Rb, Sr, V and Zn PCA[27]
SloveniaICP-OESOnly dilution1:3 (v/v) with 2% HNO3Al, B, Ca, Cu, Fe, K, Mg, Mn, Na and Zn PCA and CPANN[28]
ICP-MSOnly dilution1:10 (v/v) with 2% HNO3Ag, Au, As, Ba, Be, Bi, Ce, Co, Cr, Dy, Ga, Gd, Ge, Hg, Ir, La, Li, Mo, Nb, Nd, Ni, Os, Pb, Pd, Pt, Re, Rh, Ru, Sb, Sc, Se, Sn, Ta, Ti, Tl V, W, Y, and ZrPCA and CPANN
ArgentinaICP-MSOnly dilution1:10 (v/v) with 1% HNO3As, Ba, Be, Bi, Cd, Co, Cu, Hg, Li, Mn, Mo, Ni, Pb, Rb, Sr, Tl and VPCA and LDA[29]
Argentina, Brazil, Chile and UruguayICP-OESAcid digestion1:3 (v/v) with 2% HNO3, followed by 1:25 dilution with H2O, and final 1:10 dilution with 5% HNO3Al, Ba, Ca, Fe, K, Mg, Mn, Na, P, Rb, Sr, Ti, and ZnNN, LDA, NB and SVM[30]
ICP-MSAcid digestion1:3 (v/v) with 2% HNO3, followed by 1:25 dilution with H2O, and final 1:2 dilution with 5% HNO3Ag, As, Be, Bi, Cd, Ce, Co, Cr, Cu, Dy, Er, Eu, Gd, Ho, La, Li, Lu, Mo, Nd, Ni, Pb, Pr, Sb, Se, Sm, Sn. Tb, Tl, Tm, U, V and YbNN, LDA, NB and SVM
Argentina, Brazil, France and SpainICP-OESDegasification1:10 (v/v) with 1 M HNO3 for major elements, while minor elements are non-dilutedAl, B, Ba, Ca, Cu, Fe, K, Li, Mg, Mn, Na, and SrLDA and NB[31]
Brazil, Argentina, Spain and FranceICP-OESDegasification using ultrasonic bath1:10 (v/v) with 1 M HNO3 for major elements, while minor elements are non-dilutedAl, B, Ba, Ca, Cu, Fe, K, Li, Mg, Mn, Na, and SrLDA, PCA and LR[32]
MexicoMIP-OESOnly dilution1:100, 1:50, 1:10, and 1:4 (v/v) with 1 M HNO3 depending on concentrationsAl, Ca, Cu, Cr, Fe, K, Mg, Mn, Na, Rb, and SrPCA[35]
KrasnodarICP-OESOnly dilution1:10 (v/v) with 1 M HNO3 Fe, Mg, Rb, Ti, and Na NN[36]
CaliforniaICP-MSOnly dilution1:10 (v/v) with 1 M HNO3 Al, Cd, Co, Cr, Cu, Li, Mn, Ni, P, Pb, Rb, Sr, and ZnSVM[37]
RomaniaICP-MSDilution and microwave digestion 1:16 (v/v) with HNO3 + H2O2Ag, Al, As, Ba, Be, Bi, Ca, Cd, Co, Cr, Cs, Cu, Fe, Ga, In, K, Li, Mg, Mn, Na, Ni, Pb, Rb, Se, Sr, Tl, V, U, Zn, and Hg. Isotope ratios; 207Pb/206Pb, 208Pb/206Pb, 204Pb/206Pb, and 87Sr/86SrLDA[38]
RomaniaFAAS, GFAAS, and ICP-MSDilution and microwave digestion 1:1 (v/v) with HNO3
Final 1:20 dilution with H2O
Li, Ga, Se, Ag, Tl, Pb, Ni, Cr, Ba, Zn, Sr, Rb, Al, Cu, Mn, Fe, Ca, Mg, Na, K, and 87Sr/86SrLDA[39]
Macedonia (brandy) GFAAS-Direct injection Cd, Cr, Cu, Fe, Mn, Ni, Pb, and ZnPCA[40]
Acronyms: CPANN, Counter-propagation Artificial Neural network; DA, discriminant analysis; FAAS, flame atomic absorption spectroscopy; GFAAS, graphite furnace atomic absorption spectroscopy; ICP-MS, inductively coupled plasma-mass spectrometry; ICP-OES, inductively coupled plasma-optical emission spectrometry; LDA, linear discriminant analysis; LR, logistic regression; MIP, microwave-induced plasma; NB, nearest neighbors; NN, neural network; PCA, principal component analysis; SVM, support vector machine.
Publisher’s Note: MDPI stays neutral with regard to jurisdictional claims in published maps and institutional affiliations.

