Article

The Impact of Collaborative Communication on the Physical Distribution Service Quality of Soft Drinks: A Case Study of Beverage Manufacturing Companies in Greece

by
Stavros Kalogiannidis
1,*,
Dimitrios Kalfas
2 and
Fotios Chatzitheodoridis
3
1
Department of Business Administration, University of Western Macedonia, 51100 Grevena, Greece
2
Department of Agriculture, Faculty of Agricultural Sciences, University of Western Macedonia, 53100 Florina, Greece
3
Department of Regional and Cross-Border Development, University of Western Macedonia, 50100 Kozani, Greece
*
Author to whom correspondence should be addressed.
Beverages 2022, 8(3), 47; https://doi.org/10.3390/beverages8030047
Submission received: 26 June 2022 / Revised: 17 July 2022 / Accepted: 9 August 2022 / Published: 12 August 2022

Abstract

:
This research aimed to use the collaborative communication aspects of information sharing, incentive alignment, and decision synchronization to explain physical distribution service quality in the soft drink demand chain. The research was prompted by a desire to learn more about a topic that has received little attention in Greece while also contributing information about the variables that influence the performance of soft drink distribution networks. Manufacturers in Greece provided the data. The aspects of collaborative communication were significant determinants of the physical distribution service quality. Physical distribution service quality was shown to be significantly predicted by incentive alignment and information sharing, but not by decision synchronization. This research shows that collaborative communication aspects such as information sharing, decision synchronization, and incentive alignment enhance physical distribution service quality in soft drink demand chains. The research used a primary sample of 200 study participants from different drink manufacturing plants around Greece. In our research, we focused on vertical cooperation between manufacturers and distributors and its effect on physical distribution service quality. This is a relatively unexplored topic in the developing world. According to the scholars cited in the literature review, information exchange, incentive alignment, and decision synchronization improve physical distribution service quality in demand chains.

1. Introduction

1.1. Background to the Study

Soft drink makers and distributors utilize intermediaries to build distribution networks that are sensitive to customer requirements. Soft drink manufacturers and downstream distributors might react more swiftly to customer requirements if they shared information. However, it is known that 60% of collaborations in logistical demand chains include manufacturing firms and suppliers, as opposed to the 56% that include manufacturers and customers. These partnerships require extensive information sharing, collaborative planning, decision synchronization, and incentive alignment [1].
European soft drink producers and distributors are still not correctly using these enablers for vertical cooperation in their distribution networks. This research adds the private sector component of logistical collaboration to the sole cooperation study in public procurement. The information shared among demand chain participants is insufficient. The communication technologies in use are the Internet for email and telephone calls. Physical distribution (PD) is a subset of logistics that includes everything from marketing to customer support to product delivery [2].
A larger logistical system, which involves everything from marketing to customer service to supplying soft drinks to end consumers, includes Physical Distribution Service Quality (PDSQ). If a physical distribution system is trustworthy and ensures the availability and prompt delivery of items to end consumers, it is of high quality [2]. Physical distribution operations in Europe have more obstacles than benefits in terms of increasing PDSQ due to inadequate cooling/storage facilities and poor communication flow. Transportation, warehouse, packing, management of information, order fulfillment, and handling are examples of these tasks. These issues are made worse by inaccurate demand forecasts based on insufficient consumer data shared between producers and distributors, a lack of incentive alignment, and the synchronization of process decisions under cooperation agreements [3,4].
According to Ibn El Farouk et al. (2020), PDSQ inefficiencies may be reduced, if not avoided, via vertical cooperation or collaboration between soft drink producers and downstream distributors. However, in order for these partnerships to be successful, a significant amount of information must be exchanged, decisions must be synchronized, and financial incentives must be aligned. Unfortunately, the participants in the soft drink supply chain have not fully utilized any of these options to improve their physical distribution operations. While deciding on a course of action, producers and distributors do not confer with one another. Manufacturers setting lower prices for retail distributors to gain by selling at a special price is an example of incentive alignment. Retail distributors may benefit from these lower prices by selling a higher volume. Various logistical incentives, such as the use of appropriate packaging and labeling, are linked to the demand chain and hence cannot be provided to the various actors farther downstream [5].
The restrictive measures that were enforced in Greece led to a significant decrease in sales volume in the month of March, which ultimately resulted in a decrease that was in the high single-digit percentage range for the quarter. In spite of these challenges, the company’s market share increased in both the category of carbonated soft drinks and the category of ready-to-drink nonalcoholic beverages [6].
Companies in the soft drink industry are searching for a backup plan as a means of coping COVID-19-related losses of income (upwards of 50% of expected turnover) owing to shuttered restaurants and cafés [7].
Experts around the world expect that, in 2022, businesses should “catch up” to the profits achieved in 2019. From EUR 7.02 billion in the fiscal year 2019, analysts predict that a company’s sales would drop to EUR 6.2 billion or EUR 6.6 billion in the best-case scenario. According to the projections of industry analysts, that theoretical firm would resume its trend of organic growth in sales per box over the next year and demonstrate growth of 5% in 2021 [7].

1.2. Problem Statement

With the rising demand for soft drinks globally, beverage producers and distributors are being urged to develop distribution systems that are highly responsive to consumer needs [8]. Collaborative communication, which entails a high degree of coordination and collaboration between soft drink producers and distributors in the sector, may increase consumer needs. According to Kempa, Tanuwijaya, and Tarigan (2020), most partnerships in logistical demand chains occur between manufacturing companies and suppliers rather than between producers and consumers. Soft drink producers in Europe engage in vertical cooperation at arms’ length downstream, with information exchange, decision synchronization, and incentive alignment all being neglected [9]. The quality of the industry’s physical distribution services has suffered as a result of this development. The majority of beverage company consumers in Europe continue to complain about long lead times and inconsistent delivery [5]. Due to erroneous forecasts based on inadequate consumer demand data, leading soft drink companies in Greece are facing delivery inefficiencies in the downstream chain. There is a strong case for evaluating the impact of cooperative communication on beverage distribution service quality, as this shows.

1.3. Objectives of the Study

  • To explore the effect of information sharing on the quality of the physical distribution of beverages;
  • To establish the relationship between decision synchronization and the quality of the physical distribution of beverages;
  • To determine the effect of incentive alignment on the quality of the physical distribution of beverages.
Research questions:
  • What is the effect of information sharing on the quality of the physical distribution of beverages?
  • What is the relationship between decision synchronization and the quality of the physical distribution of beverages?
  • What is the effect of incentive alignment on the quality of the physical distribution of beverages?

1.4. Significance of the Study

The study findings will significantly contribute to the available literature about collaborative communication and its influence on the quality of physical distribution, most especially in the soft drinks/beverage industry.
The research findings will also shed light on the importance of sharing information, synchronizing decisions, and aligning incentives in improving Physical Distribution Service Quality (PDSQ). Numerous manufacturing companies have the opportunity to enhance their physical distribution services by making use of this information.

2. Literature Review

2.1. Theoretical Review

The study was based on Ijadi et al.’s 2019 service quality (SERVQUAL) model, which states that service quality has five dimensions: reliability, tangibility, responsiveness, empathy, and assurance [10]. Reliability examines whether a promised service is delivered correctly; tangibility examines the appearance of personnel, physical facilities, and tools used to provide a service; responsiveness looks at the willingness to assist quickly, immediately responding to requests, and solving problems. Empathy examines the firm’s care and personalized attention to it. The primary goal of concentrating on quality is to satisfy customer requirements while staying economically competitive; thus, service quality assesses how effectively services match customer expectations. The SERVIQUAL model is essential to the research since it offers service quality as a significant dependent variable. The model recommends that partners’ internal and outsourced service quality be assessed regarding tangibility, responsiveness, empathy, and assurance while providing logistical services to contracting parties. As a result, the service quality model recommends that the following characteristics be used to evaluate the impact of different logistical management elements on service quality. For example, Ravichandran et al. (2010) discovered a connection between the model’s “responsiveness” dimension and the delivery of the appropriate quantity of a product, at the right time and location, in the proper condition, with the correct information [11].
The quality of services provided and customer satisfaction are inextricably linked [10]. Their relationship is mainly due to the way the service is produced, the consumption by the customers of the service provided, and, finally, their evaluation [10,12]. Today, entrepreneurs certainly focus on the price of the service or product provided, but they certainly do not neglect the many other factors associated with providing a good service or product [13,14,15].
One of the important factors in customer satisfaction is the quality of the services provided [16,17,18]. This has been proven in online store repair centers [19], in touch points of banking services [20], in higher education institutions [21,22], in small retailers [23], in restaurant services and the hospitality industry in general [24,25], and for retail chain transformation [26]. It also applies in healthcare [27,28] and hospitals [29], library services [30], at airports [31], and in many other areas where a systematic evaluation study of the quality of services is applied.
The SERVQUAL model is a way of measuring the quality of services provided, which is still used in many applications and areas related to service quality [10].
Parasuraman, Zeithaml, and Berry (1985) proposed the original model containing 10 aspects of service quality (including five dimensions of service quality): materials, reliability, responsiveness, assurance, empathy, tangibility, reliability, responsiveness, assurance, and empathy [10,32,33]. As expected, the SERVQUAL model has evolved over the years and has been adapted accordingly in various fields, given different names such as ARTQUAL, SNSQUAL, SERVPERF, SERVQUAL with MADM approaches, etc. [10].
Related research was performed by Gouws and Motala (2019) on the quality of the service provided to customers in the South African hospitality industry [34], and by Mathong et al. (2020), evaluating the quality of services for third party logistics providers in the beverage industry [13]. However, according to the relevant literature, SERVQUAL has not been implemented in the soft drinks sector. The market for soft drinks keeps expanding and makes a substantial contribution to the economies of both the USA and the rest of the world [35]. This paper develops a SERVQUAL-based service quality assessment tool appropriate for the soft drinks sector and explores the importance of different service dimensions that affect customer satisfaction.
Greek scientists have conducted a huge amount of research on soft drinks, much of which focuses on technical production difficulties with kefir [36,37], the recycling of fruit juice waste [38], or the enhancement and recovery of polyphenols from plant species [39,40,41]. An association between soft drinks and human health is possible, according to the literature [42,43,44,45], which mentions drinks that are thought to help with particular ailments [46,47,48]. Studies on soft drinks tend to look at particular age ranges [46,49,50,51,52] or have results classified by gender [43,53].

2.2. Empirical Review

2.2.1. Physical Distribution

Due to globalization, businesses must now compete as supply chains instead of as separate entities if they want to outperform their competitors. This may be done by boosting the PDSQ of their goods by offering excellent customer service and lowering the cost of logistics at the same time [54]. Vertical partnership with shipping and other transportation businesses is an extra technique that manufacturers and distributors use. These collaborations allow for rapid information exchange, decision synchronization, and incentive alignment, all of which are intended to improve the quality of physical distribution and thereby strengthen manufacturers’ and distributors’ positions as competitors in global markets [55]. Communication that is collaborative takes place between two or more organizations that are working together to accomplish goals that each company could not accomplish on its own. The members benefit from an increased market share, decreased operational expenses, and reliable and on-time product delivery to customers as a result of the sharing of information, synchronization of decisions, and alignment of incentives. The timely and orderly movement of products from the point at which an order is received to the point at which it is delivered to a customer is referred to as “physical distribution”. To ensure the timely and dependable availability of goods, it is necessary to optimize logistical processes including production planning and demand forecasting, management of information, scheduling and monitoring, transport, order fulfillment, material control, and warehousing. This is a necessity in order to meet customer expectations [54].

2.2.2. Collaborative Communication

The original definition of collaborative communication included information exchange, decision-making coordination, and incentive alignment. These were taken into consideration while constructing the several research hypotheses created for the study, as shown in Figure 1. The red arrow indicates that physical distribution service quality starts with collaborative communication, while the orange arrow indicates that the relationship is two-way.

2.2.3. Information Sharing

Information sharing is the starting point for demand chain collaboration arrangements [2]. It entails communicating with other demand chain participants about point of sale (POS) data, demand estimates, inventory levels, delivery schedules, inventory costs, and order fulfillment in a timely, accurate, and pertinent way. It also comprises sharing any additional essential information in order to assist decision makers with saving time and money while upgrading the PDS.
Manufacturers and distributors can work together to optimize logistical processes including demand forecasting, delivery scheduling, and inventory management, enabling the creation of a timely and dependable system for the physical distribution of soft drinks to consumers [56]. In order to achieve the objective of enhancing the overall performance of the physical distribution system downstream, CPFR calls for the dissemination of accurate information as well as the integration of logistical operations, with the aid of communication technologies where necessary. With the help of senior management, this is possible. Although research has indicated that commitment, trust, and data communications technology are necessary for efficient collaborative planning, this study purposely postpones an analysis of these elements until further research has been conducted to enhance PDSQ [57].
Further disclosures show that sharing inventory data prevents information asymmetry, reducing the bullwhip effect in physical distribution, including excess inventory-related expenses, sluggish reactions, and lost profit by demand chain participants [58]. By eliminating the bullwhip effect via real-time data interchange, the PDSQ would be enhanced by increased confidence in production planning and distribution, as well as more precise sales forecasting, order processing, and inventory rationing. From the material referenced above, the first hypothesis is as follows:
H1: 
Information sharing has a positive effect on the quality of the physical distribution of beverages.

2.2.4. Decision Synchronization

The term “decision synchronization” refers to the act of making collaborative decisions at the planning stage as well as subsequent stages or contexts of operation. The operational level is more important for the purpose of this study because of its influence on routine logistical tasks such as order, as well as delivery processes, shipment schedules, and stock control, among other things, which are all responsible for reducing the total delivery time and improving PDSQ in the beverage industry [1]. Although other factors play an important role, the operational level is most important.
According to Naspetti et al. (2011), the design methods for the various logistical activities in the demand chain should be linked in order to promote collaborative decision making and enhance the efficiency of production scheduling, order pickup and processing, product delivery, and distribution [59]. Wetzel and Hofmann (2020) created a consistent cycle time for a variety of retail orders by arranging production planning, procurement, and delivery lot sizes by a single supplier and manufacturer. They made the discovery that combining logistical operations such as production planning, inventory management, and procurement resulted in the same delivery cycle times for different merchants. The selection of product families that have comparable processing requirements for production reconfiguration and layout design, on the other hand, may be aided by manufacturers and distributors by identifying group technologies. This is performed in order to facilitate production reconfiguration and layout design. It is vital to synchronize the options in order to combine the adaptability of the process design with the flow of the order tracking strategy while using the cellular manufacturing strategy. This results in operations that are waste-free, have high throughput, shorten the lead time, and increase the PDSQ [2].
According to Pooe and Mahlangu (2017), in order to create a productive joint decision-making process and reduce the attraction of non-value-added tasks such as memo writing, data entry, and prolonged response times in production scheduling, procurement, and order processes, which can all have a negative effect on the PDSQ [3,4], manufacturers and distributors need to exchange information through electronic coordination. We should count ourselves fortunate that there are information systems such as the Distributed Decision Support System (DDSS). It is now possible to incorporate them into the information technology architecture of entity intranets in order to analyze data and communicate results to decision makers in the demand chain in a matter of milliseconds. The second working hypothesis that we developed is as follows, taking into account the research that came before it:
H2: 
Decision synchronization has a positive relationship with the quality of the physical distribution of beverages.

2.2.5. Incentive Alignment

The extent to which demand chain players share costs, dangers, and benefits was assessed via cooperative agreements. For the purposes of this study, benefits included any logistical incentives that enhance efficiency in terms of product transit, processing, storage, and distribution between manufacturers and distributors and lower lead times, inventory prices, order processing speed, and accuracy [56].
Since chain members start out as independent entities with individual aims before forming demand chains, it has proven difficult to align individual entity interests that the demand chain cannot meet [60]. Therefore, in order to serve their own interests, these corporations often hide crucial information such as inventory levels, manufacturing prices, and demand projections. Individuals in the demand chain may make poor decisions as a result of an unbalanced information flow, which might have been prevented and resulted in undesirable outcomes such as the bullwhip effect and subpar distribution system performance [1,56].
In order to eliminate information asymmetry and help align incentives for all parties to achieve the ultimate goal of enhancing the timeliness and reliability of the physical distribution system, Van der Vorst et al. claim that a high degree of dependency among demand chain participants is necessary [61]. In order to avoid incentive misalignment and, as a consequence, foster motivation toward the common objective of enhancing the PDSQ, they advise that conflicting interests and information be carefully reviewed. We developed a third hypothesis as follows from the material mentioned above:
H3: 
Incentive alignment improves the quality of physical distribution of beverages.

2.3. Conclusion and Research Gap

According to Igwe, Robert, and Chukwu (2016), collaboration and communication can help reduce demand uncertainty, improve delivery cycle time, and boost the overall performance of a physical distribution system [1]. This can be accomplished by concentrating on specific logistical practices such as inventory management, production and scheduling, and order processing, for example. By concentrating on certain logistical best practices, it will be possible to obtain these advantages. This may be achieved by concentrating on certain logistical practices such as production and scheduling, order processing, and inventory management. However, the customer service that is included in any specific demand chain’s physical distribution system needs to be given higher priority than the total expenses associated with logistics. The vertical partnerships that are a part of physical distribution alliances need to place more of a focus on customer satisfaction than on cost reduction.
In a demand chain with numerous decision-making authorities and aligned interests, Baihaqi and Sohal (2013) found that sharing information leads to higher PDSQ as a consequence of greater transparency [60]. This was the case in a demand chain where sharing information led to higher PDSQ. The individuals who are a part of the chain are accountable for selecting a coordination structure based on the coordinated making of decisions and an efficient information structure. Since organizations begin with a variety of goals in mind when they incorporate and can only align those goals to a limited degree, aligning incentives will encourage chain members to cooperate with one another. This is because organizations can only align their goals to a limited degree. However, this will not be sufficient to fulfill the conditions that have been specified by the entities as a whole. As a consequence, it is suggested that contractual agreements be used to establish the conditions and circumstances that will either permit chain members to share information, coordinate actions, and align incentives in order to improve the PDSQ as a whole, or prevent them from doing so. This is done in order to enhance the PDSQ as a whole.

3. Methodology

3.1. Research Design, Study Area, Target Population, and Data Collection

This study adopted a cross-sectional research design, which was essential for obtaining a deeper understanding of the relationship between collaborative communication and the physical distribution of beverages as per the study participants’ responses. The researcher used a cross-sectional study due to time limitations. The researcher targeted different manufacturers of soft drinks in Greece.
This research included a sample size of 200 participants from 1150 various drinks production facilities located around Greece. Simple random sampling was used to obtain a representative sample from the beverage manufacturing plants in Greece. Simple random sampling is a kind of probability sampling in which a sample is chosen at random from a specified defined demographic using a Google form that has a participation cap of 200 people. Each person in the population has the same likelihood of being chosen. A self-administered survey questionnaire was used to collect data from the study participants. On a 5-point Likert scale, participants show their degree of agreement: strongly disagree, disagree, neutral, agree, or strongly agree. Questions were designed in a way that helps establish the opinions, perceptions, and knowledge of the top staff of the selected beverage manufacturing companies concerning the effect of collaborative communication on the quality of the physical distribution of beverages [62].
The research used a primary sample of 200 study participants from different drinks manufacturing plants around Greece. The research was conducted between 21 March and 14 April 2022. In 2021, the total number of staff members employed by soft drinks manufacturing plants around Greece was 9564 [35]. After evaluating the dependability of the research (P = 99.7%) and accuracy (km 38.95), the sample size was chosen. S2 = 1517.41 and s = 38.95 were calculated using a preliminary sample (or pilot sample) of 50 people to determine the variance in the daily distance they travel by vehicle, bus, or train, entirely for work and business. The degree of dependability (P) required determines the value of z; when utilizing the sample size calculation, a value of z = 3 is often utilized, which equates to a level of dependability P = 99.7%. Equation (1) calculates that the minimal sample size should be 200.10, i.e., 200 people, using our values N = 9564, s = 38.95, z = 3, and d = 8.17 (the needed precision, d, is selected arbitrarily and represents half the confidence interval) [63,64,65]:
n = N ( z s ) 2 N d 2 + ( z s ) 2
Calculation of the minimum sample of respondents was performed as follows:
n = 9564   ( 3 × 38.95 ) 2 9564 × 8.17 2 + ( 3 × 38.95 ) 2 n = 200.10

3.2. Data Analysis

Data analysis was performed using SPSS version 23 (Statistical Package for the Social Sciences), an IBM Statistics at three levels of analysis: univariate, bivariate, and multivariate. At the univariate level, frequencies and percentages were utilized to interpret the study participants’ demographic variables. The Pearson’s rank correlation coefficient was used at a bivariate level to establish the association between the different study variables at a 5% (0.05) level of significance. At a multivariate level, multiple regression analysis was used to validate the level at which the strength of the dependent variable may be predicted by the level at which the independent variables operate. Equation (2) provides an explanation of the multiple regression models used in this research project:
Υ = β0 + β1Χ1 + β2Χ2 + β3Χ3 + ε,
where:
  • Y = Physical distribution service quality;
  • β0 = constant (coefficient of intercept);
  • Χ1 = Information Sharing;
  • Χ2 = Decision Synchronization;
  • Χ3 = Incentive Alignment;
  • ε = Represents the error term in the multiple regression model.
β1…β3 = is the regression coefficient for the various facets of collaborative communication, which assisted in establishing the level of influence that the independent variables (information sharing, decision synchronization, and incentive alignment) had on the dependent variable (physical distribution service quality) in manufacturing companies that produce soft drinks. In the present research, autocorrelation was not taken into account, and hence, the error term was calculated based on the presumption that there was no autocorrelation. The different study hypotheses were tested at the 5% (0.05) level of significance, and the rejection and acceptance of the null hypotheses were based on the decision rule that, if p < 0.05, then the null hypothesis is accepted and, if p > 0.05, then the null hypothesis is rejected.

3.3. Ethical Considerations

Different ethical requirements were considered to ensure that the study is highly reliable and free from any harm. First and foremost, informed consent was obtained from the various study participants, and they were assured of privacy and the confidentiality of their responses. Participation in the study was voluntary; hence, participants had the freedom to offer their opinions without bias.

4. Results

This section presents and interprets results on collaborative communication and physical distribution service quality in beverage manufacturing companies.

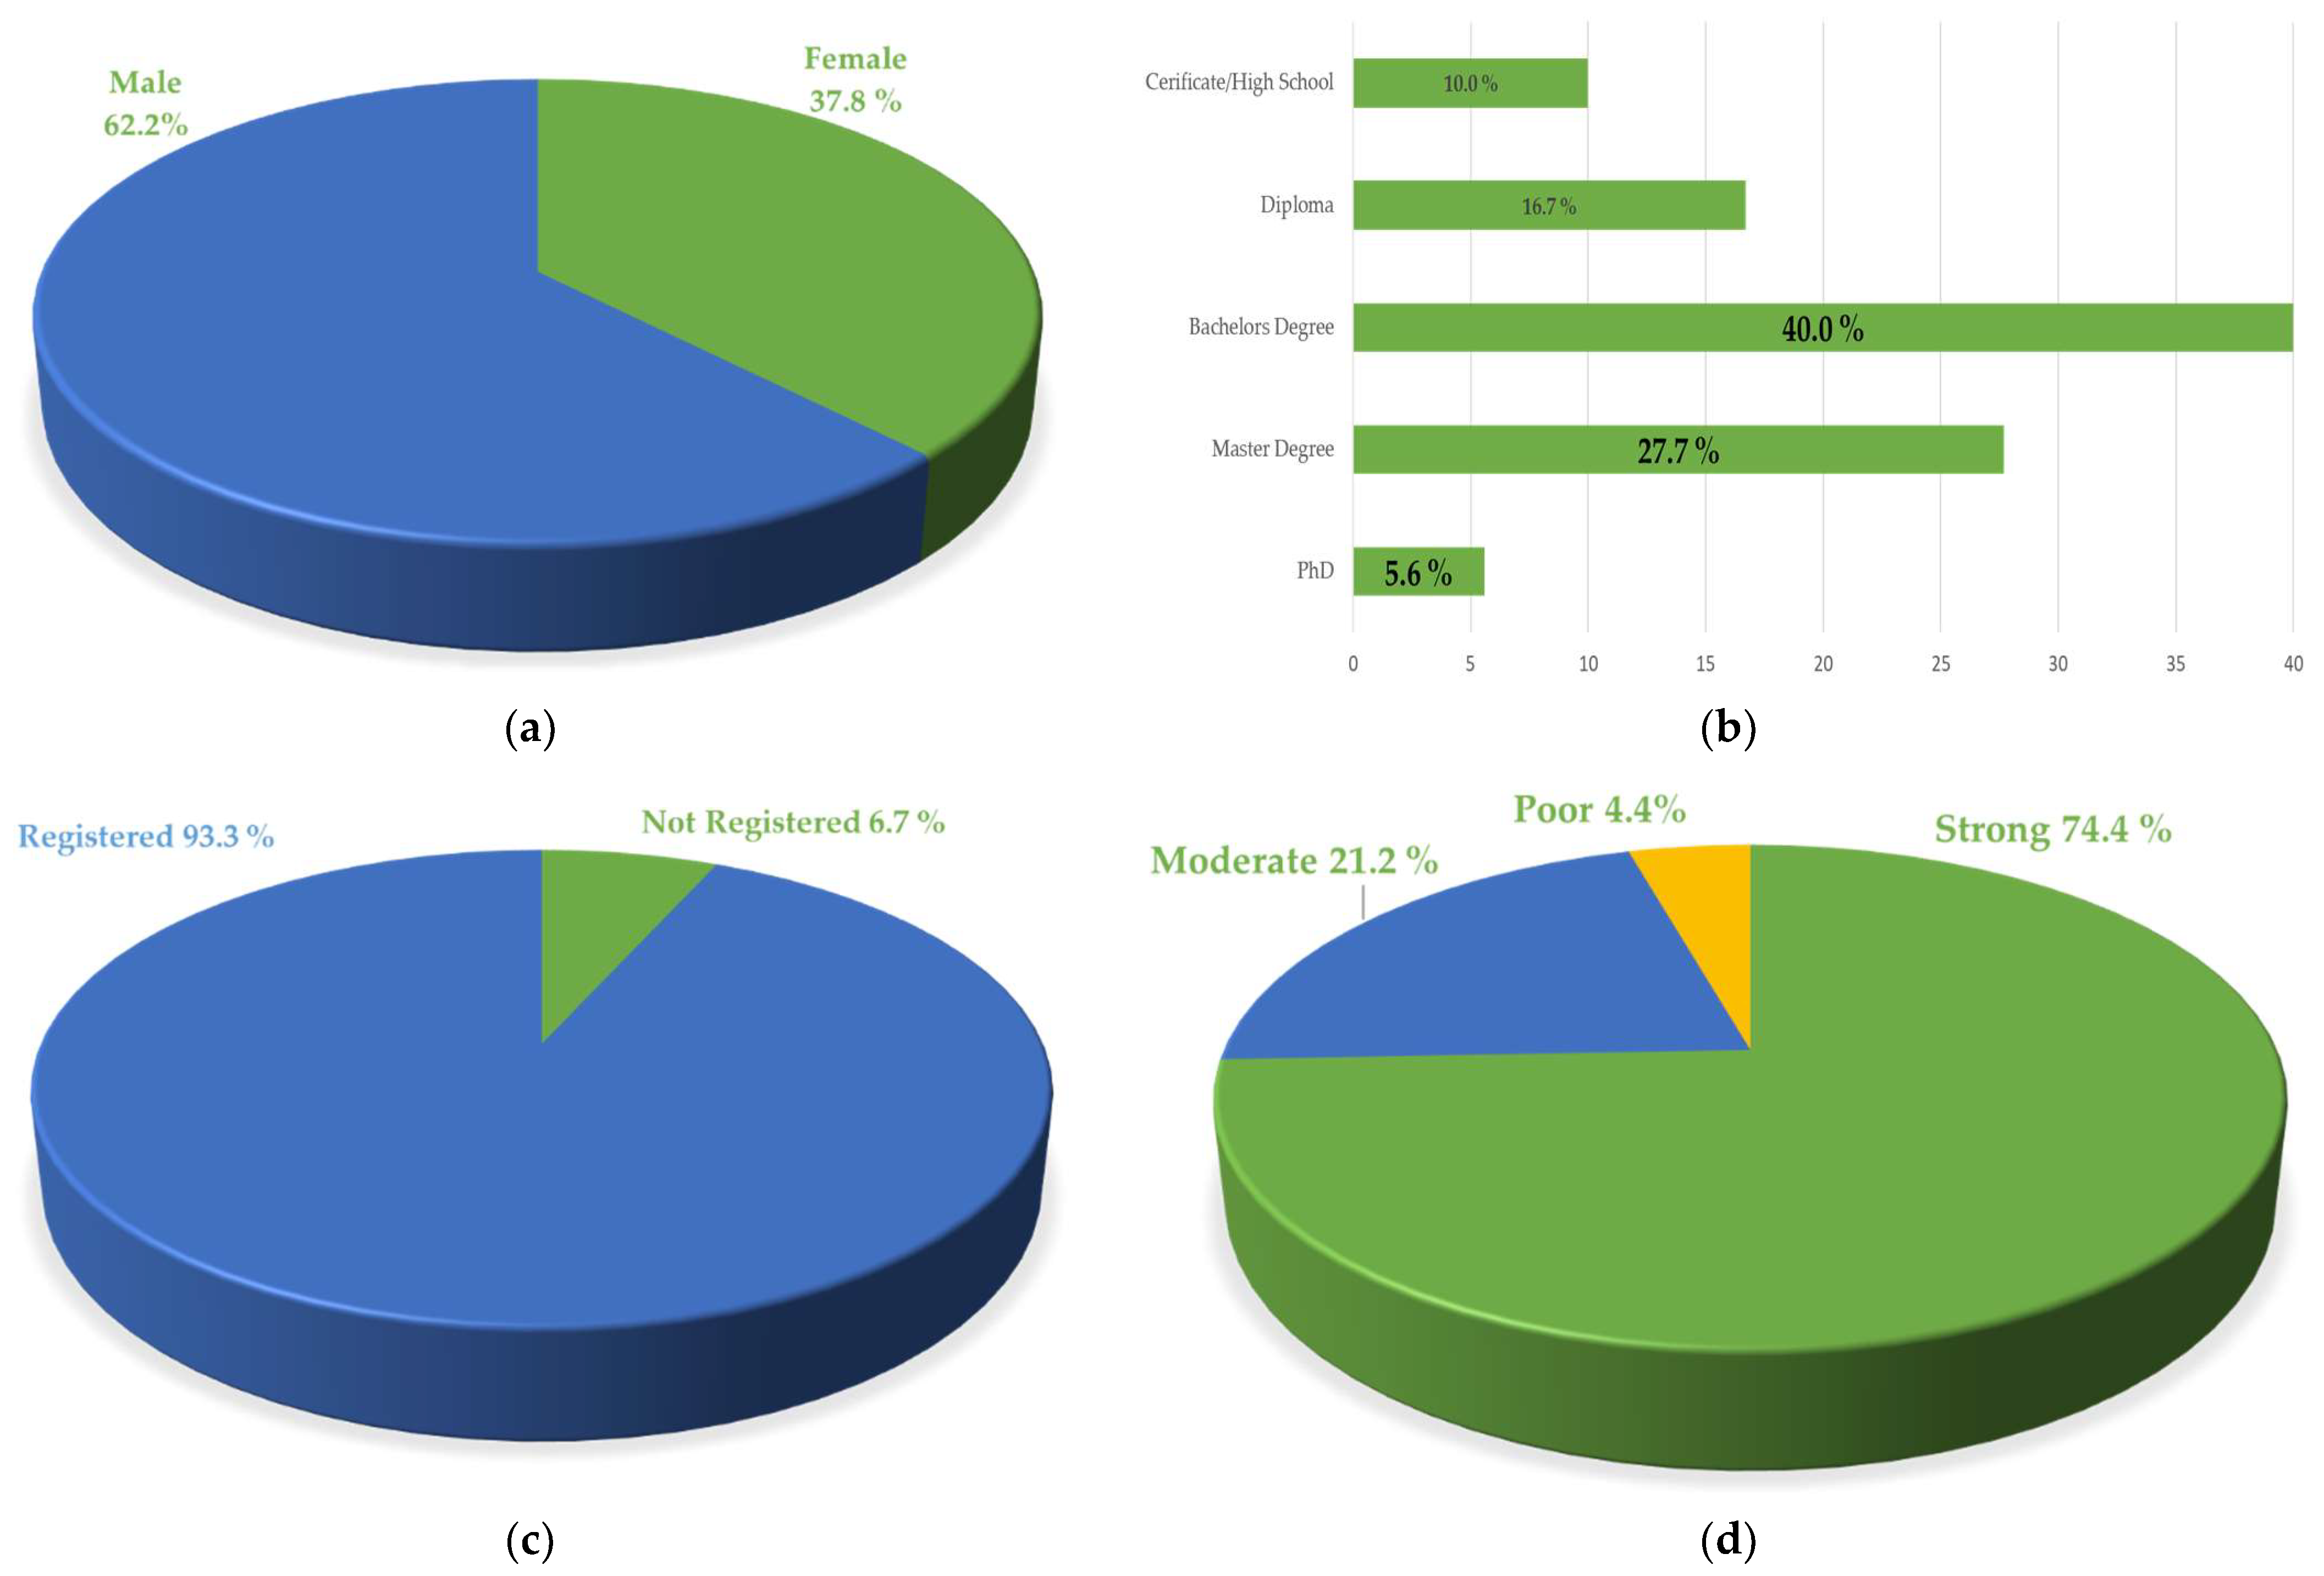
4.1. Demographic Characteristics

The results on gender, educational level, registration status, relationship with distribution, and number of employees at the manufacturing company are presented in Figure 2.
The majority of respondents (62.2%) were male; only 37.8% were female (Figure 2a). The majority of participants (40.0%) had a bachelor’s degree; 27.7% had a Master’s degree, 16.7% had a diploma, and only 5.6% had a Ph.D. (Figure 2b). Almost all of the manufacturing companies (93.3%) were registered; only 6.7% were not registered (Figure 2c). More than half of participants (74.4%) had a strong relationship with the distributor; only 4.4% had poor relationships with distributors (Figure 2d). The majority of manufacturing firms (41.1%) had over 60 employees, 34.4% had 41–60 employees, and 5.6% had 1–20 employees (Figure 2e).

4.2. Descriptive Analysis

The results in Table 1 (first part) indicate that most respondents (61.2%) strongly agreed that the distributor is well informed about the different items on sale; only 1.2% strongly disagreed. The majority of respondents also strongly agreed (62.9%) that price modifications for specific items are communicated to distributors. In addition, more than half of the respondents (55.6%) strongly agreed that every distributor in the distribution chain receives data from the point of sale; only 10.3% disagreed. Additionally, the majority of respondents (73.5%) agreed that, for the expected products to be distributed, there is an aggregate demand projection. This is a clear indication that beverage manufacturing companies are always informed about the extent of demand for the different soft drinks before any production.
However, most respondents (69.2%) disagreed that the distributor is open to providing sensitive information about on-hand inventory levels. This indicates that, despite the relevance of vertical communication, most distributors are wary of sharing sensitive information with their customers.
The results concerning decision synchronization and physical distribution in soft drinks manufacturing plants are presented in Table 1 (second part).
Most respondents (46.2%) disagreed that promotional activities are planned in collaboration with the distributor; only 6.8% agreed. Concerning whether the price policy is agreed upon with the distributor, most participants (47.0%) disagreed, while only 4.6% agreed. The majority of respondents (53.3%) also agreed that demand predictions are resolved with the distributor; only 6.2% disagreed. More than half of the participants (61.6%) strongly agreed that there is an agreement with the distributor about the order processing time; only 1.9% strongly disagreed. This indicates that most manufacturers communicate with potential distributors concerning orders for different soft drinks.
Moreover, the results concerning incentive alignment regarding physical distribution in beverage manufacturing plants are presented in Table 2 (first part). The results reveal that most respondents (36.8%) agreed that different subsidies are given to distributors in the form of reduced retail prices; only 9.4% disagreed. Concerning whether there are shared savings associated with reduced inventory costs, the majority of participants (61.5%) agreed; only 6.5% disagreed. Regarding whether distributors are always willing to share risks with a manufacturer, the majority of participants (47.7%) disagreed; only 16.2% agreed. Finally, 37.5% of soft drinks manufacturers agreed that they are involved in coordinated investments with some distributors, whereas 24.3% disagreed.
The results concerning the dependent variable (physical distribution) are presented in Table 2 (second part). The results indicate that the majority of respondents (46.2%) disagreed that promotional activities are planned in collaboration with the distributor, and only 6.8% agreed. Concerning whether the price policy is discussed and agreed upon with the distributor, the majority of participants (47.0%) disagreed; only 4.6% agreed. The majority of respondents (53.3%) also agreed that demand predictions are resolved with the distributor; only 6.2% disagreed. More than half of the participants (61.6%) strongly agreed that there is an agreement with the distributor on order processing time; only 1.9% strongly disagreed. This indicates that most manufacturers communicate with potential distributors concerning orders for different soft drinks.

4.3. Correlation Analysis

A correlation analysis was performed to establish the relationship between collaborative communication and physical distribution in beverage manufacturing plants. The results are given in Table 3.
The analysis of the results indicates a positive correlation between information sharing and physical distribution service quality (r = 0.517), which was significant at 0.05. This shows that accurate and timely dissemination of important information improves the physical distribution of beverages. There was a positive correlation between decision synchronization and physical distribution service quality (r = 0.905), which was significant at 0.05. This meant that the collaborative decision-making process in distribution planning and other associated operational activities positively impacted the quality of physical distribution for beverages. Incentive alignment had a positive correlation with physical distribution service quality (r = 0.846) at a 0.05 level of significance (p < 0.05), showing that the degree to which different soft drink demand chain members share the costs or benefits of collaborative communication influences the quality of the physical distribution of soft drinks or beverages.

4.4. Diagnostic Test for Autocorrelation

In Table 4, the diagnostic test for the assumption of no autocorrelation was the Durbin–Watson test, which gave a value of 1.862. The value of d always lies between 0 and 4, where 0 indicates autocorrelation while above 1 indicates that the residuals are interdependent. The result from the study was 1.172, which indicates that the residuals are not autocorrelated; hence, the assumption is consistent with the estimation results.

4.5. Results of Regression Analysis

Based on various predicted values, a regression analysis was performed to assess the extent to which the independent variables (information sharing, decision synchronization, and incentive alignment) aid in improving the quality of physical distribution. There was a positive multiple correlation coefficient (R) with a value of 0.913, which meant that the three independent variables were positively correlated with the quality of physical distribution. Additionally, the value of R-Squared confirmed that the three independent variables bring about an 89.4% change in the quality of the physical distribution. Additionally, the value of R-Squared in Table 5 confirmed that the three independent variables bring about an 89.4% change in the quality of the physical distribution.
In Table 6, the results for one-way ANOVA was performed to determine if the linear regression model matched the data well or whether the three independent variables were excellent predictors of the dependent variable. Since F(3, 197) = 241.105, p < 0.05, the model was deemed a satisfactory match for the data.
In Table 7, the unstandardized coefficients of the model were examined to determine the effect of Information Sharing, Decision Synchronization, and Incentive Alignment on physical distribution service quality. The coefficient of intercept 0.892 indicates that physical distribution service quality would change by 89.2% if the different aspects of Information Sharing, Decision Synchronization, and Incentive Alignment were utilized effectively. The beta coefficient of integrated planning was 0.397, indicating that a unit change in Information Sharing would lead to a 39.7% change in physical distribution service quality. Similarly, the beta coefficient of Decision Synchronization was 0.213, implying that a unit change in Decision Synchronization would lead to a 21.3% change in physical distribution service quality. Finally, a unit change in Incentive Alignment would lead to a 28.2% change in physical distribution service quality.
The beta coefficient (β1) was 0.397; the p-value (0.003) was less than the significance level (0.05). We therefore accepted Hypothesis 1 (information sharing positively affects the quality of physical distribution of beverages). The beta coefficient (β2) was 0.213; the p-value (0.021) was more significant than the significance level (0.05). We, therefore, accepted Hypothesis 2 (decision synchronization has a positive relationship with beverages’ quality of physical distribution). However, decision synchronization did not significantly predict physical distribution service quality. The beta coefficient (β3) was 0.137, and the variable was significant at the p-value (0.002), indicating a substantial relationship between incentive alignment and physical distribution service quality. We, therefore, accepted Hypothesis 3 (incentive alignment improves the quality of the physical distribution of beverages).

5. Discussion

This study supports the idea that information sharing, incentive alignment, and decision synchronization methods have a significant influence on the service quality of physical distribution. This finding is consistent with Azizi and Tarhandeh’s (2014) research on collaborative supply chain practices and beverage production performance, which found that “collaborative methods of information sharing, incentive alignment, and joint-decision making do not equally enhance physical distribution services” [54]. Boyce (2014) asserts that only environments with high-quality information have a major impact on operational performance when it comes to information sharing, incentive alignment, and collaborative decision making [56].
Our results on the significance of incentive alignment are consistent with those of academics who have shown incentive alignment to be a significant predictor of performance, including Igwe, Robert, and Chukwu (2016) [1]. According to Kempa, Tanuwijaya, and Tarigan (2020), equitable distribution of incentives and risks along the demand chain promotes physical distribution because participants are motivated to work so they can benefit from the favorable results [9]. Some authors, such as Wetzel and Hofmann (2020) and Ibn El Farouk et al. (2020), contend that sharing knowledge improves performance; others, like Igwe, Robert, and Chukwu (2016), argue that this is only true if the knowledge is of a high quality, is strategic in nature, and is supported by information systems [1,2,5].
We concur with Ibn El Farouk et al. (2020), who stated that higher performance does not necessarily result from simultaneous decision making [5], in that our findings show that decision synchronization is not a significant predictor of physical distribution service quality. Decision synchronization did not predict SME supply chain performance, as Naspetti et al. (2011) found [59]. This conflicts with the findings of researchers such as Igwe, Robert, and Chukwu (2016) and Boyce (2014), who emphasized decision synchronization as a key component in improving demand chain performance [1,56]. Numerous variables might account for this outcome, which is specific to beverage demand chains in Europe.
In Greece, producers and distributors communicate in a limited way and mainly about order quantities, reorder points, and difficulties related to distribution. This communication is usually not supported by specific information exchange systems, while low-level technologies such as mobile phones and the Internet are used in a limited way, mainly for routine information exchanges [9]. However, distributors in soft drink demand chains are well aware of the benefits of increased sales and meeting certain targets when signing distribution agreements, both for the upstream stages of the chain and for themselves. For this reason, distributors work hard to achieve targets and increase sales, but in this case, the information provided is tactical rather than strategic and therefore not a reliable indicator of the quality of physical distribution services in soft drink demand chains.
Although the results of the research highlight the need for the participation of distributors in the decision-making processes of production organizations and vice versa, there are limitations in that must be overcome. These are largely related to the trust between producers and distributors and consequently to the levels of information exchange. Specifically:
  • A relatively high rate of unethical business activity is recorded in Greece, where employees and collaborators share confidential information with competing producers in order to be personally rewarded. This implies the possible leakage of important information between competing companies.
  • A significant number of soft drink distributors are not sole distributors, which means that they carry and distribute brands from different companies and are not in a position to consult all the businesses whose products they sell when making decisions. Since distributors offer competing brands and may be tempted to reveal sensitive information to competitors in exchange for better terms, manufacturers are wary about sharing information and collaborative communication.
  • Most of the time, distributors are informed about producers’ choices mainly for implementation reasons; the synchronizing of decisions is not critical to the Greek soft drinks industry. Distributors, for example, are required to follow the suggested retail price of a particular soft drink brand. The distributor may charge more than the listed retail price, but the products cannot be sold for less than that amount [1,3,4].

Recommendations and Proposals

According to the research results, collaborative communication PDSQ downstream is important, which is acknowledged by the makers of soft drinks. Therefore, it is advised that manufacturing facilities adopt the many components of collaborative communication, such as information exchange and incentive alignment.
In the case of Greece, in order to establish collaborative communication in the soft drinks and beverages industry, trust must first be built between manufacturers and distributors. This can be achieved through a series of actions that may include:
  • Establishing exclusive cooperation between producers and distributors;
  • Agreement for the signing of confidentiality agreements between producers and distributors, as well as joint drafting of plans for quality and operational procedures in information and distribution;
  • Adoption and training of personnel in modern means of communication and information;
  • Joint training of the personnel of the manufacturers and distributors in common operational matters.
Building trust can be a conduit for sharing information, aligning incentives, and synchronizing decisions in the beverage industry, with the ultimate goals of improved quality of processes and increased profits for all involved.

6. Conclusions

The findings of this study demonstrate how elements of cooperative communication, such as information sharing, coordinated decision making, and aligned incentives, improve the quality of physical distribution services in soft drink supply chains. When researching collaboration in supply chains, many scientists fail to specify whether they are focusing on vertical or horizontal cooperation. The quality of physical distribution services in the developing world was the main topic of our study, which focused on vertical cooperation between producers and distributors. According to the literature review, information sharing, incentive alignment, and decision synchronization improve the quality of physical distribution services in demand chains. Collaborative communication has received less attention than the quality of physical distribution infrastructures in less developed countries. Our model of information sharing, incentive alignment, and simultaneous decision making produced a significant impact even though it only explained 53.5% of the variation in physical distribution service quality. This may be a starting point for further investigation into vertical collaboration or the actual distribution of services in Greece and other nations in Europe. A key component of collaboration that influences the quality of physical distribution services is the alignment of incentives. Managers in the beverage sector and individuals in the demand chain now have the opportunity to devise improved strategies for aligning incentives as a result of its discovery.

6.1. Limitations

The issues with the study design and execution are mostly responsible for this work’s shortcomings. The COVID-19 pandemic has been a huge obstacle to all of our efforts. Although attempts were made to prevent bias, it is probable that it still exists. The respondents’ unwillingness to complete the questionnaires on time and completely should be taken into account as another restriction. In the future, a comparable investigation may investigate the opinions of a sample that encompasses a whole nation or area. Additionally, given that Western Macedonia is now going through a decarbonization period, there may be a direct relationship between technology, the University of Western Macedonia, and local and regional growth

6.2. Areas for Future Research

The degree to which different dimensions affect cooperation varies, so future research might examine why they change in various contexts.
The perceptions of producers and distributors regarding physical distribution service quality were examined in this research, but not the perceptions of final soft drink consumers. Future research should include final consumers’ opinions about the quality of physical distribution services.

Author Contributions

Conceptualization, S.K. and F.C.; methodology, S.K. and D.K.; software, D.K.; validation, F.C. and D.K.; formal analysis, S.K.; investigation, S.K. and D.K.; resources, S.K., F.C. and D.K.; data curation, F.C. and S.K.; writing—original draft preparation, S.K.; writing—review and editing, D.K.; visualization, F.C. and D.K.; supervision, F.C.; project administration, F.C. and S.K.; funding acquisition, F.C. and D.K. All authors have read and agreed to the published version of the manuscript.

Funding

This research received no external funding.

Institutional Review Board Statement

Not applicable.

Informed Consent Statement

Informed consent was obtained from all subjects involved in the study.

Data Availability Statement

Data are available on request.

Conflicts of Interest

The authors declare no conflict of interest.

References

  1. Igwe, S.R.; Robert, C.P.; Chukwu, G.C. Improving on-time delivery through supply chain collaboration: The experience of brewery firms in South-South, Nigeria. J. Asian Bus. Strateg. 2016, 6, 136–149. [Google Scholar] [CrossRef]
  2. Wetzel, P.; Hofmann, E. Toward a Multi-Sided Model of Service Quality for Logistics Service Providers. Adm. Sci. 2020, 10, 79. [Google Scholar] [CrossRef]
  3. Madzimure, J. Enhancing supplier integration through e-design and e-negotiation in small and medium enterprises. S. Afr. J. Entrep. Small Bus. Manag. 2020, 12, a300. [Google Scholar] [CrossRef]
  4. Madzimure, J. Examining the influence of supplier integration on supply chain performance in South African small and medium enterprises. S. Afr. J. Entrep. Small Bus. Manag. 2020, 12, a312. [Google Scholar] [CrossRef]
  5. Ibn El Farouk, I.; Moufad, I.; Frichi, Y.; Arif, J.; Jawab, F. Proposing a Supply Chain Collaboration Framework for Synchronous Flow Implementation in the Automotive Industry: A Moroccan Case Study. Information 2020, 11, 431. [Google Scholar] [CrossRef]
  6. Kontogeorgos, A.; Sergaki, P.; Chatzitheodoridis, F. An Assessment of New Farmers’ Perceptions about Agricultural Cooperatives. J. Dev. Entrep. 2017, 22, 1750003. [Google Scholar] [CrossRef]
  7. Chatzitheodoridis, F.; Kontogeorgos, A. Exploring of a Small-Scale Tourism Product under Economic Instability: The Case of a Greek Rural Border Area. Economies 2020, 8, 52. [Google Scholar] [CrossRef]
  8. Banomyong, R. Collaboration in Supply Chain Management: A Resilience Perspective; International Transport Forum Discussion Papers; OECD Publishing: Paris, France, 2018; Volume 6, pp. 10–18. [Google Scholar]
  9. Kempa, S.; Tanuwijaya, N.C.; Tarigan, Z.J.H. The Impact of Supply Chain Collaboration in Logistic Service for Small Medium Enterprise in East Java, Indonesia. KnE Life Sci. 2020, 5, 207–216. [Google Scholar] [CrossRef]
  10. Ijadi Maghsoodi, A.; Saghaei, A.; Hafezalkotob, A. Service quality measurement model integrating an extended SERVQUAL model and a hybrid decision support system. Eur. Res. Manag. Bus. Econ. 2019, 25, 151–164. [Google Scholar] [CrossRef]
  11. Ravichandran, K.; Tamil, M.; Arun Kumar, S.; Prabhakaran, S. Influence of service quality on customer satisfaction application of SERVQUAL model. Int. J. Bus. Manag. 2010, 5, 117–124. [Google Scholar] [CrossRef]
  12. Rezaei, J.; Kothadiya, O.; Tavasszy, L.; Kroesen, M. Quality assessment of airline baggage handling systems using SERVQUAL and BWM. Tour. Manag. 2018, 66, 85–93. [Google Scholar] [CrossRef]
  13. Mathong, P.; Sureeyatanapas, P.; Arunyanart, S.; Niyamosoth, T. The assessment of service quality for third-party logistics providers in the beverage industry. Cogent Eng. 2020, 7, 1785214. [Google Scholar] [CrossRef]
  14. Banomyong, R.; Supatn, N. Selecting logistics providers in Thailand: A shippers’ perspective. Eur. J. Mark. 2011, 45, 419–437. [Google Scholar] [CrossRef]
  15. Ramanathan, R.; Karpuzcu, H. Comparing perceived and expected service using an AHP model: An application to measure service quality of a company engaged in pharmaceutical distribution. OPSEARCH 2011, 48, 136–152. [Google Scholar] [CrossRef]
  16. Kahnali, R.A.; Esmaeili, A. An integration of SERVQUAL dimensions and logistics service quality indicators (A case study). Int. J. Serv. Oper. Manag. 2015, 21, 289–309. [Google Scholar] [CrossRef]
  17. Neo, H.-Y.; Xie, M.; Tsui, K.-L. Service quality analysis: Case study of a 3PL company. Int. J. Logist. Syst. Manag. 2004, 1, 64–80. [Google Scholar] [CrossRef]
  18. Parasuraman, A.; Zeithaml, V.A.; Berry, L.L. Alternative scales for measuring service quality: A comparative assessment based on psychometric and diagnostic criteria. J. Retail. 1994, 70, 201–230. [Google Scholar] [CrossRef]
  19. Cho, I.J.; Kim, Y.J.; Kwak, C. Application of SERVQUAL and fuzzy quality function deployment to service improvement in service centres of electronics companies. Total Qual. Manag. Bus. Excell. 2016, 27, 368–381. [Google Scholar] [CrossRef]
  20. Yadollahi, S.; Kazemi, A.; Ranjbarian, B. Identifying and prioritizing the factors of service experience in banks: A best-Worst method. Decis. Sci. Lett. 2018, 7, 455–464. [Google Scholar] [CrossRef]
  21. Lupo, T. A fuzzy ServQual based method for reliable measurements of education quality in Italian higher education area. Expert Syst. Appl. 2013, 40, 7096–7110. [Google Scholar] [CrossRef]
  22. Canciglieri Junior, O.; Zierhut, R.T.; Mattioda, R.A.; Estorilio, C.C.A.; Steiner, M.T.A.; Neto, P.J.S. Model for the diagnosis of quality in service processes: A case study applied to a private higher education institution. Cogent Eng. 2019, 6, 1702856. [Google Scholar] [CrossRef]
  23. Cuesta-Valiño, P.; Gutiérrez-Rodríguez, P.; García-Henche, B. Word of mouth and digitalization in small retailers: Tradition, authenticity, and change. Technol. Forecast. Soc. Change 2022, 175, 121382. [Google Scholar] [CrossRef]
  24. Pan, H.; Ha, H.-Y. Service Quality and Satisfaction in the Context of Varying Levels of Restaurant Image and Customer Orientation during the COVID-19 Pandemic. Sustainability 2021, 13, 9694. [Google Scholar] [CrossRef]
  25. Sirimongkol, T. The effects of restaurant service quality on revisit intention in pandemic conditions: An empirical study from Khonkaen, Thailand. J. Foodserv. Bus. Res. 2022, 25, 233–251. [Google Scholar] [CrossRef]
  26. Ogunjimi, A.; Rahman, M.; Islam, N.; Hasan, R. Smart mirror fashion technology for the retail chain transformation. Technol. Forecast. Soc. Chang. 2021, 173, 121118. [Google Scholar] [CrossRef]
  27. Sulphey, M.M.; Mohamed, J.K. Ascertaining service quality and medical practitioners’ sensitivity towards surgical instruments using SERVQUAL. Benchmarking 2021, 28, 370–405. [Google Scholar] [CrossRef]
  28. Júnior, D.S.G.; Soares, E.J.O.; de Oliveira, L.A.B.; de Medeiros, D.D. Determinants of Quality of Health Insurance Services in Brazil. J. Health Manag. 2021, 23, 401–413. [Google Scholar] [CrossRef]
  29. Akdag, H.; Kalaycı, T.; Karagöz, S.; Zülfikar, H.; Giz, D. The evaluation of hospital service quality by fuzzy MCDM. Appl. Soft Comput. 2014, 23, 239–248. [Google Scholar] [CrossRef]
  30. Kachwala, T.; Panchal, D.; Bali, A. The relationships among overall service quality, customer satisfaction and customer loyalty in library services. Int. J. Product. Qual. Manag. 2021, 33, 198–217. [Google Scholar] [CrossRef]
  31. Lupo, T. Fuzzy ServPerf model combined with ELECTRE III to comparatively evaluate service quality of international airports in Sicily. J. Air Transp. Manag. 2015, 42, 249–259. [Google Scholar] [CrossRef]
  32. Parasuraman, A.; Zeithaml, V.A.; Berry, L.L. A Conceptual Model of Service Quality and Its Implications for Future Research. J. Mark. 1985, 49, 41–50. [Google Scholar] [CrossRef]
  33. Pena, M.M.; da Silva, E.M.S.; Tronchin, D.M.R.; Melleiro, M.M. The use of the quality model of Parasuraman, Zeithaml and Berry in health services. Rev. Esc. Enferm. USP 2013, 47, 1227–1232. [Google Scholar] [CrossRef]
  34. Gouws, E.; Motala, T. Quality of service delivered by alcoholic beverage suppliers to customers in the South African hospitality industry. Afr. J. Hosp. Tour. Leis. 2019, 8, 1–13. [Google Scholar]
  35. Foundation for Economic & Industrial Research. Food and Beverages Industry. Facts & Figures 2021; IOBE: Athens, Greece, 2022. (In Greek) [Google Scholar]
  36. Ganatsios, V.; Nigam, P.; Plessas, S.; Terpou, A. Kefir as a Functional Beverage Gaining Momentum towards Its Health Promoting Attributes. Beverages 2021, 7, 48. [Google Scholar] [CrossRef]
  37. Syrokou, M.K.; Papadelli, M.; Ntaikou, I.; Paramithiotis, S.; Drosinos, E.H. Sugary Kefir: Microbial Identification and Biotechnological Properties. Beverages 2019, 5, 61. [Google Scholar] [CrossRef]
  38. Zerva, I.; Remmas, N.; Ntougias, S. Biocatalyst Potential of Cellulose-Degrading Microorganisms Isolated from Orange Juice Processing Waste. Beverages 2019, 5, 21. [Google Scholar] [CrossRef]
  39. Lakka, A.; Bozinou, E.; Stavropoulos, G.; Samanidis, I.; Athanasiadis, V.; Dourtoglou, V.G.; Makris, D.P.; Lalas, S.I. Enhancement of Polyphenols Recovery from Rosa canina, Calendula officinalis and Castanea sativa Using Pulsed Electric Field. Beverages 2021, 7, 63. [Google Scholar] [CrossRef]
  40. Pappas, V.M.; Lakka, A.; Palaiogiannis, D.; Bozinou, E.; Ntourtoglou, G.; Batra, G.; Athanasiadis, V.; Makris, D.P.; Dourtoglou, V.G.; Lalas, S.I. Use of Pulsed Electric Field as a Low-Temperature and High-Performance “Green” Extraction Technique for the Recovery of High Added Value Compounds from Olive Leaves. Beverages 2021, 7, 45. [Google Scholar] [CrossRef]
  41. Alibante, A.; Lakka, A.; Bozinou, E.; Chatzilazarou, A.; Lalas, S.; Makris, D.P. Integrated Green Process for the Extraction of Red Grape Pomace Antioxidant Polyphenols Using Ultrasound-Assisted Pretreatment and β-Cyclodextrin. Beverages 2021, 7, 59. [Google Scholar] [CrossRef]
  42. Ferretti, F.; Mariani, M.; Sarti, E. Does the Prevalence of Obesity Affect the Demand for Soft Drinks? Evidence from Cross-Country Panel Data. Int. J. Environ. Res. Public Health 2022, 19, 938. [Google Scholar] [CrossRef] [PubMed]
  43. Kim, J.-M.; Lee, E. Association between Soft-Drink Intake and Obesity, Depression, and Subjective Health Status of Male and Female Adults. Int. J. Environ. Res. Public Health 2021, 18, 10415. [Google Scholar] [CrossRef] [PubMed]
  44. Lieder, B.; Čonka, J.; Reiner, A.T.; Zabel, V.; Ameur, D.; Somoza, M.M.; Šebeková, K.; Celec, P.; Somoza, V. Long-Term Consumption of a Sugar-Sweetened Soft Drink in Combination with a Western-Type Diet Is Associated with Morphological and Molecular Changes of Taste Markers Independent of Body Weight Development in Mice. Nutrients 2022, 14, 594. [Google Scholar] [CrossRef] [PubMed]
  45. Liu, B.-P.; Jia, C.-X.; Li, S.-X. The Association of Soft Drink Consumption and the 24-Hour Movement Guidelines with Suicidality among Adolescents of the United States. Nutrients 2022, 14, 1870. [Google Scholar] [CrossRef] [PubMed]
  46. Ibrahim, A.A.; Qamar, B.; Fituri, S.; Akbar, Z.A.; Al-Abdi, T.; Shi, Z. Association between Soft Drink Consumption and Asthma among Qatari Adults. Nutrients 2019, 11, 606. [Google Scholar] [CrossRef] [PubMed]
  47. Lee, J.S.; Kim, T.J.; Hong, S.K.; Min, C.; Yoo, D.M.; Wee, J.H.; Choi, H.G. Impact of Coffee/Green Tea/Soft Drink Consumption on the Risk of Hyperuricemia: A Cross-Sectional Study. Int. J. Environ. Res. Public Health 2021, 18, 7299. [Google Scholar] [CrossRef] [PubMed]
  48. Crichton, G.; Alkerwi, A.; Elias, M. Diet Soft Drink Consumption is Associated with the Metabolic Syndrome: A Two Sample Comparison. Nutrients 2015, 7, 3569–3586. [Google Scholar] [CrossRef]
  49. Katzmarzyk, P.T.; Broyles, S.T.; Champagne, C.M.; Chaput, J.-P.; Fogelholm, M.; Hu, G.; Kuriyan, R.; Kurpad, A.; Lambert, E.V.; Maia, J.; et al. Relationship between Soft Drink Consumption and Obesity in 9–11 Years Old Children in a Multi-National Study. Nutrients 2016, 8, 770. [Google Scholar] [CrossRef]
  50. Pengpid, S.; Peltzer, K. High Carbonated Soft Drink Intake is Associated with Health Risk Behavior and Poor Mental Health among School-Going Adolescents in Six Southeast Asian Countries. Int. J. Environ. Res. Public Health 2020, 17, 132. [Google Scholar] [CrossRef]
  51. Shi, Z.; Malki, A.; Abdel-Salam, A.-S.G.; Liu, J.; Zayed, H. Association between Soft Drink Consumption and Aggressive Behaviour among a Quarter Million Adolescents from 64 Countries Based on the Global School-Based Student Health Survey (GSHS). Nutrients 2020, 12, 694. [Google Scholar] [CrossRef]
  52. Marro, F.; Bottenberg, P.; Jacquet, W.; Martens, L. School Food Policies Related to Soft Drink and Fruit Juice Consumption as a Function of Education Type in Flanders, Belgium. Int. J. Environ. Res. Public Health 2019, 16, 2718. [Google Scholar] [CrossRef] [PubMed]
  53. Campos-Ramírez, C.; Ramírez-Amaya, V.; Olalde-Mendoza, L.; Palacios-Delgado, J.; Anaya-Loyola, M.A. Soft Drink Consumption in Young Mexican Adults Is Associated with Higher Total Body Fat Percentage in Men but Not in Women. Foods 2020, 9, 1760. [Google Scholar] [CrossRef] [PubMed]
  54. Azizi, S.; Jamali Kapak, S.; Tarhandeh, F. Physical Distribution Service Quality through Iranian Convenience Stores Retailers Perspectives: A Mixed Method Approach. Iran. J. Manag. Stud. 2014, 7, 121–150. [Google Scholar]
  55. Ahimbisibwe, A.; Ssentamu, A.; Kalekyezi, B. Supplier delivery performance of public procurement contracts in ugandan central government procuring and disposing entities (pdes). Eur. J. Logist. Purch. Supply Chain Manag. 2019, 7, 12–39. [Google Scholar]
  56. Boyce, W.S. Supply Chain Relationships in Procurement: Is Collaboration Reality? Ph.D. Thesis, University of Missouri, St. Louis, MO, USA, 2014. [Google Scholar]
  57. Le, T.M.H.; Nguyen, T.H.; Quy, N.L.D. Upstream Supply Chain Collaboration (SCC): A Case Study in Danang City, Viet Nam. Acad. Strateg. Manag. J. 2021, 20, 1–10. [Google Scholar]
  58. Derek, F.; Tukamuhabwa, B.R.; Eyaa, S. The effect of trust and commitment on vertical collaboration and physical distribution service quality. Int. J. Bus. Behav. Sci. 2012, 2, 49–67. [Google Scholar]
  59. Naspetti, S.; Lampkin, N.; Nicolas, P.; Stolze, M.; Zanoli, R. Organic supply chain collaboration: A case study in eight EU countries. J. Food Prod. Mark. 2011, 17, 141–162. [Google Scholar] [CrossRef]
  60. Baihaqi, I.; Sohal, A.S. The impact of information sharing in supply chains on organisational performance: An empirical study. Prod. Plan. Control 2013, 24, 743–758. [Google Scholar] [CrossRef]
  61. Van der Vorst, J.G.A.J.; Da Silva, C.; Trienekens, J.H. Agro-Industrial Supply Chain Management: Concepts and Applications; FAO: Rome, Italy, 2008; p. 17. [Google Scholar]
  62. Kontogeorgos, A.; Chatzitheodoridis, F.; Loizou, E. Adaptation strategies for the greek agricultural cooperatives during the economic crisis. Agric. Econ. 2016, 62, 26–34. [Google Scholar] [CrossRef]
  63. Kalfas, D.; Zagkas, D.; Dragozi, E.; Zagkas, T. Estimating value of the ecosystem services in the urban and peri-urban green of a town Florina-Greece, using the CVM. Int. J. Sustain. Dev. World Ecol. 2020, 27, 310–321. [Google Scholar] [CrossRef]
  64. Kalfas, D.; Chatzitheodoridis, F.; Loizou, E.; Melfou, K. Willingness to Pay for Urban and Suburban Green. Sustainability 2022, 14, 2332. [Google Scholar] [CrossRef]
  65. Kalogiannidis, S.; Toska, E.; Chatzitheodoridis, F.; Kalfas, D. Using School Systems as a Hub for Risk and Disaster Management: A Case Study of Greece. Risks 2022, 10, 89. [Google Scholar] [CrossRef]
Figure 1. Conceptual framework.
Beverages 08 00047 g001
Figure 2. Demographic characteristics. Source: Authors’ own work (2022). (a) Gender of respondents. (b) Education of respondents. (c) Registration status of respondents. (d) Relationship with distributor. (e) Number of employees.
Beverages 08 00047 g002aBeverages 08 00047 g002b
Table 1. Information sharing and decision synchronization.
SDDUASA
%%%%%
1. Information Sharing
The distributor is well informed about the different items that are on sale.1.21.52.633.561.2
Price modifications for specific items are communicated to distributors.1.54.76.824.162.9
The distributor is open to providing sensitive information about on-hand inventory levels.23.969.24.30.91.7
Every distributor in the distribution chain receives data from the point of sale.10.311.74.218.255.6
For the expected products to be distributed, there is an aggregate demand projection.2.02.71.373.520.5
2. Decision Synchronization
Promotional activities are planned in collaboration with the distributor.33.346.23.46.810.2
The price policy is agreed upon with the distributor.26.547.017.14.62.8
Demand predictions are resolved together with the distributor.2.36.27.553.330.8
On order processing time, there is an agreement with the distributor.1.94.36.725.6 61.6
Key: SD = strongly disagree, D = disagree, U = undecided, A = agree, SA = strongly agree. Source: Authors’ own work (2022).
Table 2. Incentive alignment and physical distribution.
SDDUASA
%%%%%
1. Incentive Alignment
Different subsidies are given to distributors in the form of reduced retail prices. 2.69.426.536.824.8
There are shared savings associated with reduced costs of inventory.3.86.515.761.512.5
Distributors are always willing or ready to share risks with a manufacturer.22.647.720.516.23.1
We are engaged in several shared investments with distributors. 12.824.311.637.513.9
2. Physical distribution
Distributors are informed about the plant’s inventory levels.33.346.23.46.810.2
Sometimes we fail to meet orders of stock demands from our distributors.6.517.07.124.642.8
The processing of orders is done manually through signing documents and filling out certain forms.2.36.27.553.330.8
We deliver stock at the agreed time. 1.94.36.725.661.6
We always receive accurate information concerning order placement. 2.54.316.725.551.1
Key: SD = strongly disagree, D = disagree, U = undecided, A = agree, SA = strongly agree. Source: Authors’ own work (2022).
Table 3. Cross-tabulation of aspects of collaborative communication and independent physical distribution.
Information SharingDecision
Synchronization
Incentive AlignmentPhysical Distribution Service Quality
Information Sharing1
Decision Synchronization0.648 *1
0.00
Incentive Alignment0.551 *0.649 *1
0.020.000
Physical distribution service quality (dep.)0.517 *0.905 *0.846 *1
0.000.000.000.00
* indicates statistical significance at the 5% significance level.
Table 4. Model summary.
Model R R-Squared Adjusted R-Squared Std. Error of the Estimate Durbin–Watson
10.913 a 0.8940.7980.301911.172
a Predictors (Constant): Information Sharing, Decision Synchronization, and Incentive Alignment.
Table 5. Model summary.
Model R R-Squared Adjusted R-Squares Std. Error of the Estimate
10.913 a0.894 0.798 0.30191
a Predictors (Constant): Information Sharing, Decision Synchronization, and Incentive Alignment.
Table 6. ANOVA analysis.
Model Sum of Squares dfMean Square FSig.
1Regression31.240317.182241.1050.026 a
Residual3.1081970.046
Total61.178200
a Predictors (Constant): Information Sharing, Decision Synchronization, and Incentive Alignment.
Table 7. Regression coefficient.
ModelUnstandardized CoefficientsStandardized CoefficientstSig.
BStd. ErrorBeta
(Constant)0.3180.136 2.4380.026
Information sharing0.2180.0570.3973.7360.003
Decision synchronization0.2760.0670.2133.1950.021
Incentive alignment0.1720.0490.2823.5110.002
Dependent variable: Physical distribution service quality. Predictors: (Constant). Information sharing, Decision synchronization, Incentive alignment. Source: primary data (2022).
Publisher’s Note: MDPI stays neutral with regard to jurisdictional claims in published maps and institutional affiliations.

