Article

Effect of High-Pressure and Thermal Pasteurization on Microbial and Physico-Chemical Properties of Opuntia ficus-indica Juices

LAQV-REQUIMTE, Department of Chemistry, Campus Universitário de Santiago, University of Aveiro, 3810-193 Aveiro, Portugal
*
Author to whom correspondence should be addressed.
Beverages 2022, 8(4), 84; https://doi.org/10.3390/beverages8040084
Submission received: 5 October 2022 / Revised: 22 November 2022 / Accepted: 5 December 2022 / Published: 19 December 2022

Abstract

:
Opuntia fruits are recognized for their richness in nutrients and in bioactive compounds, being also highly appreciated by consumers as a juice. Nevertheless, without further processing, prickly pear juices have a short shelf-life, hampering their commercial use. In this work, thermal (TP) and high-pressure (HPP) pasteurization were applied to juices from Opuntia ficus-indica cultivars ‘Rossa’, ‘Gialla’, and ‘Bianca’ to understand the impact of those methods on the microbial safety, physico-chemical properties, and the nutritional content of the samples, over storage at 4 °C. In general, thermal pasteurization at 71.1 °C for 30 s increased the shelf-life by 22 days, and high-pressure pasteurization at 500 MPa for 10 min increased the shelf-life by 52 days with regard to microbial growth as well as maintenance of physical-chemical characteristics. The application of these two pasteurization methods delayed changes in the physico-chemical characteristics of the juices, with a more pronounced effect on the titratable acidity, °Brix and browning. For the same periods of time, the application of pasteurization methods decreased the variation in these quality parameters by around 75%. Similarly, these methods were shown to have the same effect on the polyphenolic concentration as well as the antioxidant activity of the juices. In particular, HPP was more efficient in preventing a decrease in °Brix and increase in titratable acidity, which normally negatively affect the flavor of the juices.

1. Introduction

The species Opuntia ficus-indica (L.) Mill was brought to Europe and then to Africa and Asia, exhibiting remarkable ease of adaptation to other climates [1] and, because of this, it was considered by the U.N.’s Food and Agriculture Organization (FAO) as one of the keys to ensure food security in the world’s most arid countries after a five-year biomass trial by the University of Nevada (USA) [2]. The rapid growth of prickly pear crop cultivation must necessarily be accompanied by effective strategies for the distribution of its commercial products. Currently, the major producing countries (Mexico and Italy) market the fresh fruit for consumption, while in other regions/countries such as in North Africa and Brazil, the main products produced are the seed oil and fruit and cladode fodder for animal feed, respectively [1]. On the other hand, it is now widely accepted that Opuntia fruits possess an enormous potential for transformation into added-value products and/or use as ingredients in functional foods, given their richness in nutritional and bioactive compounds, which include fibers, polyphenols, betalains, carotenoids, phytosterols and some key minerals such as magnesium, calcium, iron, potassium, sodium, and phosphorus. Moreover, these fruits have some well-known health benefits that include antioxidant, antiatherogenic, and antiulcerogenic properties, which can be attributed to the high antioxidant capacity and high content in polyphenols, betalains, vitamin C, etc. [3].
Cactus pear fruit has a juicy pulp (28–58% of fruit mass) with a considerable number of seeds (2–10%), enclosed with a thick peel (37–67%) [4]. In general, prickly pear fruits contain approximately 85% water, 15% sugars, 0.3% ash, and less than 1% protein. Previous studies showed that the sugar component is mainly composed of glucose and fructose with a concentration ranging from 10 °Brix to 17 °Brix. Furthermore, according to the United States Department of Agriculture (USDA), prickly pear fruit has a dietary fiber content of about 14% daily value (DV), a vitamin C content of 23% DV, and, for some minerals such as magnesium, the content is above 20% DV.
Prickly pear fruits are perishable and preservation by, e.g., freezing, drying, or processing further into products such as juice/nectar and jam is of great interest. Prickly pear beverages are one of the most attractive opportunities amongst the fruit manufactured products, since they are perceived as healthy, tasty, and refreshing [5]. In fact, prickly pear juice is consumed locally in various parts of the world. Despite this, the industrial modification of prickly pear juices still must overcome several challenges, particularly the development of an effective, safe, and non-degrading quality preservation methodology [4].
A key problematic issue in the industrial processing of such a juice is the negative impact of temperature, used for pasteurization purposes, on the organoleptic properties of the final product, including taste, flavor and, particularly color [6]. Moreover, heat processing is responsible for the degradation of Opuntia bioactive compounds, including carotenoids, phenolic compounds, and betalains [7]. In this context, innovative nonthermal pasteurization technologies such as ultrasound (US), pulsed electric fields (PEF) and high-pressure processing (HPP) have been investigated as processing techniques to destroy food-borne pathogens and inactivate enzymes to enhance the safety and shelf-life of perishable foods. Among them, the application of US in pasteurization of prickly pear juices and beverages has been the most exploited technique [8,9]. In turn, to our knowledge, the application of HPP was only used by Jiménez-Aguilar et al. and Moussa-Ayoub et al. [3,10]. The first authors applied HPP in a mix of 90% pulp and 10% peel of O. Ficus-indica juices from two locally commercialized Mexican varieties (Cristal and Rojo San Martin) with the incorporation of acids and preservatives, following the effects of HPP (400–550 MPa, at room temperature, 0–16 min) on the nutritive content and on the antioxidant activity of the prickly pear beverages. The second authors evaluated the impact of PEF and HPP pasteurization on Opuntia dillenii cactus juice, with consideration for microbial inactivation and selected physicochemical properties. Nevertheless, both studies failed to analyze the impact of pasteurization over storage time, which would allow a proper and more detailed characterization of the microbial, physical-chemical and nutritional characteristics of the juices and determination of the effects on the shelf-life of the product.
Although Cristal and Rojo San Martin varieties represent popular prickly pear varieties worldwide, the O. ficus-indica cultivars ‘Gialla’ or ‘Sulfarina’, ‘Bianca’ or ‘Muscaredda’ and ‘Rossa’ or ‘Sanguigna’ are dominant in Italy (the primary country exporting fresh prickly pear fruits), and their cultivation has spread to all of the Mediterranean basin. Among them, cv ‘Gialla’ (orange fruit pulp) is the most popular due to its high productivity and good adaptability to intensive cultivation methods. ‘Bianca’ (white fruit pulp) is appreciated for its unique flavor, while the ‘Rossa’ is particularly appealing for its deep red color due to the high betacyanin level [11].
HPP has been reported to differentially affect phytochemicals, e.g., enhancing anthocyanin maintenance but not significantly altering that of betalains [12]. Since the different prickly pear cultivars possess unique phytochemical compositions, it is feasible to assume that the impacts of HPP treatment may differ among the samples. Furthermore, HPP is used for the preservation of high-quality foods, with significant microbial inactivation at pressures of 400 MPa or higher even at ambient temperatures within a sufficient holding time of several minutes [13].
So, in the present study, the impact of HPP, at 500 MPa for 10 min at 20 °C, on the juice produced from three distinct cultivars of O. ficus-indica was compared to conventional thermal pasteurization (TP) at 71.1 °C for 30 s, through evaluation of the microbial load (total psychrophiles, Enterobacteriaceae and yeast and mold) and of selected physico-chemical properties (pH, °Brix, cloudiness, browning, and titratable acidity) as well as the total phenolic content and antioxidant capacity.

2. Materials and Methods

2.1. Opuntia ficus-indica Juices

The three different prickly pear fruit cultivars, namely O. ficus-indica cv ‘Rossa’ (red pulp), ‘Gialla’ (orange pulp) and ‘Bianca’ (white pulp), were cultivated by Cooperativa Agrícola, Figo d’ Idanha (Idanha a Nova, Portugal). After harvesting, the fruits were processed separately, following internal industrial procedures of Figo d’ Idanha, to obtain the fruit juices (red, orange, and white, according to the pulps‘ color). In summary, the pulp of each cultivar was manually separated from the peels and then pressed separately to separate the seeds from the pulp. During this process, no preservatives or other compounds were added, and after preparation, the juices were packaged in polyethylene bag-in-box containers of 3 L of juice each and transported in a refrigerated container to the laboratory. After arrival, portions of the juices were submitted to thermal pasteurization or to high-pressure pasteurization (as in Section 2.2 or Section 2.3, respectively), and then stored at 4 °C together with the control group (non-pasteurized juice) through the period of analysis. The intervals of analysis for the non-pasteurized juice were primarily based on the specific shelf-life of conventional fruit juices as reported in the literature [14] and then readapted as appropriate, according to the gathered results (mainly microbial results). Considering a maximum period of 8 days in the control group, samples were taken after arrival (t0) and at day 3 (t3), day 5 (t5) and day 8 (t8). Regarding the pasteurized samples, TP and HPP samples were taken at the initial date, after processing (t0), and days 8 (t8), 15 (t15), 30 (t30), 45 (t45) and 60 (t60).

2.2. Thermal Pasteurization (TP)

The usual industrial TP conditions for premium juices are 71.1 °C for 30 s, 90 °C/2 s, or 84 °C/20 s [15], of which the first was used in this work. TP was carried out by submersing the juice samples in a thermostatic bath (Selecta Frigiterm 6000382, Barcelona, Spain) at 71.1 °C in heat-sealed polyamide and polyethylene bags (3 × 6 cm) containing 15 mL of juice. The time required to reach the desired temperature (70 s) was previously estimated using a K type thermocouple connected to a digital thermometer. As soon as the desired temperature was reached, the samples were held in the water bath for 30 s and afterwards quickly cooled in ice. To assess the shelf-life of TP juices, a microbiological analysis of sample storage under refrigerated conditions (≈4 °C) was performed. At each sampling time, three juice bags from each TP treatment were analyzed.

2.3. High-Pressure Pasteurization (HPP)

High-pressure treatments were carried out using a 55 L capacity industrial scale apparatus (model 55, Hiperbaric, Burgos, Spain). Tap water was used as pressurization fluid. Batches of juices in heat-sealed polyamide and polyethylene bags (3 × 6 cm) containing 15 mL of juice were subjected to 500 MPa for 10 min treatment at room temperature (≈22 °C). Pressure was generated in about 60 s, whereas pressure release time took about 10 s. After processing, the samples were immediately cooled in an ice bath for further analysis. To assess the shelf-life of HPP juices, microbiological analyses of samples stored under refrigerated conditions (≈4 °C) were performed. At each sampling time, three juice bags from each HPP treatment were analyzed.

2.4. Microbial Load

Each sample of prickly pear juice subjected to the different treatments was analyzed for counts of total aerobic psychrophiles (TAP), Enterobacteriaceae (ENT), and yeasts and molds (YM). From each sample, 1.0 mL was obtained aseptically and homogenized with 9.0 mL of Ringer’s solution. Further, decimal dilutions were made with the same diluent, and duplicates of dilutions were plated on the appropriate media: TAP counts were determined in plate count agar, by incubation at 30 ± 1 °C for 72 ± 3 h and at 20 ± 1 °C for 120 ± 3 h, respectively (ISO 4833:2003); ENT counts were quantified in violet red bile dextrose agar, being incubated at 37 °C for 24 ± 1 h (ISO8523:1991); YM counts were enumerated on rose-bengal chloramphenicol agar medium incubated at 25 ± 1 °C for 120 ± 3 h (ISO 7954:1987). In all cases, Petri dishes containing 15–300 colony forming units (CFU) were selected for counting, and the results expressed as log CFU/mL. The results are shown as microbial log load variation (log (N/N0)) calculated by the log load difference between the microbial load on each storage day (N) and the initial microbial load on day 0 (N0).

2.5. pH and Titratable Acidity

The variation, through time, in the pH value of the prickly pear juices was measured with a properly calibrated glass electrode at 20 °C (pH electrode 50 14, Crison Instruments, Barcelona, S.A., Spain). Titratable acidity (TA) of diluted juices (10%) was determined by titration against 0.10 M NaOH until pH of 8.1 was achieved (pH electrode 50 14, Crison Instruments, S.A., Spain), where values were expressed as percentage variation versus the initial value [16].

2.6. Total Soluble Solid Analyses (°Brix), Browning, Cloudiness

The total soluble solid content was determined by measuring Brix (Handheld Refractometer Atago, ATC-1E) at 20 °C, and the results were expressed as °Brix. The browning degree was determined by the measurement of absorbance at 420 nm in a UV-VIS microplate spectrophotometer (Multiskan GO Microplate Spectrophotometer, Thermo Scientific, Thermo Fisher Scientific Inc., Waltham, MA, USA), after centrifugation of the juice samples at 9000× g at 4 °C for 20 min. Cloudiness was evaluated by direct measurement of absorbance at 700 nm using the same UV-VIS microplate spectrophotometer.

2.7. Major Composition

The relative moisture content was determined by weighing 3–4 g of prickly pear juice into a porcelain crucible, then drying at 105 °C overnight. To determine the ash content, the remaining residue was pre-incinerated for 20 min on a heating plate and then placed in a muffle, at a temperature of 550 °C for 6 h, followed by gravimetric quantification [17]. The total dietary fiber was determined using method 2 of the Total Dietary Fiber Assay Kit (Megazyme) based on AACC method 32–05.01 and AOAC Method 985.29. The total sugar content was determined by the Dubois method [18]. Briefly, to 2 mg of prickly pear juice were added 200 µL of sulfuric acid (72% v/v). After 3 h of incubation at room temperature, 2.2 mL of water were added, and the mixture was placed in a water bath at 100 °C. After centrifugation (10,000 rpm for 5 min), to 100 µL of sample were added 50 µL of phenol 5% and 250 µL of sulfuric acid (96% v/v), and the absorbance was read in an automated plate reader (Biotek Instrument Inc., Winooski, VT, USA) at 490 nm. Moreover, reducing sugars determination was measured according to the method described by Miller [19], using 3,5-dinitrosalicylic acid (DNS) reagent. For that, 1.0 mL of the clear filtrate was added to 1.0 mL of DNS reagent, and the mixture was incubated in a boiling water bath for 5 min. After cooling in an ice bath, the mixture was diluted with 10 mL of distilled water, and the absorbance was measured at 540 nm. The concentration values were calculated using a calibration curve, obtained from glucose standard solutions, and were expressed in mg·mL−1 of prickly pear juice. DNS reagent was prepared by weighing 10 g of DNS and dissolving in 200 mL of a 2 N NaOH solution by heating with intensive stirring. Simultaneously, a solution of 300 g of potassium tartrate in 500 mL of distilled water was prepared by heating with intense stirring. Both solutions were mixed and stirred, and the final mixture was then diluted to 1 L with distilled water.

2.8. Phytochemicals

2.8.1. Total Phenolic Content

The total phenolic content was determined with the Folin–Ciocalteu reagent using the adapted procedure described by Singleton and Rossi [20]. Briefly, 15 µL of the diluted sample was reacted with 15 µL of 0.2 mol/L Folin–Ciocalteu reagent and 60 µL for 5 min, and then 150 µL of 7% sodium carbonate solution was added into the reaction mixture. The absorbance readings were taken at 760 nm after incubation at room temperature for 1 h in an automated plate reader (Biotek Instrument Inc., Winooski, VT, USA). Gallic acid was used as a reference standard, and the results were expressed in gallic acid equivalents per milliliter of juice ((GAE)/mL of juice).

2.8.2. Total Betalains

The quantification of betalains from prickly pear juice was preformed using the method described by Stintzing et al. [21]. Prickly pear peel juice samples from the three different cultivars were diluted with McIlvaine buffer (pH 6.5, citrate-phosphate) to obtain absorption values of approximately 0.9 ≤ A ≥ 1.0 at their respective absorption maxima. The betalain content (BC) was calculated as described earlier (12): BC [mg/L]) [(A × DF × MW × 1000/ε × l)], where A is the absorption value at the absorption maximum corrected by the absorption at 600 nm, DF is the dilution factor, and l is the path length (1 cm) of the cuvette. For quantification of betacyanins and betaxanthins, the molecular weights (MW) and molar extinction coefficients (ε) of betanin ((MW) 550 g/mol; ε = 60,000 L/(mol·cm−1) in H2O; λ = 538 nm) and indicaxanthin ((MW) 308 g/mol; ε = 48,000 L/(mol·cm−1) in H2O; λ = 480 nm) were applied. All measurements were performed in duplicate using a UV-vis automated plate reader (Biotek Instrument Inc., Winooski, VT, USA).

2.8.3. UHPLC-DAD-ESI-MSn Analysis

UHPLC-DAD-ESI/MS analyses were carried out on an Ultimate 3000 (Dionex Co., San Jose, CA, USA) apparatus equipped with an auto sampler, a quaternary pump, an Ultimate 3000 Diode Array Detector (Dionex Co., San Jose, CA, USA), and an automatic thermostatic column compartment. It was coupled to an ion trap MS equipped with an ESI source (Thermo LTQ XL MS, Thermo Scientific, San Jose, CA, USA). Control and data acquisition were carried out with the Thermo Xcalibur Qual Browser data system (Thermo Scientific, San Jose, CA, USA). Nitrogen above 99% purity was used, and the gas pressure was 520 kPa (75 psi). The instrument was operated in positive-ion mode, and the full scan covered the mass range from m/z 100 to 2000. ESI needle voltage was set at 4.80 kV, and the ESI capillary temperature at 275 °C. The compounds were separated using a Hypersil GOLD C18 column (100 mm length; 2.1 mm i.d.; 1.9 μm particle diameter, end capped from Thermo Scientific, USA) at 30 °C. Gradient elution was carried out with a mixture of 0.1% (v/v) formic acid in water (solvent A) and 30% (v/v) methanol in acetonitrile (solvent B), with a flow rate of 0.200 mL/min in a linear gradient. The solvent gradient started with 5% of solvent B, reaching 40% at 14 min, 100% at 16 min, and being maintained for 2 min before returning to the initial conditions at 20 min. UV–Vis spectral data for all peaks were accumulated in the range 200–700 nm, while the chromatographic profiles were recorded at 280 nm. The identification of compounds was performed by comparison of retention times, absorption spectra, and MS data with standards in the literature [22].

2.9. Enzymatic Activity

The activity of polyphenol oxidase (PPO) and of peroxidase (POD) was evaluated according to the method described by Pinto et al. [23]. For PPO, aliquots of fermented prickly pear juice (0.6 mL) were mixed with 2.4 mL of a pre-incubated substrate solution at 30 °C containing 100 mM catechol in 100 mM citrate buffer (pH 5.4), and absorbance was measured at 420 nm (Lambda 35 UV/Vis Spectrometer, PerkinElmer Instruments Inc., Waltham, MA, USA). For POD activity assays, aliquots of the samples (10 μL) were mixed with 0.36 mM ABTS and 0.1 M sodium acetate buffer (pH 6.0) to a final volume of 1.9 mL. After pre-incubation at 20 °C, 100 μL of 0.5 M hydrogen peroxide was added to initiate the reaction, and the formation of the ABTS cationic radical was monitored at 414 nm (Lambda 35 UV/Vis spectrometer, PerkinElmer Instruments Inc., Waltham, MA, USA) for 5 min. Pectin methylesterase (PME) activity was measured by titration. Two milliliters mL of 1% pectin in 250 mM NaCl were added to 4 mL of fermented juice sample. The samples were continuously titrated with 0.01 MNaOH, keeping the pH equal to 7. NaOH consumption was recorded every 30 s for a total of 15 min. The respective enzyme activity results were expressed as V(NaOH)/min/mL. Enzyme activities were obtained from the linear portion of the absorbance–time curves and expressed as ΔAbs/min/mL at 420, 414, and 620 nm, respectively, for PPO, POD, and PME.

2.10. Antioxidant Activity

2.10.1. ABTS•+ Assay

The total antioxidant activity of the extracts was measured using an adaptation of the ABTS•+ discoloration assay based on the procedure described by Amarante et al. [24]. Briefly, a stock solution of ABTS•+ was prepared by reacting the ABTS-NH4 aqueous solution (7 mM) with 2.45 mM potassium persulfate in the dark at room temperature for 12–16 h to allow the completion of radical generation. This solution was then diluted with distilled water until its absorbance reached 0.70 ± 0.05 at 734 nm. Afterwards, 50 μL of each sample were mixed with 250 μL of the diluted ABTS•+ solution in a 96-well microplate. The mixture was then allowed to react for 20 min in the dark, at room temperature. The absorbance was then measured at 734 nm in an automated plate reader (Biotek Instrument Inc., Winooski, VT, USA), and the results were expressed in milligrams of GAE per mL of juice.

2.10.2. Superoxide (SO) Scavenging Assay

In a 96-well plate, 75 µL of nitroblue tetrazolium (NBT), 100 µL of β-NADH, 75 µL of each sample/standard and 75 µL of phenazine methosulfate (PMS) were mixed and incubated for 5 min, at room temperature. The absorbance was then measured at 560 nm in an automated plate reader (Biotek Instrument Inc., Winooski, VT, USA) [25]. Results were expressed in milligrams of GAE per mL of juice.

2.10.3. Nitric Oxide (NO) Scavenging Assay

The NO scavenging method was adapted from Catarino et al. [25]. Briefly, in a 96-well plate, 100 µL of six different extract concentrations (0–1 mg/mL) were mixed with 100 µL of sodium nitroprusside (3.33 mM in 100 mM sodium phosphate buffer pH 7.4) and incubated for 15 min under a fluorescent lamp (Tryun 26 W). Afterwards, 100 µL of Griess reagent (0.5% sulphanilamide and 0.05% naphthyletylenediamine dihydrochloride in 2.5% H3PO4) were added to the mixture, which was allowed to react for another 10 min in the dark. The absorbance was then measured at 562 nm in an automated plate reader (Biotek Instrument Inc., Winooski, VT, USA). Results were expressed in milligrams of GAE per mL of juice. Gallic acid was used as reference.

2.11. Principal Components Analysis (PCA)

Principal components analysis was performed using Python (version 3.11.0), Pandas (version 1.5.1) and Numpy (version 1.23.4) software. Python was used as programming language, and Pandas and Numpy for the data analysis. The graph produced was obtained using matplotlib (version 3.6.2).

3. Results and Discussion

3.1. Microbial Load

The microbiological quality of prickly pear juices was followed by monitoring the TAP, Enterobacteriaceae, and yeast and mold counts (Figure 1a–c, respectively) along storage at 4 °C and until achieving spoilage (total microbial counts ≥ 6.00 Log10 CFU/mL) [23].
The mean of initial populations of viable microorganism for all of the juices was 4.6 ± 0.03 Log10 CFU/mL (TAP), 3.3–3.3 Log10 CFU/mL (Enterobacteriaceae) and 3.6–3.8 Log10 CFU/mL (yeast and mold). Results similar to those obtained in this work for TAP were published in the literature, reporting total aerobic psychrophilic counts of 3.20–4.60 Log10 CFU/mL in fresh fruit from O. ficus-indica Mill, cv. ‘Gialla’ from Italy (storage under modified atmosphere) and ultrasound-treated green prickly pear juice harvested in Mexico [26,27]. In turn, the initial microbial load obtained herein for Enterobacteriaceae and for counts of yeast and mold was somewhat higher than those presented in the literature (1.61 Log10 CFU/mL and approximately 1 Log10 CFU/mL, respectively) [28]. Nevertheless, for the duration of the experiment (8 days for the control group), the level of yeast and mold was maintained below the spoilage level.
Pressurization at 500 MPa, 20 °C for 10 min reduced the population of TAP to approximately 3.0 Log10 CFU/mL for the red, orange, and white juices; for Enterobacteriaceae and Yeasts and Molds, for all the days the pasteurized sample stayed below the detection limit. (≤1.00 log CFU/mL as presented by Pinto et al. [23]. After thermal pasteurization of the prickly pear juices at 71 °C for 30 s, the mean initial TAP population was 3.06 ± 0.02, 3.02 ± 0.01, and 3.04 ± 0.02 Log10 CFU/mL for the red, orange, and white juices respectively, and the Enterobacteriaceae and the yeast and mold populations were below the detection level.
The high initial microbial populations of the untreated prickly pear juices limited the shelf-life of untreated juice stored at 4 °C to 5–8 days for all three prickly pear cultivars studied. Nevertheless, these results were more promising than those obtained for prickly pear belonging to wild cultivars (yellow and red to orange colors), shelf-grown in three regions of Greece by Karabagias and coworkers, who set the shelf-life of the untreated juices between 2–3 days [29]. This could be due to a higher presence of betalains that chelate the required inner cations (Fe+2, Ca+2 and Mg+2) of microorganisms, resulting in cell death [30]. Although microbial growth was evident in thermally treated and HP-processed samples over time at 4 °C, the initial microbial reductions achieved using both treatments resulted in an increase in the shelf-life of prickly pear juices. Thermally pasteurized and HPP-treated juices stored at 4 °C were microbiologically acceptable up to 30 and 60 days, respectively, meaning that the application of HP allowed an extension of shelf-life of about 30 days in comparison to the traditional pasteurization method. So, it can be concluded that HHP is an effective alternative and efficient method of pasteurization for prickly pear when compared to thermal treatments, achieving effective microbial inactivation, and extending the shelf-life of the juices by contributing to the preservation of better overall characteristics.

3.2. Variations in pH, Titratable Acidity, °Brix, Browning and Cloudiness

3.2.1. pH and Titratable Acidity

The initial pH of the prickly pear juices was close to 6 (Figure 2a), close to the values of those reported in the literature for fruits of O. ficus-indica [31], or juices with red, orange and white pulps from different cultivars grown in the Sicilian region [32] as well as pulp from green to orange-brown cultivars [33]. Notably, among the three juice samples, the red one showed a sharper pH decreasing tendency with storage time, being particularly accentuated in the non-pasteurized sample.
Pasteurization did not influence the initial pH of the juices, since TP and HPP samples had similar initial pH values compared to the respective controls. Similar results were reported by Jiménez-Aguilar et al. for prickly pear pulp of ‘Rojo’ and ‘Cristal’ cv after high-pressure processing [3]. Among both HPP and TP treated samples, the red juices were the most affected, exhibiting a decrease in their pH values of about 1 unit in the first 15 days of storage. Betacyanins, the pigments present in higher concentrations in the red pulp fruit, are more susceptible to degradation [34] and produce betalamic acid, which could explain the higher variation noticed in pH [35]. Over longer periods, TP samples exhibited a more pronounced decrease than HPP samples (pH of 4.76 vs. 4.92 at t45, respectively). In turn, regardless of the pasteurization method, samples of white and orange juice tended to have a similar pH through the duration of storage, with values only slightly lower than those of the initial juice. As far as we know, the pH variation in unpasteurized or pasteurized prickly pear juices with storage time was not previously studied, a fact that hampers the discussion of our data. Nevertheless, the results were similar to those reported in the literature for other juices and purées after high-pressure pasteurization, where, during storage, the pH values varied slightly (less than 0.5 for all of the juices and purées) for the pasteurized samples [36].
Titratable acidity (TA gcitric acid/L) is an indicator of total acid content and is reported as a better predictor of acid content impact on flavor than of alternate measures, including pH [37]. During storage, many anaerobic and facultatively anaerobic microorganisms produce organic acids including lactic, succinic, acetic, citric, butyric, and propionic acids during fermentation [38] that can produce undesirable off-flavors.
Pasteurized juices had a similar titratable acidity value at t0, which was also equivalent to that of non-processed juice (0.62–0.75). With storage time, this parameter increased in all juices. Among non-processed samples, a maximum of 1.64 ± 0.03 gcitric acid/L was registered in red juices at t8. As for the pasteurized samples, an increase in titratable acidity was observed, particularly in red and orange juices, in TP samples after t15. From this time to t45, values of titratable acidity rose from 0.62 to 2.91 gcitric acid/L in TP samples, while those in HPP samples varied between 0.75 and 1.25 gcitric acid/L. The initial results (t0) reported in Figure 2b are consistent with those of previous reports in the literature for untreated juices from prickly pear Sicilian cultivars [32] as well as ‘Bianca’ or ‘Muscaredda’, ‘Sanguigna’ and ‘Sulfarina’ cultivars harvested in San Cono, Italy [39] and strained pulp from green to orange-brown cultivars [33], which presented a TA content of 0.02% and 0.18% of citric acid, respectively. Moreover, the initial results obtained were also similar to those for O. ficus-indica cv ‘Rojo San Martín’ and ‘Cristal’ after high-pressure processing [3].

3.2.2. Total Soluble Solids (TSS)

The total soluble solid content of a solution is determined by the index of refraction and is referred as the Brix degree. This parameter is generally used to estimate the levels of carbohydrates (around 80%), although it also takes in consideration organic acids, proteins, fats, and minerals of a sample [40]. At t0, TSS values of the juices were between 13.5–14.8, with the maximum and minimum values recorded in white and red samples, respectively. Note that the values for red juice were close to those previously reported in the literature for purple prickly pear juice from Mexico (11.9–12.8) [28] as well as prickly pear juice from cv ‘Bianca’ or ‘Muscaredda’, ‘Sanguigna’ and ‘Sulfarina’ from Italy (11.75–13.50) [39].
During storage at 4 °C, and for all juices studied, a decrease in TSS was observed (Figure 3a), a fact that is in accordance with data in the literature for other fruits and juices [41] and, in general, usually associated with some increased microbial activity that consumes the sugars [42], as well as to some Maillard reactions [43]. In fact, the observed reduction in °Brix can be related with the increased microbial activity (noticed by the microbial loads presented in Microbial load Section 3.1), as well as some Maillard reactions [43] that are responsible for the consumption of some reducing sugars and may explain the results obtained in Section 3.4. (nutritional composition).

3.2.3. Browning and Cloudiness

Browning of juices is considered a quality index of food products and is a result of Maillard reactions as well as the action of some enzymes such as polyphenol oxidase (PPO) and peroxidase (POD) that are responsible for causing color changes, off-flavors and nutrient losses [23]. The browning degree at t0, presented in Figure 3b, varied significantly between the white and the other two juices, with registered values of about 1.8 and 1.3, respectively.
Despite having lower initial values, over the time of storage, the browning index showed a much more significant increase in the red and orange juices, and especially in the orange juice, whose values became closer to those of the white juice. Changes in the browning degree can be attributed to the breakdown of carotenoid pigments as well as degradation of ascorbic acid by creating reactive carbonyl groups that act as precursors of non-enzymatic browning, as well as the activity of some enzymes such as PPO and POD that catalyze the oxidation of phenolic compounds to o-quinones that subsequently undergo rapid polymerization, producing pigments that cause fruit browning [44]. Furthermore, betaxanthin and betacyanin pigments, present in high quantities in both the orange and red juices, respectively [45], are prone to oxidation and consequently to browning [46], which may explain the fact that browning variation is superior for those juices when compared to the white juice less rich in betalains. Moreover, since the orange cultivar was richer in indicaxanthin (responsible for the orange coloration of the pulp) [45], which is more susceptible to oxidation, it is possible that the higher concentration of indicaxanthin in this juice could explain its higher browning degree variation [46].
Overall, the reactions responsible for the increase in the browning index seem to have occurred with the same intensity in the two pasteurized samples, meaning that for both treatments, the inhibition of the enzymes responsible for browning, as well as the non-enzymatic browning, was similar. Some results in watermelon juice after high-pressure processing presented lower browning for samples treated with pressure (600 MPa), suggesting that a higher pressure than the one applied in this work (500 MPa) would be preferable for the reduction in browning degree [47]. Similarly, higher temperatures could lead to a higher inactivation of the same enzymes and decrease the browning degree of the samples, but with a higher negative effect on the other quality parameters [44].
Cloud stability or cloudiness is an important quality parameter in juice and can be a positive or negative attribute, depending on the expectation of the consumers. An unstable cloud or turbidity considered ‘muddy’ is unacceptable for samples to be marketed as clarified juice [48], while for non-clarified juice, changes in cloudiness of fruit juices and juices are usually associated with the catalytic action of enzymes such as pectin methylesterase (PME) and polygalacturonase (PG), leading to a clear upper layer and a bottom sediment [49]. For the non-pasteurized samples, no variation in cloudiness was verified even though no enzymatic inactivation was produced, a fact that could be due to the short duration of the analysis (8 days). Thermal pasteurization (90 °C for 1 min) completely inactivated these enzymes, resulting in a cloud-stable juice [50] with no variation in cloudiness over time, similarly to the results obtained for the thermal pasteurization samples produced in this work (71 °C for 30 s), as presented in Figure 3c.
For HPP, no variation over time of cloudiness was verified. Similar results were reported by Bubo et al. for tomato juice [51] as well as Barba et al. in their review [42], where various levels of pressure were reviewed for their application in fruit or vegetable juices and milk, mixed or alone. Moreover, Goodner and co-workers [52] reported that pressures from 500 to 900 MPa at dwell times of 1 s, 1 min and 10 min in orange juice led to a stable cloud. Therefore, one can affirm that high-pressure treatment (500 MPa for 10 min) and TP (71 °C for 30 s) were effective in preserving cloud stability in prickly pear juice, while maintaining acceptably low levels of microorganisms.

3.3. Nutritional Composition

The results for the nutritional composition of juices from O. ficus-indica cv ‘Rossa’, ‘Gialla’ and ‘Bianca’ are presented in Table 1 and Figure 4. The juices had a moisture content in the range of 86 to 88%, which is similar to the results obtained for other prickly pear juices [3,53] and other fruit juices in general [54]. As for the ash content, the results obtained in this work were close to 0.50%, which is significantly higher than those previously reported in the literature for untreated juice from nine different Moroccan cultivars (0.27–0.41%) [53] and HP-treated prickly pear pulp from Cristal and Rojo San Martín varieties harvested in Mexico (0.20–0.4%). Curiously, values for total dietary content were higher than those previously reported in the literature for untreated juices from different Moroccan cultivars (2.96–6.13%) [53] and for prickly pear pulp from the Cristal and Rojo San Martín varieties—14.5 and 15.2%, respectively [55].
The total sugar content (Figure 4a), was around 15.5% for untreated samples and 19.5% for pasteurized samples, which corresponded to slightly higher values than the 12% obtained by Eroglu et al. using HPLC in prickly pear pulp obtained from fruits collected at different harvest times from Mersin-Silifke in Turkey, and the 11% obtained by Gurrieri et al. for juices of Sicilian prickly pear with red, yellow and white pulp from three different cultivars [32,56]. The increase in total sugar content after pasteurization was also observed for pasteurized apple juice and sugarcane juice, where, after thermal pasteurization, an increase in the total sugar content was verified [57,58]. Similarly, some authors noticed an increase in sugar content for non-thermal pasteurization methods when applied to açai juice [59], and since high-pressure is associated to some extent with the destruction of cell walls in vegetable and fruit products [60], results analogous to those obtained and reported in this work were expected. For all conditions tested and for the three cultivars, a decrease in total sugar content over storage time was verified, a fact that probably resulted from the fermentation processes that were occurring during storage [61].
A reducing sugar is any sugar that can act as a reducing agent because it has a free aldehyde group or a free ketone group [62]. In the case of prickly pear juice, the most abundant reducing sugars are fructose and glucose [32]. The average reducing sugar levels during storage for the control group and for the two pasteurization methods are shown in Figure 4b. The reducing sugar content in the white juice was approximately 17%, a lower value than those obtained for the other two juices. For this juice, the reducing sugar concentration was higher for samples treated with temperature, whereas for the orange and red juices, it was higher for samples treated with pressure. Furthermore, both pasteurization treatments allowed for improved maintenance of the results, showing a slight increase when compared to samples that were non-pasteurized, in which the reducing sugar showed sharper variation for 8 days of the experiment.
Overall, the reducing sugars at t0 were similar to those reported in the literature for prickly pear from various cultivars and regions of Mexico, between 5–14% [63]. Nevertheless, the obtained results herein were closer to those described for other fruit juices and fruit blends, such as mango, papaya and guava juices and blends [52]. When stored at 4 °C, the three prickly pear juices exhibited a slight variation in their concentrations of reducing sugars, which tended to increase over the storage period, a fact that may be due to hydrolysis of polysaccharides such as starch, cellulose, pectin, etc. and conversion into simple sugars (glucose).

3.4. Phytochemicals

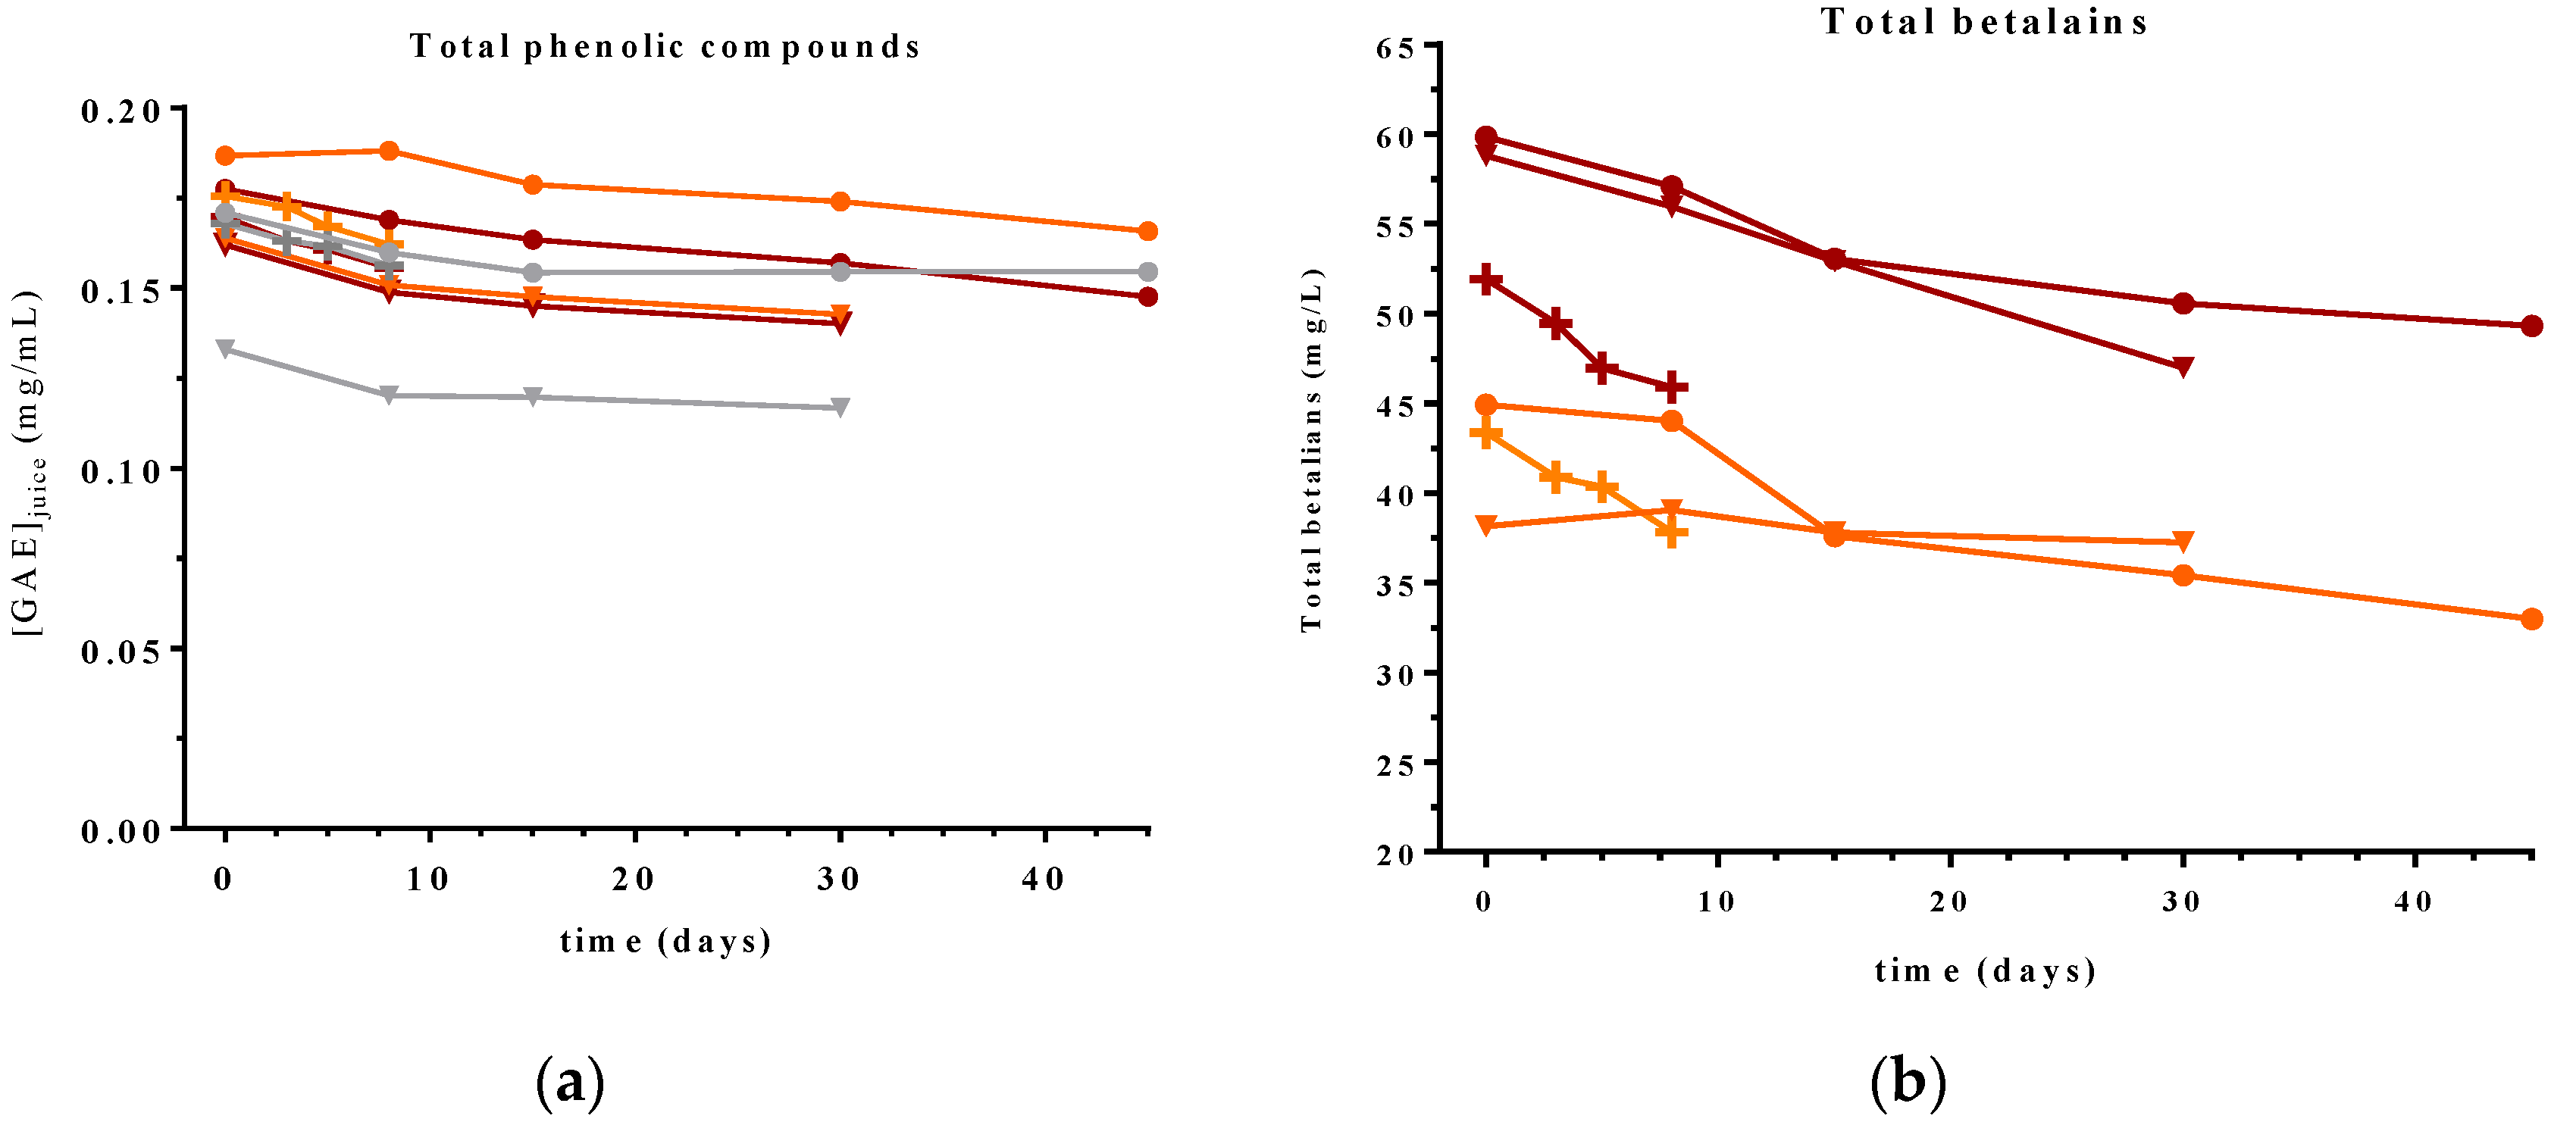
3.4.1. Phenolic Compounds

Phenolic compounds are abundant secondary metabolites in plants, being ubiquitously distributed phytochemicals found in most plant tissues. In general, they possess a common chemical structure comprising an aromatic ring with one or more hydroxyl substituents that can be divided into several classes, being in general claimed to possess antioxidant capabilities [64].
Overall, TPC at t0 of the three untreated Opuntia juices was found to be in the range of 0.13–0.18 mg/mL, with the lowest levels registered in thermal pasteurized ‘Bianca’ cv (Figure 5a). Moreover, all of the juices showed similar chromatographic peaks at 280 nm (not shown), suggesting that all juices had the same phenolic constituents. Indeed, as summarized in Table 2, the main phenolic compounds identified in these samples were piscidic acid, eucomic acid and isorhamnetin derivates. Similar compounds and fragments were identified by Mata et al. for O. ficus-indica juices harvested in Portugal and produced from orange-red pulps [65].
As for the effects of storage on the total phenolic contents of prickly pear juice, a slight decrease was observed (around 0.02–0.025 mg/mL[GAE]) for all of the cultivars, a fact that was mostly evident in unpasteurized samples. Moreover, compared to thermal-treated samples, those submitted to HPP pasteurization showed superior stability in their TPC levels. This result is consistent with data reported in the literature for other food products [66], where HPP treatments of other fruits and vegetables proved to have a low impact on phenolic composition over time. Regarding the general variation in the TPC of prickly pear cv ‘Rossa’, ‘Gialla’ and ‘Bianca’ through time, results with a similar tendency were found by Yung-Sheng Lin et al. for juices of Momordica charantia L. and Momordica charantia L. var. abbreviata, where normalization of the TPC showed a decrease during storage [67].

3.4.2. Betalains

Total betalains were measured for the cv ‘Rossa’ and ‘Gialla’, since the ‘Bianca’ cultivar does not express the betaxanthin and betacyanin pathways [11]. The results obtained, of around 60 and 40 mg/ L of total betalains, respectively, were slightly lower than those obtained for Opuntia ficus-indica from Italy [45]. As expected, the results showed that the cv ‘Rossa’ had higher betalain content than cv ‘Gialla’. Indeed, it is well-reported that Opuntia juices of red pulp have higher concentrations of betacyanins and a considerable quantity of betaxanthins, when compared with the other colored fruits [68]. These compounds exhibit strong antioxidant properties but are susceptible to changes in pH, oxygen, metal ions, temperature, water activity, light exposure, and enzymatic activities that occur during technological processes, hence accelerating their decomposition [64]. This can explain the decrease in betalains measured in both the untreated and treated samples during storage (Figure 5b). Moreover, Gokhale et al. reported that betacyanins of beet root (Beta vulgaris) were more sensitive to temperature than betaxanthin, a fact that can partially explain the increased loss of total betalains in the ‘Rossa’ cultivar, compared to the ‘Gialla’ cultivar.

3.5. Determination of Enzymatic Activity (PPO, POD and PME)

Fruit and vegetables in general contain oxidative enzymes such as PPO, POD, and PME, which are involved in oxidizing aromatic compounds and can lead to the decreased nutritional value of food and the development of unpleasant taste [69]. As expected, the activities of these enzymes were increased in unpasteurized juices, whereas processing with temperature and HPP reduced their activity—by approximately 36–40% for PPO, 80–85% for PME and 85–90% for POD, respectively (Table 3). In fact, temperature and HPP are well-known for their capacity to inhibit PPO [70,71]. As an example, Carlos et al. reported a similar inhibition of PPO in watermelon juice treated with hyperbaric pressure and stored at 4 °C [23]. Likewise, other authors reported a significant reduction in POD and PME activities, both by temperature and HPP processing [15,23,72]. Moreover, a slight decrease in the activity of all of the enzymes could also be observed with storage, similarly to what was reported by Chisari et al. for strawberry stored at 4 °C [73]. Hirsch et al. also reported a decrease in the activity of PME and POD in orange juice treated with temperature and stored at 4 °C for 60 days [74]. These enzymes are associated with the quantity of clouding particles, so the results obtained can be explained by the decrease in observed TSS [74].

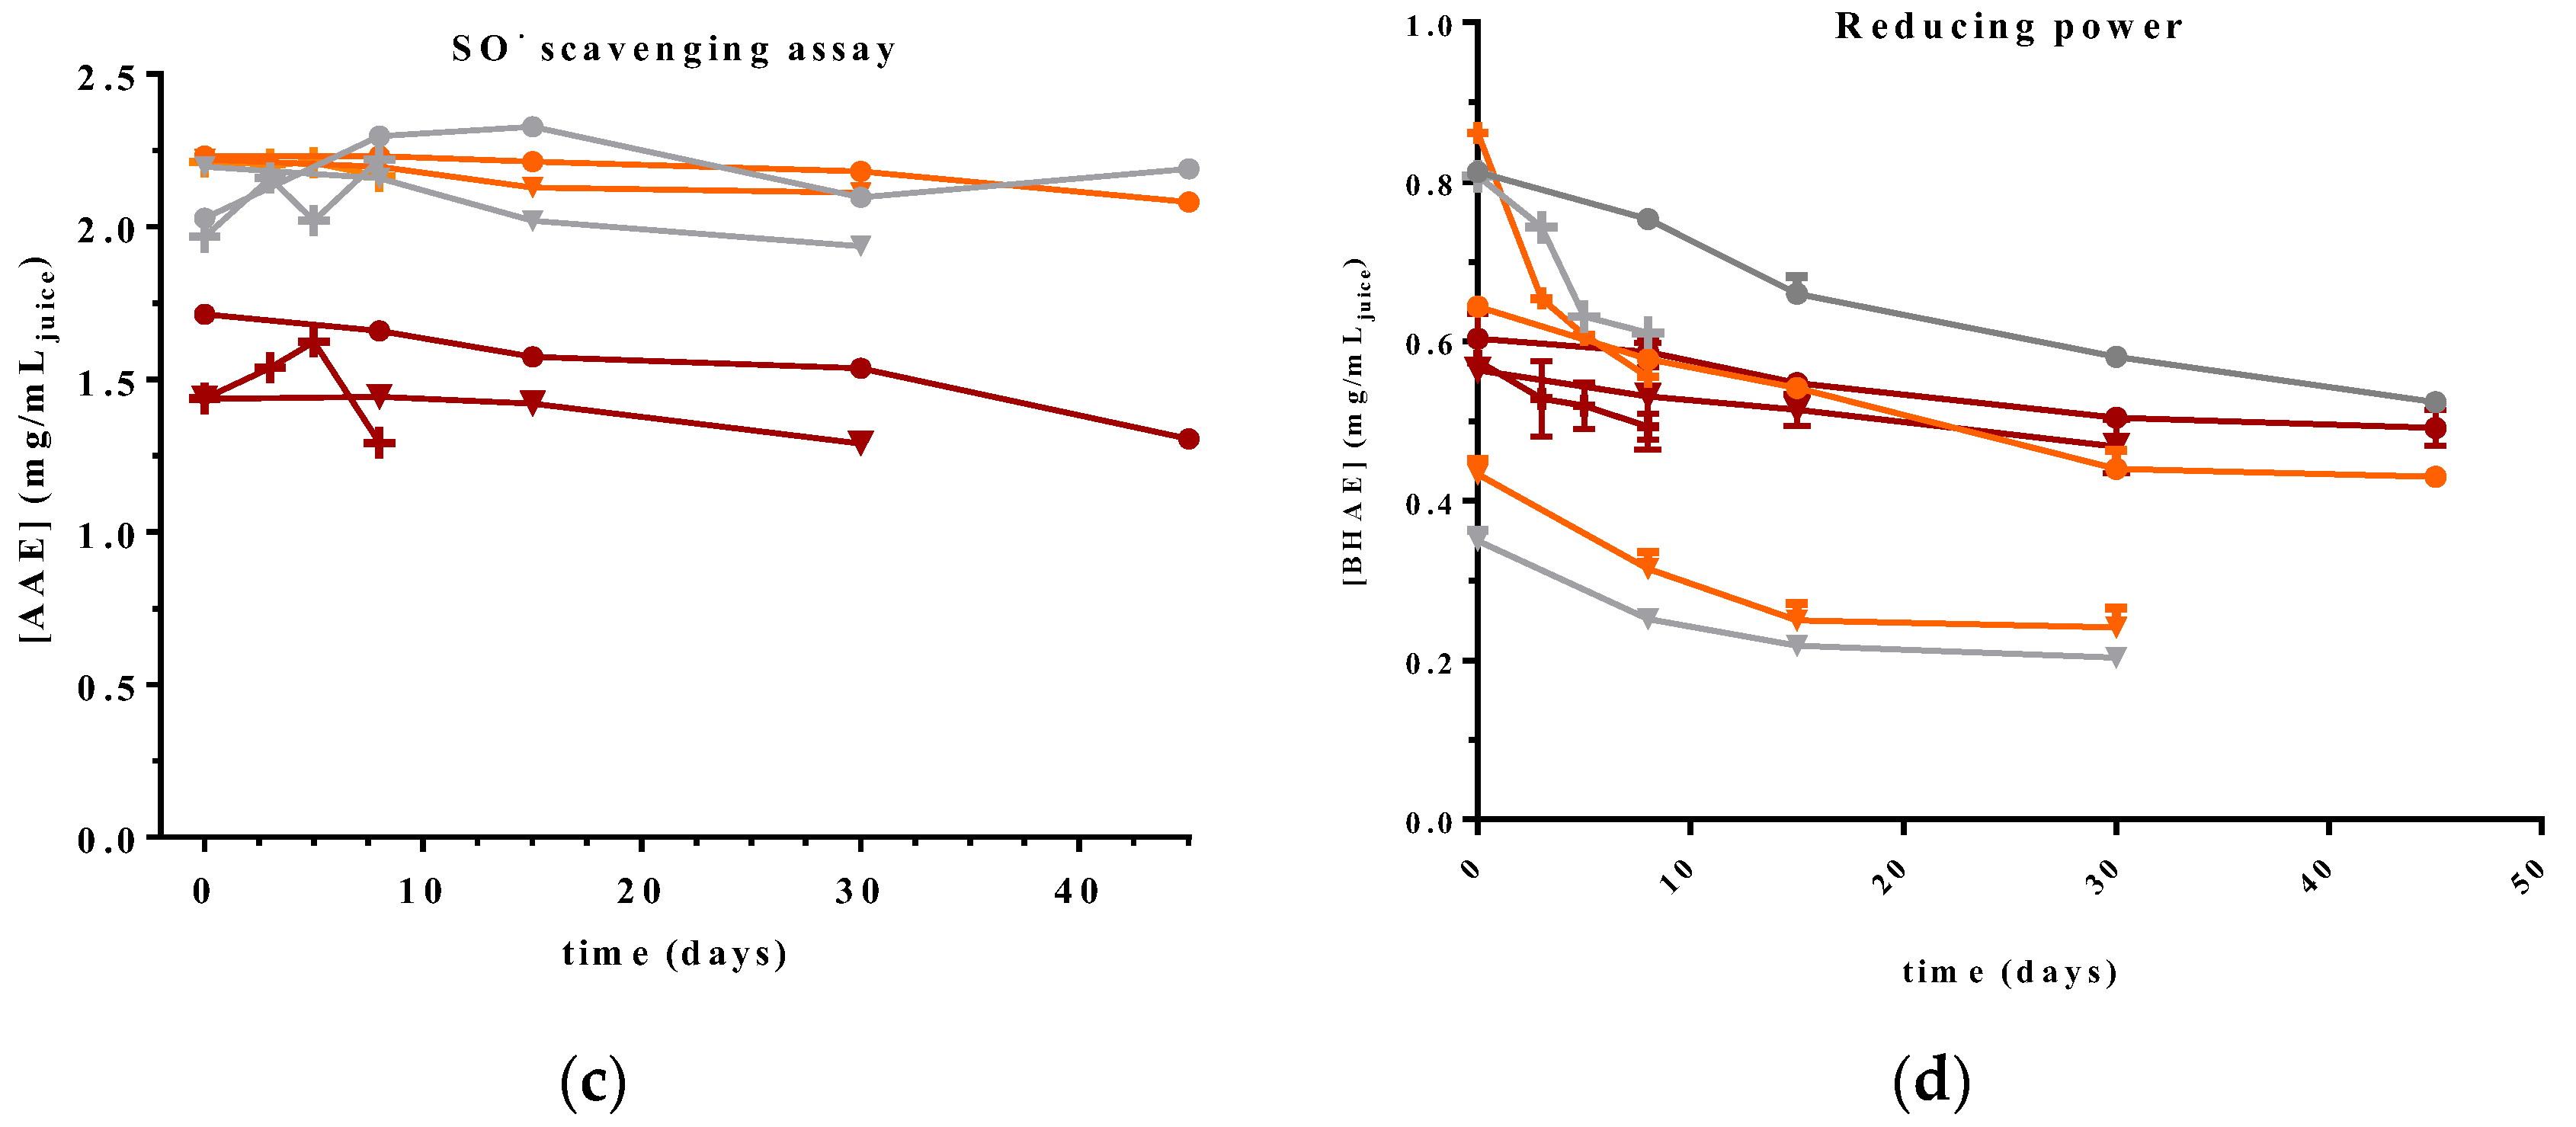
3.6. Antioxidant Capacity

The antioxidant capacity of the juices was estimated through the colorimetric methods ABTS+, NO, and SO, to evaluate their radical scavenging capacity, and the reducing power assay to estimate their capacity to reduce Fe3+ to Fe2+.
Overall, the gathered results demonstrated that the application of different pasteurization methods to the three different juices did not cause significant variations in the ABTS•+, NO, and SO methods (Figure 6). Nevertheless, a small but general tendency toward a decrease in the capacity to scavenge these radicals could be observed over time. As for reducing power, the antioxidant capacity decreased over storage time with lower effects on the ‘Rossa’ cv. These results can be explained by the variation in the TPC and betalains present. The decrease in the concentrations of these compounds could explain the slight tendency toward decreasing antioxidant capacity in Opuntia juices, as was observed by Yung-Sheng Lin et al. for juices of Momordica charantia L. and Momordica charantia L. var. abbreviata, where during storage the reduction in phenolic and flavonoid compounds was accompanied by a slight decrease in the capacity to scavenge DPPH and ABTS radicals and a more pronounced variation in the capacity to reduce Fe3+ to Fe2+ [67].
Moreover, the impact of the different pasteurization methods was studied by other authors that had similar results to the ones obtained in this work, reporting that both thermal and high-pressure pasteurization did not have a significant effect on the antioxidant capacity of many fruit and vegetable products [75]. Similarly, prickly pears from the ‘Orito’ cultivar cultivated in Alicante, Spain, and stored under low temperatures (2 °C) were able to maintain their antioxidant capacity during 28 days of storage [76].

3.7. Principal Component Analysis (PCA)

PCA is a technique for reducing the dimensionality of large datasets, increasing their interpretability but at the same time minimizing the loss of information. It works by creating new uncorrelated variables that successively maximize variance, allowing the user to correlate larger datasets. The PCA obtained from O. ficus-indica juices from the three different cultivars during storage, after the two pasteurization methods and comparing with the non-pasteurized samples, is depicted in Figure 7. The distinct clusters presented allow the conclusion that the application of these different pasteurization techniques has little impact on the variation detected in the previously reported results. This can also be observed in Figure S1 (Supplementary Materials), which represents PCA applied to the different pasteurization methods, with no clear groupings being perceptible. Moreover, it can be observed that the clusters are mainly due to the difference in composition of the different cultivars, which had a higher influence on the results obtained. So, in conclusion, the use of different pasteurization methods does not impact the physico-chemical and nutritional characteristics of prickly pear juices during storage, but the differences in the composition of each cultivar significantly impacts the storage of these juices. In fact, preliminary consumer perception data indicated that the global appearance of the prickly pear juices from the three cultivars was clearly distinguishable in terms of their color, odor, and taste, while no significant changes were noticed between non-pasteurized samples and the respective treated samples, just after processing. Nevertheless, a slight decrease in viscosity was reported for the HPP samples that represented a change in texture, possibly due to the breakage of some cell walls as a result of the increase and decrease in pressure during pasteurization [77].

4. Conclusions

The high-pressure processing of prickly pear juices from the cultivars ‘Rossa’, ‘Gialla’, and ‘Bianca’ reduced the yeast and mold and enterobacteria counts to levels of no detection and reduce approximately 2 log of the total psychrophile cell counts, compared with the most common thermal pasteurization method used for premium juices. As a result, HPP treatment allowed extending the shelf-life of juices by 22 and 52 days, when compared to thermal pasteurized and raw samples, respectively. Moreover, HPP also proved to be more effective in reducing the effects of storage time on the total soluble solids and titratable acidity, which are relevant parameters related to consumers’ acceptance of the final product while maintaining, for the duration of the experiment, similar polyphenolic contents and antioxidant capacities. So, this technology was demonstrated to be a promising alternative to heat treatments that allows the processing of fruit products with good quality. In general, despite the similarities in the physico-chemical characteristics of all the cultivars, the juices from cv ‘Gialla’ possessed superior overall qualities.

Supplementary Materials

The following are available online at https://www.mdpi.com/article/10.3390/beverages8040084/s1, Figure S1: Principal components analysis (PCA) of Opuntia ficus-indica cv ‘Rossa’ (red juice), cv ‘Gialla’ (orange juice), and cv ‘Bianca’ (white juice) for non-pasteurized (green) samples and the two processing methods (High-pressure processing (blue), and Thermal pasteurization (red), showing the correlation between the different treatments and the physico-chemical and nutritional characteristics of Opuntia ficus-indica cultivars.

Author Contributions

Conceptualization, R.M.F. and S.M.C.; methodology, R.M.F. and R.A.A.; software, R.A.A.; validation, R.M.F.; formal analysis, R.M.F.; investigation, R.M.F.; data curation, R.M.F.; writing—original draft preparation, R.M.F.; writing—review and editing, R.A.A., A.M.S.S., S.M.C. and J.A.S.; supervision, S.M.C. and J.A.S. All authors have read and agreed to the published version of the manuscript.

Funding

This work received financial support from PT national funds (FCT/MCTES, Fundação para a Ciência e Tecnologia and Ministério da Ciência, Tecnologia e Ensino Superior) through the projects UIDB/50006/2020 and UIDP/50006/2020. Thank you to FCT for the PhD granted to Ricardo M. Ferreira (SFRH/BD/137057/2018) and Renata A. Amaral (SFRH/BD/146009/2019).

Data Availability Statement

The data that support the findings of this study are available within the article.

Acknowledgments

We acknowledge the company Figo d’ Idanha for supplying us with the raw material used in the development of this work.

Conflicts of Interest

The authors declare no conflict of interest.

References

  1. Feugang, J.M.; Konarski, P.; Zou, D.; Stintzing, F.C.; Zou, C. Nutritional and medicinal use of Cactus pear (Opuntia spp.) cladodes and fruits. Front. Biosci. 2006, 11, 2574–2589. [Google Scholar] [CrossRef] [PubMed]
  2. Neupane, D.; Mayer, J.A.; Niechayev, N.A.; Bishop, C.D.; Cushman, J.C. Five-year field trial of the biomass productivity and water input response of cactus pear (Opuntia spp.) as a bioenergy feedstock for arid lands. GCB Bioenergy 2021, 13, 719–741. [Google Scholar] [CrossRef]
  3. Jiménez-Aguilar, D.M.; López-Martínez, J.M.; Hernández-Brenes, C.; Gutiérrez-Uribe, J.A.; Welti-Chanes, J. Dietary fiber, phytochemical composition and antioxidant activity of Mexican commercial varieties of cactus pear. J. Food Compos. Anal. 2015, 41, 66–73. [Google Scholar] [CrossRef]
  4. Barba, F.J.; Putnik, P.; Bursać Kovačević, D.; Poojary, M.M.; Roohinejad, S.; Lorenzo, J.M.; Koubaa, M. Impact of conventional and non-conventional processing on prickly pear (Opuntia spp.) and their derived products: From preservation of beverages to valorization of by-products. Trends Food Sci. Technol. 2017, 67, 260–270. [Google Scholar] [CrossRef]
  5. Verón, H.E.; Di Risio, H.D.; Isla, M.I.; Torres, S. Isolation and selection of potential probiotic lactic acid bacteria from Opuntia ficus-indica fruits that grow in Northwest Argentina. LWT-Food Sci. Technol. 2017, 84, 231–240. [Google Scholar] [CrossRef]
  6. Sáenz, C.; Sepúlveda, E. Cactus-Pear Juices. J. Prof. Assoc. Cactus Dev. 2001, 4, 3–10. [Google Scholar]
  7. Jaramillo-Flores, M.E.; González-Cruz, L.; Cornejo-Mazón, M.; Dorantes-álvarez, L.; Gutiérrez-López, G.F.; Hernández-Sánchez, H. Effect of Thermal Treatment on the Antioxidant Activity and Content of Carotenoids and Phenolic Compounds of Cactus Pear Cladodes (Opuntia ficus-indica). Food Sci. Technol. Int. 2003, 9, 271–278. [Google Scholar] [CrossRef]
  8. Cruz-Cansino, N.D.S.; Montiel-Columna, N.I.; Bautista-Velueta, P.G.; Pérez-Tinoco, M.R.; Alanís-García, E.; Ramírez-Moreno, E. Optimization of Thermoultrasound Conditions for the Processing of A Prickly Pear Juice Blend (Opuntia Ficus Indica) Using Response Surface Methodology. J. Food Qual. 2016, 39, 780–791. [Google Scholar] [CrossRef]
  9. de Albuquerque, J.G.; Escalona-Buendía, H.B.; de Magalhães Cordeiro, A.M.T.; dos Santos Lima, M.; de Souza Aquino, J.; da Silva Vasconcelos, M.A. Ultrasound treatment for improving the bioactive compounds and quality properties of a Brazilian nopal (Opuntia ficus-indica) beverage during shelf-life. LWT-Food Sci. Technol. 2021, 149, 111814. [Google Scholar] [CrossRef]
  10. Moussa-Ayoub, T.E.; Jäger, H.; Knorr, D.; El-Samahy, S.K.; Kroh, L.W.; Rohn, S. Impact of pulsed electric fields, high hydrostatic pressure, and thermal pasteurization on selected characteristics of Opuntia dillenii cactus juice. LWT-Food Sci. Technol. 2017, 79, 534–542. [Google Scholar] [CrossRef]
  11. Felker, P.; Stintzing, F.C.; Müssig, E.; Leitenberger, M.; Carle, R.; Vogt, T.; Bunch, R. Colour inheritance in cactus pear (Opuntia ficus-indica) fruits. Ann. Appl. Biol. 2008, 152, 307–318. [Google Scholar] [CrossRef]
  12. Santos, C.D.; Ismail, M.; Cassini, A.S.; Marczak, L.D.F.; Tessaro, I.C.; Farid, M. Effect of thermal and high pressure processing on stability of betalain extracted from red beet stalks. J. Food Sci. Technol. 2018, 55, 568–577. [Google Scholar] [CrossRef] [PubMed]
  13. Castro, S.M.; Saraiva, J.A. High-pressure processing of fruits and fruit products. In Emerging Technologies for Food Processing; Elsevier Science & Technology: Amsterdam, The Netherlands, 2014; pp. 65–76. ISBN 9780124114791. [Google Scholar]
  14. Ashurst, P. The stability and shelf life of fruit juices and soft drinks. In The Stability and Shelf Life of Food; Elsevier Ltd.: Ludlow, VT, USA, 2016; pp. 347–374. ISBN 9780081004357. [Google Scholar]
  15. Timmermans, R.A.H.; Mastwijk, H.C.; Knol, J.J.; Quataert, M.C.J.; Vervoort, L.; Van der Plancken, I.; Hendrickx, M.E.; Matser, A.M. Comparing equivalent thermal, high pressure and pulsed electric field processes for mild pasteurization of orange juice. Part I: Impact on overall quality attributes. Innov. Food Sci. Emerg. Technol. 2011, 12, 235–243. [Google Scholar] [CrossRef]
  16. Horwitz, W.; Latimer, G.W.; International, A. Official Methods of Analysis of AOAC International; CD-ROM; AOAC International: Gaithersburg, MA, USA, 2005. [Google Scholar]
  17. Bell, L.N.; Park, Y.W. Determination of moisture and ash Contents of Foods. In Handbook of Food Analysis; CRC Press: New York, NY, USA, 2004; pp. 55–82. ISBN 082475039X. [Google Scholar]
  18. Dubois, M.; Gilles, K.A.; Hamilton, J.K.; Rebers, P.A.; Smith, F. Colorimetric Method for Determination of Sugars and Related Substances. Anal. Chem. 1956, 28, 350–356. [Google Scholar] [CrossRef]
  19. Miller, G.L. Use of dinitrosalicylic acid reagent for determination of reducing sugar. Anal. Chem. 1959, 31, 426–428. [Google Scholar] [CrossRef]
  20. Singleton, V.L.; Rossi, J.A. Colorimetry of total phenolics with phosphomolybdic-phosphotungstic acid reagents. Am. J. Enol. Vitic. 1965, 16, 144–158. [Google Scholar]
  21. Stintzing, F.C.; Herbach, K.M.; Mosshammer, M.R.; Carle, R.; Yi, W.; Sellappan, S.; Akoh, C.C.; Bunch, R.; Felker, P. Color, betalain pattern, and antioxidant properties of cactus pear (Opuntia spp.) clones. J. Agric. Food Chem. 2005, 53, 442–451. [Google Scholar] [CrossRef] [PubMed]
  22. Ferreira, S.S.; Monteiro, F.; Passos, C.P.; Silva, A.M.S.; Wessel, D.F.; Coimbra, M.A.; Cardoso, S.M. Blanching impact on pigments, glucosinolates, and phenolics of dehydrated broccoli by-products. Food Res. Int. 2020, 132, 109055. [Google Scholar] [CrossRef]
  23. Pinto, C.; Moreira, S.A.; Fidalgo, L.G.; Santos, M.D.; Vidal, M.; Delgadillo, I.; Saraiva, J.A. Impact of different hyperbaric storage conditions on microbial, physicochemical and enzymatic parameters of watermelon juice. Food Res. Int. 2017, 99, 123–132. [Google Scholar] [CrossRef]
  24. Amarante, S.J.; Catarino, M.D.; Marçal, C.; Silva, A.M.S.; Ferreira, R.; Cardoso, S.M. Microwave-Assisted Extraction of Phlorotannins from Fucus vesiculosus. Mar. Drugs 2020, 18, 559. [Google Scholar] [CrossRef]
  25. Catarino, M.D.; Silva, A.; Cruz, M.T.; Mateus, N.; Silva, A.M.S.; Cardoso, S.M. Phlorotannins from fucus vesiculosus: Modulation of inflammatory response by blocking nf-κb signaling pathway. Int. J. Mol. Sci. 2020, 21, 6897. [Google Scholar] [CrossRef] [PubMed]
  26. Corbo, M.R.; Altieri, C.; D’Amato, D.; Campaniello, D.; Del Nobile, M.A.; Sinigaglia, M. Effect of temperature on shelf life and microbial population of lightly processed cactus pear fruit. Postharvest Biol. Technol. 2004, 31, 93–104. [Google Scholar] [CrossRef]
  27. Cansino, N.C.; Carrera, G.P.; Rojas, Q.Z.; Olivares, L.D.; García, E.A.; Moreno, E.R. Ultrasound Processing on Green Cactus Pear (Opuntia ficus Indica) Juice: Physical, Microbiological and Antioxidant Properties. J. Food Process. Technol. 2013, 4. [Google Scholar]
  28. Del Socorro Cruz-Cansino, N.; Ramírez-Moreno, E.; León-Rivera, J.E.; Delgado-Olivares, L.; Alanís-García, E.; Ariza-Ortega, J.A.; De Jesús Manríquez-Torres, J.; Jaramillo-Bustos, D.P. Shelf life, physicochemical, microbiological and antioxidant properties of purple cactus pear (Opuntia ficus indica) juice after thermoultrasound treatment. Ultrason. Sonochem. 2015, 27, 277–286. [Google Scholar] [CrossRef]
  29. Karabagias, V.K.; Karabagias, I.K.; Gatzias, I.; Riganakos, K.A. Characterization of prickly pear juice by means of shelf life, sensory notes, physicochemical parameters and bio-functional properties. J. Food Sci. Technol. 2019, 56, 3646–3659. [Google Scholar] [CrossRef]
  30. Madadi, E.; Mazloum-Ravasan, S.; Yu, J.S.; Ha, J.W.; Hamishehkar, H.; Kim, K.H. Therapeutic application of betalains: A review. Plants 2020, 9, 1219. [Google Scholar] [CrossRef]
  31. Cota-Sánchez, J.H. Nutritional Composition of the Prickly Pear (Opuntia ficus-indica) Fruit. In Nutritional Composition of Fruit Cultivars; Elsevier: Amsterdam, The Netherlands, 2015; pp. 691–712. ISBN 9780124081178. [Google Scholar]
  32. Gurrieri, S.; Miceli, L.; Maria Lanza, C.; Tomaselli, F.; Bonomo, R.P.; Rizzarelli, E. Chemical characterization of sicilian prickly pear (Opuntia ficus indica) and perspectives for the storage of its juice. J. Agric. Food Chem. 2000, 48, 5424–5431. [Google Scholar] [CrossRef]
  33. Sawaya, W.N.; Khatchadourian, H.A.; Safi, W.M.; Al-Muhammad, H.M. Chemical characterization of prickly pear pulp, Opuntia ficus-indica, and the manufacturing of prickly pear jam. Int. J. Food Sci. Technol. 1983, 18, 183–193. [Google Scholar] [CrossRef]
  34. Chandran, J.; Nisha, P.; Singhal, R.S.; Pandit, A.B. Degradation of colour in beetroot (Beta vulgaris L.): A kinetics study. J. Food Sci. Technol. 2014, 51, 2678–2684. [Google Scholar] [CrossRef] [Green Version]
  35. Herbach, M.K.; Stintzing, F.C.; Carle, R. Thermal degradation of betacyanins in juices from purple pitaya [Hylocereus polyrhizus (Weber) Brittonv & Rose] monitored by high-performance liquid chromatography-tandem mass spectometric analyses. Eur. Food Res. Technol. 2004, 219, 377–385. [Google Scholar]
  36. Liu, F.; Zhang, X.; Zhao, L.; Wang, Y.; Liao, X. Potential of high-pressure processing and high-temperature/short-time thermal processing on microbial, physicochemical and sensory assurance of clear cucumber juice. Innov. Food Sci. Emerg. Technol. 2016, 34, 51–58. [Google Scholar] [CrossRef]
  37. Sadler, G.D.; Murphy, P.A. pH and Titratable Acidity. In Foan; Springer: Boston, MA, USA, 2010; pp. 219–238. [Google Scholar]
  38. Naraian, R.; Kumari, S. Microbial production of organic acids. In Progress in Industrial Microbiology; Elsevier Science: Amsterdam, The Netherlands, 1995; Volume 33, pp. 249–272. [Google Scholar]
  39. Palmeri, R.; Parafati, L.; Arena, E.; Grassenio, E.; Restuccia, C.; Fallico, B. Antioxidant and antimicrobial properties of semi-processed frozen prickly pear juice as affected by cultivar and harvest time. Foods 2020, 9, 235. [Google Scholar] [CrossRef] [PubMed] [Green Version]
  40. Khandpur, P.; Gogate, P.R. Effect of novel ultrasound based processing on the nutrition quality of different fruit and vegetable juices. Ultrason. Sonochem. 2015, 27, 125–136. [Google Scholar] [CrossRef] [PubMed]
  41. Queirós, R.P.; Rainho, D.; Santos, M.D.; Fidalgo, L.G.; Delgadillo, I.; Saraiva, J.A. High pressure and thermal pasteurization effects on sweet cherry juice microbiological stability and physicochemical properties. High Press. Res. 2015, 35, 69–77. [Google Scholar] [CrossRef]
  42. Barba, F.J.; Esteve, M.J.; Frígola, A. High Pressure Treatment Effect on Physicochemical and Nutritional Properties of Fluid Foods During Storage: A Review. Compr. Rev. Food Sci. Food Saf. 2012, 11, 307–322. [Google Scholar] [CrossRef]
  43. Teodorowicz, M.; van Neerven, J.; Savelkoul, H. Food processing: The influence of the Maillard Reaction on immunogenicity and allergenicity of food proteins. Nutrients 2017, 9, 835. [Google Scholar] [CrossRef] [Green Version]
  44. Taranto, F.; Pasqualone, A.; Mangini, G.; Tripodi, P.; Miazzi, M.M.; Pavan, S.; Montemurro, C. Polyphenol oxidases in crops: Biochemical, physiological and genetic aspects. Int. J. Mol. Sci. 2017, 18, 377. [Google Scholar] [CrossRef] [Green Version]
  45. Albano, C.; Negro, C.; Tommasi, N.; Gerardi, C.; Mita, G.; Miceli, A.; de Bellis, L.; Blando, F. Betalains, phenols and antioxidant capacity in cactus pear [opuntia ficus-indica (L.) mill.] fruits from Apulia (South Italy) genotypes. Antioxidants 2015, 4, 269–280. [Google Scholar] [CrossRef]
  46. Herbach, K.M.; Stintzing, F.C.; Carle, R. Betalain stability and degradation—Structural and chromatic aspects. J. Food Sci. 2006, 71, 41–50. [Google Scholar] [CrossRef]
  47. Zhang, C.; Trierweiler, B.; Li, W.; Butz, P.; Xu, Y.; Rüfer, C.E.; Ma, Y.; Zhao, X. Comparison of thermal, ultraviolet-c, and high pressure treatments on quality parameters of watermelon juice. Food Chem. 2011, 126, 254–260. [Google Scholar] [CrossRef]
  48. Sin, H.N.; Yusof, S.; Hamid, N.S.A.; Rahman, R.A. Optimization of enzymatic clarification of sapodilla juice using response surface methodology. J. Food Eng. 2006, 73, 313–319. [Google Scholar] [CrossRef]
  49. Queirós, R.P.; Santos, M.D.; Fidalgo, L.G.; Mota, M.J.; Lopes, R.P.; Inácio, R.S.; Delgadillo, I.; Saraiva, J.A. Hyperbaric storage of melon juice at and above room temperature and comparison with storage at atmospheric pressure and refrigeration. Food Chem. 2014, 147, 209–214. [Google Scholar] [CrossRef] [PubMed]
  50. Eagerman, B.A.; Rouse, A.H. Heat Inactivation Temperature-Time Relationships for Pectinesterase Inactivation in Citrus Juices. J. Food Sci. 1976, 41, 1396–1397. [Google Scholar] [CrossRef]
  51. Kubo, M.T.K.; Augusto, P.E.D.; Cristianini, M. Effect of high pressure homogenization (HPH) on the physical stability of tomato juice. Food Res. Int. 2013, 51, 170–179. [Google Scholar] [CrossRef]
  52. Mgaya-Kilima, B.; Remberg, S.F.; Chove, B.E.; Wicklund, T. Influence of storage temperature and time on the physicochemical and bioactive properties of roselle-fruit juice blends in plastic bottle. Food Sci. Nutr. 2014, 2, 181–191. [Google Scholar] [CrossRef] [PubMed]
  53. Dehbi, F.; Hasib, A.; Ouatmane, A.; Elbatal, H.; Jaouad, A. Physicochemical Characteristics of Moroccan Prickly Pear Juice (Opuntia ficus indica L.). Int. J. Emerg. Technol. Adv. Eng. 2005, 9001, 300–306. [Google Scholar]
  54. Okokon, E.J.; Okokon, E.O. Proximate analysis and sensory evaluation of freshly produced apple fruit juice stored at different temperatures and treated with natural and artificial preservatives. Glob. J. Pure Appl. Sci. 2019, 25, 31. [Google Scholar] [CrossRef]
  55. Jiménez-Aguilar, D.M.; Escobedo-Avellaneda, Z.; Martín-Belloso, O.; Gutiérrez-Uribe, J.; Valdez-Fragoso, A.; García-García, R.; Torres, J.A.; Welti-Chanes, J. Effect of High Hydrostatic Pressure on the Content of Phytochemical Compounds and Antioxidant Activity of Prickly Pears (Opuntia ficus-indica) Beverages. Food Eng. Rev. 2015, 7, 198–208. [Google Scholar] [CrossRef]
  56. Eroglu, E.C.; Arslan, R.; Güleç, A.; Aksay, S. Determination of physical and phytochemical properties of prickly pear (Opuntia ficus-indica L.). J. Food Process. Preserv. 2021, e15990. [Google Scholar] [CrossRef]
  57. Bulegon, R.; de Almeida Gomes, G.; Rigo, E. Influence of the Pasteurization Conditions on Sugarcane Juice Packaged in Glass Packaging. Rev. Congr. Bras. Eng. Aliment. 2019, 4, 12–22. [Google Scholar] [CrossRef] [Green Version]
  58. Bianchi, F.; Pünsch, M.; Venir, E. Effect of processing and storage on the quality of beetroot and apple mixed juice. Foods 2021, 10, 1052. [Google Scholar] [CrossRef] [PubMed]
  59. Maria de Fátima, D.L.; Alves Filho, E.G.; Silva, L.M.A.; Fonteles, T.V.; Wurlitzer, N.J.; de Brito, E.S.; Fernandes, F.A.N.; Rodrigues, S. Thermal and non-thermal processing effect on açai juice composition. Food Res. Int. 2020, 136, 109506. [Google Scholar]
  60. De Roeck, A.; Sila, D.N.; Duvetter, T.; Van Loey, A.; Hendrickx, M. Effect of high pressure/high temperature processing on cell wall pectic substances in relation to firmness of carrot tissue. Food Chem. 2008, 107, 1225–1235. [Google Scholar] [CrossRef]
  61. Wei, H.; He, C.; Zhang, S.; Xiong, H.; Ni, H.; Li, Q. Effects of four storage conditions on the sugar content, acidity, and flavor of “Guanxi” honey pomelo. J. Food Process. Preserv. 2021, 45, e15088. [Google Scholar] [CrossRef]
  62. Belitz, H.; Grosh, W. Food Chemistry, 2nd ed.; Springer: Berlin/Heidelberg, Germany, 1999; Volume 53, ISBN 9788578110796. [Google Scholar]
  63. Pimienta-Barrios, E. Prickly pear (Opuntia spp.): A valuable fruit crop for the semi-arid lands of Mexico. J. Arid Environ. 1994, 28, 1–11. [Google Scholar] [CrossRef]
  64. Sawicki, T.; Wiczkowski, W. The effects of boiling and fermentation on betalain profiles and antioxidant capacities of red beetroot products. Food Chem. 2018, 259, 292–303. [Google Scholar] [CrossRef]
  65. Mata, A.; Ferreira, J.P.; Semedo, C.; Serra, T.; Duarte, C.M.M.; Bronze, M.R. Contribution to the characterization of Opuntia spp. juices by LC-DAD-ESI-MS/MS. Food Chem. 2016, 210, 558–565. [Google Scholar] [CrossRef]
  66. Tokuşoǧlu, Ö. Effect of high hydrostatic pressure processing strategies on retention of antioxidant phenolic bioactives in foods and beverages—A review. Pol. J. Food Nutr. Sci. 2016, 66, 243–251. [Google Scholar] [CrossRef]
  67. Chen, C.; Chang, M.; Huang, S. Effects of storage time and temperature on antioxidants in juice from Momordica charantia L. and Momordica charantia L. var. abbreviata Ser. Molecules 2020, 25, 3614. [Google Scholar]
  68. Chavez-Santoscoy, R.A.; Gutierrez-Uribe, J.A.; Serna-Saldívar, S.O. Phenolic composition, antioxidant capacity and in vitro cancer cell cytotoxicity of nine prickly pear (Opuntia spp.) juices. Plant Foods Hum. Nutr. 2009, 64, 146–152. [Google Scholar] [CrossRef]
  69. Techakanon, C.; Sirimuangmoon, C. The Effect of Pasteurization and Shelf Life on the Physicochemical, Microbiological, Antioxidant, and Sensory Properties of Rose Apple Cider during Cold Storage. Beverages 2020, 6, 43. [Google Scholar] [CrossRef]
  70. Wang, L.; Deng, W.; Wang, P.; Huang, W.; Wu, J.; Zheng, T.; Chen, J. Degradations of aroma characteristics and changes of aroma related compounds, PPO activity, and antioxidant capacity in sugarcane juice during thermal process. J. Food Sci. 2020, 85, 1140–1150. [Google Scholar] [CrossRef] [PubMed]
  71. Zawawi, N.A.F.; Hazmi, N.A.M.; How, M.S.; Kantono, K.; Silva, F.V.M.; Sulaiman, A. Thermal, High Pressure, and Ultrasound Inactivation of Various Fruit Cultivars’ Polyphenol Oxidase: Kinetic Inactivation Models and Estimation of Treatment Energy Requirement. Appl. Sci. 2022, 12, 1864. [Google Scholar] [CrossRef]
  72. Houška, M.; Silva, F.V.M.; Evelyn; Buckow, R.; Terefe, N.S.; Tonello, C. High Pressure Processing Applications in Plant Foods. Foods 2022, 11, 223. [Google Scholar] [CrossRef] [PubMed]
  73. Chisari, M.; Barbagallo, R.N.; Spagna, G. Characterization of polyphenol oxidase and peroxidase and influence on browning of cold stored strawberry fruit. J. Agric. Food Chem. 2007, 55, 3469–3476. [Google Scholar] [CrossRef] [PubMed]
  74. Hirsch, A.R.; Förch, K.; Neidhart, S.; Wolf, G.; Carle, R. Effects of thermal treatments and storage on pectin methylesterase and peroxidase activity in freshly squeezed orange juice. J. Agric. Food Chem. 2008, 56, 5691–5699. [Google Scholar] [CrossRef]
  75. Pérez-Lamela, C.; Franco, I.; Falqué, E. Impact of high-pressure processing on antioxidant activity during storage of fruits and fruit products: A review. Molecules 2021, 26, 5265. [Google Scholar] [CrossRef]
  76. Andreu-Coll, L.; García-Pastor, M.E.; Valero, D.; Amorós, A.; Almansa, M.S.; Legua, P.; Hernández, F. Influence of storage on physiological properties, chemical composition, and bioactive compounds on cactus pear fruit (Opuntia ficus-indica (l.) mill.). Agriculture 2021, 11, 62. [Google Scholar] [CrossRef]
  77. Gonzalez, M.E.; Barrett, D.M. Thermal, high pressure, and electric field processing effects on plant cell membrane integrity and relevance to fruit and vegetable quality. J. Food Sci. 2010, 75, R121–R130. [Google Scholar] [CrossRef]
Figure 1. Evaluation of the total aerobic psychrophiles (blue), Enterobacteriaceae (red) and yeast and mold (green) counts (expressed in Log10 CFU/mL) in juices of O. ficus-indica cultivars: (a) ‘Rossa’ (red juice); (b) ‘Gialla’ (orange juice); and (c) ‘Bianca’ (white juice) (non-pasteurized—□, pasteurized with pressure—●, pasteurized with temperature—▼, unfit for consumption (6.0 log)—••••, and below the detection limit—----). Samples of Enterobacteriaceae and yeasts and molds for both HP and thermal pasteurization were below the detection limit (1.0 log) and are not represented in the graph. Results are expressed as averages ± SD.
Beverages 08 00084 g001
Figure 2. Evaluation of the (a) pH and (b) titratable acidity in juices of O. ficus-indica versus storage time for non-pasteurized samples (raw (□)) and the two processing methods (high-pressure processing (●) and thermal pasteurization (▼)). Cv ‘Rossa’ (red juice) in red (), cv ‘Gialla’ (orange juice) in orange, () and cv ‘Bianca’ (white juice) in gray (). Results are expressed as averages ± SD.
Beverages 08 00084 g002
Figure 3. Variation in (a) total soluble solids (°Brix); (b) browning degree and (c) cloudiness versus storage time in prickly pear non-pasteurized samples (raw (□)) and the two processing methods (high-pressure processing (●) and thermal pasteurization (▼)). Cv ‘Rossa’ (red juice) in red (), cv ‘Gialla’ (orange juice) in orange () and cv ‘Bianca’ (white juice) in gray (). Results are expressed as averages ± SD.
Beverages 08 00084 g003
Figure 4. Variation in (a) total sugar content and (b) reducing sugar content over storage time in prickly pear non-pasteurized samples (raw (□)) and the two processing methods (high-pressure processing (●) and thermal pasteurization (▼)). cv ‘Rossa’ (red juice) in red (), cv ‘Gialla’ (orange juice) in orange () and cv ‘Bianca’ (white juice) in gray (). Results are expressed as averages ± SD.
Beverages 08 00084 g004
Figure 5. Variation in (a) total phenolic compounds and (b) total betalains over storage time in prickly pear non-pasteurized samples (raw (+)) and the two processing methods (high-pressure processing (●) and thermal pasteurization (▼)). Cv ‘Rossa’ (red juice) in red (), cv ‘Gialla’ (orange juice) in orange () and cv ‘Bianca’ (white juice) in gray (). Results are expressed as averages ± SD.
Beverages 08 00084 g005
Figure 6. Variation in the antioxidant capacity of Opuntia juices presented in gallic acid equivalents and given by the (a) ABTS•+, (b) NO, (c) SO and (d) reducing power assays over storage time in prickly pear non-pasteurized samples (raw (+)) and the two processing methods (high-pressure processing (●) and thermal pasteurization (▼)). Cv ‘Rossa’ (red juice) in red (), cv ‘Gialla’ (orange juice) in orange (), and cv ‘Bianca’ (white juice) in gray (). Results are expressed as averages ± SD.
Beverages 08 00084 g006aBeverages 08 00084 g006b
Figure 7. Principal components analysis (PCA) of Opuntia ficus-indica cv ‘Rossa’(red juice) in red, cv ‘Gialla’ (orange juice) in orange, and cv ‘Bianca’ (white juice) in blue, for non-pasteurized samples and the two pasteurization methods (high-pressure processing and thermal pasteurization) showing the correlation between the different cultivars and the different physico-chemical and nutritional characteristics of Opuntia ficus-indica.
Beverages 08 00084 g007
Table 1. Variation in nutritional parameters (moisture, ash and total dietary fiber (%)) of three juices of prickly pear—cv ‘Rossa’ (red juice), cv ‘Gialla’ (orange juice), and cv ‘Bianca’ (white juice) over storage time for non-pasteurized (NP) samples and the two processing methods—high-pressure processing (HPP) and thermal pasteurization (TP). Results are expressed as averages ± SD.
Moisture (%)Ash (%)Total Dietary Fiber (%)
‘Rossa’‘Gialla’‘Bianca’‘Rossa’‘Gialla’‘Bianca’‘Rossa’‘Gialla’‘Bianca’
NPt087.24 ± 0.0286.73 ± 0.0187.92 ± 0.00.559 ± 0.0040.548 ± 0.0030.597 ± 0.00217.33 ± 0.0317.39 ± 0.0417.46 ± 0.02
t387.29 ± 0.0186.81 ± 0.0287.85 ± 0.020.501 ± 0.0030.521 ± 0.0020.556 ± 0.00617.15 ± 0.0717.12 ± 0.0917.35 ± 0.01
t587.31 ± 0.0386.75 ± 0.0187.79 ± 0.030.445 ± 0.0030.499 ± 0.0030.523 ± 0.00117.04 ± 0.0317.05 ± 0.0217.34 ± 0.03
TPt087.13 ± 0.0187.01 ± 0.0888.23 ± 0.020.470 ± 0.0050.586 ± 0.0090.582 ± 0.00717.29 ± 0.0117.41 ± 0.0217.45 ± 0.06
t886.98 ± 0.0386.92 ± 0.0388.19 ± 0.050.452 ± 0.0020.573 ± 0.0020.563 ± 0.00217.28 ± 0.0517.29 ± 0.0317.29 ± 0.03
t1587.03 ± 0.0386.89 ± 0.0687.99 ± 0.040.439 ± 0.0010.561 ± 0.0050.560 ± 0.00317.03 ± 0.0217.21 ± 0.0717.14 ± 0.01
t3087.21 ± 0.0687.03 ± 0.0288.07 ± 0.020.416 ± 0.0060.518 ± 0.0020.542 ± 0.00516.81 ± 0.0117.03 ± 0.0116.99 ± 0.02
HPPt087.23 ± 0.0487.00 ± 0.0188.05 ± 0.040.546 ± 0.0040.610 ± 0.0030.568 ± 0.00117.23 ± 0.0417.35 ± 0.0117.49 ± 0.06
t887.38 ± 0.0186.94 ± 0.0288.12 ± 0.050.525 ± 0.0020.595 ± 0.0020.542 ± 0.00217.18 ± 0.0817.21 ± 0.0317.33 ± 0.03
t1587.12 ± 0.0287.06 ± 0.0187.93 ± 0.030.515 ± 0.0050.580 ± 0.0080.519 ± 0.00217.02 ± 0.0217.09 ± 0.0717.17 ± 0.05
t3087.22 ± 0.0386.85 ± 0.0687.89 ± 0.050.481 ± 0.0060.572 ± 0.0060.503 ± 0.00216.92 ± 0.0516.95 ± 0.0617.05 ± 0.01
t4586.41 ± 0.0687.02 ± 0.0288.06 ± 0.060.460 ± 0.0060.564 ± 0.0010.491 ± 0.00916.63 ± 0.0216.81 ± 0.0216.92 ± 0.06
Table 2. Identification of the components detected in the chromatogram of Opuntia ficus-indica juices from cv ‘Rossa’ (red juice), cv ‘Gialla’ (orange juice), and cv ‘Bianca’ (white juice), at 280 nm, by UHPLC-DAD-ESI-MSn.
RT (min)λmax[M-H] (m/z)MS/MS (m/z)Identification
1.5245191209Quinic acid
1.5204, 242133115, 133Malic acid
1.8206, 253191111, 173Citric acid
3.7224, 274255165, 193Piscidic acid
6.3219, 278253177Not identified
8.6224, 272239179, 149Eucomic acid
10.8229, 270613405Syrinigil (t8-O-4) guaiacyl
11.4254, 352769315, 338Isorhamnetin glucosyl-di-rhamnoside
11.5254, 352755315Isorhamnetin pentosyl-rutinoside
12.1251, 351609315, 314Isorhamnetin pentosyl-hexoside
12.7254, 345623315Isorhamnetin-rutinoside
Table 3. Variation in the enzymatic activity of polyphenol oxidase (PPO), peroxidase (POD), and pectin methylesterase (PME) in three juices of prickly pear cv ‘Rossa’ (red juice), cv ‘Gialla’ (orange juice), and cv ‘Bianca’ (white juice) during storage of non-pasteurized (NP) samples and the two processing methods—high-pressure processing (HPP) and thermal pasteurization (TP). Results are expressed as averages ± SD.
PPOPME (VNaOH/min/mL)POD (U/mL)
‘Rossa’‘Gialla’‘Bianca’‘Rossa’‘Gialla’‘Bianca’‘Rossa’‘Gialla’‘Bianca’
NPt00.6790.6540.6310.4770.4520.4330.1950.1860.179
t30.6760.6510.6280.4550.4310.4130.1860.1770.171
t50.6600.6330.6110.4220.4000.3830.1720.1640.158
TPt00.4320.4120.4010.1040.0880.0790.0290.0210.019
t80.4300.4100.3990.0990.0830.0750.0260.0180.017
t150.4220.3990.3880.0920.0790.0710.0240.0170.015
t300.4190.3890.3760.0870.0730.0660.0190.0140.011
HPPt00.4190.4000.3860.0750.0660.0540.0180.0160.015
t80.4110.3920.3750.0700.0620.0500.0130.0120.011
t150.4020.3810.3680.0660.0580.0470.0120.0110.010
t300.3850.3770.3590.0610.0530.0430.0110.0100.009
t450.3740.3710.3490.0560.0490.0400.0100.0090.008
Publisher’s Note: MDPI stays neutral with regard to jurisdictional claims in published maps and institutional affiliations.

