Article

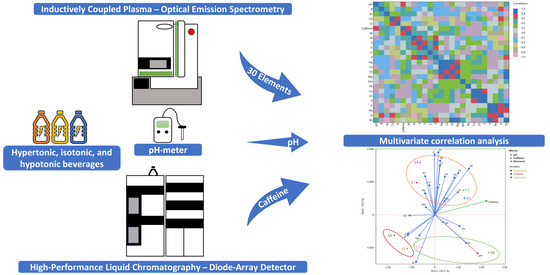
Determination of Caffeine and Elements in Hypertonic, Isotonic, and Hypotonic Beverages

by
Vassilis Athanasiadis
,
Theodoros Chatzimitakos
,
Dimitrios Kalompatsios
,
Martha Mantiniotou
,
Eleni Bozinou
and
Stavros I. Lalas
*
Department of Food Science and Nutrition, University of Thessaly, Terma N. Temponera Street, 43100 Karditsa, Greece
*
Author to whom correspondence should be addressed.
Beverages 2023, 9(3), 56; https://doi.org/10.3390/beverages9030056
Submission received: 28 May 2023 / Revised: 21 June 2023 / Accepted: 26 June 2023 / Published: 3 July 2023
(This article belongs to the Section Tea, Coffee, Water, and Other Non-Alcoholic Beverages)

Abstract

:
The study focused on the examination of eight commercial hypertonic, isotonic, and hypotonic beverage samples that were packaged in aluminum cans or polyethylene terephthalate (PET) bottles. The pH value, caffeine content, and concentration of thirty elements were determined. Caffeine quantification was performed by a high-performance liquid chromatography method. Element determination was conducted by using inductively coupled plasma–optical emission spectrometry. The results showed that pH values were much more acidic in all samples, ranging from 2.68 to 3.97. Caffeine concentrations ranged from 0.02–38.93 mg/100 mL between the samples and were found to be below the acceptable daily level (~400 mg) established by the relevant food regulatory authority. The measurable quantity of caffeine (~10 mg/100 mL) was found in two functional beverage samples where caffeine was labeled as an ingredient. Element concentration varied with statistically significant differences (p < 0.05) among all samples. Elements such as arsenic, cadmium, chromium, and lead were measured below the corresponding permissible levels set by the European Commission; however, daily consumption of functional beverages should be examined to deteriorate several health risks. Aluminum was quantified above the parametric value by 21 to 117% in the canned samples, whereas antimony was only measured in PET-bottled samples at approximately 3 μg/L. Multivariate methods were applied to investigate any possible correlation between the samples and the examined parameters. Strong positive correlations with statistically significant differences (R > 0.9, p < 0.05) were observed between zinc and copper and between calcium and silver. Finally, similarities and differences between the samples and the examined parameters resulted in satisfactory discrimination of them regarding not only their caffeine content but also their tonicity. Excessive consumption of functional beverages could represent a major public health issue due to elevated amounts of caffeine and elements. Consequently, the results of this research could facilitate the formulation of stricter standards in beverage consumption by revealing potential health hazards to consumers.

Graphical Abstract

1. Introduction

Functional food has been defined by the European Commission [1] as “a food that beneficially affects one or more target functions in the body beyond adequate nutritional effects in a way that is relevant to either an improved state of health and well-being and/or reduction of risk of disease. It is consumed as part of a normal food pattern. It is not a pill, a capsule or any form of dietary supplement”. This leads to an overall improvement in physical welfare as well as a lower chance of disease progression [2]. Beverages are the most popular type of functional food on the market; in fact, they match the demands of the consumers in terms of size, shape, storage, and the nutrients and bioactive substances they contain [3]. Functional beverages provide an appealing and efficient way to replenish electrolytes, carbohydrates, and other nutrients that are used up during physical activity. Each nutrient is believed to cater to the requirements of athletes both during physical activity and post-workout [4].
There are several types of functional beverages, the most well-known of which are energy drinks and sports drinks. Energy drinks are beverages that contain compounds with stimulatory properties, such as caffeine, taurine, ginseng, and L-carnitine [5]. Energy drinks are marketed as products that impact the improvement of mental and physical energy levels, but such a fact is not proved yet [6]. Sports drinks are another kind of beverage that was created to swiftly restore fluids and electrolytes lost due to exercise-induced perspiration, as well as supply carbohydrates to replenish glycogen stores, hence preserving adequate performance during exercise [4,6]. Sports drinks are usually classified into three types: isotonic, hypertonic, and hypotonic, with various amounts of electrolytes, and carbohydrates. Despite being categorized as sports beverages, their composition varies significantly, subsequently affecting their impact on the human body. The primary purpose of hypertonic drinks is to reduce water content, whereas hypotonic drinks aim to increase it. Isotonic drinks provide the proper mineral content in the human body [5]. Given that these beverages are commonly used to help maintain electrolyte equilibrium in the human body, they may additionally provide energy during or after exercise [4,7].
Dehydration significantly impairs athletic performance to the point where it may endanger the health of the athlete. Consequently, controlling hydration levels is crucial not only during exercise, but also before and after physical activity. To accomplish this, hypotonic drinks should be consumed prior to activity, isotonic drinks during exercise, and slightly hypertonic drinks following exercise [7,8]. Mixing sports drinks with other foods affects carbohydrate and sodium concentration, delaying energy and fluid delivery [7]. Sports drinks only benefit adults during intense exercise and training in high temperatures and humidity, not children and adolescents. A well-balanced diet and water are sufficient for most children and teenagers, and the consumption of sports drinks, energy drinks, or other caffeinated drinks is not necessary, as they often contain chemical substances such as caffeine or toxic metals [6,7,9].
Small amounts of electrolytes, often sodium and potassium cations, are added to sports drinks to increase palatability and contribute to fluid balance [10]. As a consequence, beverages may contain several natural inorganic elements as well as additional components resulted from human activities. Extensive exposure to certain elements has been linked to the development of cognitive impairments and neurological disorders, as well as nephrotoxicity, gastrointestinal issues, reproductive complications, and mental system disorders [11]. A study showed that excessive consumption of functional beverages from adolescents lead to unhealthy behaviors, such as breakfast skipping or excessive screen time [12]. Lead, cadmium, and mercury cations have been determined to be the most toxic inorganic elements. The presence of such elements usually derive from the water used to produce these beverages, which can be polluted from human activities [13]. Furthermore, several additional metals, known as trace elements, can have adverse consequences when present in elevated amounts [6].
Caffeine is a compound that can enhance alertness, and cognitive function, reduce fatigue and increase endurance, stimulates the nervous system, and is commonly added to beverages. Caffeine has also been observed to reduce the reliance on glycogen utilization and increase the dependence on free fatty acid mobilization during physical activity. However, excessive consumption may lead to insomnia, anxiety, and heart palpitations [14,15,16,17]. Adverse effects include irritability, anxiety, insomnia, tachycardia, palpitations, vomiting, abdominal pain, hypokalemia, hallucinations, and supraventricular and ventricular tachyarrhythmias, among others [18]. It is crucial for consumers to be aware of the absence of caffeine in their beverages to prevent the potential adverse effects associated with caffeine consumption. Various investigations [19,20] have been conducted wherein beverage samples were analyzed and the concentration of caffeine was solely indicated as an ingredient. Such drinks are mostly consumed by adolescents. A survey conducted in the United States revealed that 85% of parents support regulations mandating disclosure of caffeine content and warning labels on energy drinks, indicating international backing for the regulation of such products [21]. Trace elements are micronutrients involved in various biological processes, but heavy metals can be disastrous, causing neurological and kidney damage. Therefore, it is of high importance to monitor the levels of trace metals and caffeine in widely consumed beverages to ensure their safety and quality [22,23,24].
The aim of this study was to assess the levels of thirty elements (silver (Ag), aluminum (Al), arsenic (As), boron (B), barium (Ba), beryllium (Be), calcium (Ca), cadmium (Cd), cobalt (Co), chromium (Cr), copper (Cu), iron (Fe), potassium (K), lithium (Li), magnesium (Mg), manganese (Mn), molybdenum (Mo), sodium (Na), nickel (Ni), phosphorus (P), lead (Pb), sulfur (S), antimony (Sb), selenium (Se), silicon (Si), strontium (Sr), titanium (Ti), thallium (Th), vanadium (V), and zinc (Zn)), pH, and caffeine in three types (hypertonic, isotonic, and hypotonic (HIH)) of sports and energy drinks. To accomplish this, commercially available samples were examined, and the measurements were compared to the established safety limits by regulations. The study also conducted multivariate analyses in order to assess any probable correlation between the measured parameters and the samples. The results of the study would contribute to the formulation of guidelines for the safe consumption of these beverages by providing significant insight into the potential health hazards connected with their consumption.

2. Materials and Methods

2.1. Chemicals and Reagents

Hydrochloric acid (37%) and acetonitrile were obtained from Panreac (Barcelona, Spain). Standard solutions for element detection were obtained from Perkin Elmer (Waltham, MA, USA). Caffeine (99%) was purchased from Merck Ltd. (Darmstadt, Germany). Methanol (≥99.9%), formic acid (≥96%), nitric acid (65%), and 0.22 μm polytetrafluoroethylene (PTFE) syringe filters were purchased from Sigma Aldrich (Steinheim, Germany). The solvents used in chromatography were of HPLC grade. To generate deionized water, a deionizing column was employed.
Eight functional beverages with variable tonicity were purchased from a local market in Karditsa, Greece. Samples S1–S4 were hypertonic, S5 and S6 were isotonic, and S7 and S8 were hypotonic. The samples were kept refrigerated at 4 °C. Samples S2, S3, and S4 were packaged in aluminum cans, while samples S1 and S5–S8 were packaged in polyethylene terephthalate (PET) bottles.

2.2. pH Value

A digital pH meter (XS Instruments, PC 60 VioLab with XS 201T DHS digital electrode, Carpi, Modena, Italy) was employed to measure the pH value. It was calibrated with buffer solutions at two different points (pH 4.00 and 7.00) at room temperature (25 °C). After letting the samples at room temperature for at least an hour, the pH value was determined.

2.3. Caffeine Content

Approximately 50 mL of each sample was placed in an Elmasonic P ultrasonication bath (Elma Schmidbauer GmbH, Singen, Germany) for 40 min to remove carbon dioxide and then properly diluted in methanol. Prior to injection into the high-performance liquid chromatography (HPLC) system, all samples were filtered with a 0.22-μm PTFE syringe filter.
HPLC analysis was carried out on a Shimadzu CBM-20A liquid chromatograph (Shimadzu Europa GmbH, Duisburg, Germany) coupled with a SIL-20AC autosampler and a CTO-20AC column oven. A Shimadzu SPD-M20A diode array detector was used for detection. Shimadzu LC solution software (Version 1.22 SP1) was used to control the system, as well as carry out further analysis. Phenomenex Luna C18(2) column (100 Å, 5 μm, 4.6 × 250 mm) (Phenomenex, Inc., Torrance, CA, USA) was used as a stationary phase. The column temperature was kept constant at 40 °C. Elution was carried out using an isocratic mode using 85% water acidified with 0.5% formic acid (A) and 15% acetonitrile (B), for 10 min. The flow rate was set at 1.0 mL/min and the injection volume was 20 μL. Identification of caffeine was carried out by matching the retention time and the UV absorbance spectrum with that of a standard compound. Quantification was carried out at 272 nm. Calibration curves of caffeine in methanol (0–50 μg/mL) were used for the quantification (R2 = 0.9999). The limit of quantification (LOQ) was determined to be 0.06 mg/L.

2.4. Elements Content

The inductively coupled plasma–optical emission spectrometry (ICP–OES) method from Lalas et al. [25] was applied with some modifications. The samples were processed using the following steps before being analyzed by ICP–OES (PerkinElmer, Optima S300 DV, Waltham, MA, USA). First, 25 mL of each sample was added to a 50 mL tube and mixed with 10 mL of concentrated HNO3. The mixtures were stirred at 150 rpm for 3 h at 85 °C. The samples were then sonicated for 30 min before cooling at room temperature for one hour. Next, 0.5 mL HCl (37%) was added, the solution was heated at 85 °C until transparent, and the volume was reduced. After cooling at room temperature, the samples were transferred to a 25 mL volumetric flask, and the volume was filled with 1% v/v HNO3.
The conditions of ICP–OES were: plasma RF power was 1450 W, plasma gas flow was 15 L/min, the auxiliary gas flow was set at 0.20 L/min, the nebulizer gas flow was 0.70 L/min, and the sample absorption rate was 1.50 mL/min. Calibration curves with at least five points and a blank solution were prepared for each element with a range from 0.5–250 mg/L for high-concentration elements (Ca, K, Mg, Na, P, S, and Si) and 0.001–0.5 mg/L for low concentration elements (Ag, Al, As, B, Ba, Be, Cd, Co, Cr, Cu, Fe, Li, Mn, Mo, Ni, Pb, Sb, Se, Sr, Ti, Th, V, and Zn). A standard solution was examined after every ten analyses, so as to guarantee accuracy. A blank solution (1% v/v HNO3 solution) was also used to verify there were no carryover effects.

2.5. Statistical Analysis

Data are presented as the mean values and standard deviation (SD) of three replicate analyses. A one-way analysis of variance (ANOVA) test was performed using the IBM SPSS Statistics (Ver. 29.0) statistical software package (SPSS Inc., Chicago, IL, USA) to determine whether there were statistically significant differences between samples. The significance level was set at p < 0.05. Using JMP®® Pro 16 software (SAS, Cary, NC, USA), the multivariate correlation analysis (MCA) and multiple factor analysis (MFA) were performed.

3. Results and Discussion

The pH value, caffeine content, and quantification of thirty elements were assessed in eight samples of HIH beverage samples. For the quantification of caffeine, a validated HPLC method was utilized, providing accurate, reliable, reproducible, and sensitive results [26]. Moreover, in the determination of element content, an ICP–OES method was used to determine the element content, allowing for simultaneous detection of elements [27]. Nonetheless, it is important to consider that both methods might have limitations, namely matrix effects, depending on the analyzed sample [28,29]. In our study, the selection of elements for analysis was driven by several factors, including their relevance to beverage safety, potential health risks, and the availability of established regulatory limits. We aimed to focus on elements that are commonly found in beverages, according to previous studies [27,30,31], and may pose health hazards if present in excessive amounts. Tin (Sn) was not studied since, as a potentially integral part of the packaging material, it adheres to strict regulations and standards set by food safety authorities. These regulations ensure that the migration of Sn into the packaged product remains within acceptable limits [32,33].
Significant information on the potential health risks associated with beverage consumption could be obtained from the outcomes of this study, which would lead to the development of guidelines for the safety of consumers.

3.1. pH

The results from the pH measurements are shown in Table 1, along with labeled ingredients. All samples had acidic pH, which ranged from 2.68 to 3.97. Statistically significant differences (p < 0.05) were observed especially between samples S8 and S4, where sample S4 had the lowest value and sample S8 had the highest value. The presence of carbon dioxide or other acids used as preservatives or acidity regulators by the manufacturers of these beverages, such as phosphoric acid, benzoic acid, ascorbic acid, and citric acid could explain the low pH values [34]. The presence of such acids has been found to inhibit the growth of microorganisms, including bacteria, mold, and fungi, which have the potential to downgrade the quality of beverages. Studies indicate that the consumption of acidic beverages for an extended duration can lead to the gradual erosion of tooth enamel, thereby increasing the susceptibility of the consumer to dental ailments [35]. Our results are similar to Idris et al. [36], who measured the sugar content and the pH value of six carbonated sports drinks and four soft drinks. They measured an average of 2.8 and 2.9 pH values, respectively.

3.2. Caffeine

The caffeine content of the samples is listed in Table 2. Caffeine content ranged from 0.02–38.93 mg/100 mL. Statistically significant differences (p < 0.05) were observed between all samples. Samples S5, S6, and S7 were sold as caffeine-free sports drinks and had traces of caffeine, whereas S2 had the highest caffeine content. S2 and S3 samples had similar amounts of caffeine (~34 mg/100 mL of the sample). According to the European Food Safety Authority [37], consumption of caffeine up to a maximum of 400 mg/day, which is equivalent to approximately 5.7 mg/kg of body weight for a 70 kg adult, does not pose any safety concerns for healthy individuals in the general population, except for pregnant women. The results showed that all the examined samples were in accordance with the abovementioned guidelines.
Energy drinks typically not only contain caffeine as the main active ingredient, but also other components such as guarana, taurine, vitamins, and ginseng extract. The presence of additional compounds in energy drinks has prompted certain individuals to hypothesize that the impact of these beverages on human health may diverge from those that solely contain caffeine. The caffeine content in this type of drink is typically indicated on the packaging; however, recent scientific data has highlighted deviations between the labeled caffeine content and the actual amount present in the product [38,39]. Samples S1 and S4 only note caffeine as a flavoring or as an ingredient. Hence, it should be noted that caffeine was present in samples S1 and S4 at satisfactory levels. An athlete could consume 13.51 and 7.86% of the daily caffeine intake that the S1 and S4 samples provided, respectively. Samples S5, S6, and S7 did not disclose that caffeine may be present even in traces, which was confirmed by our results. Nevertheless, S2, S3, and S8 samples directly listed the amount of caffeine they contained on their labels, and the measured caffeine content varied from –2.68 to +6.97%. A similar study was conducted by Al-Bratty et al. [40]. They investigated caffeine levels in sports drinks commercially available in Saudi Arabia. The range of caffeine between eight different samples was from 20.82–33.72 mg/L, while the percentage of the label claim ranged from –8.9 to +6.9%. Our study is also in line with Attipoe et al. [19], who examined the caffeine content in nine sports drinks and five energy drinks. The caffeine found in nine products that were labeled caffeine ranged from –11.7 to +11.1%. The analyzed products that did not label caffeine were proved to contain the substance from 67.3 to 333.3 mg.

3.3. Elements

The presence of thirty elements was evaluated and the findings are demonstrated in Table 3. Due to the absence of corresponding legislation for functional beverages, the results were compared with the current parametric values for drinking water established by the European Directive (EC) 2020/2184 [41]. Statistically significant differences (p < 0.05) were observed in most elements between the samples. The results showed that elements such as Ba, Be, Co, Se, and Th were not found in any sample, while Li and Mo were only quantified in S8 at 0.015 and 0.006 mg/L, respectively.
In addition to caffeine, HIH beverage samples may contain other stimulants such as B-vitamins complex, taurine, ginseng extract, and guarana seed extract. The utilization of these compounds in the production process may lead to contamination concerns, such as residues of heavy metals [42]. Heavy metals are naturally present in the eart’sh crust and are utilized in various manufacturing industries. Moreover, the usage of contaminated water or ingredients is a primary factor contributing to contamination with various metals and elements in the manufactured beverages, leading to increased toxicity [43]. The detection of metals in beverages is a subject of high concern, because the various mechanisms of action of these elements usually lead to chronic and acute toxicity in consumers [44]. Cr levels varied statistically significantly (p < 0.05) among all samples and ranged from 0.001–0.01 mg/L. Pb, Cd, and Ni have the potential to be toxic at elevated concentrations and can be classified as poisonous [31]. Pb concentrations ranged from 0.005–0.01 mg/L and Cd ranged from 0.001–0.002 mg/L. It appeared that the consumption of HIH beverage samples could result in the intake of 20–40% of the acceptable level of Cd, whereas this percentage ranged from 30–100% in the case of Pb. Ni concentration ranged from 0.010–0.018 mg/L, values above 50% of the current provisional guideline. Fe concentrations in beverage samples varied from 0.040–0.093 mg/L. Sample S3 was packaged in an aluminum can and had the highest concentration of Fe. None of the samples had concentrations of Fe and Ni that exceeded the provisional guideline established by the World Health Organization [45] and parametric value set by the European Commission [41] (0.200 mg/L for Fe and 0.02 mg/L for Ni, respectively).
The existence of As in food composites is a matter of apprehension due to its hazardous nature [46]. According to Mandal and Suzuki [47], both acute and chronic exposures to this substance can lead to numerous detrimental health results in humans, including alterations in skin characteristics, respiratory and pulmonary issues, cardiovascular complications, and more. As concentration was found to have statistically significant variations (p < 0.05) among all samples and ranged from 0.003–0.009 mg/L. An athlete could consume two cans of the S2 energy drink, which had the highest As content and equals one liter in total, and could reach the parametric value that the European Commission set at 10 μg/L. Sb was not quantified in any hypertonic beverages (S1–S4), but it was found in the rest of the beverages, with the highest concentration measured in the S5 sample approximately 3 μg/L. Interestingly enough, Sb was only quantified in PET-bottled beverages, supporting the hypothesis of migration of the specific metal from PET packaging to the beverage. The presence of Sb in PET-bottled drinks could be attributed to its usage as a catalyst during the production of PET, mostly in the Sb trioxide form [48,49]. Xu et al. [50] examined the leaching and bioavailability of Sb in PET-bottled beverages across six categories (carbonated, fruit juices, tea, sports, protein, and coffee beverages). They found that high temperature and low pH exposure could lead to excessive Sb leaching, 1.1–10.9 times higher than before exposure.
Cu is an essential element for human nutrition. A deficiency in this element can result in various symptoms such as impaired hematopoiesis, bone metabolism, gastrointestinal, cardiovascular, and neurological systems. On the contrary, the condition known as metal fume fever arises after extended exposure to Cu [51]. Cu concentration had statistically significant differences (p < 0.05) among samples S1, S2, S3, S5, and S7 samples and ranged from 0.018–0.187 mg/L, well below the permissible limit (2.0 mg/L). Zn deficiency resulting from inadequate nutrition, malabsorption, or alcoholism can lead to dwarfism, hypogonadism, and dermatitis. Conversely, excessive Zn intake can cause electrolyte imbalance, anemia, nausea, and lethargy [51]. Zn recorded statistically significant differences (p < 0.05) between the samples S1, S2, S3, and S8, and the concentration ranged from 0.064–0.200 mg/L. P was quantified in every sample with its concentration ranging from 0.543–2.042 mg/L. The highest concentration was found in S4 in which phosphate was labeled to be present. The significant presence of both Mg and Ca (0.36–98.48 mg/L and 2.26–86.70 mg/L, respectively), surpassing the levels of all other elements by several orders of magnitude, could be logically attributed to the water hardness utilized in the production of the beverages.
As for Al, samples S2, S3, and S4 exhibited an exceptionally elevated content, surpassing the parametric value established by the European Commission (0.02 mg/L) by 21 to 117%. Indeed, it should be noted that the abovementioned values were present in containers composed of Al. The present data support the hypothesis that this element could have migrated from the container into the examined beverage. Francisco et al. [22] have reported that although aluminum containers are coated with a thin layer of polymeric material for protection, the handling of metal cans may result in damage to the polymer film. This would enable the beverage to make contact with the metallic surface of the container. The low pH value also plays an important role in the migration of metals in drinks [52].

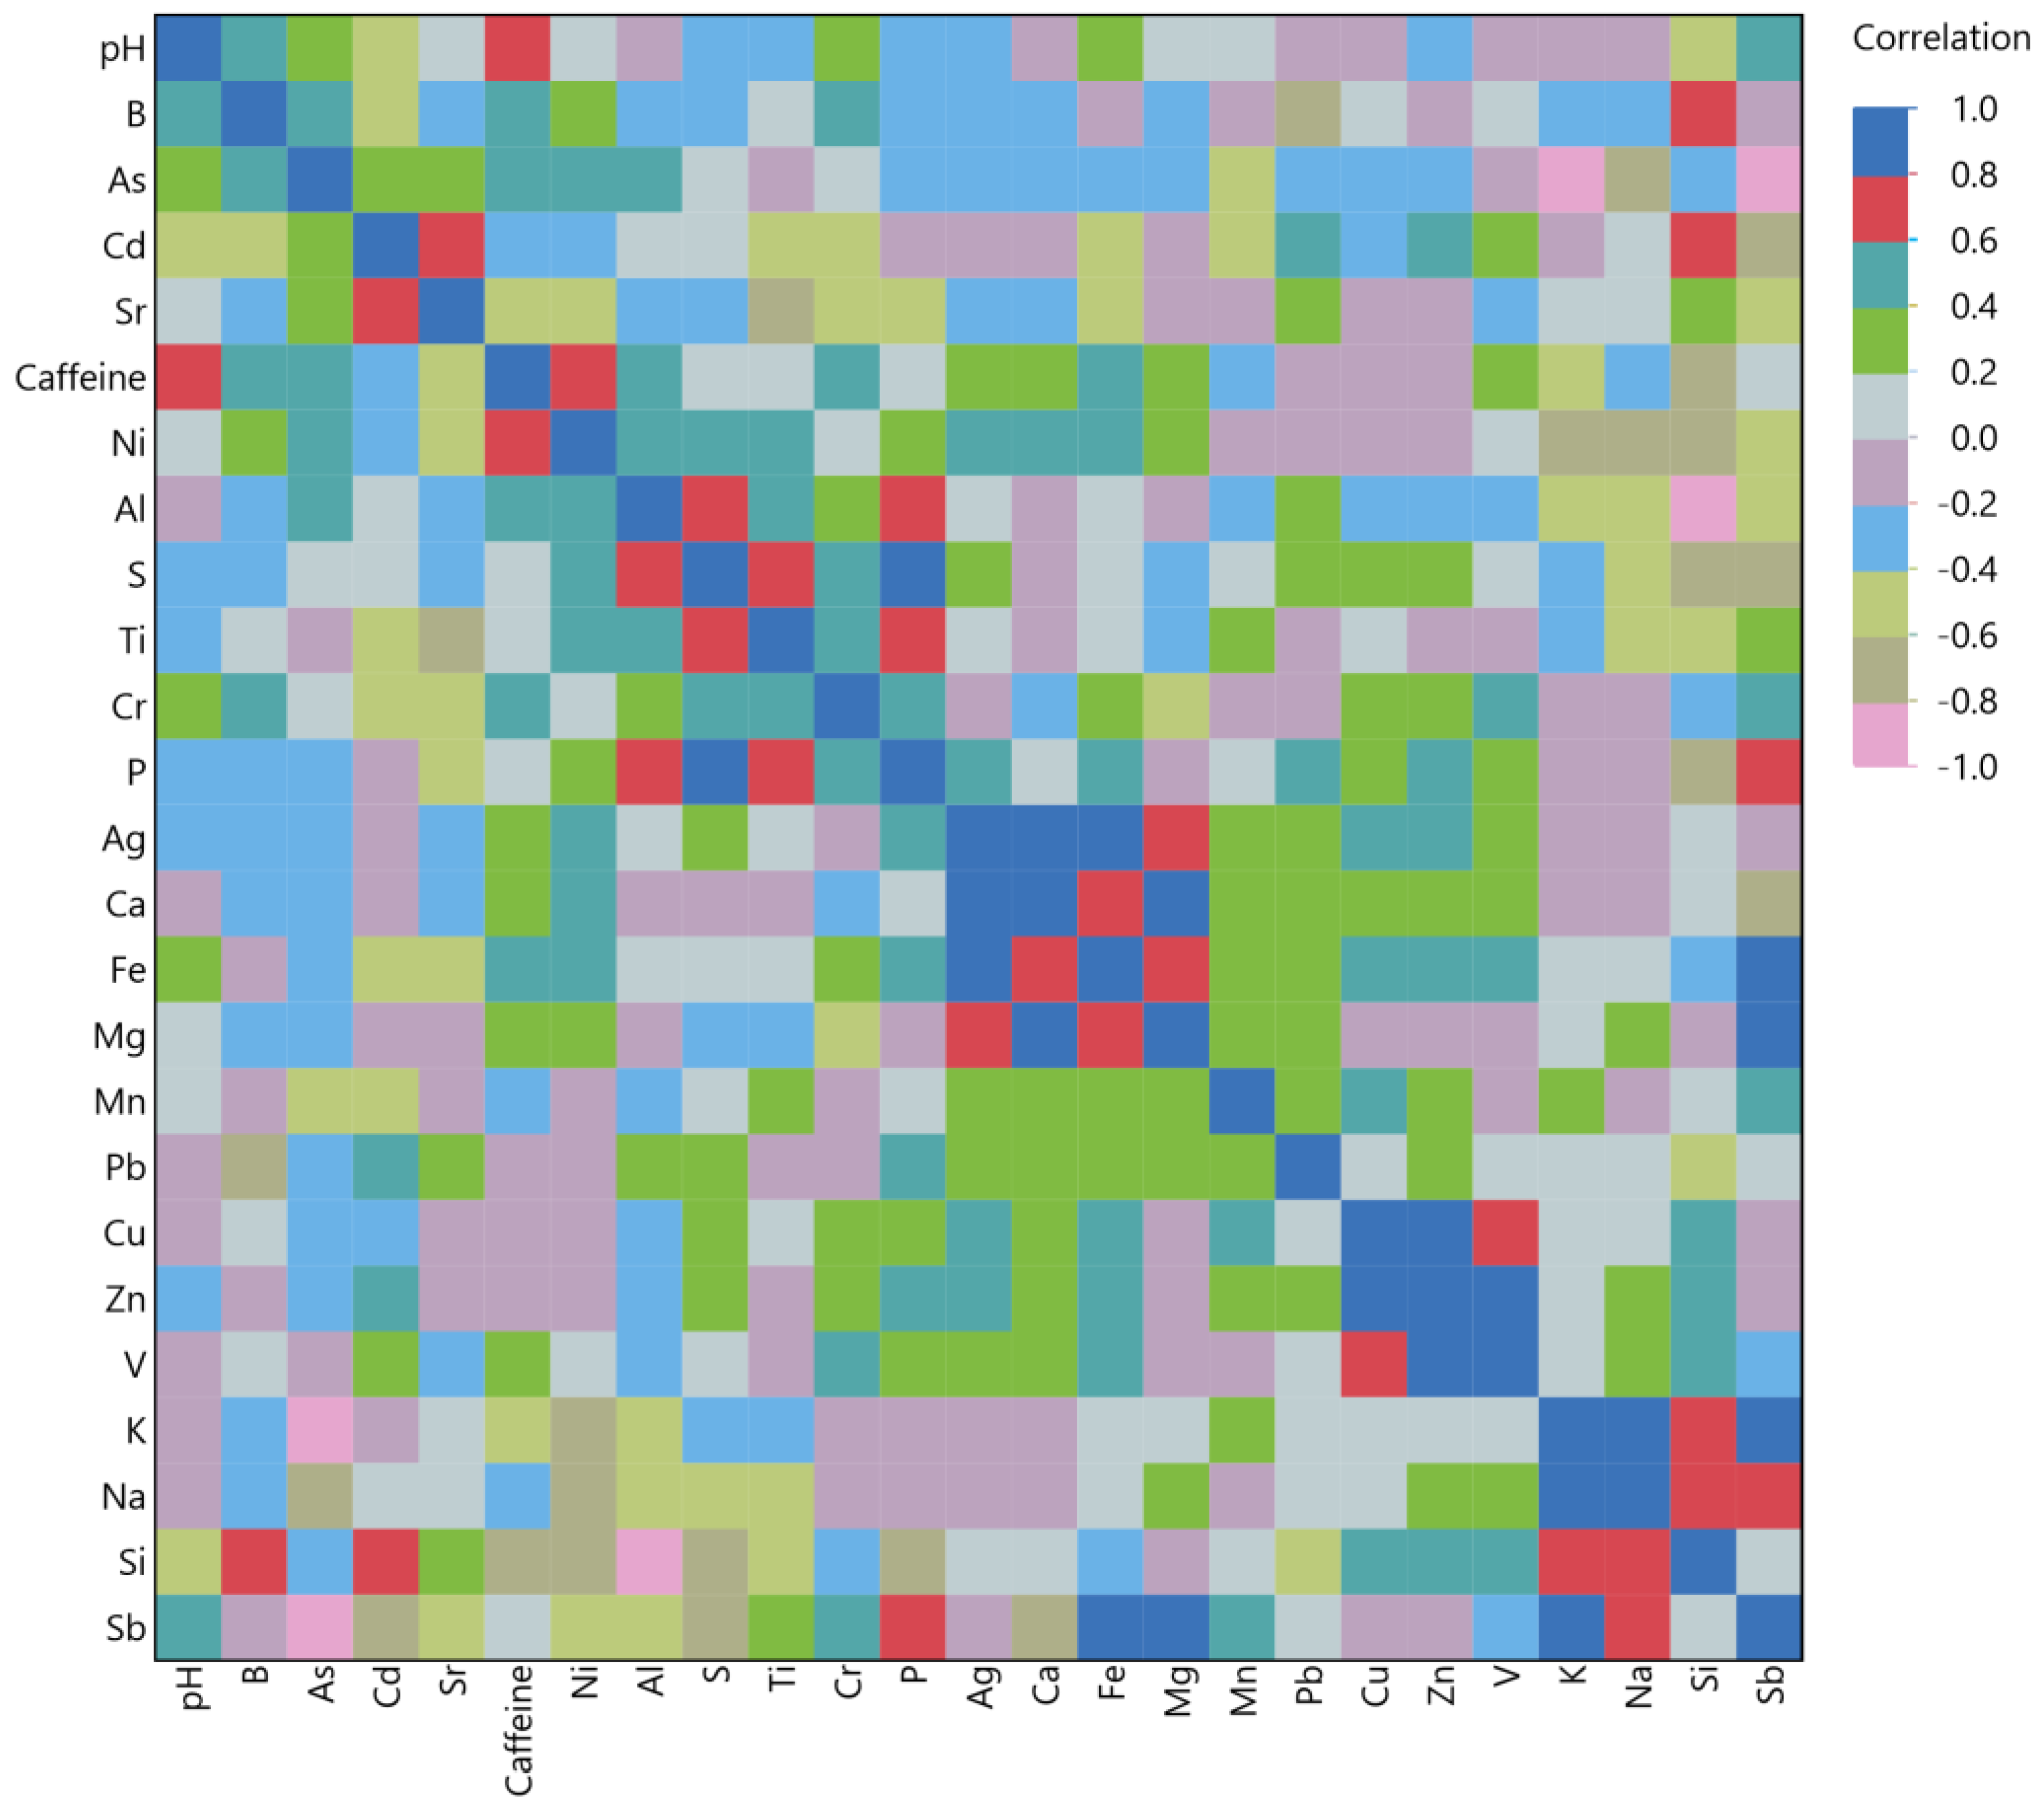
3.4. Multivariate Correlation Analysis

A multivariate correlation analysis (MCA) was conducted to elucidate the correlation between the measured parameters of the examined HIH beverage samples (pH value, caffeine, and element concentration). The results are presented in Figure 1. The correlation values on the color scale in this heat map range from –1 to 1. Ba, Be, Li, Mo, Se, and Th did not correlate with any other parameter, so they were excluded from the color map. MCA findings revealed the strongest positive correlations between Ca and Ag (R = 0.95 and p < 0.0005). A strong correlation was also observed between Zn and Cu (R = 0.94 and p < 0.0005) and between Na and K (R = 0.88 and p < 0.01). Froes et al. [53] have suggested that the correlations between the inorganic constituents found in the raw materials used to manufacture energy beverages are directly linked to their presence. A significant correlation was also detected among various metals. However, elucidating the true reason for this pattern was a challenging task that needs further research. In addition, caffeine did not show any significant correlation with other elements, except for nickel. Our findings were in line with Kolayli et al. [54], who investigated the binding of caffeine with Ca, Mg, Fe, Zn, Pb, Mn, Co, and Cr metal ions and found low interactions of caffeine with them.

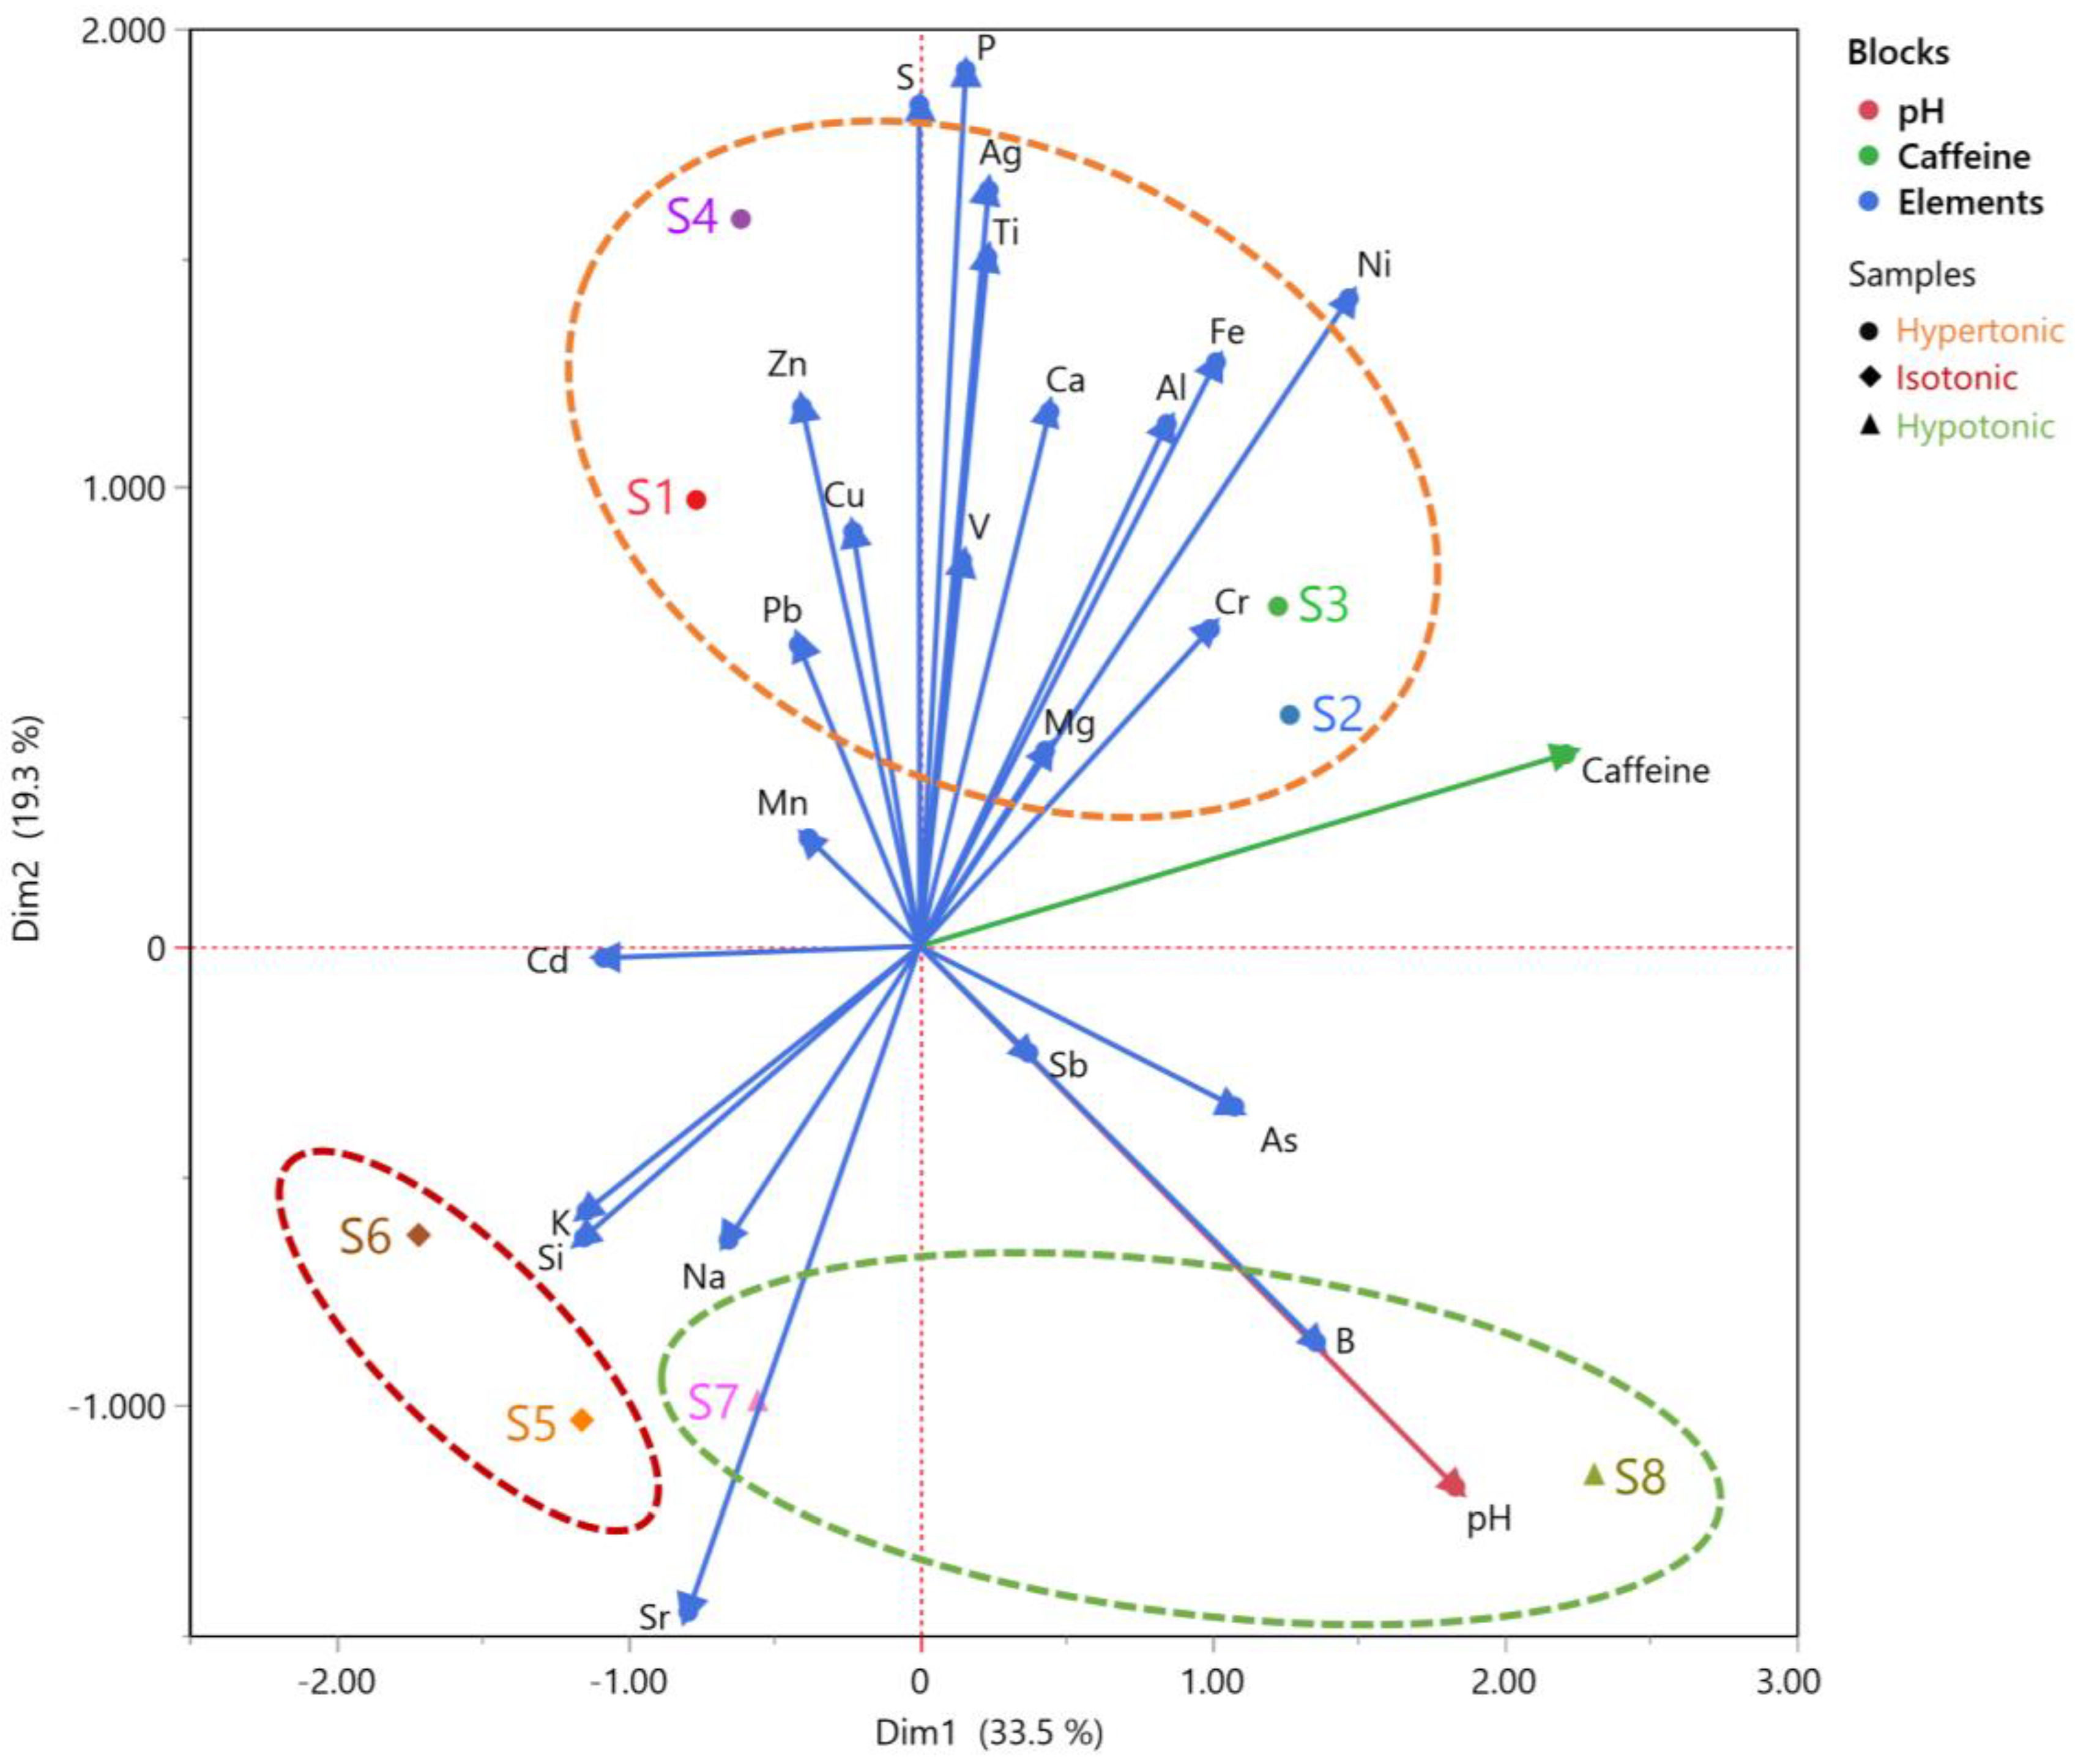
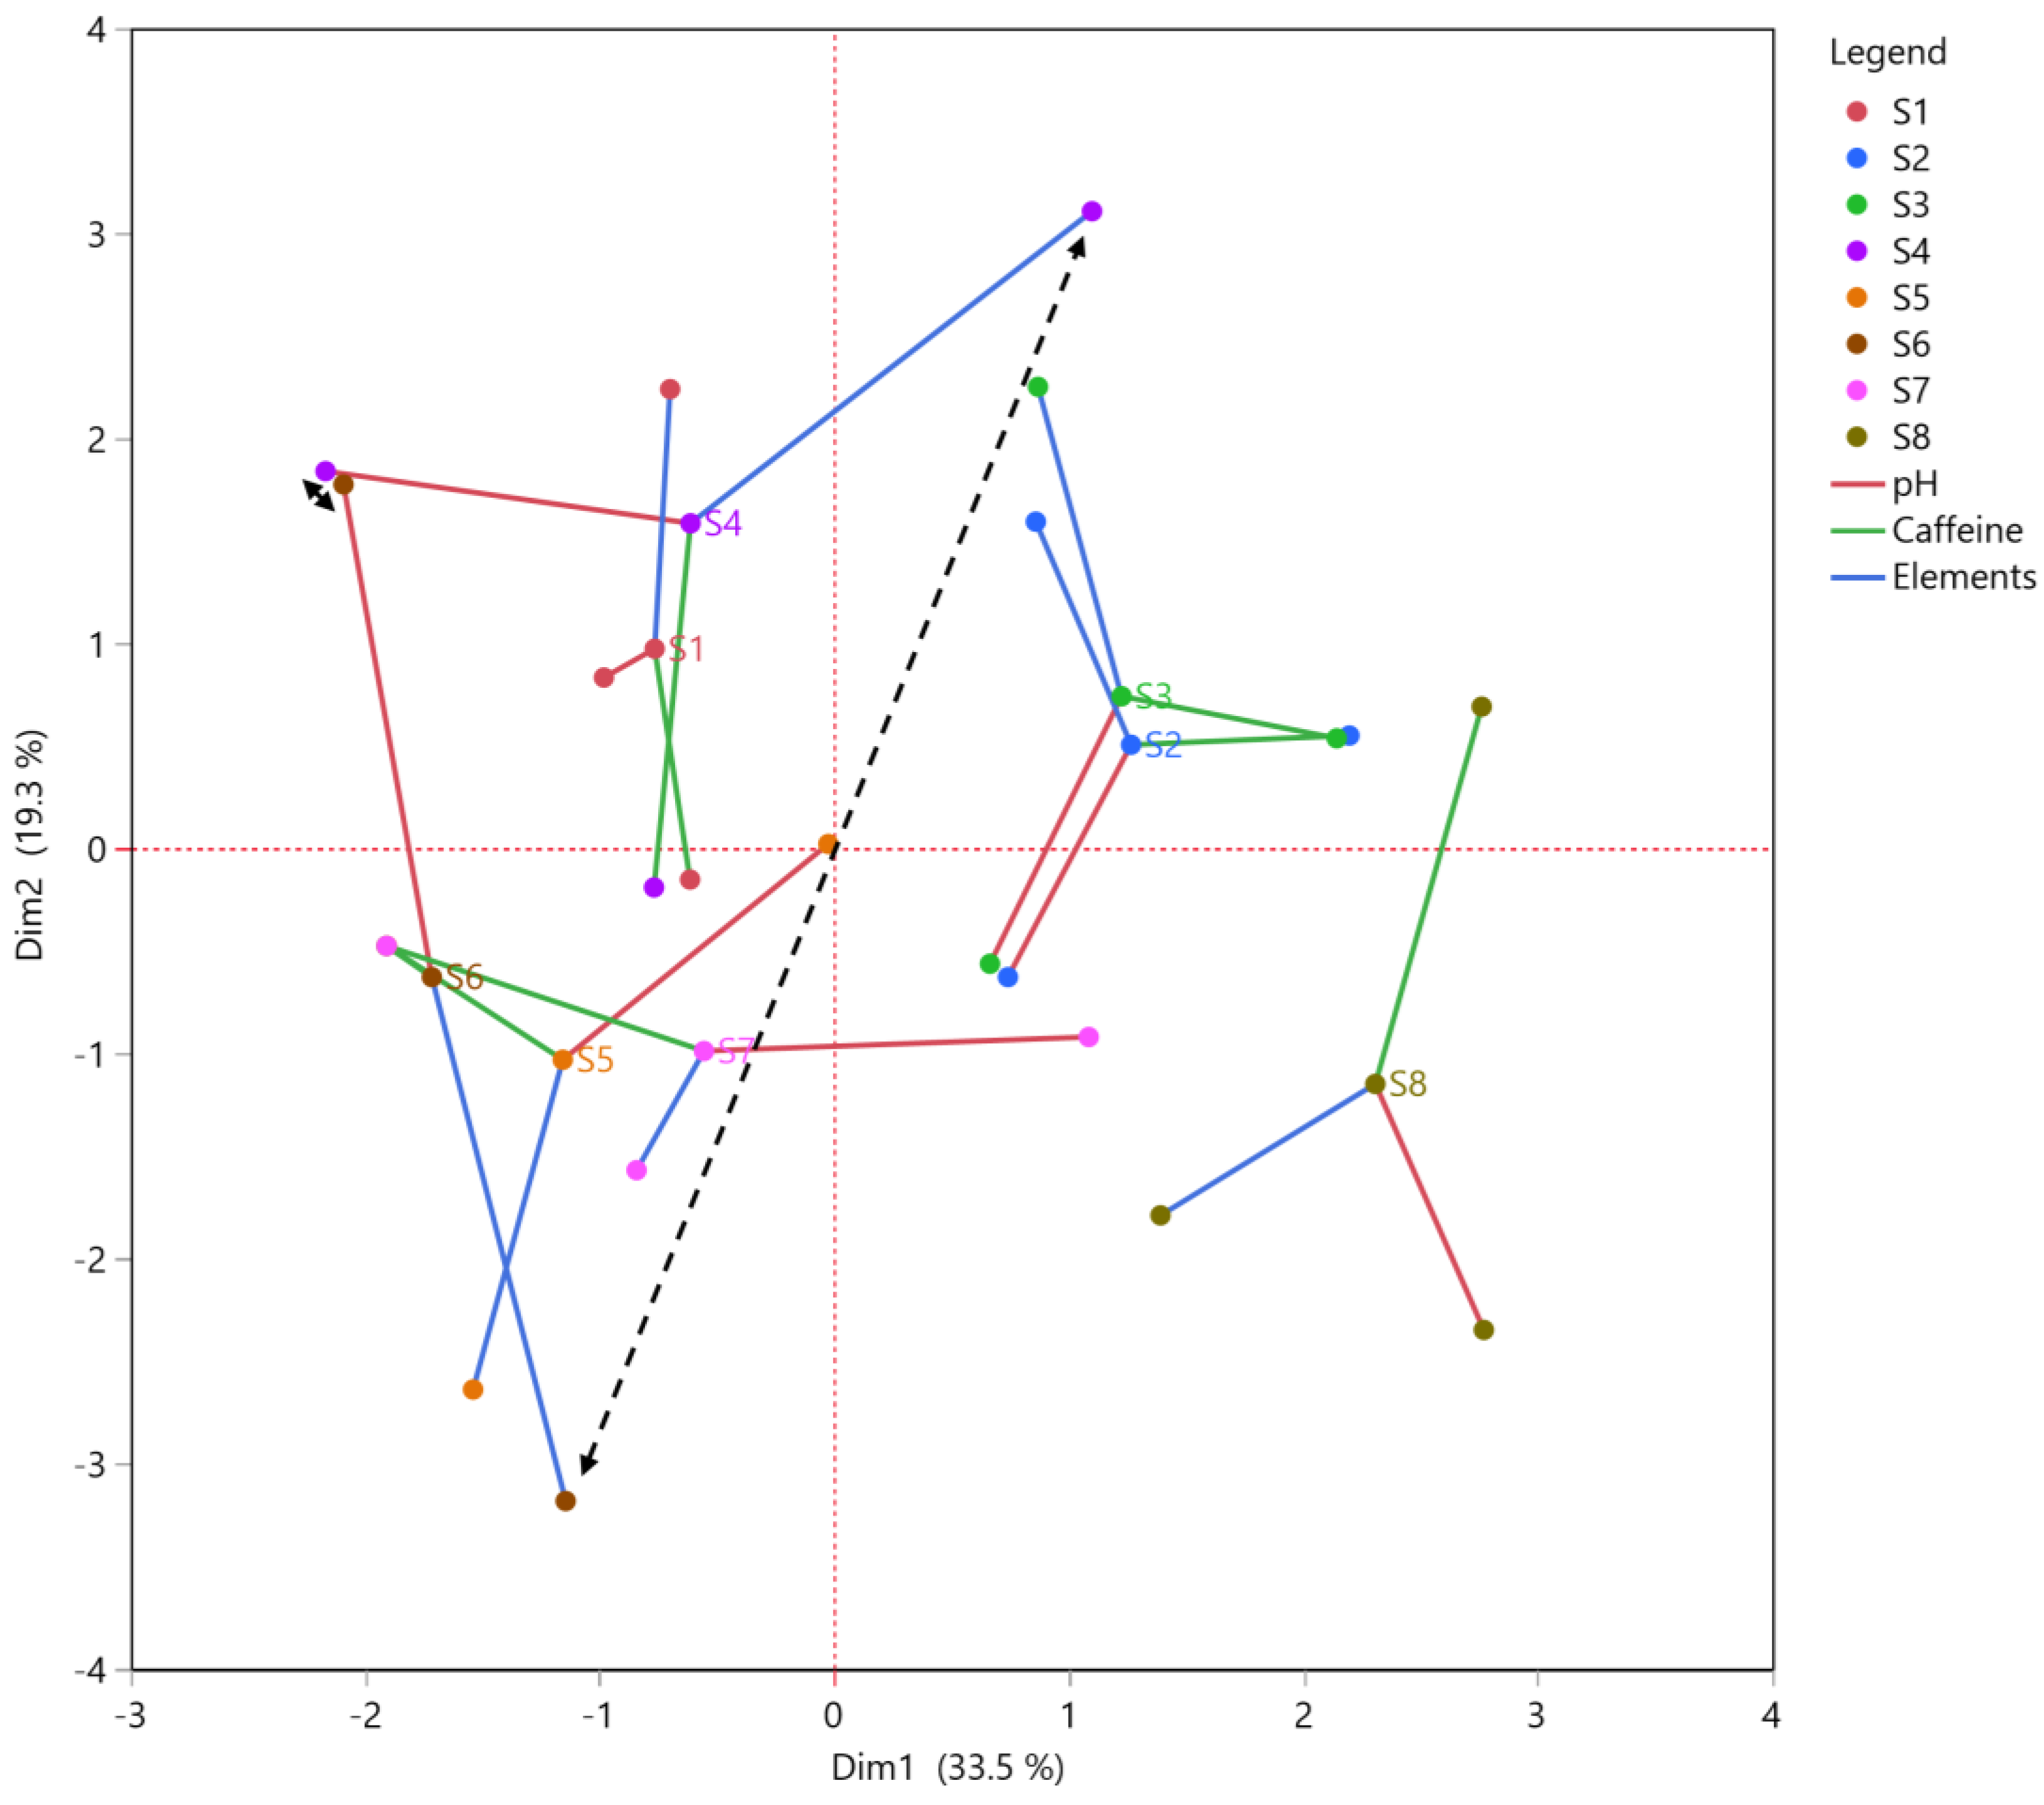
3.5. Multiple Factor Analysis

A multiple factor analysis (MFA) was used for a more thorough analysis of the data and improved information extraction from the samples and variables. The results are illustrated in Figure 2. MFA allows the examination of similarities and dissimilarities among HIH beverage samples. The abovementioned measured parameters (pH value, caffeine, and elements concentration) were investigated to examine if any association among these variables was observed. Only the first two dimensions (Dim1: 33.5% and Dim2: 19.3%) were significant, according to the Kaiser–Meyer–Olkin test for explaining the variation in the data. These dimensions had eigenvalues >1 and they explained 52.80% of the total variance. The results showed that many parameters had either positive or negative correlation with each other. For instance, a positive correlation between pH and boron was observed. Several variables of elements such as Ca, Mg, Al, Fe, Ni, and Cr, along with caffeine were positioned positively on the Dim1. Samples were also classified based on their tonicity. It should be noted that the MFA graph provided discrimination among the samples, according to the corresponding parameters. Initially, a negative correlation was observed between caffeine and the samples S5, S6, and S7. These samples were found to have traces of caffeine and were successfully discriminated from the other samples that contained caffeine. Hypertonic samples (S1, S2, S3, and S4) were satisfactorily discriminated from isotonic samples (S5 and S6) and from hypotonic samples (S7 and S8). Isotonic samples achieved a satisfactory level of discrimination with sample S8 which is hypotonic, but this pattern was not observed in hypotonic sample S7. This outcome could be attributed to the prior integration of the specific sample with caffeine-free beverages.
A consensus map graph was also utilized for improved data processing and interpretation from the samples and variables, as shown in Figure 3. The consensus map is an alternative diagram to MFA that overlays the individual sample responses with the average response across all samples. This chart is a visual representation of all the above variables (pH value, caffeine, and elements concentration). It could also illustrate how similar or different several parameters were among the samples. This outcome was interpreted with “inertia” values. “Inertia”, also known as the within-cluster sum of squares, is a metric for assessing the level of coherence among different clusters. A high inertia value suggests that the data points within a given cluster exhibit dissimilarity from one another [55]. For instance, samples S4 and S6 showed low inertia, meaning they had similarities in their corresponding pH values (red line). Indeed, pH values were measured at 2.68 and 2.7, respectively. On the other hand, these two samples showed large inertia in their element’s variable, meaning that their content in elements (blue line) had statistically significant differences (p < 0.05). These findings were also highlighted with black arrows. In addition, samples S2 and S3 had low inertia in each variable (pH value, caffeine, and element concentration), as their measurements did not vary statistically significantly (p > 0.05). To sum up, this graph provides a comprehensive overview of the correlation between the samples and the different variables. This methodology allows the swift classification of samples while assessing every variable.

4. Conclusions

The pH value, caffeine level, and concentration of thirty elements on eight hypertonic, isotonic, and hypotonic beverages packaged in aluminum cans and PET containers were investigated in this study. The pH values were highly acidic in all samples. Caffeine levels varied statistically significantly (p < 0.05) among all samples, as sports drinks do not usually contain caffeine. It was found that caffeine was present in quantities similar to labeled values while some samples did not quantify or label caffeine at all. The results obtained from the element analysis were compared to the parametric values established by the European Commission for drinking water, where most metals were found to have concentrations below the corresponding permissible thresholds. Nevertheless, the health risks associated with elements in samples should be evaluated with regard to their daily consumption rates. Canned samples exhibited higher Fe and Al concentrations, whereas Sb was only found in PET-bottled samples. Specifically, Al was measured above the permissible quantities. Low pH levels, temperature exposure, and poor handling of containers could lead to metal leaching. Multivariate correlation and multiple factor analysis also supported the metal migration hypothesis but contradict any link between caffeine and elements other than Ni. The discrimination of the samples concerning caffeine levels was adequate. A satisfactory discrimination of samples regarding their tonicity was also possible within this study. Exceeded consumption of functional beverages may lead to a growing public health issue regarding caffeine and elements content. The findings of this study could potentially inspire the development of more stringent guidelines for the beverages industry.

Author Contributions

Conceptualization, V.A., T.C. and S.I.L.; methodology, V.A., T.C. and S.I.L.; software, V.A.; validation, V.A., T.C., D.K. and S.I.L.; formal analysis, V.A. and E.B.; investigation, V.A., E.B. and T.C.; resources, S.I.L.; data curation, V.A. and T.C.; writing—original draft preparation, V.A., M.M. and D.K.; writing—review and editing, V.A., T.C., D.K., M.M., E.B. and S.I.L.; visualization, V.A. and T.C.; supervision, S.I.L.; project administration, S.I.L.; funding acquisition, S.I.L. All authors have read and agreed to the published version of the manuscript.

Funding

This research received no external funding.

Data Availability Statement

All related data and methods are presented in this paper. Additional inquiries should be addressed to the corresponding author.

Conflicts of Interest

The authors declare no conflict of interest.

References

  1. European Commission. Directorate-General for Research Functional Foods; Publications Office: Brussels, Belgium, 2010. [Google Scholar]
  2. Ozen, A.E.; Pons, A.; Tur, J.A. Worldwide Consumption of Functional Foods: A Systematic Review. Nutr. Rev. 2012, 70, 472–481. [Google Scholar] [CrossRef] [PubMed]
  3. Wootton-Beard, P.C.; Ryan, L. Improving Public Health?: The Role of Antioxidant-Rich Fruit and Vegetable Beverages. Food Res. Int. 2011, 44, 3135–3148. [Google Scholar] [CrossRef]
  4. Orrù, S.; Imperlini, E.; Nigro, E.; Alfieri, A.; Cevenini, A.; Polito, R.; Daniele, A.; Buono, P.; Mancini, A. Role of Functional Beverages on Sport Performance and Recovery. Nutrients 2018, 10, 1470. [Google Scholar] [CrossRef] [Green Version]
  5. Fields, S.K.; MacDonald, J.; Joseph, A.M.; Wold, L.E.; Collins, C.L.; Comstock, R.D. Consumption of Sports and Energy Drinks by High School Athletes in the United States: A Pilot Study. Beverages 2015, 1, 218–224. [Google Scholar] [CrossRef] [Green Version]
  6. Sugajski, M.; Buszewska-Forajta, M.; Buszewski, B. Functional Beverages in the 21st Century. Beverages 2023, 9, 27. [Google Scholar] [CrossRef]
  7. Simulescu, V.; Ilia, G.; Macarie, L.; Merghes, P. Sport and Energy Drinks Consumption before, during and after Training. Sci. Sports 2019, 34, 3–9. [Google Scholar] [CrossRef]
  8. Urdampilleta, A. Hydration and Chemical Ingredients in Sport Drinks: Food Safety in the European Context. Nutr. Hosp. 2015, 31, 1889–1899. [Google Scholar] [CrossRef] [Green Version]
  9. Rowlands, D.S.; Kopetschny, B.H.; Badenhorst, C.E. The Hydrating Effects of Hypertonic, Isotonic and Hypotonic Sports Drinks and Waters on Central Hydration During Continuous Exercise: A Systematic Meta-Analysis and Perspective. Sports Med. Auckl. NZ 2022, 52, 349–375. [Google Scholar] [CrossRef]
  10. Coombes, J.S.; Hamilton, K.L. The Effectiveness of Commercially Available Sports Drinks. Sports Med. 2000, 29, 181–209. [Google Scholar] [CrossRef]
  11. Anissa, Z.; Sofiane, B.; Adda, A.; Marlie-Landy, J. Evaluation of Trace Metallic Element Levels in Coffee by Icp-Ms: A Comparative Study among Different Origins, Forms, and Packaging Types and Consumer Risk Assessment. Biol. Trace Elem. Res. 2023, 1–13. [Google Scholar] [CrossRef]
  12. Larson, N.; DeWolfe, J.; Story, M.; Neumark-Sztainer, D. Adolescent Consumption of Sports and Energy Drinks: Linkages to Higher Physical Activity, Unhealthy Beverage Patterns, Cigarette Smoking, and Screen Media Use. J. Nutr. Educ. Behav. 2014, 46, 181–187. [Google Scholar] [CrossRef] [PubMed] [Green Version]
  13. Ober, J.; Karwot, J. Tap Water Quality: Seasonal User Surveys in Poland. Energies 2021, 14, 3841. [Google Scholar] [CrossRef]
  14. Graham, T.E. Caffeine and Exercise: Metabolism, Endurance and Performance. Sports Med. 2001, 31, 785–807. [Google Scholar] [CrossRef] [PubMed]
  15. Rosenbloom, C. Energy Drinks, Caffeine, and Athletes. Nutr. Today 2014, 49, 49–54. [Google Scholar] [CrossRef] [Green Version]
  16. Souza, D.B.; Del Coso, J.; Casonatto, J.; Polito, M.D. Acute Effects of Caffeine-Containing Energy Drinks on Physical Performance: A Systematic Review and Meta-Analysis. Eur. J. Nutr. 2017, 56, 13–27. [Google Scholar] [CrossRef]
  17. Goldstein, E.R.; Ziegenfuss, T.; Kalman, D.; Kreider, R.; Campbell, B.; Wilborn, C.; Taylor, L.; Willoughby, D.; Stout, J.; Graves, B.S.; et al. International Society of Sports Nutrition Position Stand: Caffeine and Performance. J. Int. Soc. Sports Nutr. 2010, 7, 5. [Google Scholar] [CrossRef] [Green Version]
  18. Reissig, C.J.; Strain, E.C.; Griffiths, R.R. Caffeinated Energy Drinks—A Growing Problem. Drug Alcohol. Depend. 2009, 99, 1–10. [Google Scholar] [CrossRef] [Green Version]
  19. Attipoe, S.; Leggit, J.; Deuster, P.A. Caffeine Content in Popular Energy Drinks and Energy Shots. Mil. Med. 2016, 181, 1016–1020. [Google Scholar] [CrossRef] [Green Version]
  20. Kudema, S.; Thomas, C.; Ngowi, H. The Caffeine Content of Energy Drinks in Accordance with the Information on the Package Label. Adv. Public Health 2023, 2023, e9938190. [Google Scholar] [CrossRef]
  21. Pomeranz, J.L.; Munsell, C.R.; Harris, J.L. Energy Drinks: An Emerging Public Health Hazard for Youth. J. Public Health Policy 2013, 34, 254–271. [Google Scholar] [CrossRef]
  22. Francisco, B.B.A.; Brum, D.M.; Cassella, R.J. Determination of Metals in Soft Drinks Packed in Different Materials by ETAAS. Food Chem. 2015, 185, 488–494. [Google Scholar] [CrossRef] [PubMed] [Green Version]
  23. Kilic, S.; Cengiz, M.F.; Kilic, M. Monitoring of Metallic Contaminants in Energy Drinks Using ICP-MS. Environ. Monit. Assess. 2018, 190, 202. [Google Scholar] [CrossRef] [PubMed]
  24. Yahaya, T.O.; Gulumbe, B.H.; Umar, A.K.; Yusuf, A.; Mohammed, A.Z.; Izuafa, A.; Abubakar, A. Heavy Metal Content and Associated Health Risks in Selected Energy Drinks Sold in Birnin Kebbi, Nigeria. Afr. J. Health Saf. Environ. 2022, 3, 26–34. [Google Scholar] [CrossRef]
  25. Lalas, S.; Athanasiadis, V.; Dourtoglou, V.G. Humic and Fulvic Acids as Potentially Toxic Metal Reducing Agents in Water. CLEAN Soil Air Water 2018, 46, 1700608. [Google Scholar] [CrossRef]
  26. Palur, K.; Archakam, S.C.; Koganti, B. Chemometric Assisted UV Spectrophotometric and RP-HPLC Methods for Simultaneous Determination of Paracetamol, Diphenhydramine, Caffeine and Phenylephrine in Tablet Dosage Form. Spectrochim. Acta. A Mol. Biomol. Spectrosc. 2020, 243, 118801. [Google Scholar] [CrossRef]
  27. Martins, A.S.; Junior, J.B.P.; de Araújo Gomes, A.; Carvalho, F.I.M.; Filho, H.A.D.; das Graças Fernandes Dantas, K. Mineral Composition Evaluation in Energy Drinks Using ICP OES and Chemometric Tools. Biol. Trace Elem. Res. 2020, 194, 284–294. [Google Scholar] [CrossRef]
  28. Perrone, D.; Donangelo, C.M.; Farah, A. Fast Simultaneous Analysis of Caffeine, Trigonelline, Nicotinic Acid and Sucrose in Coffee by Liquid Chromatography–Mass Spectrometry. Food Chem. 2008, 110, 1030–1035. [Google Scholar] [CrossRef]
  29. Cindrić, I.J.; Zeiner, M.; Kröppl, M.; Stingeder, G. Comparison of Sample Preparation Methods for the ICP-AES Determination of Minor and Major Elements in Clarified Apple Juices. Microchem. J. 2011, 99, 364–369. [Google Scholar] [CrossRef]
  30. Leśniewicz, A.; Grzesiak, M.; Żyrnicki, W.; Borkowska-Burnecka, J. Mineral Composition and Nutritive Value of Isotonic and Energy Drinks. Biol. Trace Elem. Res. 2016, 170, 485–495. [Google Scholar] [CrossRef]
  31. Onianwa, P.C.; Adetola, I.G.; Iwegbue, C.M.A.; Ojo, M.F.; Tella, O.O. Trace Heavy Metals Composition of Some Nigerian Beverages and Food Drinks. Food Chem. 1999, 66, 275–279. [Google Scholar] [CrossRef]
  32. Blunden, S.; Wallace, T. Tin in Canned Food: A Review and Understanding of Occurrence and Effect. Food Chem. Toxicol. 2003, 41, 1651–1662. [Google Scholar] [CrossRef]
  33. Parkar, J.; Rakesh, M. Leaching of Elements from Packaging Material into Canned Foods Marketed in India. Food Control 2014, 40, 177–184. [Google Scholar] [CrossRef]
  34. Kregiel, D. Health Safety of Soft Drinks: Contents, Containers, and Microorganisms. BioMed Res. Int. 2015, 2015, 128697. [Google Scholar] [CrossRef] [Green Version]
  35. Marshall, T.A.; Levy, S.M.; Broffitt, B.; Warren, J.J.; Eichenberger-Gilmore, J.M.; Burns, T.L.; Stumbo, P.J. Dental Caries and Beverage Consumption in Young Children. Pediatrics 2003, 112, e184–e191. [Google Scholar] [CrossRef] [Green Version]
  36. Idris, A.M.; Vani, N.V.; Almutari, D.A.; Jafar, M.A.; Boreak, N. Analysis of Sugars and PH in Commercially Available Soft Drinks in Saudi Arabia with a Brief Review on Their Dental Implications. J. Int. Soc. Prev. Community Dent. 2016, 6, S192–S196. [Google Scholar] [CrossRef] [Green Version]
  37. EFSA Panel on Dietetic Products, Nutrition and Allergies (NDA). Scientific Opinion on the Safety of Caffeine. EFSA J. 2015, 13, 4102. [Google Scholar] [CrossRef] [Green Version]
  38. Cohen, P.A.; Attipoe, S.; Travis, J.; Stevens, M.; Deuster, P. Caffeine Content of Dietary Supplements Consumed on Military Bases. JAMA Intern. Med. 2013, 173, 592–594. [Google Scholar] [CrossRef] [Green Version]
  39. McLellan, T.M.; Lieberman, H.R. Do Energy Drinks Contain Active Components Other than Caffeine? Nutr. Rev. 2012, 70, 730–744. [Google Scholar] [CrossRef]
  40. Al-Bratty, M.; Alhazmi, H.A.; Rehman, Z.U.; Javed, S.A.; Ahsan, W.; Najmi, A.; Khuwaja, G.; Makeen, H.A.; Khalid, A. Determination of Caffeine Content in Commercial Energy Beverages Available in Saudi Arabian Market by Gas Chromatography-Mass Spectrometric Analysis. J. Spectrosc. 2020, 2020, e3716343. [Google Scholar] [CrossRef]
  41. European Parliament, Council of the European Union. Directive (EU) 2020/2184 of the European Parliament and of the Council of 16 December 2020 on the Quality of Water Intended for Human Consumption (Recast) (Text with EEA Relevance); European Union Commission: Brussels, Belgium, 2020. [Google Scholar]
  42. Higgins, J.P.; Tuttle, T.D.; Higgins, C.L. Energy Beverages: Content and Safety. Mayo Clin. Proc. 2010, 85, 1033–1041. [Google Scholar] [CrossRef] [Green Version]
  43. Bingöl, M.; Yentür, G.; Er, B.; Öktem, A.B. Determination of Some Heavy Metal Levels in Soft Drinks from Turkey Using ICP/OES Method. Czech J. Food Sci. 2010, 28, 213–216. [Google Scholar] [CrossRef] [Green Version]
  44. Ibrahim, D.; Froberg, B.; Wolf, A.; Rusyniak, D.E. Heavy Metal Poisoning: Clinical Presentations and Pathophysiology. Clin. Lab. Med. 2006, 26, 67–97. [Google Scholar] [CrossRef] [PubMed]
  45. World Health Organization. Guidelines for Drinking-Water Quality, 4th ed.; World Health Organization: Geneva, Switzerland, 2011. [Google Scholar]
  46. Al Rmalli, S.W.; Haris, P.I.; Harrington, C.F.; Ayub, M. A Survey of Arsenic in Foodstuffs on Sale in the United Kingdom and Imported from Bangladesh. Sci. Total Environ. 2005, 337, 23–30. [Google Scholar] [CrossRef] [PubMed]
  47. Mandal, B.K.; Suzuki, K.T. Arsenic Round the World: A Review. Talanta 2002, 58, 201–235. [Google Scholar] [CrossRef] [PubMed]
  48. Filella, M. Antimony and PET Bottles: Checking Facts. Chemosphere 2020, 261, 127732. [Google Scholar] [CrossRef]
  49. Kiyataka, P.H.M.; Dantas, S.T.; Albino, A.C.; Pallone, J.A.L. Antimony Assessment in PET Bottles for Soft Drink. Food Anal. Methods 2018, 11, 1–9. [Google Scholar] [CrossRef]
  50. Xu, S.; Zhou, P.; Li, H.; Juhasz, A.; Cui, X. Leaching and In Vivo Bioavailability of Antimony in PET Bottled Beverages. Environ. Sci. Technol. 2021, 55, 15227–15235. [Google Scholar] [CrossRef]
  51. Onianwa, P.C.; Adeyemo, A.O.; Idowu, O.E.; Ogabiela, E.E. Copper and Zinc Contents of Nigerian Foods and Estimates of the Adult Dietary Intakes. Food Chem. 2001, 72, 89–95. [Google Scholar] [CrossRef]
  52. Mirwan, A.; Putra, M.D.; Lestari, R.A.; Haka, M.R.; Ulum, M.B. Effect of Acid Concentration on the Aluminum Leaching Process. IOP Conf. Ser. Earth Environ. Sci. 2020, 524, 012010. [Google Scholar] [CrossRef]
  53. Froes, R.E.S.; Borges Neto, W.; Naveira, R.L.P.; Silva, N.C.; Nascentes, C.C.; da Silva, J.B.B. Exploratory Analysis and Inductively Coupled Plasma Optical Emission Spectrometry (ICP OES) Applied in the Determination of Metals in Soft Drinks. Microchem. J. 2009, 92, 68–72. [Google Scholar] [CrossRef]
  54. Kolaylı, S.; Ocak, M.; Küçük, M.; Abbasoǧlu, R. Does Caffeine Bind to Metal Ions? Food Chem. 2004, 84, 383–388. [Google Scholar] [CrossRef]
  55. El Khediri, S.; Fakhet, W.; Moulahi, T.; Khan, R.; Thaljaoui, A.; Kachouri, A. Improved Node Localization Using K-Means Clustering for Wireless Sensor Networks. Comput. Sci. Rev. 2020, 37, 100284. [Google Scholar] [CrossRef]
Figure 1. Multivariate correlation analysis of measured variables.
Beverages 09 00056 g001
Figure 2. Multiple factor analysis for the measured parameters in blocks (pH, caffeine, and elements) between HIH beverage samples.
Beverages 09 00056 g002
Figure 3. Consensus nap for the measured parameters in blocks (pH, caffeine, and elements) between HIH beverage samples.
Beverages 09 00056 g003
Table 1. pH values, container, and label in HIH beverage samples.
SamplepHContainerLabel
S12.99 ± 0.2 b,c,dPET bottlecarbon dioxide, citric acid, orange juice from concentrate (5%), caffeine, sodium gluconate, potassium sorbate, ascorbic acid
S23.44 ± 0.08 a,bAluminum cancarbon dioxide, citric acid, taurine, sodium citrate, L-carnitine, L-tartrate, caffeine, sorbic acid, benzoic acid, niacinamide (vit. B3), pyridoxine hydrochloride (vit. B6), riboflavin (vit. B2), cyanocobalamin (vit. B12)
S33.42 ± 0.17 a,bAluminum cancarbon dioxide, citric acid, taurine, sodium bicarbonate, magnesium carbonate, colors, caffeine, niacinamide (vit. B3), pyridoxine hydrochloride (vit. B6), calcium pantothenate, cyanocobalamin (vit. B12)
S42.68 ± 0.14 dAluminum cancarbon dioxide, phosphoric acid, natural flavors, caffeine
S53.24 ± 0.22 b,cPET bottlecitric acid, sodium citrate, monopotassium phosphate, yellow 6 (sunset yellow FCF)
S62.7 ± 0.18 c,dPET bottleless than 0.5% of citric acid, monopotassium phosphate, magnesium chloride, calcium chloride, vitamins B3, B6, B12 (niacinamide, pyridoxine hydrochloride, cyanocobalamin), ascorbic acid, calcium disodium EDTA
S73.53 ± 0.25 a,bPET bottlecitric acid, L-carnitine, acesulfame potassium, sucralose
S83.97 ± 0.27 aPET bottlecitric acid monohydrate, L-carnitine, L-citrulline, beta-alanine, caffeine anhydrous, taurine, sucralose, acesulfame potassium, colors (sulfite ammonia caramel, ponceau 4R, carmoisine)
Statistically significant differences (p < 0.05) are denoted by different superscript letters (e.g., a–d).
Table 2. The caffeine content in HIH beverage samples.
CodeCaffeine Content Listed on the Label (per 100 mL of Beverage)Serving (mL)Caffeine (mg/100 mL) Measuredmg Caf/Serving Measured% Difference from Caffeine Label Amount
S1Caffeine listed as a flavoring ingredient but not quantified50010.81 ± 0.74 c54.05n.a.
S232 mg50034.23 ± 1.95 b171.15+6.97
S332 mg25033.78 ± 0.95 b84.45+5.56
S4Caffeine listed as an ingredient3309.53 ± 0.6 c31.45n.a.
S5n.a.5000.04 ± 0 d0.20n.a.
S6n.a.5000.02 ± 0 d0.10n.a.
S7n.a.5000.03 ± 0 d0.15n.a.
S840 mg25038.93 ± 0.9 a97.32–2.68
Statistically significant differences (p < 0.05) in the caffeine content column are denoted by different superscript letters (e.g., a–d); n.a., not applicable.
Table 3. The total concentration of elements (mg/L) in HIH beverage samples and their parametric values (mg/L).
ElementParametric Value * (mg/L)Coded HIH Beverage Samples
S1S2S3S4S5S6S7S8
Agn.a.0.046 ± 0.001 a,b0.041 ± 0.001 b,c0.049 ± 0.003 a0.043 ± 0.001 b,c0.04 ± 0.002 c0.04 ± 0.001 c0.04 ± 0.003 c0.039 ± 0.002 c
Al0.20.19 ± 0.014 d0.434 ± 0.013 a0.242 ± 0.029 c0.35 ± 0.019 b0.081 ± 0.003 e0.109 ± 0.005 e0.161 ± 0.008 d0.116 ± 0.007 e
As0.010.004 ± 0 d0.009 ± 0.001 a0.006 ± 0 c0.006 ± 0 c0.003 ± 0 e0.008 ± 0 a,b0.007 ± 0 b0.008 ± 0 a
B1.50.277 ± 0.007 b0.246 ± 0.018 b,c0.218 ± 0.012 c,d0.258 ± 0.012 b,c0.197 ± 0.007 d0.271 ± 0.017 b0.267 ± 0.014 b0.56 ± 0.034 a
Ban.a.n.d.n.d.n.d.n.d.n.d.n.d.n.d.n.d.
Ben.a.n.d.n.d.n.d.n.d.n.d.n.d.n.d.n.d.
Can.a.40.295 ± 0.967 b2.262 ± 0.131 d86.70 ± 4.075 a15.034 ± 0.947 c3.806 ± 0.247 d6.19 ± 0.229 d5.618 ± 0.14 d2.37 ± 0.123 d
Cd0.005n.d.0.002 ± 0 bn.d.0.001 ± 0 c0.002 ± 0 c0.002 ± 0 a0.002 ± 0 b0.001 ± 0 d
Con.a.n.d.n.d.n.d.n.d.n.d.n.d.n.d.n.d.
Cr0.050.008 ± 0 c0.01 ± 0 a0.001 ± 0 f0.008 ± 0 c0.004 ± 0 d0.001 ± 0 f0.003 ± 0 e0.009 ± 0 b
Cu2.00.187 ± 0.01 a0.035 ± 0.002 d0.048 ± 0.003 c0.047 ± 0.001 c,d0.014 ± 0 e0.018 ± 0.001 e0.072 ± 0.005 b0.044 ± 0.003 c,d
Fe0.20.087 ± 0.003 a0.073 ± 0.003 b0.093 ± 0.007 a0.065 ± 0.002 b,c0.066 ± 0.003 b,c0.04 ± 0.001 d0.058 ± 0.002 c0.064 ± 0.005 b,c
Kn.a.109.422 ± 8.207 b10.578 ± 0.434 d,e6.368 ± 0.452 e28.218 ± 1.411 c210.25 ± 12.405 a30.707 ± 1.781 c31.123 ± 2.085 c21.834 ± 1.419 c,d
Lin.a.n.d.n.d.n.d.n.d.n.d.n.d.n.d.0.015 ± 0.001
Mgn.a.13.959 ± 0.335 c0.369 ± 0.018 d98.489 ± 6.205 a1.685 ± 0.113 d37.608 ± 1.88 b2.194 ± 0.156 d0.868 ± 0.036 d0.63 ± 0.013 d
Mn0.050.02 ± 0.001 b0.008 ± 0 e0.018 ± 0.001 b,c0.019 ± 0.001 b,c0.017 ± 0.001 c,d0.01 ± 0.001 e0.022 ± 0.001 a0.015 ± 0.001 d
Mon.a.n.d.n.d.n.d.n.d.n.d.n.d.n.d.0.006 ± 0.001
Nan.a.40.58 ± 2.8 b24.25 ± 1.091 c21.35 ± 0.705 c,d4.479 ± 0.228 f60.52 ± 2.179 a25.25 ± 1.162 c9.996 ± 0.59 e20.009 ± 0.68 d
Nin.a.0.012 ± 0.001 c0.015 ± 0.001 b0.018 ± 0.001 a0.016 ± 0.001 b0.007 ± 0 d0.012 ± 0.001 c0.01 ± 0.001 c0.015 ± 0.001 b
Pn.a.1.629 ± 0.101 b1.896 ± 0.118 a1.166 ± 0.03 c2.042 ± 0.047 a0.993 ± 0.065 c,d0.293 ± 0.012 f0.932 ± 0.022 d0.543 ± 0.023 e
Pb0.010.008 ± 0 c,d0.009 ± 0.001 a,b0.008 ± 0 b,c0.007 ± 0 d0.008 ± 0 c,d0.005 ± 0 e0.01 ± 0.001 a0.003 ± 0 f
Sn.a.40.306 ± 2.701 c55.57 ± 2.89 b20.414 ± 0.817 e69.107 ± 3.317 a5.222 ± 0.261 g16.687 ± 0.567 e,f29.437 ± 0.706 d12.334 ± 0.863 f
Sbn.a.n.d.n.d.n.d.n.d.0.003 ± 0 a0.002 ± 0 d0.002 ± 0 c0.002 ± 0 b
Se0.02n.d.n.d.n.d.n.d.n.d.n.d.n.d.n.d.
Sin.a.8.607 ± 0.577 a0.624 ± 0.028 c3.073 ± 0.187 b1.249 ± 0.086 cn.d.8.097 ± 0.405 an.d.n.d.
Srn.a.0.014 ± 0 e0.024 ± 0.001 c0.016 ± 0.001 d0.001 ± 0 g0.025 ± 0.001 c0.033 ± 0.001 b0.043 ± 0.001 a0.011 ± 0.001 f
Tin.a.0.019 ± 0.001 c0.022 ± 0.001 c0.018 ± 0.001 c0.084 ± 0.004 a0.007 ± 0 d,e0.003 ± 0 e0.011 ± 0.001 d0.027 ± 0.001 b
Thn.a.n.d.n.d.n.d.n.d.n.d.n.d.n.d.n.d.
Vn.a.0.008 ± 0 a0.005 ± 0 b0.003 ± 0 d0.001 ± 0 e,f0.002 ± 0 e0.003 ± 0 c,d0.001 ± 0 f0.003 ± 0 c
Znn.a.0.2 ± 0.014 a0.1 ± 0.002 b0.091 ± 0.005 b0.085 ± 0.002 b,c0.072 ± 0.004 c,d0.072 ± 0.005 c,d0.089 ± 0.006 b,c0.064 ± 0.002 d
* Parametric values (mg/L of drinking water) (EC 2020/2184). Statistically significant differences (p < 0.05) within each row are denoted by different superscript letters (e.g., a–g); n.a., not applicable; n.d., not detected.
Disclaimer/Publisher’s Note: The statements, opinions and data contained in all publications are solely those of the individual author(s) and contributor(s) and not of MDPI and/or the editor(s). MDPI and/or the editor(s) disclaim responsibility for any injury to people or property resulting from any ideas, methods, instructions or products referred to in the content.

