Article

Live, Probiotic, or Neither? Microbial Composition of Retail-Available Kombucha and “Hard” Kombucha in the Pacific Northwest of the United States

1
Department of Food Science and Technology, Oregon State University, Corvallis, OR 97331, USA
2
Sierra Nevada Brewing Company, Chico, CA 95928, USA
3
Center for Quantitative Life Sciences, Oregon State University, Corvallis, OR 97331, USA
*
Author to whom correspondence should be addressed.
Beverages 2023, 9(3), 59; https://doi.org/10.3390/beverages9030059
Submission received: 28 March 2023 / Revised: 18 April 2023 / Accepted: 17 May 2023 / Published: 11 July 2023
(This article belongs to the Section Beverage Technology Fermentation and Microbiology)

Abstract

:
Kombucha is an acidic non-alcoholic fermented tea beverage that has surged in popularity over the past decade. A key driver of this popularity is the perception that kombucha contains microbes that contribute to gut health, a perception that is reinforced by package claims such as “live” and “probiotic”. We surveyed retail-available non-alcoholic (soft) and alcoholic (hard) kombucha and selected 39 products, of which 74.4% included at least one of these claims. Based upon Nuclear Magnetic Resonance (NMR) evaluation of the chemical composition, approximately one-third of soft kombucha products were re-categorized as “soft-aberrant” on the basis of their alcohol by volume (ABV) exceeding 0.5%. Across all three categories, the majority (82.1%) of products were “live”, containing culturable yeast and/or bacteria. However, there were no significant differences in median maximum colony-forming unit (CFU) counts between these categories, nor was there a difference according to package claims. Interestingly, only 6.3% of soft and 10% of soft-aberrant kombucha products exceeded 10 6 CFU/mL, the threshold that would deliver at least one billion cells in one package. None of the sampled hard kombucha exceeded this threshold. Metabarcoding analyses of microbial communities revealed differences in composition between categories and according to package claims. Notably, the subset of products with “probiotic” claims that listed Bacillus coagulans as an ingredient were enriched in read counts for Bacillus.

1. Introduction

Fermented foods and beverages have become a major feature of a consumer trend known as the “wellness lifestyle”, whereby individuals make dietary choices with the intention of pursuing or maintaining a health goal [1]. This is particularly true of non-alcoholic fermented products that contain, or are perceived to contain, live beneficial microorganisms at the point of retail sale. Kombucha, a fermented tea-based beverage, falls into this category and is generally considered to be a functional food [2].
Research into the functionality of kombucha has explored a range of perceived health benefits. While there is a lack of supporting clinical data [3], in vitro studies have demonstrated that tea polyphenols are potent antioxidants [4], fermented kombucha inhibits the growth of foodborne pathogens [5], and kombucha extracts exhibit antiproliferative effects on cancer cells [6], along with an array of other bioactivities. In addition, some recent animal studies have indicated that the consumption of kombucha can alter the gut microbiome and alleviate disease states, results that align with the generalized concept that fermented foods containing live microbes exert their impacts via direct interactions with the gastrointestinal tract and its microbiota [7,8]. Nevertheless, the potential for a fermented food to provide gut- and general-health benefits does not equate to probiotic status, which is reserved for systems where a known dosage of specific microbes with demonstrated health benefits can be assured [9]. Are the terms “live”, “contains probiotics”, and “probiotic beverage”, often used to describe kombucha [2], warranted based on how it is produced?
The traditional process of kombucha production involves the inoculation of sweetened tea with a cellulosic pellicle harboring an undefined microbial community known as the SCOBY (Symbiotic Culture of Bacteria and Yeast) [10,11,12]. Upon the completion of fermentation, these microbes remain part of the tea, which is adjusted for preferred organoleptic properties by the addition of flavorants and non-caloric sweeteners [11] and then carbonated and bottled for commercial sale. Although microbial taxa within the kombucha pellicle may vary between producers, the most prevalent belong to the acetic acid bacteria (AAB) Komagataeibacter and the fermentative yeast Brettanomyces [13,14]. Neither genus has been associated with physiological impacts on ingestion or health benefits. While few studies have profiled the microbiota of retail-available kombuchas, Andreson et al. [15] found that Brettanomyces was the dominant yeast genus in 16 European samples. In the same study, Komagataeibacter was often displaced by Bacilli and Lactobacilli, possibly reflecting that some producers inoculate before packaging with known probiotic strains of Bacillus coagulans, B. subtilis, Lacticaseibacillus rhamnosus, and S. cerevisae var boulardii [2].
“Hard”, or alcoholic, kombucha is a relatively new beverage category, and its production practices are not described in the scientific literature. The process of the hard kombucha production workflow and how it compares to the soft kombucha production workflow is postulated in Figure 1. It is likely that some hard kombuchas on the market reflect a minimal extension of the traditional process of kombucha production, whereby an anaerobic phase without refrigeration is incorporated to allow ethanol to accumulate beyond 0.5-percent alcohol by volume (ABV). This process essentially takes advantage of a known problem in the “soft” (non-alcoholic) kombucha sector: post-packaging cold-chain failures that result in retail-available products that exceed the maximum allowed ABV [7]. It is also likely that hard kombucha is produced by the intentional inoculation of soft kombucha with the pre-eminent fermentation yeast species, S. cerevisiae [16]. To date, no studies have examined the chemical or microbial composition of finished retail-available hard kombucha.
Consumers seeking to embrace a “wellness lifestyle” are faced with a growing array of kombucha-based products, including “hard” styles containing alcohol. In this study, we surveyed kombucha beverages available at retail outlets in Oregon, USA, profiling their chemical and microbial compositions to address two hypotheses. First, we asked whether the chemical and microbial contents of hard kombucha differed from those found in soft kombucha. Then, we asked whether package claims of “live” or “probiotic”, or the specific mention of probiotic species and/or strains in the package ingredient lists, were predictive of the microbial content. Our results highlight the variability between retail-available kombucha products in terms of their composition and associated package claims, providing data that can guide further research focused on the nutritional and health outcomes of kombucha consumption.

2. Materials and Methods

2.1. Chemicals, Reagents, and Microbiological Media

Unless stated otherwise, all chemicals and reagents were obtained from Sigma-Aldrich (St. Louis, MO, USA). The standard yeast differential medium WLN (Millipore Burlington, MA, USA) agar was prepared by dissolving 77 g/L in deionized water. M13 agar for the cultivation of acetic acid bacteria contained 25 g/L d-mannitol, 5 g/L yeast extract, and 3 g/L peptone in deionized water, with the addition of 15 g/L agar (Bioplus, Altamonte Springs, FL, USA). Post-autoclave, M13 agar was supplemented with 2.0% (volume by volume) acetic acid and 2.0% (v/v) ethanol (Oregon State University Chemistry Store, Corvallis, OR, USA) prior to pouring into Petri dishes. Nutrient agar (NA; Research Products International, Mount Prospect, IL, USA) for the cultivation of spore-forming Bacilli was prepared by dissolving 23 g/L in deionized water with 15 g/L agar. MRS broth (Research Products International, Mount Prospect, IL, USA) for the cultivation of lactic acid bacteria was prepared by dissolving 55 g/L in deionized water. All media were sterilized by autoclaving at 121 °C for 15 min.

2.2. Kombucha Sampling and Processing

All kombucha products were purchased from retail stores in the Willamette Valley (Oregon, USA) in January 2021. A preliminary analysis of the ingredient lists of all kombucha products available at one online retailer (wholefoodsmarket.com, accessed on 11 March 2023) was used to define the prevalent flavor categories: “berry/fruity”, “ginger/citrus”, and “herbal/tea”. Brands available in the marketplace in Oregon were representatively sampled by purchasing products for each brand from within the prevalent flavor categories. Overall, 39 unique kombucha products from 21 brands were obtained (Table 1). One hard kombucha product and two soft kombucha products were repeat-sampled from different packages, providing an additional 7 samples for the evaluation of packaged product consistency. On-package claims of “live” or “probiotic” and the specific mention of probiotic cultures (species and strain, CFU count) in the ingredient lists were recorded as metadata (Table S1).
Each kombucha product was immediately transported in a cooler to Oregon State University following its purchase, where it was refrigerated at 4 °C until opened for sampling. Packaged products were agitated to homogenize contents and then allowed to rest for 2 min prior to being opened aseptically in a laminar-flow hood. Then, 50 mL was transferred into sterile gas-exchange “bioreactor” tubes (Tubespin, TPP Techno Plastic Products AG, Trasadingen, Switzerland) and centrifuged at 3900 RPM for 15 min to remove carbon dioxide. Degassed samples were vortexed and subsampled for chemical and microbiological analyses, and then the remainder of each was stored at 4 °C for resampling if required.
Subsamples were used immediately for dilution and standard plate counting. Additional subsamples for 1H NMR spectroscopy and DNA extraction were centrifuged at 15,000 RPM for 5 min. Supernatants were transferred to fresh tubes, and then supernatants and pellets were stored at −20 °C until use.

2.3. Enumeration of Culturable Yeast and Bacteria

For enumeration on Wallerstein (WLN), de Man Rogosa and Sharpe (MRS), Mannitol Agar (M13), and Nutrient Agar (NA) media, 39 unique samples and an additional 7 repeat samples were serially diluted in 0.1% sterile peptone water, and 100 µL of the appropriate dilution was spread onto the surface of each plate to generate 25–250 colony-forming units (CFU). For enumeration on MRS, samples were centrifuged, resuspended and serially diluted in MRS broth, and then 1 mL of the appropriate dilution was transferred to the surface of Aerobic Plate Count (APC) Petrifilm (3M, St. Paul, MN, USA) to generate <300 CFU. WLN and M13 plates were incubated aerobically at 27 °C for 7 days, and MRS-loaded APC Petrifilms were incubated anaerobically at 27 °C for 7 days in a BD GasPak EZ Container with EZ Gaskpak indicator sachets (Becton Dickinson and Company, Franklin Lakes, NJ, USA). NA plates were incubated aerobically at 27 °C for 2 days. All samples that did not generate a CFU count, or where CFU counts were out of range, were immediately repeat-plated from degassed reserve samples to confirm the lack of culturable cells or obtain counts within the target range.

2.4. 1H NMR Spectroscopy Analysis of Chemical Composition

2.4.1. Acquisition of Chemical Composition by 1H NMR Spectroscopy

The frozen supernatants of 39 unique samples and 7 additional repeat samples were thawed and incubated at room temperature. Samples were normalized to pH 7 using phosphate buffer (1.88 mM NaH 2 PO 4 •H 2 O, 5.8 mM Na 2 HPO 4 , pH 7.1). Then, 540 µL of each sample was transferred to a 5 mm NMR tube (Norell, Morganton, NC, USA) with 60 µL of 0.25 mM 4,4-dimethyl-4-silapentane-1-sulfonic acid (DSS) in 90% H 2 O/10% deuterium oxide (Chenomx Inc., Edmonton, Alberta, Canada). All spectra were acquired at 300 K using a Bruker Avance 800 MHz NMR spectrometer (Bruker BioSpin, Rheinstetten, Germany) operating at 800 MHz. NMR data were acquired with 128 scans at 32 K data points, a 1H spectral window of 9600 Hz, a 12.1 ppm spectral width, and a dwell time interval of 52 μ s between data point collections and a recovery (D1) delay of 5 s between acquisitions.

2.4.2. Analysis of 1H NMR Spectra

NMR spectra were Fourier transformed and automatically phased using TOPSPIN 3.7 software (Leyton, London, UK). Spectra were corrected for using Chenomx NMR suite 8.2 software (Edmonton, AB, Canada) with the DSS internal standard. Automatic phase correction, line broadening, water deletion, and baseline correction were performed on 39 samples according to the chemical form indicator. Some manual adjustments to the phase were used where necessary. Analytes were identified and quantified by fitting the 1D 1H spectral patterns, chemical shifts, and spectral intensities to references from the Chenomx spectral database for 800 MHz NMR spectrometers.
Principal component analysis (PCA) was applied to NMR analytes matched to reference spectra using “prcomp” from the package “stats” in R (Boston, MA, USA) [17]. The Wilcoxon rank-sum test, Kruskal–Wallis test, and multivariate analysis of variance (MANOVA) were employed for testing differences between “Types”, “Claim”, and “Organism listed” groups of kombucha. Ethanol gave a triplet signal at 1.20 ppm and a multiplet signal at 3.66 without noise from other analytes [
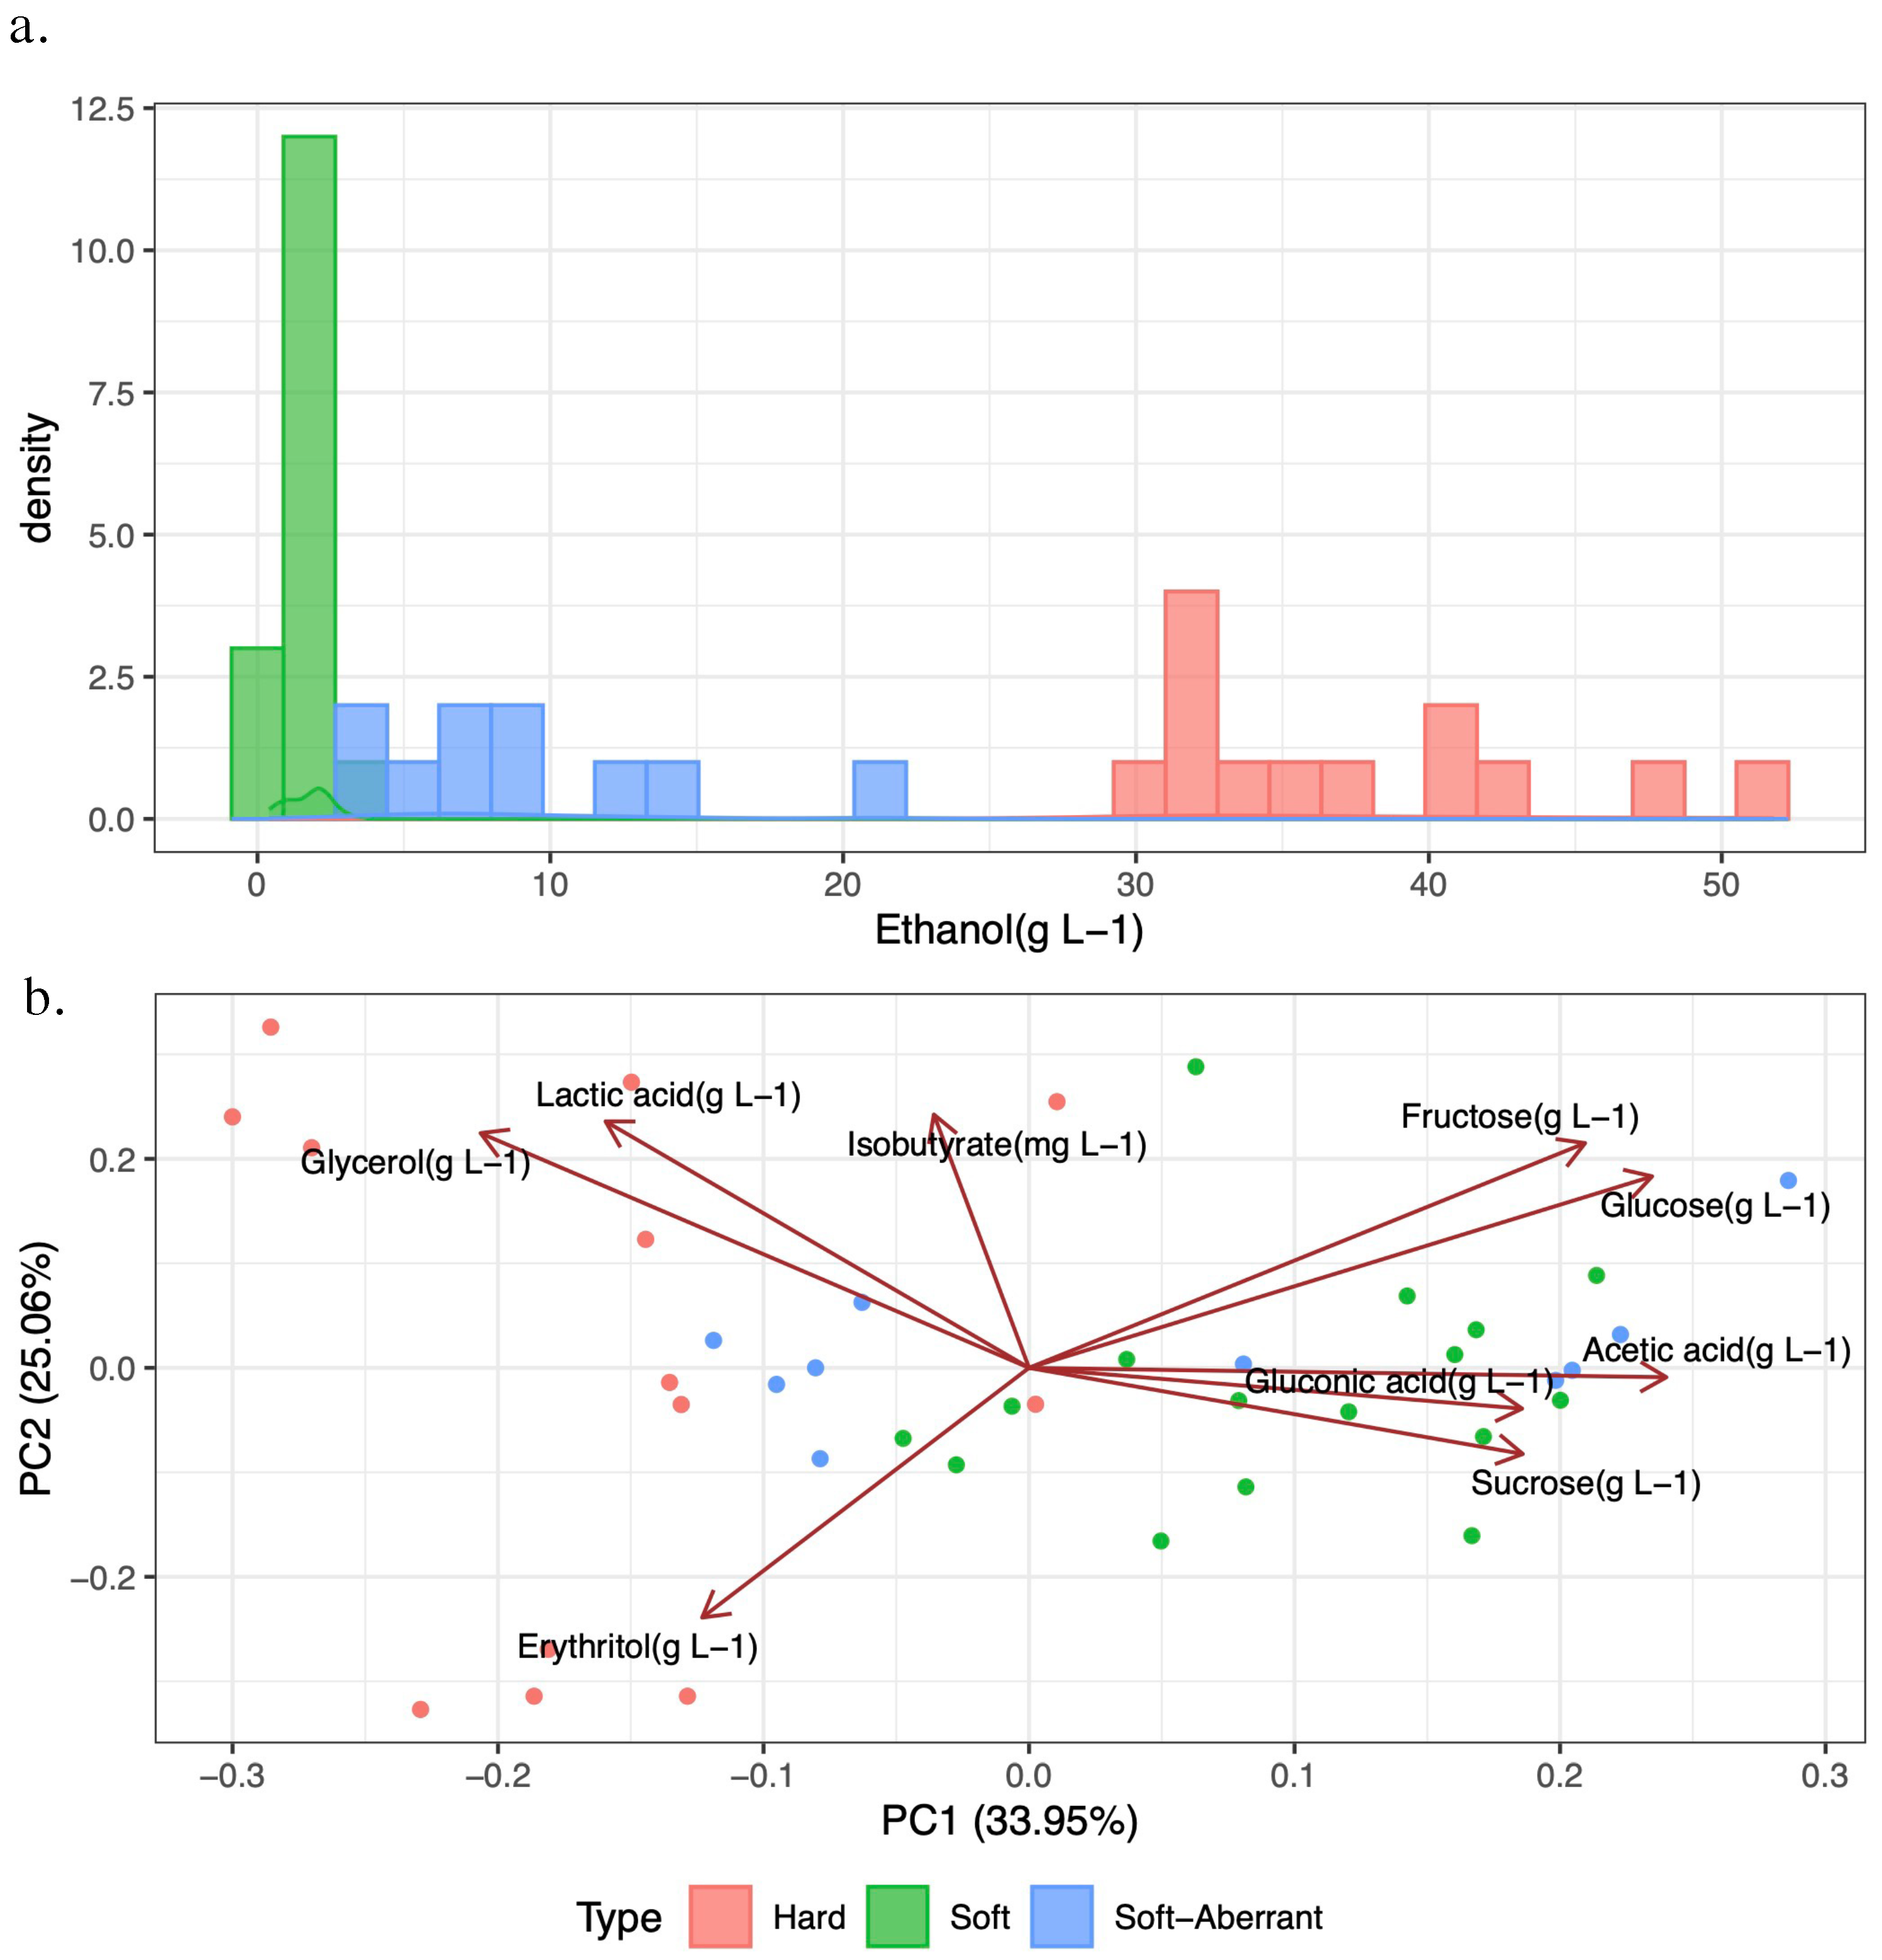
18]. The ABV for ethanol was calculated from g/L, and 0.5 ± 0.05% was used as the threshold for defining soft and soft-aberrant kombucha types. The cutoff used for the inclusion of organic acids in this study was 0.1 mg/L. Organic acids that fell below this threshold were excluded from analysis.

2.5. DNA Extraction for Microbiome Analysis

Centrifuged pellets for 39 unique samples and 7 additional repeat samples (see Section 2.2) were resuspended in molecular-grade water, and DNA was extracted using the DNeasy Power Foods Microbial kit (QIAGEN, Hilden, Germany) according to the manufacturer’s instructions with minor modifications. In place of vortexing, the Omni Bead Ruptor 24 (Omni International, Inc., Kennesaw, GA, USA) was used with 15 s pulses at 8.0 m/s with a 55 s pause and 10 cycles. All DNA extracts were quantified using the SpectraMax Quant Accuclear Nano dsDNA assay kit (Molecular Devices, San Jose, CA, USA) on the SpectraMax M2 (Molecular Devices, San Jose, CA, USA) with excitation and emission at 468 and 507 nm, respectively. The ZymoBIOMICS Microbial Community Standard (Zymo Research, Irvine, CA, USA) was included as a positive control for DNA extraction. DNA extracts were stored at 20  °C until further use.

2.6. Metabarcoding Sequencing and Data Analysis

2.6.1. Metabarcoding Sequence Processing

Libraries for metabarcoding analyses were prepared as described by Comeau et al. [19], with minor modifications. For the analysis of fungal communities, the fungal ITS2 region was amplified using BITS-F and B58S3-R primers [20]. For the analysis of bacterial communities, the bacterial 16S V4–V5 domain was amplified using F515 and R926 primers [21]. Forward and reverse fusion primers were designed using the scheme recommended by Comeau et al. [19] for Illumina Nextera XT v2 indices and Nextera adapters (Table S2).
Each DNA extract was amplified twice (reactions using 1× and 1/10× DNA concentration) using 12.5 µL of Platinum Hot Start 2× master mix (Thermo Scientific, Waltham, MA, USA), 1 µM of each primer, 2 µL of template DNA, and molecular-biology-grade water (Biotium, Hayward, NJ, USA) in a final volume of 25 µL. Successful amplification of DNA templates was verified by visualizing products on 1.5% agarose gels using 6× GelRed Nucleic Acid Stain (Biotium, Hayward, NJ, USA). Samples not successfully amplified were excluded from downstream processing (n = 2). Duplicate PCR products of 37 samples were combined, purified, and normalized using SequalPrep Normalization Plates (Thermo Scientific, Waltham, MA, USA) according to the manufacturer’s instructions. Pooled libraries were quantified using the Qubit dsDNA HS assay (Thermo Scientific, Waltham, MA, USA), and the median fragment size was determined on the Bioanalyzer 2100 high-sensitivity DNA assay (Agilent, Santa Clara, CA, USA). The pooled fungal ITS2 and bacterial 16S libraries were sequenced separately using MiSeq 2 × 300 bp v3 chemistry by the Oregon State University Center for Quantitative Life Sciences (CQLS, Corvallis, OR, USA) with a 5% PhiX spike-in, according to standard Illumina protocols.

2.6.2. Post-Sequencing Processing

Paired-end reads were trimmed and merged, and chimeric sequences were removed using the DADA2 plugin in QIIME2 (qiime dada2 denoise-paired) [22]. 16S OTUs were clustered at 100% sequence similarity (amplicon sequence variants) using DADA2 and classified using the QIIME2 pre-trained naïve Bayes classifier trained on the Greengenes database (13_8) [23]. ITS OTUs were classified using the classifier trained on UNITE (ver8) with q2-feature-classifier [24].

2.7. Metabarcoding Sequence Analysis

Metabarcoding data visualization was performed in R v4.2.1 following the Phyloseq and Microviz tutorials (https://vaulot.github.io/tutorials/Phyloseq_tutorial.html and https://david-barnett.github.io/microViz/articles/shao19-analyses.html, accessed on 11 March 2023 [25,26]. The function filter_taxa was used to remove taxa not seen more than 5 times in at least 25% of the samples. Two samples were excluded for having fewer than 500 reads [27]. To determine species-level assignments for 16S feature IDs, a BLAST search using the command blastn and NIH nt.fsa database was used [28]. Species richness (Chao1), alpha-diversity (Shannon), and beta-diversity metrics were grouped by facets of “Type” (“Soft”, “Soft-aberrant”, or “Hard”) and “Claims” (“Live”, “Probiotic”, or “No claim”) to compare compositions by kombucha type and label claim. Beta diversity was calculated using Bray–Curtis distance and visualized using MicroViz [29]. The samples in the NMDS plot are sorted based on their pairwise similarities, with closer samples representing more similar microbial communities. The ordering is determined by minimizing the stress value, which measures the discrepancy between the pairwise distances in the plot and the original distances between the samples. Generalized UniFrac and weighted UniFrac scores were calculated using the phyloseq distance function and were subsequently used to determine the dissimilarity between samples according to their bacterial and fungal communities. For beta diversity, overall and pairwise comparisons were made with permutational multivariate analyses of variance (PERMANOVA) and were performed using adonis in vegan [30]. For “type” comparisons, samples without NMR data were excluded from analyses.

3. Results

3.1. NMR 1H Analysis of the Chemical Composition of Retail-Available Kombucha

The products that we sampled from the retail market were categorized as either hard or soft kombucha types based on their package labeling. The median concentration of ethanol for these types was 35.2 g/L (4.6% ABV) for hard kombucha and 2.3 g/L (0.3% ABV) for soft kombucha (Table S3). However, for the soft kombucha type, 12 products exceeded the 0.5% (+/− 0.05%) ABV legal limit for the regulation of non-alcoholic beverages according to the US Alcohol and Tobacco Tax and Trade Bureau [31]. When soft kombucha products were separated into “soft” and “soft-aberrant” types, there was less variability in the distribution of ethanol concentrations by type (Figure 2a). A PCA biplot of analytes from the 1H NMR spectra showed some separation by type, even when ethanol was excluded. In particular, hard kombucha samples clustered to the left of the plot with several soft-aberrant samples, while soft kombucha clustered to the right of the plot (Figure S1 and Figure 2b). High-, medium-, and low-alcohol groups oriented along a sucrose–glycerol continuum so that samples with the most ethanol had the least residual sugar and the greatest concentration of glycerol, a fermentation byproduct. Correlations between analytes confirmed that ethanol was strongly correlated with glycerol (r = 0.83, p < 0.005) and anticorrelated with sucrose (r = −0.39, p < 0.01); no significant relationship was observed between ethanol and glucose.
A MANOVA analysis (p < 0.05) and post hoc LDA (p = 0.03) confirmed that the different kombucha types had significantly different analyte profiles (Figure S2, Table S4). The PCA plot shows a clear separation of samples based on their anaerobic fermentation products (lactic acid and glycerol) versus residual sugars and acetic acid. Hard kombucha samples cluster to the left of the biplot, while soft kombucha samples are clustered to the right. Interestingly, the major analytes present in soft-aberrant kombucha do not appear to be intermediates between hard and soft kombucha. Instead, some soft-aberrant samples cluster with hard kombucha samples, while others cluster with soft kombucha samples along the first principal component. Hard kombucha diverged from soft and soft-aberrant kombucha, exhibiting lower concentrations of sucrose, glucose, fructose, acetic acid, and gluconic acid (p < 0.05). Hard kombucha samples diverged into two groups based on the presence and absence of erythritol. Soft and soft-aberrant kombucha did not differ in terms of glucose and fructose (p > 0.05), but soft had significantly more sucrose than soft-aberrant kombucha (p < 0.05)).

3.2. Microbial Enumeration of Retail-Available Kombucha Products

Our enumeration strategy was designed to quantify microbial taxa associated with kombucha production: fermentative yeasts (WLN), acetic acid bacteria (M13), and lactic acid bacteria (MRS and anaerobic). Because several products sampled listed probiotic Bacillus strains as an ingredient, we also used media (NA) and short-term incubation to preferentially enumerate spore-forming Bacilli. We observed an overlap in the capacity of representative strains in each microbial category to grow on the different media under permissive conditions; therefore, in addition to analyzing CFU for each medium separately, we also considered “maximum CFU” (highest CFU count across all media) rather than “total CFU” as an indicator of how “live” each product was.
The majority of kombucha products (82.1%) in our survey exhibited a maximum CFU count of greater than 10 2 CFU/mL, our limit of quantification on all media. The overall median of counts across all media types and the median of maximum plate counts across all plate types were 4.0 and 4.5 log CFU/mL, respectively. For the kombucha samples in which we detected viable cells on at least one of the four media, the most frequent discernable growth was observed for NA (n = 27) and WLN (n = 23) media types (Table S5).
From Kruskal-Wallis chi-square analyses, we observed significantly higher maximum CFU counts in samples from bottles with no label claims compared to bottles with “live” label claims (Figure 3a, Table S6). Conversely, we did not observe significant differences in maximum CFU counts between the kombucha types, as depicted in Figure 3b. Considering each medium individually, CFU counts were significantly lower in hard kombucha samples only on the M13 medium (p < 0.05) (Figure 3c). Additionally, maximum CFU counts were significantly greater in samples from bottles with an organism listed on the bottle than in those without.
We noted that there were similar proportions of soft (52.9%), soft-aberrant (60%), and hard (61.5%) kombucha packages that made a probiotic claim on the label (Table S7). Based upon a generally accepted criterion that probiotic doses should measure in the billions of cells, for a typical kombucha package size of 500 mL, only samples exceeding 10 6 maximum CFU/mL approach this benchmark. Using this criterion, 6.3% and 10% of soft kombucha and soft-aberrant kombucha samples, respectively, attain a potentially probiotic dose, while no samples from the hard kombucha type were above this level. It is also worth noting that only 13% of packages with a probiotic claim were found to contain more than 10 6 maximum CFU/mL. For a subset of 14 products across three brands (A = 7 samples, B = 5 samples, and C = 2 samples), we then compared maximum CFU counts with total CFU counts listed on package labels “at bottling” (Figure 3d). While there was variation between products within each brand, the mean difference between reported and actual CFU counts was in the range from log 0.78 to 4.50 CFU/mL, with a median difference of log 1.62 CFU/mL.

3.3. Microbial Composition of Hard, Soft, and Soft-Aberrant Retail-Available Kombucha

Metabarcoding analyses were used to evaluate the yeast and bacterial compositions of each kombucha sample. For bacteria, neither species richness nor the evenness of 16S reads differed significantly between kombucha types (Figure S3). Similarly, for fungi, the diversity of ITS reads did not differ among kombucha types (Figure S4). However, the species richness of ITS reads was significantly higher among soft kombucha samples when compared to hard kombucha (Chao1, p = 0.04).
Based on NMDS distance calculations, soft and soft-aberrant samples in the 16S ordination plot are more proximally arranged to each other than to hard samples (Figure 4), indicating that their microbial compositions are more similar. The ITS ordination plots, on the other hand, show a more mixed sample proximity, suggesting that the kombucha type is not a strong predictor of the ITS microbial composition. These observations were supported by significant differences (PERMANOVA on Bray–Curtis dissimilarity) in bacterial 16S but not in fungal ITS reads according to the kombucha type (Table 2).
Of the nine bacterial genera detected above the minimal cutoff criterion, the relative abundance differed significantly (p < 0.05) between soft and hard kombucha for Gluconobacter, Lactobacillus, Bacillus, and Streptococcus (Table S8). Gluconobacter and Bacillus were the most abundant genera observed in soft kombucha samples, and the relative abundance of each was significantly higher (p < 0.05) in these samples compared to hard kombucha. Meanwhile, for hard kombucha, both Lactobacillus and Bacillus were observed to be the most abundant genera. The relative abundance of Lactobacillus was shown to be significantly higher in hard kombucha when compared to soft kombucha (p < 0.05). Interestingly, Komagataeibacter was the dominant (relative abundance > 0.5) bacterial taxa in only a handful of samples (two soft and one hard) and, on average, was present at a relatively low abundance across all three kombucha types.
Consistent with the lack of difference in overall ITS profiles, among the 11 fungal species detected in retail-available kombucha, only 2 displayed significant differences (p < 0.05) in relative abundance between kombucha types (Table S9). Notably, S. cerevisiae was more abundant in hard than in soft-aberrant kombucha, while B. anomalus was more abundant in soft kombucha relative to hard kombucha samples.

3.4. Microbial Composition of Commercial Kombucha with “Live” and “Probiotic” Claims

Products with package claims of “live” had significantly higher species richness (p = 0.01; p = 0.009) for bacterial 16S reads than those with “probiotic” or no claim (Figure S5). For fungal ITS reads, both indices differed significantly (p < 0.05), paradoxically implying significantly greater species richness and taxonomic diversity among samples with neither a “live” nor “probiotic” claim (Figure S6, Tables S10 and S11).
For the 23 products that incorporated “probiotic” claims on their packaging, 12 listed at least one organism as an added ingredient: B. coagulans, Lactobacillus spp., and/or S. boulardii. S. boulardii was listed as an ingredient for two products. Alpha diversity did not significantly differ between those with and without listed strains as ingredients.
Considering the overall relative abundance profiles (Figure 4), samples with “live” claims exhibited closer proximity in terms of NMDS distances on both the 16S and ITS plots, whereas products with either the “probiotic” or no claim were dispersed around the plots. Further inspection of the data revealed significant differences (PERMANOVA on Bray–Curtis dissimilarity) in bacterial 16S and fungal ITS reads according to package claims and bacterial 16S reads according to the listing of probiotic species/strains in package ingredient lists (Table 3).
When examining the distribution of read counts assigned to the genus Bacillus, we observed a bimodal distribution with dense representation around log 1.5 and log 4.5 sequencing reads (Figure 5a). The latter peak was associated with products listing Bacillus as an ingredient. Furthermore, when normalized against total 16S reads, there was a significant difference between samples listing Bacillus species as an ingredient and all other samples ( X 2 ; p < 0.005). Additionally, for every sample with Bacillus as an ingredient, at least one representative sequence feature when submitted to blastn returned B. coagulans as a top hit (Table S12). This was not the case for products that did not include Bacillus as an ingredient but displayed relatively high Bacillus read counts. Meanwhile, the distribution of reads assigned to Lactobacillus displayed a multimodal distribution, with no significant differences according to the inclusion of Lactobacillus in the ingredient list (Figure 5b, p = 0.27). Indeed, only 33% of products listing Lactobacillus as an ingredient showed at least one representative sequence feature associated with Liquorilactobacillus nagelli by blastn. L. nagelli was also returned as a blastn result of sequence features observed for products that did not list Lactobacillus as an ingredient.
For the two samples that listed S. cerevisiae var. boulardii as an ingredient, the dominant fungal taxon observed was B. bruxellensis, comprising 98 and 94% of ITS reads (Table S13).

3.5. Packaged Product Consistency

We evaluated multiple packages of three distinct kombucha products, one hard (AC) and two soft (AJ and BD), from three different brands. The 1H NMR profiles of the three different products were distinct, and replicates clustered together (Figure 6). All three products displayed some degree of variation in maximum CFU counts; interestingly, the product with the greatest variation (AJ) was also the most variable in terms of 16S and ITS metabarcoding profiles. Product AJ lists Bacillus coagulans as an ingredient, yet in three of the four sampled packages, approximately 50% of sequence reads were assigned to Gluconobacter. In one package sample of this product, we noted that the otherwise dominant Brettanomyces population was displaced by Saccharomyces. Nevertheless, there was no indication of continued “in-package” alcoholic fermentation based upon the minimal variation in ethanol and residual sugar concentrations between replicates.

4. Discussion

Kombucha has rapidly become a mainstream beverage over the past decade, as the emergent public awareness of gut health as a function of the gut microbiome has become a driver for consumers to make choices consistent with the “wellness lifestyle”. Central to the place of kombucha within this paradigm is the perception that it contains live, potentially probiotic microbes and that non-alcoholic styles are indeed non-alcoholic.
Within our survey, approximately one-third of retail-available non-alcoholic kombucha products exceeded the TTB’s threshold of 0.5% ABV. This is consistent with the proportion of non-compliant samples (>1% ABV) observed in a comprehensive (n = 684) sampling of kombucha products from different points of sale in British Columbia, Canada [32]. We termed these samples “soft-aberrant” and assume that excess ethanol was due to in-package refermentation, possibly reflecting failures in cold-chain logistics [33].
Distinct chemical profiles of hard kombucha samples suggest that products available at retail in the Pacific Northwest of the United States are intentionally alcoholic, utilizing defined production systems, rather than representing aberrant batches of soft kombucha. We found that hard kombucha contained more glycerol, and it is notable that the most prevalent fungal species associated with soft kombucha production, Brettanomyces bruxellensis [10,11], produces negligible glycerol during alcoholic fermentation under anaerobiosis in minimal culture medium (5% glucose, 0.2% (NH4)2SO4, 0.5% KH2PO4, 0.04% MgSO4·7H2O, and 0.1% yeast extract) [34]. Saccharomyces cerevisiae, on the other hand, is known to balance its redox state during fermentation and manage osmotic stress by making more glycerol [35]. While no studies have directly assessed whether these yeast species exhibit similar behavior under conditions of kombucha fermentation, we speculate that hard kombucha producers inoculate a base kombucha tea with starter cultures of S. cerevisiae, given its widespread application in other alcoholic fermentations [16]. The detection of erythritol only in hard kombucha samples in our survey, on the other hand, is less readily explainable. As a non-caloric sweetener, erythritol addition likely reflects attempts to appeal to health-conscious consumers [2,36]. Alternatively, hard kombucha producers may be taking advantage of the relative microbial stability conferred by ethanol, acidity, and low residual sugars and therefore using erythritol for organoleptic balance without a risk of continued in-package fermentation, even when stored at non-refrigeration temperatures.
We found that across soft, soft-aberrant, and hard kombucha samples, the main organic acids were acetic acid, gluconic acid, and lactic acid. We did not detect glucuronic acid, a finding in line with recent studies, which may have implications for some health claims associated with consuming kombucha [15,37]. However, it is important to note that our study only analyzed a limited number of commercially available kombucha brands.
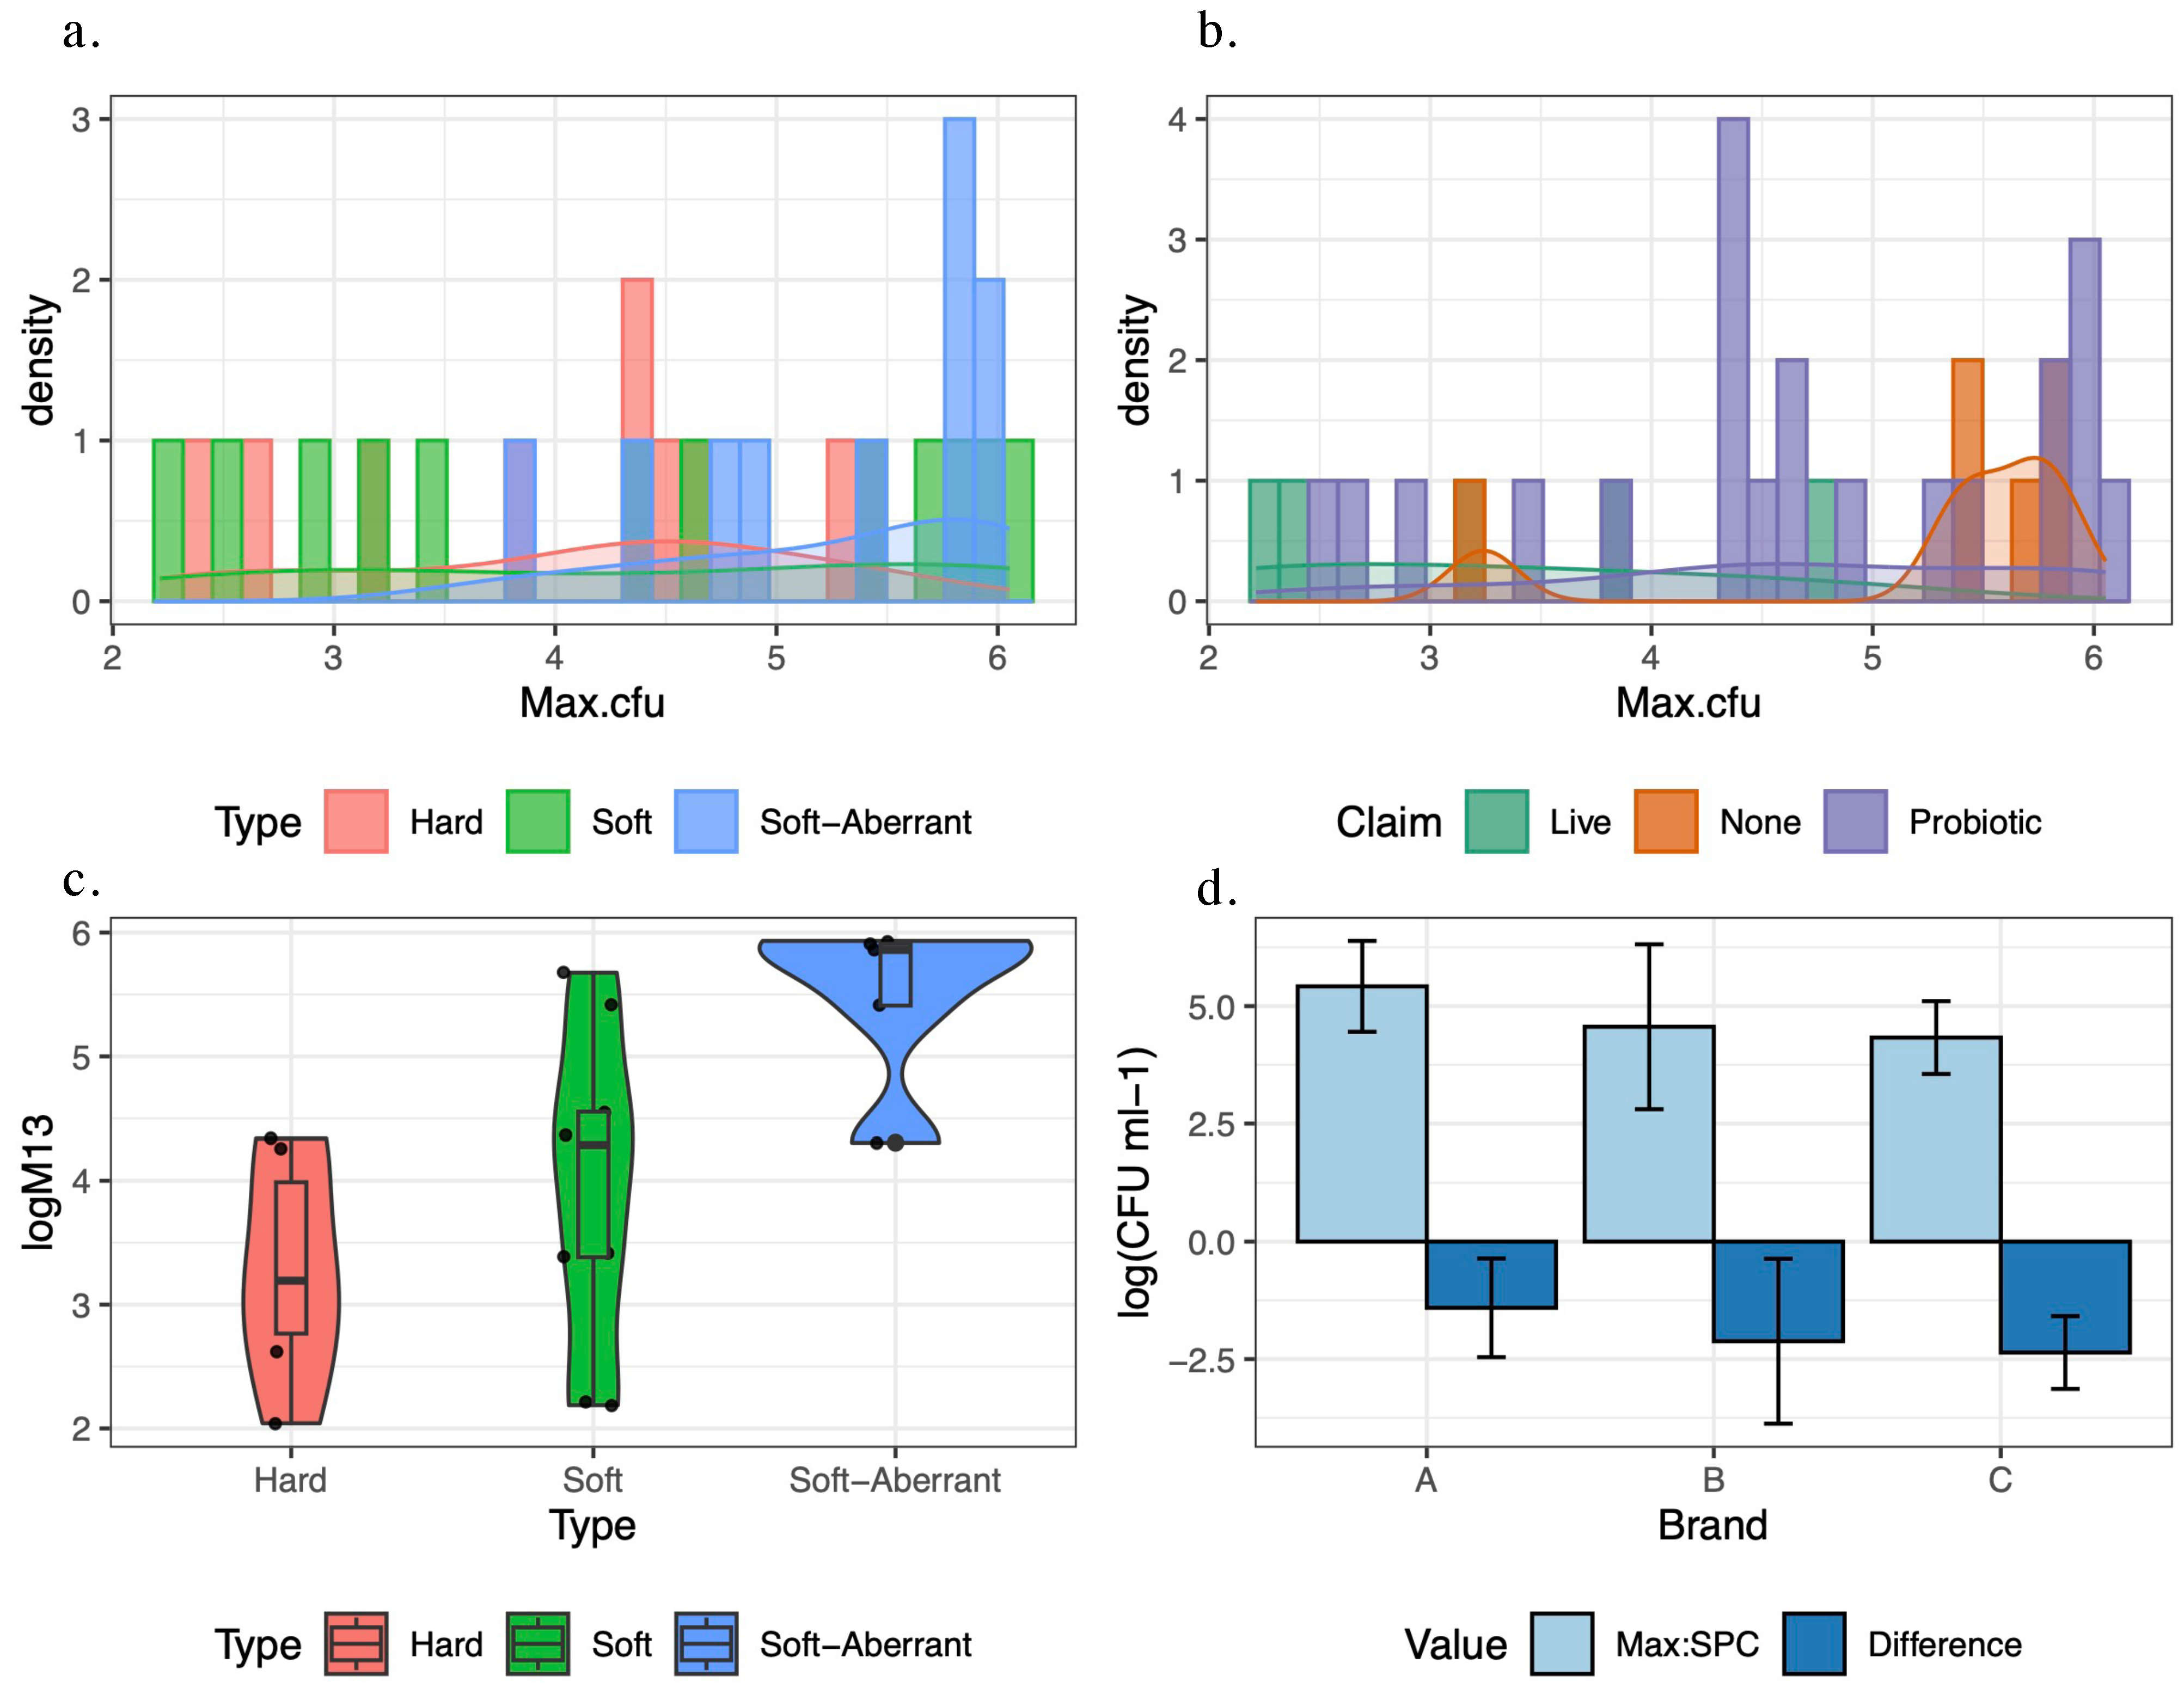
Based upon our dataset, the risk of kombucha continuing alcoholic fermentation in-package is considerable, because across all three kombucha types, the majority of products sampled contained culturable microbes. We observed a wide range of maximum CFU counts, from 10 2 to 10 7 CFU/mL, but did not observe a relationship with alcohol (kombucha type). Live microbial population sizes in our survey were lower than the 10 7 10 9 CFU/mL quantified using qPCR across 16 retail kombucha samples in a recent study [15]. Our results are, however, in line with culturable microbial populations in the liquid phase during kombucha fermentation [37,38]. Compared with other “live” fermented foods, retail-available kombucha CFU counts span a similar range to traditional Asian fermented foods, such as miso, tempeh, and fish sauce, all of which contain fewer CFU than yogurt or other cultured dairy foods [39].
In contrast to the lack of differences between kombucha types with regard to culturable microbial population sizes, the structures of retail-available hard, soft, and soft-aberrant kombucha microbial communities diverged. The major difference between fungal communities was that hard kombucha exhibited decreased species richness, likely due to the inoculation of S. cerevisiae, which was most abundant in the read counts of hard kombucha. Niche engineering by S. cerevisiae through the production of ethanol is known to cause a collapse in fungal diversity of wine fermentations, and the dominance of S. cerevisiae in hard kombucha likely reflects its capacity to outcompete B. bruxellensis and B. anomalus [40]. Bacterial communities differed according to the relative abundance of several genera, including the two most abundant: Gluconobacter and Bacillus. It was interesting to note that Gluconobacter comprised more sequencing reads than Komagataeibacter in retail-available soft kombucha, whereas Komagataeibacter is the consensus dominant bacterial genus in the kombucha pellicle as well as in the liquid phase at the end of kombucha fermentation [13,14,41]. These observations indicate that different production practices during hard kombucha fermentation are responsible for the differences in the abundance of the main taxa between hard, soft, and soft-aberrant kombucha. Therefore, there is no evidence to suggest that soft-aberrant kombucha shows an intermediate abundance of the main fungal or bacterial taxa between hard and soft types.
A large proportion of brands surveyed made a probiotic claim on their product packaging, and a subset of these listed probiotic strains within their ingredient lists with accompanying CFU numbers “at packaging”. Our data show that for three brands, represented by multiple individual products, the maximum CFU counts of retail-available samples were, on average, 2–4 log lower than the probiotic CFU counts stated on their labels. The maintenance of minimum effective CFU levels during the product’s shelf-life is a recommended criterion for the consideration of food as probiotic [42]. It is also essential that the stated species/strains are detectable in retail-available products. Metabarcoding analyses revealed abundant reads associated with Bacillus, particularly in soft kombucha, supporting the presence of B. coagulans in products listing strains of this species in ingredient lists. This was not the case for probiotic Lactobacilli or S. cerevisiae var. boulardii. The lack of an association between Lactobacilli in ingredient lists with Lactobacillus reads may reflect the poor survivability of some lactic acid bacteria in kombucha, although it should be noted that some LAB may not have poor survivability, especially those strains that are more adapted to kombucha or those that are naturally present in the pellicle. Fu et al. [43] observed that during refrigerated storage, inoculated Lactiplantibacillus plantarum populations decreased in size by at least 4-log. The practice of supplementing kombucha with known probiotic species/strains is one solution to meet consumer expectations of healthfulness, but shelf-life stability appears to be a critical gap that requires further research [2]. Encapsulation strategies that protect culture viability in kombucha may be a path forward [39,40]. Regardless, it is worth considering whether this practice is necessary or beneficial for consumers if the purpose is solely to support probiotic labeling.
Kombucha has a long cultural history of perceived health benefits that, as already discussed, require more supporting clinical evidence. Nevertheless, this association exists and has been established for kombucha beverages containing their own microbial communities; supplementation with known probiotics may disrupt these communities and inadvertently negate associated gut-health benefits. Emerging views of fermented foods and health acknowledge that their functionality may be cumulative as part of a diet comprising other fermented products, collectively delivering transient microbes to the gut [8]. In this context, the labeling terminology “contains live and active cultures” would be most applicable to traditionally made kombucha [44]. Given the acidic pH range (2.5–4.0) of kombucha, it is reasonable to speculate that it contains microbial communities with greater potential to survive the gastric environment, though, to date, there is no evidence that kombucha microbes become resident in the gut microbiome. Moreover, there is a lack of evidence that food is a more effective form of probiotic delivery than supplements, though some research has focused upon the acid adaptation of probiotic strains for this purpose [45]. Regardless, it is well established that live or even dead microorganisms, through their cellular constituents or metabolites, can stimulate the gut microbiome, modulating its composition with associated impacts on the host’s health [46]. Therefore, further research is needed to understand the extent to which kombucha consumption meets consumer expectations, and strategies should be developed to maximize the native microbial content of finished kombucha while addressing stability issues.
Setting aside kombucha supplemented with known probiotic strains of B. coagulans, our metabarcoding analyses imply that most kombucha products in the marketplace in the Pacific Northwest of the United States do not contain populations of genera corresponding to demonstrated species/strains with probiotic capacity, many of which belong to the lactic acid bacteria [47]. It is possible that the two hard and two soft kombuchas exhibiting relatively high abundances of Streptococcus reads represent products to which a known probiotic has been added but not listed with the ingredients. Streptococcus thermophilus is a well-known starter culture used in dairy foods that has demonstrated probiotic capacity [48] but does not feature in the kombucha SCOBY microbiome [13]. On the other hand, six kombuchas harbored bacterial communities that were Lactobacilli-dominant, exhibiting sequence features assigned to L. nagelli. This species was the most abundant lactic acid bacterium detected in kombucha SCOBY, albeit a relatively minor component compared to other genera [10]. Preliminary work on a non-kombucha isolate of this species suggests that it exhibits properties found in probiotic Lactobacilli [49].
As the first large survey of commercial retail-available soft and hard kombucha in the United States that evaluated both chemical and microbial compositions, our study provides a snapshot of this increasingly popular beverage. Our data point toward a known but continued challenge for the soft kombucha industry—aberrant alcohol levels that exceed regulatory requirements. Strategies to mitigate the risk of post-packaging alcohol formation, such as pasteurization, conflict with the ideology surrounding kombucha as a “live” product with potential probiotic value and are currently not widely practiced [2], but the results of our study suggest that native kombucha microbial communities do not contain effective doses of known probiotics. Supplementing kombucha with probiotic strains and listing them as ingredients is one way to address this; indeed, we were able to detect added B. coagulans in retail-available kombucha. The extent to which this meets consumer expectations is worthy of further research, along with strategies to maximize the native microbial content of finished kombucha while addressing stability issues, which constitutes quite a challenge.

Supplementary Materials

The following supporting information can be downloaded at https://www.mdpi.com/article/10.3390/beverages9030059/s1: Figure S1: PCA biplot of analytes from 1H NMR spectra by type with ethanol included; Figure S2: MANOVA of NMR data by type; Figure S3: Box-and-whisker plots of metrics of alpha diversity for 16S ASV reads at the genus level by type; Figure S4: Box-and-whisker plots of metrics of alpha diversity for ITS ASV reads at the species level by type; Figure S5: Box-and-whisker plots of metrics of alpha diversity for 16S ASV reads at the genus level by claim; Figure S6: Box-and-whisker plots of metrics of alpha diversity for ITS ASV reads at the species level by claim; Table S1: Fusion primers for metabarcoding PCR amplification; Table S2: Comparison of median concentrations of ethanol (g/L) between hard and soft kombucha; Table S3: Comparison of median concentration of ethanol (g/L) between hard and soft kombucha.; Table S4: NMR H1 analysis comparing the chemical composition among hard, soft, and soft-aberrant kombucha products; Table S5: Colony growth on M13, MRS, NA, and WLN media plates; Table S6: Kruskal–Wallis chi-square analysis comparing SPC growth (CFU/mL) on different media; Table S7: Kruskal–Wallis chi-square analysis comparing SPC growth (CFU/mL) on different media from kombucha groups based on claim (live, probiotic, or none), type (hard, soft, or soft-aberrant), and organism listed (yes or no); Table S8: Average relative abundance and Kruskal–Wallis chi-square analysis of ASV I6S by bacteria genus by type; Table S9: Average relative abundance and Kruskal–Wallis chi-square analysis of ASV ITS by fungal species by type; Table S10: Student t-test comparison of metrics of alpha diversity for 16S ASV reads at the genus level; Table S11: Student t-test comparison of metrics of alpha diversity for ITS ASV reads at the species level; Table S12: Lactobacillus and Bacillus species feature ID identification by blastn; Table S13: Saccharomyces species feature ID identification by blastn.

Author Contributions

Conceptualization, K.H. and C.C.; methodology, K.H., R.N., K.J. and W.C.; software, K.H.; validation, K.H. and C.C.; data generation, K.H., R.N. and K.J.; resources, C.C. and T.N.; data curation, K.H. and C.C.; writing—original draft preparation, K.H.; writing—review and editing, K.H. and C.C.; visualization, K.H.; supervision, C.C. and T.N.; project administration, C.C. and T.N.; funding acquisition, C.C. and T.N. All authors have read and agreed to the published version of the manuscript.

Funding

This research was funded by the Agricultural Research Foundation and Sierra Nevada Brewing Company.

Institutional Review Board Statement

Not applicable.

Informed Consent Statement

Not applicable.

Data Availability Statement

All R code to reproduce statistical analyses are available as an R markdown file at https://github.com/curtinlab/Kombucha-composition-R-markdown, accessed on 11 March 2023. Fastq files are available at NCBI BioProject: PRJNA944697.

Acknowledgments

The authors thank the Linus Pauling Center and Patrick Reardon for training and access to the Nuclear Magnetic Resonance Spectrometer.

Conflicts of Interest

The authors declare no conflict of interest.

References

  1. Goetzke, B.I.; Spiller, A. Health-improving lifestyles of organic and functional food consumers. Br. Food J. 2014, 116, 510–526. [Google Scholar] [CrossRef]
  2. Kim, J.; Adhikari, K. Current Trends in Kombucha: Marketing Perspectives and the Need for Improved Sensory Research. Beverages 2020, 6, 15. [Google Scholar] [CrossRef] [Green Version]
  3. Kapp, J.M.; Sumner, W. Kombucha: A systematic review of the empirical evidence of human health benefit. Ann. Epidemiol. 2019, 30, 66–70. [Google Scholar] [CrossRef]
  4. Yan, Z.; Zhong, Y.; Duan, Y.; Chen, Q.; Li, F. Antioxidant mechanism of tea polyphenols and its impact on health benefits. Anim. Nutr. 2020, 6, 115–123. [Google Scholar] [CrossRef]
  5. Nyiew, K.-Y.; Kwong, P.J.; Yow, Y.-Y. An overview of antimicrobial properties of kombucha. Compr. Rev. Food Sci. Food Saf. 2022, 21, 1024–1053. [Google Scholar] [CrossRef] [PubMed]
  6. Morales, D. Biological activities of kombucha beverages: The need of clinical evidence. Trends Food Sci. Technol. 2020, 105, 323–333. [Google Scholar] [CrossRef]
  7. Jung, Y.; Kim, I.; Mannaa, M.; Kim, J.; Wang, S.; Park, I.; Kim, J.; Seo, Y.-S. Effect of Kombucha on gut-microbiota in mouse having non-alcoholic fatty liver disease. Food Sci. Biotechnol. 2019, 28, 261–267. [Google Scholar] [CrossRef] [PubMed]
  8. Marco, M.L.; Heeney, D.; Binda, S.; Cifelli, C.J.; Cotter, P.D.; Foligné, B.; Gänzle, M.; Kort, R.; Pasin, G.; Pihlanto, A.; et al. Health benefits of fermented foods: Microbiota and beyond. Curr. Opin. Biotechnol. 2017, 44, 94–102. [Google Scholar] [CrossRef]
  9. Marco, M.L.; Sanders, M.E.; Gänzle, M.; Arrieta, M.C.; Cotter, P.D.; De Vuyst, L.; Hill, C.; Holzapfel, W.; Lebeer, S.; Merenstein, D.; et al. The International Scientific Association for Probiotics and Prebiotics (ISAPP) consensus statement on fermented foods. Nat. Rev. Gastroenterol. Hepatol. 2021, 18, 196–208. [Google Scholar] [CrossRef]
  10. De Miranda, J.F.; Ruiz, L.F.; Silva, C.B.; Uekane, T.M.; Silva, K.A.; Gonzalez, A.G.M.; Fernandes, F.F.; Lima, A.R. Kombucha: A review of substrates, regulations, composition, and biological properties. J. Food Sci. 2022, 87, 503–527. [Google Scholar] [CrossRef]
  11. Nyhan, L.M.; Lynch, K.M.; Sahin, A.W.; Arendt, E.K. Advances in Kombucha Tea Fermentation: A Review. Appl. Microbiol. 2022, 2, 5. [Google Scholar] [CrossRef]
  12. Jayabalan, R.; Malbaša, R.V.; Lončar, E.S.; Vitas, J.S.; Sathishkumar, M. A Review on Kombucha Tea—Microbiology, Composition, Fermentation, Beneficial Effects, Toxicity, and Tea Fungus. Compr. Rev. Food Sci. Food Saf. 2014, 13, 538–550. [Google Scholar] [CrossRef]
  13. Harrison, K.; Curtin, C. Microbial Composition of SCOBY Starter Cultures Used by Commercial Kombucha Brewers in North America. Microorganisms 2021, 9, 1060. [Google Scholar] [CrossRef]
  14. Landis, E.A.; Fogarty, E.; Edwards, J.C.; Popa, O.; Eren, A.M.; Wolfe, B.E. Microbial Diversity and Interaction Specificity in Kombucha Tea Fermentations. mSystems 2022, 7, e00157-22. [Google Scholar] [CrossRef]
  15. Andreson, M.; Kazantseva, J.; Kuldjärv, R.; Malv, E.; Vaikma, H.; Kaleda, A.; Kütt, M.-L.; Vilu, R. Characterisation of chemical, microbial and sensory profiles of commercial kombuchas. Int. J. Food Microbiol. 2022, 373, 109715. [Google Scholar] [CrossRef] [PubMed]
  16. Parapouli, M.; Vasileiadis, A.; Afendra, A.-S.; Hatziloukas, E. Saccharomyces cerevisiae and its industrial applications. AIMS Microbiol. 2020, 6, 1–31. [Google Scholar] [CrossRef] [PubMed]
  17. Sánchez, J.; Mardia, K.; Kent, J.; Bibby, J. BIBBY: Multivariate Analysis. Academic Press, London-New York-Toronto-Sydney-San Francisco 1979. xv, 518 pp., 61.00. Biom. J. 1982, 24, 502. [Google Scholar] [CrossRef]
  18. Zuriarrain, A.; Zuriarrain, J.; Villar, M.; Berregi, I. Quantitative determination of ethanol in cider by 1H NMR spectrometry. Food Control 2015, 50, 758–762. [Google Scholar] [CrossRef]
  19. Comeau, A.M.; Douglas, G.M.; Langille, M.G.I. Microbiome Helper: A Custom and Streamlined Workflow for Microbiome Research. mSystems 2017, 2, e00127-16. [Google Scholar] [CrossRef] [PubMed] [Green Version]
  20. Hierro, N.; Esteve-Zarzoso, B.; González, A.; Mas, A.; Guillamón, J.M. Real-time quantitative PCR (QPCR) and reverse transcription-QPCR for detection and enumeration of total yeasts in wine. Appl. Environ. Microbiol. 2006, 72, 7148–7155. [Google Scholar] [CrossRef] [Green Version]
  21. Jo, J.H.; Kennedy, E.A.; Kong, H.H. Research Techniques Made Simple: Bacterial 16S Ribosomal RNA Gene Sequencing in Cutaneous Research. J. Investig. Dermatol. 2016, 136, e23–e27. [Google Scholar] [CrossRef] [Green Version]
  22. Callahan, B.J.; McMurdie, P.J.; Rosen, M.J.; Han, A.W.; Johnson, A.J.; Holmes, S.P. DADA2: High resolution sample inference from amplicon data. bioRxiv 2015, 024034. [Google Scholar] [CrossRef] [PubMed] [Green Version]
  23. DeSantis, T.Z.; Hugenholtz, P.; Larsen, N.; Rojas, M.; Brodie, E.L.; Keller, K.; Huber, T.; Dalevi, D.; Hu, P.; Andersen, G.L. Greengenes, a chimera-checked 16S rRNA gene database and workbench compatible with ARB. Appl. Environ. Microbiol. 2006, 72, 5069–5072. [Google Scholar] [CrossRef] [Green Version]
  24. Abarenkov, K.; Nilsson, R.H.; Larsson, K.-H.; Alexander, I.J.; Eberhardt, U.; Erland, S.; Høiland, K.; Kjøller, R.; Larsson, E.; Pennanen, T.; et al. The UNITE database for molecular identification of fungi—Recent updates and future perspectives. New Phytol. 2010, 186, 281–285. [Google Scholar] [CrossRef]
  25. Vaulot, D. Phyloseq Tutorial. 2021. Available online: https://vaulot.github.io/tutorials/Phyloseq_tutorial.html (accessed on 1 July 2022).
  26. Bartnett, D. Example Analyses: Shao 2019 Data, Getting Started 2022. Available online: https://david-barnett.github.io/microViz/articles/shao19-analyses.html (accessed on 1 July 2022).
  27. Kõljalg, U.; Nilsson, H.R.; Schigel, D.; Tedersoo, L.; Larsson, K.-H.; May, T.W.; Taylor, A.F.; Jeppesen, T.S.; Frøslev, T.G.; Lindahl, B.D.; et al. The Taxon Hypothesis Paradigm—On the Unambiguous Detection and Communication of Taxa. Microorganisms 2020, 8, 1910. [Google Scholar] [CrossRef]
  28. Chen, Y.; Ye, W.; Zhang, Y.; Xu, Y. High speed BLASTN: An accelerated MegaBLAST search tool. Nucleic Acids Res. 2015, 43, 7762–7768. [Google Scholar] [CrossRef] [PubMed] [Green Version]
  29. Barnett, D.; Arts, I.; Penders, J. microViz: An R package for microbiome data visualization and statistics. J. Open Source Softw. 2021, 6, 3201. [Google Scholar] [CrossRef]
  30. Oksanen, J. Vegan: Ecological Diversity. Available online: https://cran.r-project.org/web/packages/vegan/vignettes/diversity-vegan.pdf (accessed on 24 August 2022).
  31. TTBGov-Kombucha. Available online: https://www.ttb.gov/kombucha (accessed on 24 December 2022).
  32. Jang, S.S.; McINTYRE, L.; Chan, M.; Brown, P.N.; Finley, J.; Chen, S.X. Ethanol Concentration of Kombucha Teas in British Columbia, Canada. J. Food Prot. 2021, 84, 1878–1883. [Google Scholar] [CrossRef]
  33. Chhay, J.; Chen, D.; Kuo, H. Analyzing ethanol accumulation in different kombucha tea brands during storage: Relationship between storage and ethanol production. BCIT Environ. Public Health J. 2020. [Google Scholar] [CrossRef]
  34. Uscanga, M.G.A.; Délia, M.-L.; Strehaiano, P. Brettanomyces bruxellensis: Effect of oxygen on growth and acetic acid production. Appl. Microbiol. Biotechnol. 2003, 61, 157–162. [Google Scholar] [CrossRef]
  35. Nevoigt, E.; Stahl, U. Osmoregulation and glycerol metabolism in the yeast Saccharomyces cerevisiae. FEMS Microbiol. Rev. 1997, 21, 231–241. [Google Scholar] [CrossRef]
  36. Kim, J.; Bhattarai, U.; Adhikari, K. The Healthy Eater’s Idea and Related Behavior of a Healthy Diet—A Case Study with Kombucha Drinkers. Beverages 2022, 8, 25. [Google Scholar] [CrossRef]
  37. Tran, T.; Grandvalet, C.; Verdier, F.; Martin, A.; Alexandre, H.; Tourdot-Maréchal, R. Microbiological and technological parameters impacting the chemical composition and sensory quality of kombucha. Compr. Rev. Food Sci. Food Saf. 2020, 19, 2050–2070. [Google Scholar] [CrossRef] [PubMed]
  38. Coton, M.; Pawtowski, A.; Taminiau, B.; Burgaud, G.; Deniel, F.; Coulloumme-Labarthe, L.; Fall, A.; Daube, G.; Coton, E. Unraveling microbial ecology of industrial-scale Kombucha fermentations by metabarcoding and culture-based methods. FEMS Microbiol. Ecol. 2017, 93. [Google Scholar] [CrossRef]
  39. Rezac, S.; Kok, C.R.; Heermann, M.; Hutkins, R. Fermented Foods as a Dietary Source of Live Organisms. Front. Microbiol. 2018, 9, 1785. [Google Scholar] [CrossRef]
  40. Boynton, P.J.; Greig, D. Species richness influences wine ecosystem function through a dominant species. Fungal Ecol. 2016, 22, 61–72. [Google Scholar] [CrossRef] [Green Version]
  41. Villarreal-Soto, S.A.; Bouajila, J.; Pace, M.; Leech, J.; Cotter, P.D.; Souchard, J.-P.; Taillandier, P.; Beaufort, S. Metabolome-microbiome signatures in the fermented beverage, Kombucha. Int. J. Food Microbiol. 2020, 333, 108778. [Google Scholar] [CrossRef]
  42. Binda, S.; Hill, C.; Johansen, E.; Obis, D.; Pot, B.; Sanders, M.E.; Tremblay, A.; Ouwehand, A.C. Criteria to Qualify Microorganisms as ‘Probiotic’ in Foods and Dietary Supplements. Front. Microbiol. 2020, 11, 166. Available online: https://www.frontiersin.org/articles/10.3389/fmicb.2020.01662 (accessed on 27 December 2022). [CrossRef]
  43. Fu, C.; Yan, F.; Cao, Z.; Xie, F.; Lin, J. Antioxidant activities of kombucha prepared from three different substrates and changes in content of probiotics during storage. Food Sci. Technol. 2014, 34, 123–126. [Google Scholar] [CrossRef] [Green Version]
  44. Frye, C.P.; Kilara, A. Regulations for Product Standards and Labeling. In Dairy Processing and Quality Assurance; John Wiley & Sons, Ltd.: Hoboken, NJ, USA, 2015; pp. 152–177. [Google Scholar] [CrossRef]
  45. Sanz, Y. Ecological and functional implications of the acid-adaptation ability of Bifidobacterium: A way of selecting improved probiotic strains. Int. Dairy J. 2007, 17, 1284–1289. [Google Scholar] [CrossRef]
  46. Rooks, M.G.; Garrett, W.S. Gut microbiota, metabolites and host immunity. Nat. Rev. Immunol. 2016, 16, 341–352. [Google Scholar] [CrossRef] [PubMed]
  47. Office of Dietary Supplements—Probiotics. Available online: https://ods.od.nih.gov/factsheets/Probiotics-HealthProfessional/ (accessed on 27 December 2022).
  48. Delorme, C. Safety assessment of dairy microorganisms: Streptococcus thermophilus. Int. J. Food Microbiol. 2008, 126, 274–277. [Google Scholar] [CrossRef] [PubMed]
  49. Yetiman, A.; Ortakci, F. Metabolic potentials of Liquorilactobacillus nagelii AGA58 isolated from Shalgam based on genomic and functional analysis. bioRxiv, 2021; preprint. [Google Scholar] [CrossRef]
Figure 1. Production workflow for making kombucha at an industrial scale. Production methods vary from producer to producer, and the steps highlighted as optional indicate such. Soft and hard kombucha production methods typically branch after the initial fermentation and acetification of raw materials. Hard kombucha practices focus on controlling secondary fermentation. Probiotic strains may be added at several points in the production workflows.
Beverages 09 00059 g001
Figure 2. Comparison of chemical composition between kombucha types: soft (n = 16), soft-aberrant (n = 10), and hard (n = 13). Soft and soft-aberrant kombucha delineated according to the legal limit (0.5% ABV +/− 0.05%) for non-alcoholic beverages in the United States. (a) Distribution of ethanol content according to kombucha type. (b) PCA biplot of major 1H NMR analytes.
Beverages 09 00059 g002
Figure 3. Comparison of microbial culturability across kombucha samples. (a) Distribution of log10 maximum CFU/mL by label claims on kombucha packages. (b) Distribution of log10 maximum CFU/mL by kombucha type. (c) Violin plot comparing distribution of log10 CFU/mL by kombucha type on M13 medium. (d) Log10 difference between total CFU/mL listed on product label and maximum CFU/mL across three brands (A, B, C). Maximum CFU/mL count determined across four different media types (NA, WLN, M13, and MRS). Eight samples with non-discernable growth (<100 CFU/mL) were excluded from analyses for (ac). Maximum (MAX) growth determined by the highest SPC count across the media types.
Beverages 09 00059 g003
Figure 4. Taxonomic diversity of kombucha products’ microbiomes and mycobiomes. Circular genus-level relative abundance barplots of 37 samples for bacteria (a) and fungi (b), generated from 16S and ITS metabarcoding data, respectively. Barplots were sorted by ordination angle and ordered by kombucha type to compare microbial composition among soft, soft-aberrant, and hard kombucha, as well as probiotic packaging claims, using the microViz R package.
Beverages 09 00059 g004
Figure 5. Distribution of log sequencing read counts for ASVs associated with (a) Bacillus and (b) Lactobacillus according to their inclusion (yes/no) in package ingredient lists.
Beverages 09 00059 g005
Figure 6. Packaged product consistency for subset of repeat-purchased replicate samples. (a) PCA biplot of NMR analytes; (b) maximum CFU counts; (c) 16S metabarcoding profiles of bacterial genera; (d) ITS metabarcoding profiles of fungal genera.
Beverages 09 00059 g006
Table 1. Sample demographics of hard and soft kombucha products. Microbial claims (including “Live”, “Probiotic”, or neither) and specified probiotic strains listed on product labels were recorded for 39 products.
Sample InformationNN %
Brands21
Type39
        Hard1333.3%
        Soft2666.7%
Claim
        None1025.6%
        Live615.4%
Probiotic2359.0%
In ingredient list (probiotic)
        B. coagulans834.7%
               B. coagulans GBI-3060864
               B. coagulans Snz 19692
        Lactobacillus spp.730.4%
        S. cerevisiae var boulardii28.7%
Table 2. PERMANOVA analysis of beta diversity (Bray–Curtis dissimilarity) according to kombucha type.
Metabarcoding TargetF-StatisticPr (>F) %
Bacterial 16S2.880.01
Fungal ITS1.580.06
Table 3. PERMANOVA analysis of beta diversity (Bray–Curtis dissimilarity) according to kombucha package claim and listing of probiotic species/strains on package ingredients.
EvaluationMetabarcoding TargetF-StatisticPr (>F) %
Claim (Live, Probiotic, None)Bacterial 16S1.760.04
Claim (Live, Probiotic, None)Fungal ITS1.780.01
Probiotic species listed (Yes, No)Bacterial 16S4.01<0.005
Disclaimer/Publisher’s Note: The statements, opinions and data contained in all publications are solely those of the individual author(s) and contributor(s) and not of MDPI and/or the editor(s). MDPI and/or the editor(s) disclaim responsibility for any injury to people or property resulting from any ideas, methods, instructions or products referred to in the content.

