
Effects of Pulsed Electric Fields on the Physicochemical and Sensory Properties of Thompson Seedless Grapes

Department of Agriculture and Food Sciences, Neubrandenburg University of Applied Sciences, 17033 Neubrandenburg, Germany
*
Author to whom correspondence should be addressed.
Beverages 2023, 9(4), 82; https://doi.org/10.3390/beverages9040082
Submission received: 28 July 2023
/
Revised: 13 September 2023
/
Accepted: 20 September 2023
/
Published: 6 October 2023
(This article belongs to the Section Wine, Spirits and Oenological Products)
Abstract
:While the treatment of red grapes with pulsed electric fields (PEFs) has been widely investigated, white grapes have been little studied to date. This work, therefore, investigates the PEF treatment of white grapes (Thompson Seedless) by applying different field strengths (2 to 6 kV/cm), resulting in different specific energy inputs (2.5 to 22.5 kJ/kg). Numerous parameters of the whole grapes and the extracted juice were analyzed, including the total phenolic index (TPI), reducing sugars, juice yields, and changes in color and texture. Changes in the aroma profile were investigated using instrument-based and sensory analysis. The most striking effect seen in the PEF-treated samples was the visual change in the grape skin, specifically browning. Depending on the field strength, the treated grapes showed a 26% to 50% reduction in crunchiness. No significant changes were measured in the juice yields compared with the control, although at E = 4.5 kV/cm there was an increase in reducing sugars of up to 11% (220.97 g/L) and a 30% higher TPI (398.90 mg/L). Aroma differences were not detected between the control and the treated grapes, meaning that consumers should not expect negative sensory effects in the juice of treated white grapes.
1. Introduction
Pulsed electric fields are one of the non-thermal treatment technologies for different products or matrixes for gentle treatment within an electric field [1,2]. Typically, the products are placed in a treatment chamber consisting of two electrodes, and high-voltage pulses that are activated for very short periods (ns or ms) permeabilize the membranes of the treated material, resulting in reversible or irreversible cell opening. The applied voltage acts on the naturally occurring transmembrane voltage of cells, which is formed between the interior and exterior of the cells by ion gradients. As soon as a critical threshold value is reached, pores are formed in the membrane and cells are opened [2,3]
Thus, PEF treatment is a promising technology for enhancing mass transfer during the processing of foodstuffs and is associated with many benefits, as can be seen in juices or syrups of different origins and an associated improvement in physicochemical properties [4,5,6] but without negative impact on the flavor profile [7]. This technology has been shown to produce improved peelability in various vegetables, such as tomatoes, peaches, and oranges [8], while the potato industry is investigating the use of PEFs to pre-treat potatoes for the production of French fries and the degradation of starch to improve their texture [9]. Reductions in the microbial activity of products, such as blueberries, could be also achieved using PEFs [10].
The application of PEF treatment is also used in wine production [2,11,12,13,14,15,16,17,18]. Wine is a popular luxury food worldwide with current consumption volumes of 234 million hL in 2021 [19]. Research has often focused on pretreating red grapes in particular with the aim of increasing their polyphenols, anthocyanins, or color intensity, which are some of the quality parameters of red wine [11]. In addition, studies have also been conducted on volatiles at different stages of wine production [12]. A reduction in maceration time [13] is one positive result achieved by treating red grapes with PEFs. A method for early verification of the effectiveness of PEF treatment was also developed that highlighted the importance of selecting a responsive grape variety [2,13], as well as the harvesting time and pulse duration [13]. Different grape varieties thus showed increases in anthocyanins, polyphenols, and color, with the greatest effect observed in Mazuelo grapes treated with a higher electric field strength of up to 10 kV/cm (compared with 2 kV/cm). Shorter processing times and lower energy consumption were also achieved [2].
The influence of PEF treatment on wine sensory characteristics was also considered, as can be seen in [12]. The sensorial aroma of Merlot grape musts examined by trained panelists using a descriptive analysis changed when grapes were treated with E > 40 kV/cm, developing a more intense blackcurrant flavor and odor [12]. Analyses using headspace (HS) solid phase microextraction (SPME) coupled with gas chromatography (GC) and mass spectrometry (MS) (HS–SPME/GC–MS) also showed reductions in (E)-2-hexenal, the compound responsible for the green aroma, after samples had undergone PEF treatment. More than 40 compounds including terpenoids, alcohols, or carbonyls were identified in grape juice via SPME/GC–MS, with the floral and fruity aroma that was detected resulting from the identified esters and terpenes. Ethanol was also present with a high peak [20].
In addition to the listed studies on PEF-treated red grapes, this work focused on Thompson Seedless grapes, a seedless white grape also known as Sultania. Thompson Seedless grapes are used as raisins, table grapes, and wine grapes, are available over a wide time period during the year, and a fraction of 14.5 percent of these grapes in the USA and a portion in Europe are used for the production of juices and wines [21,22]. Thompson Seedless was the leading raisin-type variety in California (USA) in 2021 and was utilized for raisins, fresh markets, concentrates, and wines [23]. It is also registered in the European Union for its multipurpose use, including wine production, in Spain, Greece, Turkey, and Croatia [24].
Up to now, numerous applications for pulsed electric fields have been investigated and the technology even reached a level where it was successfully implemented in industrial processes. As of now, only relatively small pieces of the puzzle can be added to the body of knowledge, and the fields of application need to be systematically broadened. The objectives of the present work were to show the effects of pulsed electric fields on commercially important Thompson Seedless grapes that are known for their multipurpose use. To the best of our knowledge, the application of PEFs on Thompson Seedless grapes has not been investigated before. Electric field strength was varied to understand the influences of PEF treatment on the physicochemical and sensory characteristics of the grapes and the extracted juice. The influence of PEF on white grapes and especially its effect on the sensory profile required for consumer acceptance, has been little studied to date [14,15,16]. The aim of this study is to investigate the physicochemical properties of Thompson Seedless grapes, including any changes in color, pH, and texture as well as the content of sugar and total polyphenols. Another focus is the characterization of aroma profiles using instrument measurements (SPME/GC–MS) as well as human sensory tests, which can determine essential quality parameters that are ultimately of high relevance for consumers.
2. Materials and Methods
2.1. Grape Selection and Preparation
An amount of 10 kg of seedless white grapes (Thompson variety, Italy, class 1) was obtained in October 2022 and then stored at 4–6 °C until processed and used within 2.5 weeks. The grapes were destemmed, inspected for rot, and washed. Each trial, regardless of the respective field strength, required 2 × 300 g of grapes: 300 g for the examination of the juice and 300 g for the analyses of texture, appearance, and physical color change in the whole grapes. In each run, 400 g of grapes were sufficient for the controls. The grapes were warmed to room temperature (23 ± 1 °C) while the PEF treatment chamber and the water used were adjusted to 30 ± 0.1 °C.
2.2. PEF Equipment and Implementation
The PEF treatment was performed with a commercial Solidus PEF pilot system from Pulsemaster (Pulsemaster B.V., Hapert, The Netherlands), whose typology is based on a spark gap generator with a high-voltage capacitor. The treatment chamber capacity is 0.5 L (10 × 5 × 10 cm) and treatment is performed under an exponentially decaying pulse shape and a pulse repetition frequency of 2 Hz. The field strengths used were 2, 3, 4.5, and 6 kV/cm. For each field strength, 50 pulses were used, resulting in a specific energy input of 2.5 to 22.5 kJ/kg. The polarity of the pulses is unipolar positive.
Each run was prepared with 300 g of warmed, washed, and destemmed grapes and 200 mL of tempered tap water with a conductivity of 757 ± 3.3 µS/cm (30 ± 0.1 °C). The temperature was measured before and immediately after treatment and while still in the chamber before the measuring cell was removed from the PEF device. The time interval between removal and temperature measurement was not longer than 5 s. The PEF settings and the change in temperature of the water during the treatments are shown in Table A1 in Appendix A.
2.3. Grape Processing and Measurements
An overview of the experimental workflow for the whole grapes and their corresponding extracted juices is shown in Figure 1.
2.3.1. Pressing
The washed and (un-)treated grapes were pressed using a Kenwood JE 850 kitchen juice extractor (1000 W). Because the marc of the grapes was still relatively wet after the first pressing step, the pressing was repeated twice more. The pressing was completed by filtering the juice through a paper filter and measuring the total volume. The extracted juice was either used fresh for further analysis or stored in aliquots at −20 °C.
2.3.2. Physicochemical Measurements
The visual change in the grape skin was documented with photographs taken at 5-min intervals, starting 5 min after treatment, and ending 60 min after treatment. The color of the grape skins was also physically characterized using a L*a*b* colorimeter (HunterLAB FMS Jansen GmbH & Co. KG, Murnau, Germany), with five grapes measured for each replicate. The L*, a*, and b* values determined provide information about the brightness L* (L* = 0 = black; L* = 100 = white) and the color axes green to red (−a* to +a*) and blue to yellow (−b* to +b*). Comparing these values with the control, ∆E can be calculated with Equation (1) and indicates how readily the color difference can be detected by the human eye [25]:
In addition to measuring the color of the whole grapes, the color of the final grape juice was also measured using a glass cuvette (ø 34 mm, embossed Z12) with a spacer ring (ø 12 mm), a white enameled stamp, and an aperture.
The volume of juice was measured using a graduated cylinder and calculated with Formula (2) where Y represents the total yield, m the total volume of the juice, and mg the weight of the grapes before pressing:
Texture changes in the grapes’ crunchiness and firmness were measured using the texture analyzer Ta-XT2i Plus (Stable Micro Systems Ltd., Godalming, UK) with its software Exponent Connect (Stable Micro Systems Ltd., Godalming, UK) and the Warner–Bratzler rectangular notch blade. The settings used were: feed rate: 1 mm/s; pretest speed: 2.00 mm/s; test speed: 1.00 mm/s; back speed: 10.00 mm/s; distance: 25.0 mm; trigger set: 5.0 g; and measuring points/s: 250. The measurements were taken 5 min after the PEF treatment with five grapes per treatment.
To analyze the effect of PEF treatment compared with untreated grapes, pH, °Bx, reducing sugars, and TPI of the juice were also measured. pH and °Bx were measured immediately after pressing while reducing sugars and TPI were determined from frozen aliquots.
Sugar content (°Bx) was measured using the EasyDens device (Anton Paar GmbH, Graz, Austria) and the software Wine Meister (version 2.2.4, version code: 60).
TPI was measured using spectrophotometry at 720 nm using a 10% Folin–Ciocalteu reagent (FCR) according to an internal instruction. Gallic acid (50–500 mg/L) is used for calibration. Once the samples were diluted (1:5 (v/v)), 8.4 mL of distilled water and 0.1 mL of these samples were mixed before adding 0.5 mL of FCR. At 3 min after mixing the above substances, 1 mL of saturated Na2CO3 solution was added at room temperature (20 °C). After 60 min, the samples were measured at 720 nm. The results are shown as the gallic acid equivalent in mg/L.
Reducing sugars were determined using the method developed by Miller [26]. Sodium oxide, 3,5-dinitrosalicylic acid (3,5-DNSS), sodium sulfite, and sodium potassium tartrate were mixed and filtered. D(+)-glucose (0–1 mg/mL) was used for calibration. The samples were diluted with distilled water (1/200 (v/v)). An amount of 1 mL of the diluted sample was mixed with 2 mL of 3,5-DNSS reagent and boiled for 15 min at 100 °C. After cooling for 20 min at 20 °C, the sample was made up to a total volume of 20 mL and measured using spectrophotometry at 505 nm.
2.4. Aroma Profile Analyses of Grape Juices from Control and PEF-Treated Grapes
2.4.1. Sensory Analysis of Grape Juice
Differences in the odor of treated and untreated grapes were checked using two sensory analyses: check-all-that-apply (CATA) [27,28] and rate-all-that-apply (RATA) [29], which are rapid measurements to determine and rate large amounts of product information in a short time. Compared with the classical testing methods, which can be very time-consuming, these short-time methods can be performed with semi-trained panelists and even untrained consumers, as the results between the classical and new methods were associated with very similar results [30].
For the sensory analysis, the grape juices of the replicates were stored at −20 °C and thawed just before testing. Olfactory strips were immersed in the thawed samples and left for at least 1 h. The strips were then placed in closed plastic test tubes. For the product description, the panelists were given a list of various attributes from which they could select the attributes that applied in each case. The list is provided in Table 1.
First, the panelists had to smell the samples, which had been coded with random 3-digit numbers, and check all applicable attributes from the list (CATA). Second, the attributes “fruity”, “sweetish”, “sour”, and “fermented” were rated according to their intensity (RATA). The ratings are subdivided into “not applicable”, “hardly pronounced”, “slightly pronounced”, “moderately pronounced”, “somewhat more pronounced”, and “very pronounced”.
The evaluation was performed by 14 trained panelists (57% female and 43% male, with an average age of 49 ± 18 years for standard deviation) for each replicate series consisting of treatments with 0, 3, and 6 kV/cm. The tasting was conducted in a standardized sensory laboratory as defined in DIN 10962 [31] with a temperature of 22 °C and a humidity of approximately 45%.
2.4.2. Instrument-Based Analysis of Grape Juice with SPME/GC–MS
The aroma profiles of grape juices were also analyzed with SPME/GC–MS. For this purpose, the frozen juice samples were thawed and refrigerated at 4 °C until used. According to [17], the extraction of volatiles is enhanced by adding sodium chloride to the grape sample in a ratio of 1 g NaCl per 6 mL of grape juice [17]. Therefore, 0.83 g of NaCl was added to the sample volume of 5 mL, mixed, and poured into a 20 mL vial with an airtight silicone/polytetrafluorethylene septum (La-pha-pack GmbH, Langerwehe, DE, Germany).
The SPME measurement of the volatile components was performed with the SPME fiber assembly 75 µm Carboxen/Polydimethylsiloxane (CAR/PDMS), fused silica (Gerstel GmbH & Co. KG, Mülheim an der Ruhr, DE, Germany), and an incubation temperature of 60 °C for 15 min.
GC–MS analysis was performed with an Agilent gas chromatograph type 122-7032 (GC system: Agilent Technologies 7890 B; MS system: Agilent Technologies 5977A MSD; Agilent Technologies, Santa Clara, CA, USA) and helium as the carrier gas (1 mL/min). A DB-WAX capillary column 0–250 °C (30 m × 0.25 µm × 0.25 µm film thickness; Agilent Technologies) was used to separate the components. The oven was programmed as follows: 40 °C (7 min)–40 °C/min–80 °C (5 min)–6 °C/min–150 °C (0 min)–10 °C/min–220 °C (0 min). The temperature of the transfer line was set at 250 °C. Each replicate was measured with a split ratio of 25:1. The volatile components measured were identified using the National Institute of Standard and Technology database (NIST1.4).
2.5. Statistical Analysis
Data analysis was performed using triplicates of all samples. Data were analyzed using one-way analysis of variance (ANOVA) and multiple comparisons (Tukey HSD) using XLSTAT 2022.4.1.1362. Sensory analyses were performed with a Principal Component Analysis (PCA), a Chi-squared test, a Cochran´s Q-test (paired comparisons, Sheskin) for CATA, and a Generalized Procrustes Analysis (GPA) for RATA. Differences are defined as significant with a significance level of p < 0.05 (Addinsoft, Paris, France, 2023).
3. Results
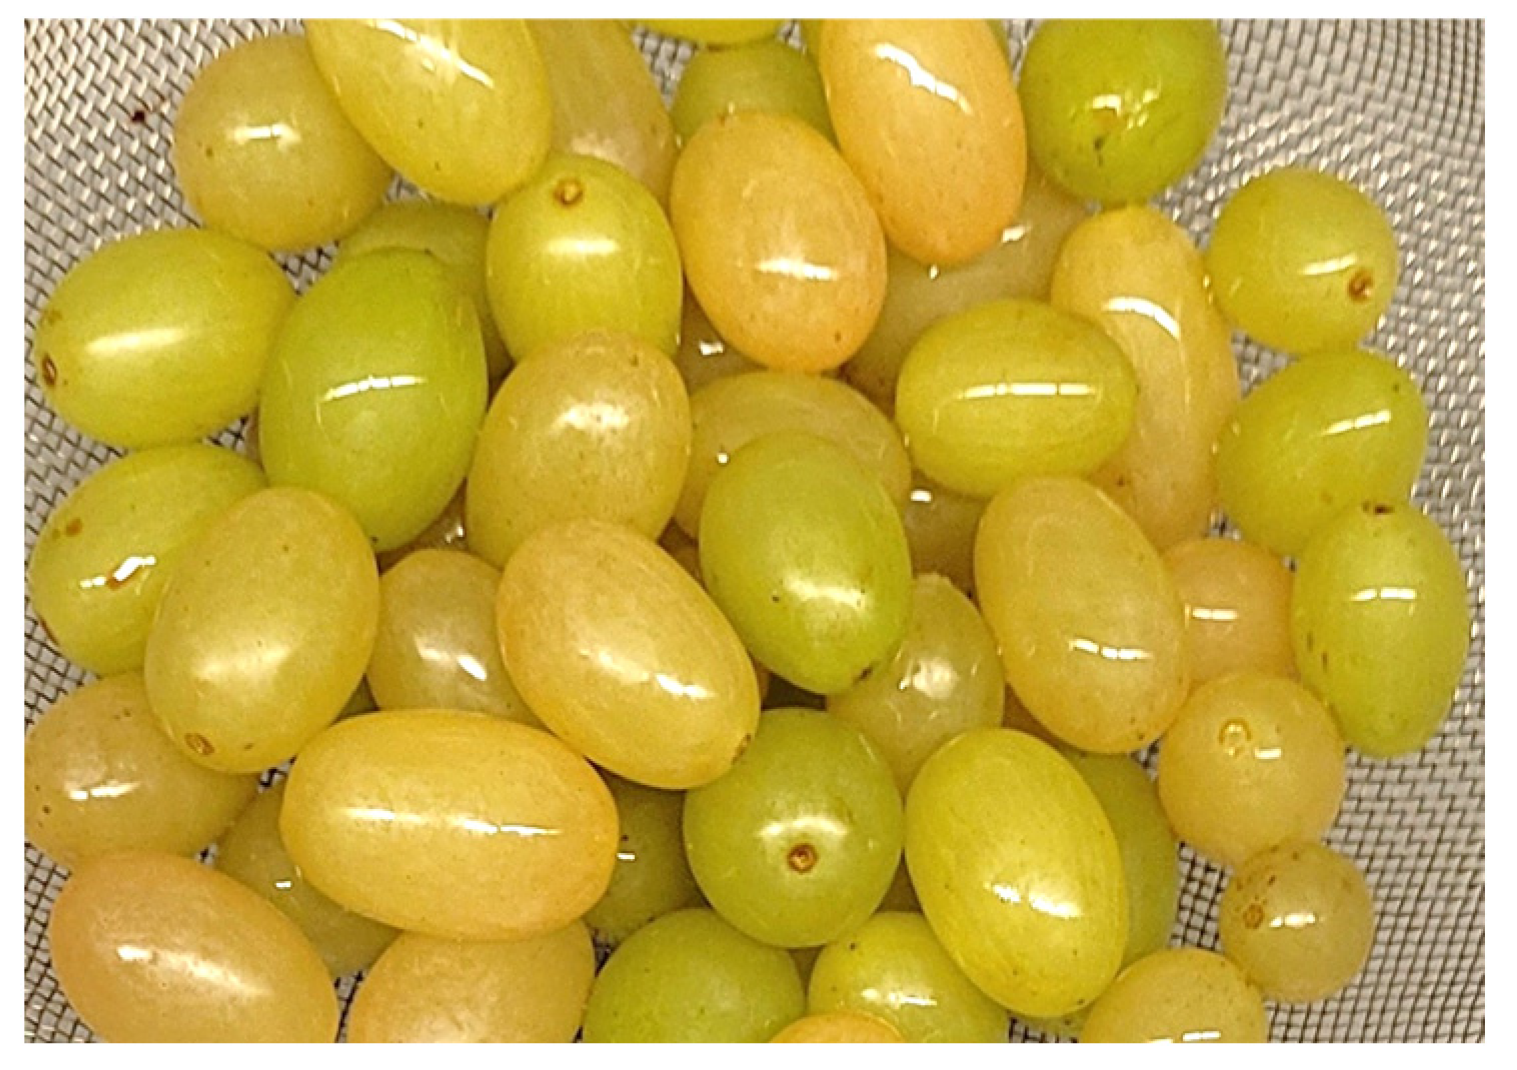
For all experiments, 10 kg of Thompson grapes were obtained. Unfortunately, differences in appearance, which result from different ripening stages and their associated colors, were already apparent in the visual inspection even though they came from the same batch. The fresh grapes with their visual differences are shown in Figure 2.
3.1. Physicochemical Measurements
3.1.1. Color Measurements of Whole Grapes Relative to PEF Intensity and Time after PEF Treatment
Compared with the control, a strong darkening was observed in the treated grapes, which started a few minutes after the PEF treatment: Five minutes after destemming and washing (control) or treating with PEFs, pictures were taken of the grapes at intervals of 5 min. Sample images at 5, 30, and 60 min after each treatment are shown in Figure 3. It can be seen that treatment of 2 kV/cm and 50 pulses darkened the skins within 30 min and resulted in a slightly darker appearance after 60 min. Treatments with higher electric field strengths show a generally similar effect but with more pronounced results. The darkening of the skin was not apparent in the pictures of the control grapes.
Instrumental L*a*b* measurements confirm these results (Table A2 in Appendix A). The calculated values for the ΔE for the control and treated grapes are listed in Table 2 and show the differences between 5 and 60 min. These values also provide information about the color differences of both the whole grapes and the extracted juices compared with the control 60 min after starting the treatment.
The ΔE shows similar ranges for the different field strengths of the treated samples. Compared with the control, these are almost five times higher with values between 2.64 (2 kV/cm) and 2.90 (4.5 kV/cm). After 60 min, ΔE values were slightly higher in the treated samples than in the control variants, ranging from 2.64 to 3.21 (2 kV/cm) and 2.90 to 3.88 (4.5 kV/cm). Using the classification of Gierling (2006) [25], ΔE is a metric for the color differences that can be perceived by the human eye. However, a large difference is seen at ΔE = 6, while values between 3 and 6 are moderately different. Despite this, the visual differences over time are very clear and noticeable (Figure 3).
The ΔE for the pressed juice showed slightly larger differences across the different treatment strengths but with deviations from 1.50 to 3.16 between replicates. Visual differences can also be seen in Figure 4 with the largest color deviation seen at E = 4.5 kV/cm with ΔE = 4.96. The greatest differences were found for the a* and b* values but the brightness values also varied between 62.0 and 67.8, independent of the treatment intensity. The a* values ranged from 0.23 to 1.53 for juices treated with 0, 2, 3, and 6 kV/cm, while the corresponding b* values ranged from 12.37 to 21.45. In contrast, juices from grapes treated with E = 4.5 kV/cm showed larger variations relative to each other, with values between 1.81 (a* value) and 24.11 (b* value), respectively. The color of the juice from grapes treated with 4.5 kV/cm thus developed more red and yellow pigments than the control variant or juices treated with the other electric field strengths. The raw data for these measurements are listed in Table A2 in Appendix A.
3.1.2. Texture Measurements
Texture measurements were performed using a guillotine with a pointed edge. The results for crunchiness (slope/diameter) and firmness (strength/diameter) using these measurements are listed in Table 3.
Texture analyses comparing control grapes and grapes treated with different field strengths revealed a significant decrease in the crunchiness of between 26% (6 kV/cm) and 50% (3 kV/cm). Firmness decreased between 26% (6 kV/cm) to 45% (2 kV/cm) compared with untreated grapes (1.319 ± 0.259 N/mm), which was significantly different. Although the crunchiness of the sample treated with 3 kV/cm was reduced by 50%, the firmness of 0.799 ± 0.087 N/mm showed a similar range to the other treatment intensities (2 and 4.5 kV/cm). The texture of the treated grapes was thus different from that of the untreated controls, a difference that could also be clearly perceived by touch.
3.1.3. Measurements of pH and °Bx
The pH and °Bx were determined immediately after the fresh juice had been filtered. Mean values ± standard deviations are listed in Table 4. The values of the treated samples and untreated controls varied, especially the pH of the control (0 kV/cm) with a value of 3.44 ± 0.55. The pH values for the treated grapes range between 3.39 and 3.60 with smaller standard deviations. These differences are significant. The sugar content also fluctuated, with values between 17.89 °Bx (3 kV/cm) and 20.68 °Bx (4.5 kV/cm), which may be due to the different ripening stages of the grapes. Although the grapes were harvested at the same time and are from the same batch, the appearance of the grapes differed. This was already apparent in the color of the whole grapes (Figure 1).
3.1.4. Measurements of Yield, Reducing Sugars, and Total Polyphenols
The juice yield of control grapes was on average almost 165 mL when 300 g of grapes were pressed. The yields obtained with varying treatment strengths were slightly lower with mean values between 149.5 mL (2 kV/cm) to 160.7 mL (3 kV/cm).
The reduced sugar content was significantly higher when the grapes were treated with PEFs. Starting with 198.86 g/L reducing sugars in grapes that had not undergone any treatment, the treated grapes showed increases of 3.5% (2 kV/cm), 7.5% (3 kV/cm), and 11% with E = 4.5 kV/cm. The most intense treatment of E = 6 kV/cm showed a slightly smaller increase than the intermediate treatment levels, with an increase of only 6% (210.55 g/L) compared with the control. However, these increases in the PEF-treated grapes are not significant compared with the control except for 4.5 kV/cm.
The TPI showed significant increases for PEF-treated grapes. While the control had an initial value of 306.20 mg/L and a high standard deviation of 116.89 mg/L, the lower field strengths of 2 and 3 kV/cm did not result in significant increases in the TPI. These were 3% to 8% lower than the control. Higher TPI was detected in grapes treated with 4.5 kV/cm, increasing by 30% to a total quantity of 398.90 mg/L. The treatment with 6 kV/cm also increased by 20% to 367.91 mg/L. The standard deviations were in a similar range to the lower treatment levels.
3.2. Sensory and Instrumental Analyses of Grape Juices
3.2.1. Sensory Analysis of Grape Juice
Sensory evaluation was conducted only with the control juice and juice treated with 3 kV/cm and 6 kV/cm. The test consisted of two parts: First, all possible attributes were selected from a list that contained odor attributes typical for white wine and checked if they applied to the respective sample (CATA). The results of the panelists’ selections can be seen in Figure 5, given as the mean values for all replicates after PCA.
All three samples are in the middle of the two-dimensional space near the origin and 69% of the variance can be explained by principal component one (PC-1) (Figure 5). PC-2 explains around 30% of the variance of the dataset. The distances from the control to the middle treatment level are slightly larger than those to the highest level, meaning that the most intense treatment and control have slightly more attributes in common. All three samples were described as fruity, sweetish, aromatic, and having the odor of grape and apple. The treatment with 6 kV/cm and the control were also sour.
The individual samples can also be further concretized. The control in particular is described as yeasty and fermented, while the middle treatment (3 kV/cm) is more earthy and herbaceous compared with the other two samples. The juices treated with 6 kV/cm are described as fresh. These results indicate, however, that the samples have a very similar odor to each other, regardless of treatment.
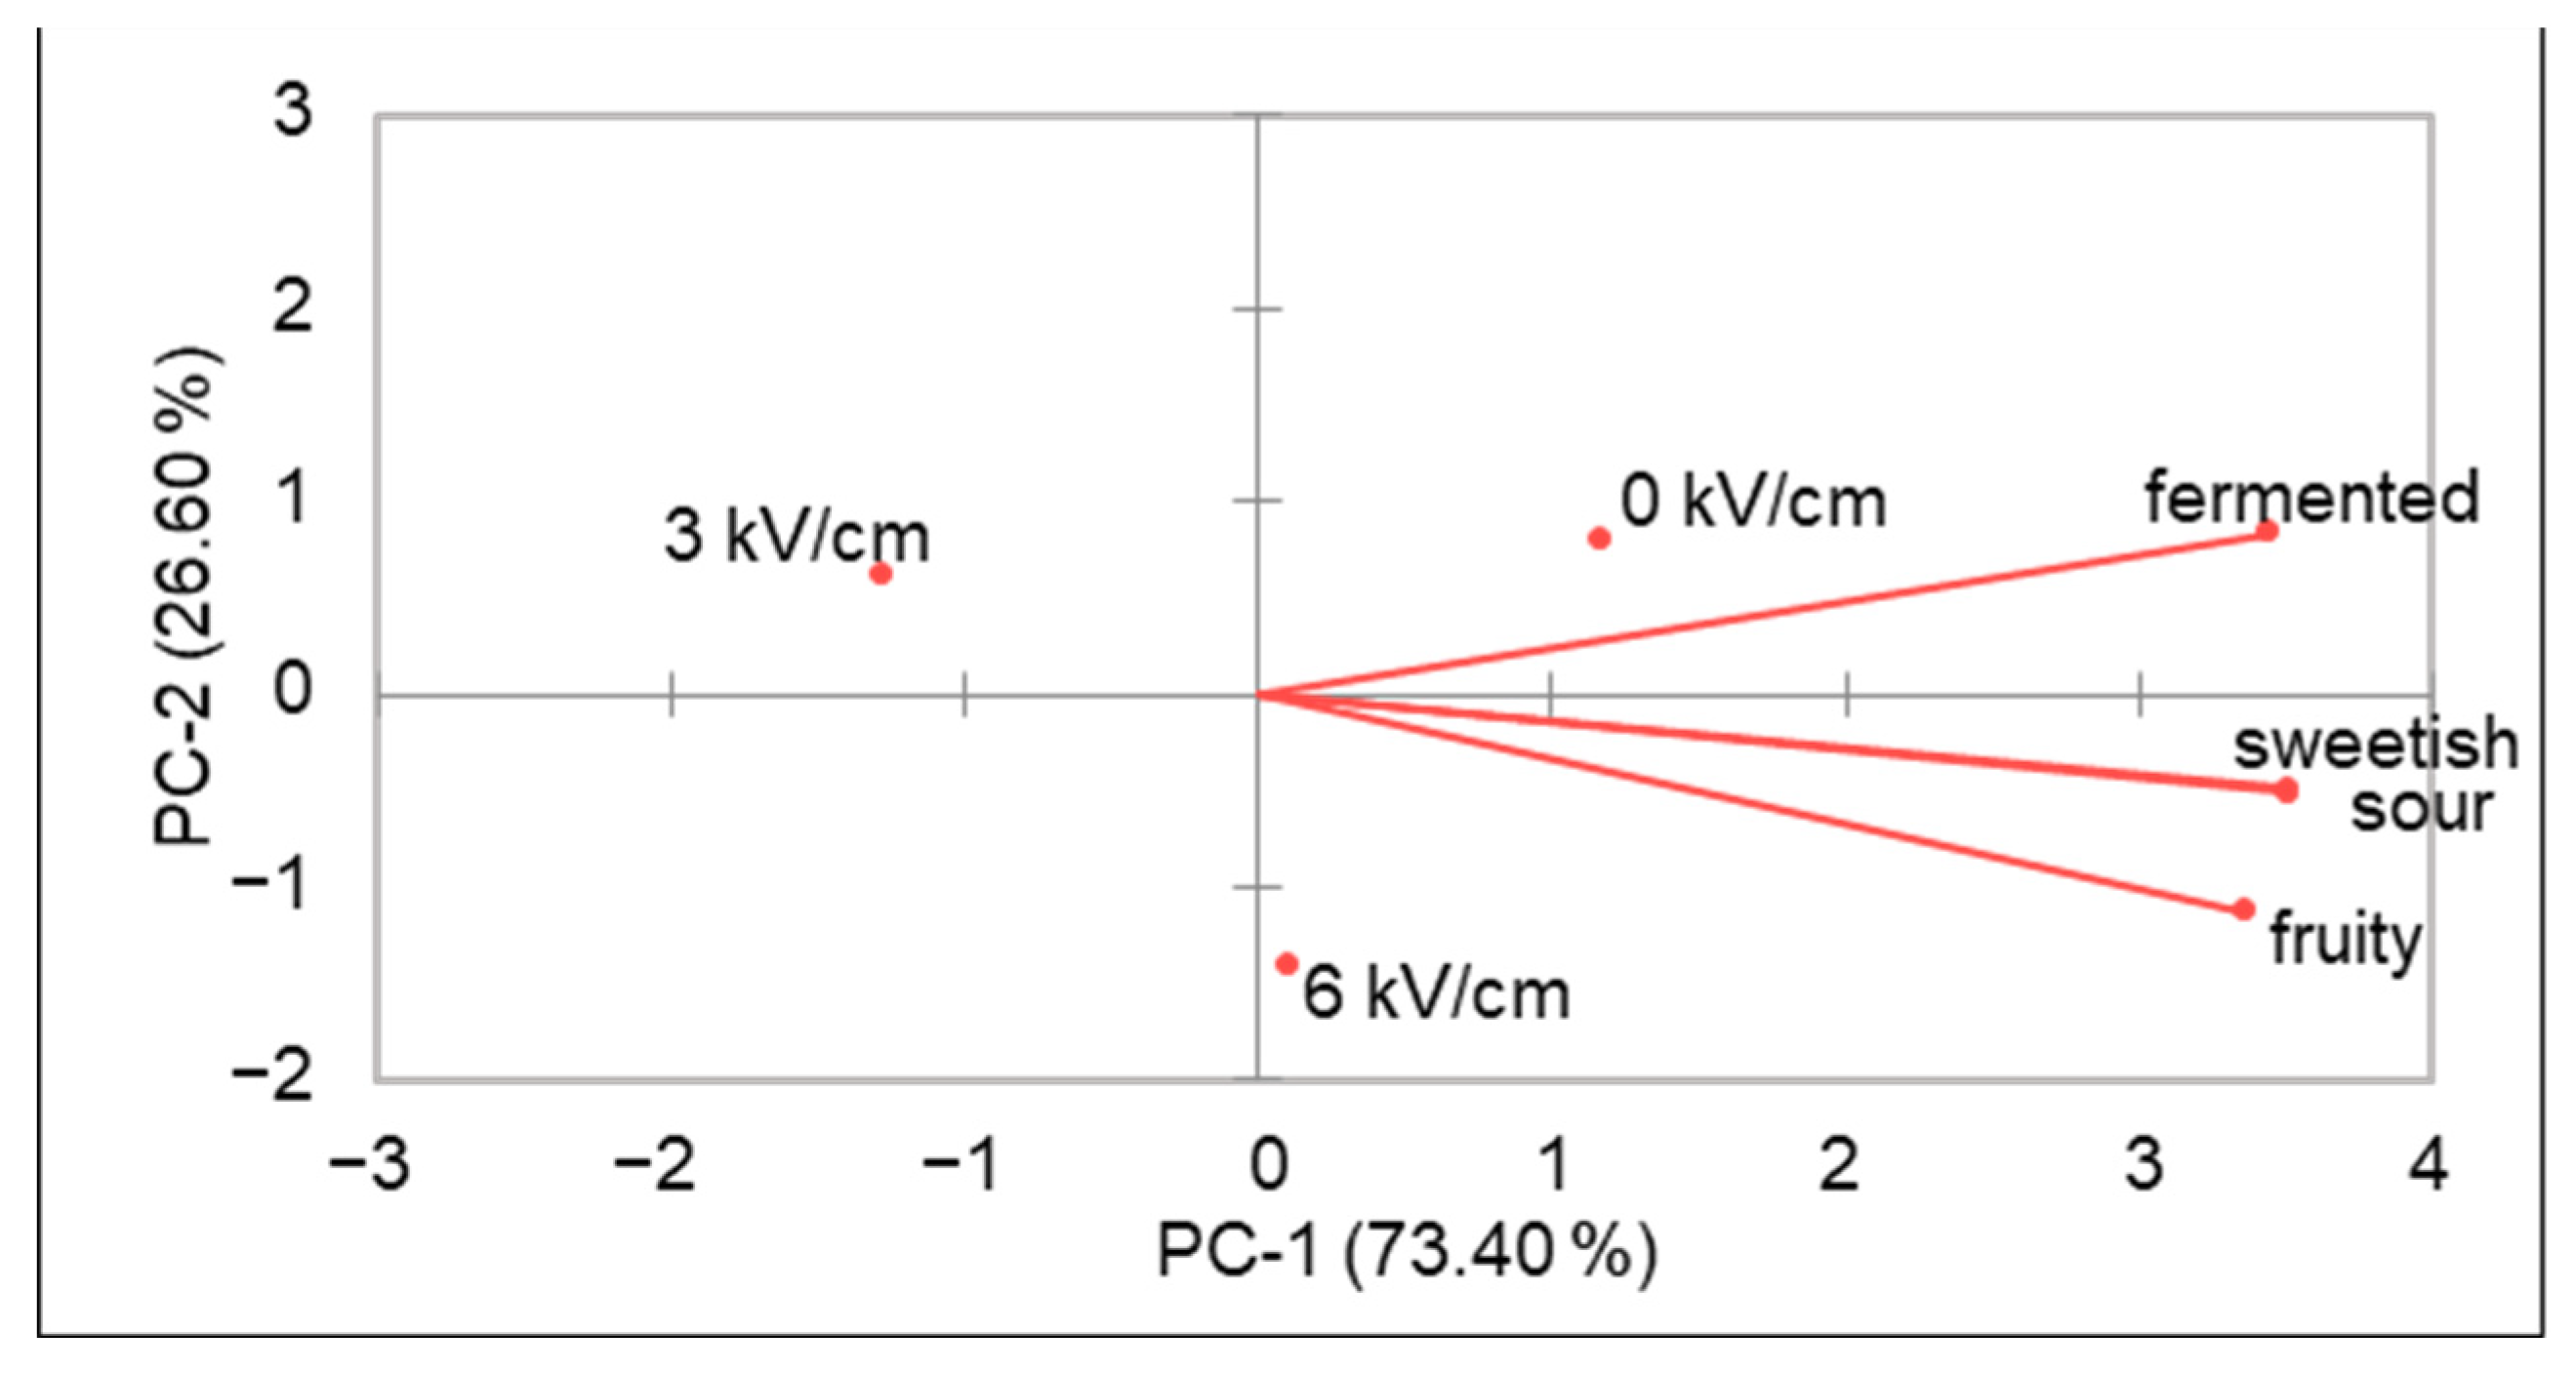
The RATA analysis provides more information about the intensity expressions for the attributes fruity, sweetish, sour, and fermented. As can be seen in the PCA in Figure 6, the control grape juice and the juice treated with the most intense field strength were mainly characterized by these attribute intensities. In particular, the control juice shows a higher intensity for the fermented attribute, which is consistent with the results of CATA. The intensity expressions of sweetish and sour are almost the same for both groups, while the most intense treatment has slightly more fruity aspects.
Figure 7 shows a more detailed examination of the individual intensity levels from the RATA analysis. A total of 38% of the panelists perceived the fruity component in the control as being only slightly pronounced, while a further 21% perceived it as slightly more pronounced and 13% as medium pronounced. Treatment with 3 kV/cm resulted in general in a slightly less perceived fruity aroma, which also explains the separation between control and 3 kV/cm in the PCA analysis (Figure 6). In the case of the fruity aroma, treatment with 6 kV/cm exhibited slightly altered data distribution in comparison to the control, but the mean of the distribution was almost identical. The differences are minor and, therefore, not statistically significant. Considering the attribute sweetish, the control shows a similar distribution to the previous evaluation (38% slightly pronounced and 21% medium pronounced). The treatment with 3 kV/cm resulted in a lower perception of the sweetish aroma. Treatment of the grapes with 6 kV/cm again resulted in a slightly pronounced (38%) to medium pronounced sweetness (17%). Again, the differences are comparatively small and, therefore, not statistically significant. Most of the panelists were unable to detect acidity and fermentation aroma characteristics in any of the samples and the distribution of the control and the PEF-treated samples were very similar.
3.2.2. Instrumental Analysis of Grape Juice with SPME/GC–MS
The chromatograms of the control and the juice samples treated with 3 and 6 kV/cm are shown in Figure 8. The main volatile components found in the samples are listed in Table 5. No internal standards were measured for calibration, which allows only a semi-quantitative interpretation of the results.
Six major volatiles can be identified in the juice variants. The first peak appears after a retention time of 2.836 min and is identified as ethanol (1), which is mainly described as having a weak, ethereal, but also vinous odor [32]. Hexanal (2), which is associated with a fruity, strong, and green grass odor [33], is found at a retention time of 6.277 min but only with a very low intensity in the control and treated variant with 6 kV/cm. Isobutanol (3; RT = 7.106 min), on the other hand, could be identified with a slightly higher peak in these variants, while the height is very low in the variant with 3 kV/cm. In the literature, isobutanol is described as sweet but also with a musty and undesirable odor [34]. The peak at 12.138 min was identified as (E)-2-hexenal (4), with its typically strong, fruity, green, and herbal odor [35], and is one of the most dominant peaks in the control. In contrast, the peaks detected for 1-hexanol (RT = 18.048 min; 5) and (E)-2-hexen-1-ol (RT = 20.514 min; 6) are less pronounced. Typical odor characteristics are fruity and freshly mown grass for 1-hexanol [36] and a strong and fruity-green aroma for (E)-2-hexen-1-ol [37]. The sensory analysis by the panelists revealed a less fruity aroma and in addition a less pronounced fermented odor (Figure 7) for the juice treated with 3 kV/cm. This is also covered by the instrumental analysis. The juices exhibited strongly reduced ethanol and (E)-2-hexenal peaks. Nevertheless, 1-hexanol and (E)-2-hexen-1-ol increased in the chromatogram, which illustrates more complex alterations in the volatile components than expected. As expected by the data from sensory analysis (Figure 7), the chromatogram obtained via SPME/GC–MS of the juice treated from 6 kV/cm was in general very similar to the control. The aroma compounds geraniol and linalool, which are principally found in grapes and wine and have a floral, spicy, and woody [38], or sweet rose and geranium-like aroma [39], can be detected only sporadically in the replicates and only at very low levels.
4. Discussion
The benefits of non-thermal treatment of red grapes with PEFs, which have already been demonstrated in several studies, stimulated this study to test the effect of PEF treatment on white grapes. Unlike the few studies dealing with PEF-treated white grapes and their limitation to sensory or physical changes, this study also compared the physical, chemical, and sensory parameters using instrument-based and human perceptions of Thompson Seedless grapes. This commercially important grape variety is known for its multipurpose use (fresh market, raisins, concentrate, and wine) [21,22,23,24]. For this purpose, grapes were treated with different field strengths and the resultant specific energy inputs and then analyzed for changes in pH, texture, color, TPI, and reducing sugars. Human and instrumental sensory data complement these results.
Previous studies investigating PEF treatment on different juices of longan [40], grapefruits [41], carrots, or oranges [4] demonstrated that non-thermal treatment does not affect all parameters, such as pH or °Bx. Using a treatment of 20 kV/cm and 600 µs for grapefruit yielded a pH of 4.54 and 10.7 °Bx for the treated juice compared with a pH of 4.51 and 10.0 °Bx for the control. The values observed by Rivas et al. in 2006 [4] also yielded only slight variations between a pH of 3.83 (9.5 °Bx) for the control juice and a pH of 3.86 (10.2 °Bx) for the PEF-treated juice (25 kV/cm with a maximum temperature of 68 °C). Small differences were partly confirmed in this study, as significant differences were found between the control and treated samples but also between the different field strengths. While the field strengths in this study were 4–12 times lower, representing a significant difference from the study just mentioned, the degree of ripeness of the single grapes might also have been responsible for the variations in the treated samples. Options to investigate the degree of ripeness include NIR analysis as demonstrated by a study on Cabernet Franc grapes [42]. On the other side, a significant increase in the scale of the processing of the grapes might help to overcome the heterogeneity in terms of different stages of ripeness within each batch, as was carried out by Fauster and co-workers (2020) [14].
Significantly greater differences were observed in the visual appearance of the treated grapes regardless of the field strength. Color changes in the grape skin were noted within a few minutes, evidenced by increasing a* and b* values, but there were no changes in brightness (L*) over 60 min. Grimi et al. (2011) [43] detected similar browning behavior in PEF-treated and untreated apple slices. They saw significantly increased browning in the treated slices over a period of 90 min due to tissue damage and the corresponding contact with air. In contrast, the control variant had a lesser visible browning effect and thus corresponded to the results for the control grapes of our study. While the treated grapes are damaged by short pulses and thus come into contact with air, the grape skin darkens within a few minutes over a period of up to 60 min. This could be diminished by the direct use of antioxidants during the PEF treatment. But the question arises whether the diffusion of antioxidants into the whole grapes is sufficient. In this regard, PEF treatment itself promotes rapid browning of the tissue, which is why the color change is most pronounced immediately after treatment. Furthermore, the study of apple slices revealed that the duration of contact with air is not relevant for the browning intensity of apple slices and is thus consistent with the visual appearance of the grape skin treated with different PEF intensities in this study [43]. On the other side, the brownish coloration and the increased mass transfer after PEF treatment are beneficial in the case of raisin production [44]. A study showed that a drying time reduction of 20% was possible for raisin production after PEF treatment [45].
Color changes in the form of a higher red intensity were seen in PEF-treated tomato juice when treated with 40 kV/cm for a short time [46]. In addition, the decline in the red tone was less for the treated juice (3.75 to about 3.60; control 3.60 to about 3.20) compared with the control after 4 months of storage (4 °C). In contrast, grapefruit juices did not show any changes for treated samples when L*, a*, and b* values were measured [41].
Regarding the influence on the juice yield, a previous study that focused on PEF-treated white grapes showed an increase in the juice yield of up to 26% to an overall yield of about 81% with settings of E = 0.75 kV/cm and 100 pulses [15]. Depending on the variety, yields of 51% to 56% were obtained for grapes without PEF treatments. This is also consistent with the yield obtained for the controls in this study (55%). However, the treated samples in our study showed slightly lower yields with values between 50 and 54% but were not significantly different. Similar results were obtained by Fauster and co-workers [14]. It is possible that the different yields that have been used in different studies can be explained by the different pressing times and technologies applied. While the grapes were pressed with a common kitchen press and the grape marc was pressed three times in total, Praporscic et al. (2007) [15] pressed grapes for 45 min with the combined PEF chamber. Therefore, the grapes should be pressed for a longer period of time. Easier and higher juice discharge, due to the facilitated cell opening, was also shown by El Kantar et al. (2018) [5]. A comparison between controls and treated whole fruits showed increases for lemons (39% to 63%), pomelos (54% to 74%), and oranges (48% to 60%) using field strengths similar to this study ranging from 3 to 10 kV/cm. These values were similar to the increases observed in white grapes from previous research [15]. Increased juice yields were also measured in wild blueberries when treated with field strengths of 1, 3, and 5 kV/cm and a constant pulse number [47]. A higher extraction yield was explained by the higher water content of grapes and that other vegetables and fruits have tougher tissues [37]. Bobinaitė et al. (2015) [47] also mentioned that their most intense field strength of 5 kV/cm did not show the highest extraction yield and cited the work of Jaeger et al. (2012) [48] by way of explanation: excessively high field strength can lead to compression and closing of the capillaries in the press cake, resulting in an unfavorable effect on the de-stacking.
A consequence of this is also the softening of the texture of treated products, which was already measured in the grapes 5 min after PEF treatment. Significant reductions in the crunchiness (up to 50%) and firmness (up to 45%) were observed between field strengths of 2 to 6 kV/cm compared with the control. The effect of a reduction in firmness by more than 70% was also observed in blueberries treated with a combination of sanitizing solution and PEF treatment of 2 kV/cm for 2, 4, and 6 min [10]. This reduction could be a response to the cell membrane breakdown, which could also be responsible for the softening of grape texture. However, the greater loss of texture in blueberries could also be due to the treatment time, as they were treated for a few minutes at 100 pulses per second. The grapes, on the other hand, were treated with 50 pulses for just a few seconds [10].
Reduced firmness of fruits could also negatively affect the products’ sensory quality and, therefore, PEF treatment should only be used for fruits that require a softer texture for processing [10]. Analyzing the odor of the treated grapes from this study did not reveal any significant sensory differences using the two short-term measurements CATA and RATA. Accordingly, the varying degrees of PEF treatment had no negative effect on the odor of the grape juices, which was also seen in the sensory similarity between treated and untreated carrot and orange juices compared with heat-pasteurized juices [4]. A possible further analysis would be to check the acceptance of treated and untreated samples using a nine-point scale such as that used by Min and Zhang (2003) [46] with 30 trained panelists. Tomato juice treated with PEF (40 kV/cm; 45 °C for 90 s) achieved a rating of 6.1 for flavor and 6.4 for color, while juice that had undergone heat treatment (92 °C for 90 s) only achieved ratings of 4.7 for flavor, while color was rated 6.1. Siddeeg et al. (2019) [49] could not find significant differences in vinegar from date palm fruits treated with PEF, ultrasound, or a combination of both compared with untreated vinegar. Trained panelists also ranked the samples with mean values of 6.90 for taste and color and 7.80 for flavor. Significant results could only be seen in the overall acceptability with a ranking of 8.10 for PEF-treated vinegar while the control was rated slightly lower at 6.00 (nine-point scale). The sensory profile is often also determined via GC–MS as seen in a study with Aglianico wine [11]. With their aim of identifying a possible negative aroma when grapes were treated with PEFs, field strengths of 1.5 kV/cm did not significantly affect volatiles for the most part but led to a few variations in some compounds compared with the control. For example, the composition of octanoic and hexanoic acid, which is considered negative in the literature, was higher in their treated wine. These findings cannot be confirmed in the white grapes in this study. Despite the fact that only the six most conspicuous peaks were examined more closely in the current study, almost no hits for octanoic or hexanoic acid were detected in the raw data of the replicates. One reason for the failure to detect the two acids is possibly the presence of the final product because this study uses only grape juice and thus a precursor of wine. Octanoic and hexanoic acid could be detected in this study in a total of two replicates of the treated samples but only in a very low abundance. This could be related to the degree of ripeness of the grapes. Ripeness could be successfully verified using SPME/MS in a study by Sánchez-Palomo et al. (2005) [50] with optimization of the process using additional verification with different HS–SPME fibers. Furthermore, the aroma profile of Muscat grapes identified 16 compounds, with linalool, geraniol, and nerol being the most important volatile compounds. Since these compounds were partially determined in this work but did not reach high peak areas, fiber changes should be considered for further analysis. A systematic analysis of the aroma profile of wines from two white grapes (Grüner Veltliner, and Traminer) was conducted by Fauster and co-workers [14]. The aim was to investigate the combined application of an enzymatic treatment and a PEF treatment to white wine mash. In this work, nine different terpenes and 18 esters were identified and quantified. Especially, the concentration of volatile esters of the variety Traminer increased significantly after PEF/enzymatic treatment [14].
The greatest differences between treated and untreated white grapes were seen in the analytical measurements of TPI and reducing sugars. The increases in TPI of about 20% to 30% were seen at the higher treatment strengths of 4.5 and 6 kV/cm and are consistent with the results for red wine [11]. Field strengths between 0.5 and 1.5 kV/cm with specific energy inputs between 1–50 kJ/kg resulted in an increase in total polyphenols of up to 38% (1.5 kV/cm, 25 kJ/kg) compared with the control. A higher quantity of total polyphenols derived from the PEF treatment could improve the antioxidant properties and maintain acidity or sugar content [11]. Unfortunately, measurements by these authors on a second grape variety could not achieve this increase in polyphenols, meaning that the grape variety seems to be important for the success of the PEF treatment. At a lower electric field strength of 0.4 to 2.0 kV/cm, the quantity of polyphenols increased (44.61%) when tomatoes were examined [51]. Higher total polyphenols were also seen in trials with oranges, pomelos, and lemons using treatment strengths of 3 and 10 kV/cm [5] as well as in wild blueberries, with increases of 43%, where the electric field strength was varied between 1, 3, and 5 kV/cm [47]. An increase in specific polyphenols was also described in the wine from Grüner Veltliner and Traminer grapes after a combination of PEF and enzymatic treatment [14].
For the reducing sugars, an electric field strength of E = 4.5 kV/cm also showed significant increases of more than 11% to a total quantity of 220.97 g/L compared with control grapes. The other field strengths also resulted in higher reducing sugar quantities but were not significantly different from this value. This was also confirmed for PEF-treated musts from white grapes with mean values of 182 g/L for the control and 179 to 182 g/L from treated grapes [16]. In particular, the control values for reducing sugars (182 g/L) of [16] were in a similar range to the results of this study (199 g/L), whereas their PEF-treated musts differed with almost unchanged values of reducing sugars compared with the obtained increases from this study. Measurements of reducing sugars in wine after storage for 3 months and bottle aging also revealed no significant differences in reducing sugar levels, with values ranging from 1.50 g/L (control) to 1.45 g/L (PEF-treated Cabernet Sauvignon wine) [18]. Also, in the work of Donsi et al. (2010), no significant increase in reducing sugars was detectable in the wine of PEF-treated Aglianico grapes [11].
5. Conclusions
In this study, the effect of PEF treatment on white grapes (Thompson Seedless variety), which is known for multipurpose use, was investigated. Electric field strengths between 4.5 and 6 kV/cm showed the greatest effect with texture decreases of almost 50% and increases in reducing sugars (11%) and total polyphenols (30%). Negative changes in sensory and olfactory characteristics were not determined, which makes it interesting for juice and wine producers. However, it should be noted that the permeabilization of the grape skin and the associated oxygen contact leads to the browning of the grape skin, which results in a negative visual appearance of the grapes and also of the juice obtained from them. It would, therefore, be advisable to perform PEF treatment in a flow cell to minimize oxygen contact and prevent grape skin browning as much as possible. It is also important that treated grapes be processed immediately after PEF treatment. However, the brownish coloration and the increased mass transfer after PEF treatment are beneficial in the case of raisin production.
Author Contributions
Conceptualization, S.S. and M.S.; methodology, S.S. and M.S.; validation, S.S. and M.S.; formal analysis, S.S.; investigation, S.S.; resources, M.S.; data curation, S.S.; writing—original draft preparation, S.S.; writing—review and editing, S.S. and M.S.; visualization, S.S.; supervision, M.S.; project administration, M.S.; funding acquisition, M.S. All authors have read and agreed to the published version of the manuscript.
Funding
This work was funded by the German Federal Ministry of Education and Research (BMBF), FZK 03WIR2808A. We acknowledge support for the Article Processing Charge from the Deutsche Forschungsgemeinschaft (DFG, German Research Foundation, 491232355) and the Open Access Publication Fund of the Hochschule Neubrandenburg (Neubrandenburg University of Applied Sciences).
Data Availability Statement
The data presented in this study are available upon request from the corresponding author.
Conflicts of Interest
The authors declare no conflict of interest. The funders had no role in the design of the study; in the collection, analyses, or interpretation of data; in the writing of the manuscript; or in the decision to publish the results.
Appendix A

Table A1.
Parameters for PEF treatment.
| Electric Field Strength E (kV/cm) | Applied Energy (kJ) | Voltage (kV) | Pulse Number | Specific Energy Input (kJ/kg) | Measured Temperature Increase Due to PEF Treatment ∆T (°C) |
|---|---|---|---|---|---|
| 2 | 1.250 | 10.0 | 50 | 2.5 | 0.0 |
| 3 | 2.812 | 15.0 | 50 | 5.624 | 0.0 |
| 4.5 | 6.328 | 22.5 | 50 | 12.656 | 1.9 |
| 6 | 11.250 | 30.0 | 50 | 22.5 | 4.0 |
Table A2.
L*, a*, and b* mean values of pressed grape juices with different treatment strengths.
| Mean Values of L*, a*, and b* for Treatment Strength and Replica | Summarized Mean Values of L*, a*, and b* for Each Treatment Strength and Replicas 1–3 | |||||
|---|---|---|---|---|---|---|
| Trial | L* | a* | b* | L* | a* | b* |
| 0 kV/cm (Replicate 1) | 62.65 | 1.11 | 17.04 | 62.74 | 1.07 | 16.48 |
| 0 kV/cm (Replicate 2) | 62.44 | 1.15 | 17.46 | |||
| 0 kV/cm (Replicate 3) | 63.13 | 0.96 | 14.95 | |||
| 2 kV/cm (Replicate 1) | 63.98 | 0.86 | 16.36 | 65.10 | 0.64 | 15.20 |
| 2 kV/cm (Replicate 2) | 67.79 | 0.26 | 12.37 | |||
| 2 kV/cm (Replicate 3) | 63.54 | 0.81 | 16.88 | |||
| 3 kV/cm (Replicate 1) | 63.60 | 0.88 | 16.53 | 63.80 | 0.88 | 17.25 |
| 3 kV/cm (Replicate 2) | 64.66 | 0.23 | 13.76 | |||
| 3 kV/cm (Replicate 3) | 63.15 | 1.53 | 21.45 | |||
| 4.5 kV/cm (Replicate 1) | 63.15 | 1.16 | 18.84 | 62.48 | 1.56 | 21.38 |
| 4.5 kV/cm (Replicate 2) | 62.35 | 1.70 | 21.20 | |||
| 4.5 kV/cm (Replicate 3) | 61.95 | 1.81 | 24.11 | |||
| 6 kV/cm (Replicate 1) | 63.51 | 1.05 | 18.61 | 63.83 | 0.84 | 16.15 |
| 6 kV/cm (Replicate 2) | 64.49 | 0.60 | 13.13 | |||
| 6 kV/cm (Replicate 3) | 63.50 | 0.88 | 16.71 | |||
The abbreviations denote the characterization of the measured color space where the L* value denotes the light and dark color space, a* denotes the color axes green to red, and b* denotes the color axes yellow to blue.
References
- Toepfl, S.; Heinz, V.; Knorr, D. High intensity pulsed electric fields applied for food preservation. Chem. Eng. Process. 2007, 46, 537–546. [Google Scholar] [CrossRef]
- López, N.; Puértolas, E.; Condón, S.; Álvarez, I.; Raso, J. Application of pulsed electric fields for improving the maceration process during vinification of red wine: Influence of grape variety. Eur. Food Res. Technol. 2008, 227, 1099–1107. [Google Scholar] [CrossRef]
- Zimmermann, U.; Pilwart, G.; Riemann, F. Dielectric Breakdown of Cell Membranes. Biophys. J. 1974, 14, 881–899. [Google Scholar] [CrossRef]
- Rivas, A.; Rodrigo, D.; Martínez, A.; Barbosa-Cánovas, G.V.; Rodrigo, M. Effect of PEF and heat pasteurization on the physical-chemical characteristics of blended orange and carrot juice. Food Sci. Technol. 2006, 39, 1163–1170. [Google Scholar] [CrossRef]
- El Kantar, S.; Boussetta, N.; Lebovka, N.; Foucart, R.; Rajha, H.N.; Maroun, R.G.; Louka, N.; Vorobiev, E. Pulsed electric field treatment of citrus fruits: Improvement of juice and polyphenols extraction. Innov. Food Sci. Emerg. Technol. 2018, 46, 153–161. [Google Scholar] [CrossRef]
- Schilling, S.; Alber, T.; Toepfl, S.; Neidhardt, S.; Knorr, D.; Schieber, A.; Carle, R. Effects of pulsed electric field treatment of apple mash on juice yield and quality attributes of apple juices. Innov. Food Sci. Emerg. Technol. 2007, 8, 127–134. [Google Scholar] [CrossRef]
- Sevenich, R.; Gratz, M.; Hradecka, B.; Fauster, T.; Teufl, T.; Schottroff, F.; Chytilova, L.S.; Hurkova, K.; Tomaniova, M.; Hajslova, J.; et al. Differentiation of sea buckthorn syrups processed by high pressure, pulsed electric fields, ohmic heating, and thermal pasteurization based on quality evaluation and chemical fingerprint. Front. Nutr. 2023, 10, 912824. [Google Scholar] [CrossRef]
- Koch, Y.; Witt, J.; Lammerskitten, A.; Siemer, C.; Toepfl, S. The influence of Pulsed Electric Fields (PEF) on the peeling ability of different fruits and vegetables. J. Food Eng. 2022, 322, 110938. [Google Scholar] [CrossRef]
- Leong, S.Y.; Roberts, R.; Hu, Z.; Bremer, P.; Silcock, P.; Toepfl, S.; Oey, I. Texture and in vitro starch digestion kinetics of French Fries produced from potatoes (Solanum tuberosum L.) pre-treated with Pulsed Electric Fields. Appl. Food Res. 2022, 2, 100194. [Google Scholar] [CrossRef]
- Jin, T.Z.; Yu, Y.; Gurtler, J.B. Effects of pulsed electric field processing on microbial survival, quality change and nutritional characteristics of blueberries. Food Sci. Technol. 2017, 77, 517–524. [Google Scholar] [CrossRef]
- Donsi, F.; Ferrari, G.; Fruilo, M.; Pataro, G. Pulsed Electric Field-Assisted Vinification of Aglianico and Piedirosso Grapes. J. Agric. Food Chem. 2010, 58, 11606–11615. [Google Scholar] [CrossRef] [PubMed]
- Arcena, M.R.; Leong, S.Y.; Then, S.; Hochberg, M.; Sack, M.; Mueller, G.; Sigler, J.; Kebede, B.; Silcock, P.; Oey, I. The effect of pulsed electric fields pretreatment on the volatile and phenolic profiles of Merlot grape musts at different winemaking stages and the sensory characteristics of the finished wines. Innov. Food Sci. Emerg. Technol. 2021, 70, 102698. [Google Scholar] [CrossRef]
- Saldaña, G.; Cebrián, G.; Abenoza, M.; Sánchez-Gimeno, C.; Álvarez, I.; Raso, J. Assessing the efficacy of PEF treatments for improving polyphenol extraction during red wine vinifications. Innov. Food Sci. Emerg. Technol. 2017, 39, 179–187. [Google Scholar] [CrossRef] [PubMed]
- Fauster, T.; Philipp, C.; Hanz, K.; Scheibelberger, R.; Teufl, T.; Nauer, S.; Scheibelhofer, H.; Jaeger, H. Impact of a combined pulsed electric field (PEF) and enzymatic mash treatment on yield, fermentation behaviour and composition of white wine. Eur. Food Res. Technol. 2020, 246, 609–620. [Google Scholar] [CrossRef]
- Praporscic, I.; Lebovka, N.; Vorobiev, E.; Mietton-Peuchot, M. Pulsed electric field enhanced expression and juice quality of white grapes. Sep. Purif. Technol. 2007, 52, 520–526. [Google Scholar] [CrossRef]
- Comuzzo, P.; Marconi, M.; Zanella, G.; Querzè, M. Pulsed electric field processing of white grapes (cv. Garganega): Effects on wine composition and volatile compounds. Food Chem. 2018, 264, 16–23. [Google Scholar] [CrossRef]
- Garde-Cerdán, T.; González-Arenzana, L.; López, N.; López, R.; Santamaría, P.; López-Alfaro, I. Effect of different pulsed electric field treatments on the volatile composition of Graciano, Tempranillo and Grenache grape varieties. Innov. Food Sci. Emerg. Technol. 2013, 20, 91–99. [Google Scholar] [CrossRef]
- Puértolas, E.; Saldaña, G.; Condón, S.; Álvarez, I.; Raso, J. A Comparison of the Effect of Macerating Enzymes and Pulsed Electric Fields Technology on Phenolic Content and Color of Red Wine. J. Food Sci. 2009, 74, C647–C651. [Google Scholar] [CrossRef]
- Wine Consumption Worldwide from 2000 to 2022 (in Million Hectoliters) in Statista. Available online: https://www.statista.com/statistics/232937/volume-of-global-wine-consumption/ (accessed on 1 September 2023).
- Genova, G. Qualitative Evaluation of Aroma-Active Compounds in Grape and Grape-Derived Products by Means of Headspace SPME-GC/MS Analysis. Perkin Elmer 2012, 1–7. [Google Scholar]
- Paranjpe, S.S.; Ferruzzi, M.; Morgan, M.T. Effect of a flash vacuum expansion process on grape juice yield and quality. Food Sci. Technol. 2012, 48, 147–155. [Google Scholar] [CrossRef]
- Christensen, L.P. Raisin Grape Varieties. In Raisin Production Manual, 1st ed.; Christensen, L.P., Ed.; UCANR Publications: Oakland, CA, USA, 2000; p. 39. [Google Scholar]
- California Grape Acreage Report, 2021 Summary. Available online: https://www.nass.usda.gov/Statistics_by_State/California/Publications/Specialty_and_Other_Releases/Grapes/Acreage/2022/grpacSUMMARY2021Crop.pdf (accessed on 12 September 2023).
- Vitis International Variety Catalogue—Varieties Registered in Europe. Available online: https://www.vivc.de/index.php?r=www-europ-catalogue%2Fresult&WwwEuropCatalogueSearch%5Bvivc_var_id%5D=12051&sort=-eu_member# (accessed on 12 September 2023).
- Gierling, R. Farbmanagement, 3rd ed.; mitp-Verlag: Heidelberg, Germany, 2006. [Google Scholar]
- Miller, G.L. Use of Dinitrosalicylic Acid Reagent for Determination of Reducing Sugar. Anal. Chem. 1959, 31, 426–428. [Google Scholar] [CrossRef]
- Meyners, M.; Castura, J.C. Randomization of CATA attributes: Should attribute lists be allocated to assessors or to samples. Food Qual. Prefer. 2016, 48, 210–215. [Google Scholar] [CrossRef]
- Valentin, D.; Chollet, S.; Lelevre, M.; Abdi, H. Quick and dirty but still pretty good: A review of new descriptive methods in food science. Int. J. Food Sci. Technol. 2012, 47, 1563–1578. [Google Scholar] [CrossRef]
- Ares, G.; Bruzzone, F.; Vidal, L.; Cadena, R.S.; Giménez, A.; Pineau, B.; Hunter, D.C.; Paisley, A.G.; Jaeger, S.R. Evaluation of a rating-based variant of check-all-that-apply questions: Rate-All-That-Apply (RATA). Food Qual. Prefer. 2014, 36, 87–95. [Google Scholar] [CrossRef]
- Varela, P.; Ares, G. Sensory profiling, the blurred line between sensory and consumer science. A review of novel methods for product characterization. Food Res. Int. 2012, 48, 893–908. [Google Scholar] [CrossRef]
- DIN 10962:1997-10; Deutsches Institut für Normung e. V., Areas for Sensory Analysis- Specifications of Testrooms. Beuth Verlag GmbH: Berlin, Germany,, 1997.
- National Library of Medicine—Ethanol. Available online: https://pubchem.ncbi.nlm.nih.gov/compound/Ethanol (accessed on 8 May 2023).
- National Library of Medicine—Hexanal. Available online: https://pubchem.ncbi.nlm.nih.gov/compound/Hexanal (accessed on 9 May 2023).
- National Library of Medicine—Isobutanol. Available online: https://pubchem.ncbi.nlm.nih.gov/compound/Isobutanol (accessed on 26 July 2023).
- National Library of Medicine—2-Hexenal. Available online: https://pubchem.ncbi.nlm.nih.gov/compound/2-Hexenal (accessed on 8 May 2023).
- National Library of Medicine—1-Hexanol. Available online: https://pubchem.ncbi.nlm.nih.gov/compound/1-Hexanol (accessed on 8 May 2023).
- National Library of Medicine—2-Hexen-1-ol. Available online: https://pubchem.ncbi.nlm.nih.gov/compound/2-Hexen-1-OL (accessed on 8 May 2023).
- National Library of Medicine—Linalool. Available online: https://pubchem.ncbi.nlm.nih.gov/compound/Linalool (accessed on 9 May 2023).
- National Library of Medicine—Geraniol. Available online: https://pubchem.ncbi.nlm.nih.gov/compound/Geraniol (accessed on 9 May 2023).
- Zhang, Y.; Gao, B.; Zhang, M.; Shi, J.; Xu, Y. Pulsed electric field processing effects on physicochemical properties, flavor compounds and microorganisms of Longan Juice. J. Food Process. Preserv. 2010, 34, 1121–1138. [Google Scholar] [CrossRef]
- Aadil, R.M.; Zeng, X.-A.; Sun, D.-W.; Wang, M.-S.; Liu, Z.-W.; Zhang, Z.-H. Combined effects of sonication and pulsed electric field on selected quality parameters of grapefruit juice. Food Sci. Technol. 2015, 62, 890–893. [Google Scholar] [CrossRef]
- Le Moigne, M.; Maury, C.; Bertrand, D.; Jourjon, F. Sensory and instrumental characterisation of Cabernet Franc grapes according to ripening stages and growing location. Food Qual. Prefer. 2008, 19, 220–231. [Google Scholar] [CrossRef]
- Grimi, N.; Mamouni, F.; Lebovka, N.; Vorobiev, E.; Vaxelaire, J. Impact of apple processing modes on extracted juice quality: Pressing assisted by pulsed electric fields. J. Food Eng. 2011, 103, 52–61. [Google Scholar] [CrossRef]
- Fidelibus, M.W. Grapevine Variety and Number of Canes Affect Dry-on-Vine (DOV) Raisin Production on an Overhead Arbor Trellis. Horticulturae 2021, 7, 356. [Google Scholar] [CrossRef]
- Patidar, A.; Vishwakarma, S.; Meena, D. Traditional and recent development of pretreatment and drying process of grapes during raisin production: A review of novel pretreatment and drying methods of grapes. Food Front. 2021, 2, 46–61. [Google Scholar] [CrossRef]
- Min, S.; Zhang, Q.H. Effects of Commercial-scale Pulsed Electric Field Processing on Flavor and Color of Tomato Juice. J. Food Sci. 2003, 68, 1600–1606. [Google Scholar] [CrossRef]
- Bobinaitė, R.; Pataro, G.; Lamanauskas, N.; Šatkauskas, S.; Viškelis, P.; Ferrari, G. Application of pulsed electric field in the production of juice and extraction of bioactive compounds from blueberry fruits and their by-products. J. Food Sci. Technol. 2015, 52, 5898–5905. [Google Scholar] [CrossRef]
- Jaeger, H.; Schulz, M.; Lu, P.; Knorr, D. Adjustment of milling, mash electroporation and pressing for the development of a PEF assisted juice production in industrial scale. Innov. Food Sci. Emerg. Technol. 2012, 14, 46–60. [Google Scholar] [CrossRef]
- Siddeeg, A.; Zeng, X.A.; Rahaman, A.; Manzoor, M.F.; Ahmed, Z.; Ammar, A.-F. Quality characteristics of the processed dates vinegar under influence of ultrasound and pulsed electric field treatments. J. Food Sci. Technol. 2019, 56, 4380–4389. [Google Scholar] [CrossRef]
- Sánchez-Palomo, E.; Consuelo Díaz-Maroto, M.; Soledad Pérez-Coello, M. Rapid determination of volatile compounds in grapes by HS-SPME coupled with GC–MS. Talanta 2005, 66, 1152–1157. [Google Scholar] [CrossRef]
- Vallverdú-Queralt, A.; Oms-Oliu, G.; Odriozola-Serrano, I.; Lamuela-Raventos, R.M.; Martín-Belloso, O.; Elez-Martínez, P. Effects of pulsed electric fields on the bioactive compound content and antioxidant capacity of tomato fruit. J. Agric. Food Chem. 2012, 60, 3126–3134. [Google Scholar] [CrossRef] [PubMed]
Figure 1.
Experimental workflow for the measurements carried out on whole grapes and their corresponding juices. The abbreviations mentioned in the workflow denote the characterization of the measured color space where the L* value denotes the light and dark color space, a* denotes the color axes green to red, and b* denotes the color axes yellow to blue. CATA and RATA are the abbreviations for the check- and rate-all-that-apply sensory methods, respectively, while SPME/GC-MS means solid phase microextraction (SPME)/gas chromatography (GC)–mass chromatography (GC).

Figure 2.
Sample showing the differing visual appearance of Thompson Seedless grapes.

Figure 3.
The visual appearance of the grapes over a period of up to 60 min (time measurement started after destemming/washing for the control sample, and after treatment with PEFs for the treated samples).
Figure 3.
The visual appearance of the grapes over a period of up to 60 min (time measurement started after destemming/washing for the control sample, and after treatment with PEFs for the treated samples).

Figure 4.
Photographs of the pressed grape juice treated with different electric field strengths. (A) Grape juice from untreated grapes. (B) Grape juice from grapes treated with 2 kV/cm. (C) Grape juice from grapes treated with 3 kV/cm. (D) Grape juice from grapes treated with 4.5 kV/cm. (E) Grape juice from grapes treated with 6 kV/cm.

Figure 5.
PCA of CATA for the odor attributes of different treated grapes: 0 kV/cm (control) = grapes without any treatment; 3 kV/cm (middle field strength) = grapes treated with 3 kV/cm; and 6 kV/cm (most intense field strength) = grapes treated with a 2-fold higher treatment strength than 3 kV/cm. n = 3. The results were selected by 14 panelists per run.

Figure 6.
PCA of RATA for the odor attributes of different treated grapes: 0 kV/cm (control), 3 kV/cm, and 6 kV/cm; n = 3. The results are based on mean values from all replicates.
Figure 6.
PCA of RATA for the odor attributes of different treated grapes: 0 kV/cm (control), 3 kV/cm, and 6 kV/cm; n = 3. The results are based on mean values from all replicates.

Figure 7.
Distribution of intensity perceptions for selected attributes in control grapes and grapes treated with 3 and 6 kV/cm. (A) Intensity perceptions of the attribute fruity for the three different grape treatments. (B) Intensity perceptions of the attribute sweetish for the three different grape treatments. (C) Intensity perceptions of the attribute sour for the three different grape treatments. (D) Intensity perceptions of the attribute fermented for the three different grape treatments. The results are from 14 panelists per run and are shown as the means from all replicates. Differences are not statistically significant.

Figure 8.
Total ion chromatograms for the control sample (0 kV/cm, upper chromatogram) and grapes treated with E = 3 kV/cm (middle chromatogram) and 6 kV/cm (lower chromatogram) obtained via SPME/GC–MS. The x-axis represents the time in minutes; y-axis represents the abundance (Ab). Peak identification: 1 = ethanol; 2 = hexanal; 3 = isobutanol; 4 = (E)-2-hexenal; 5 = 1-hexanol; and 6 = (E)-2-hexen-1-ol.

Table 1.
Attributes for CATA.
| Fruity Attributes | Desirable Attributes | Non-Desirable Attributes |
|---|---|---|
| Pear | Fruity | Woody |
| Apple | Sweetish | Earthy |
| Peach | Sour | Musty |
| Gooseberry | Aromatic | Oxidized (fermented) |
| Lemon | Tart | Chemical |
| Lime | Fresh | Yeasty |
| Grapefruit | Flowery | |
| Herbaceous | ||
| Neutral | ||
| Rounded |
Table 2.
Color changes in the grape skin and the extracted juice.
| Electric Field Strength E [kV/cm] | ΔE of Whole Grapes between 5 and 60 min | ΔE of Whole Grapes between Different Field Strengths and Control Sample (0 kV/cm) after 60 min | ΔE of the Extracted Juice between Different Field Strengths and Control Sample (0 kV/cm) |
|---|---|---|---|
| 0 | 0.55 ± 0.12 | - | - |
| 2 | 2.64 ± 0.28 | 3.21 ± 0.67 | 2.92 ± 3.16 |
| 3 | 2.66 ± 0.54 | 3.74 ± 0.53 | 3.11 ± 2.08 |
| 4.5 | 2.90 ± 0.79 | 3.88 ± 0.79 | 4.96 ± 2.66 |
| 6 | 2.73 ± 0.62 | 3.52 ± 0.62 | 2.30 ± 1.50 |
Color measurements were taken at intervals of 5 min and ended at 60 min; time measurement started after destemming/washing (control) or after the PEF treatment; n = 3.
Table 3.
Texture measurements of the control and treated grapes.
| Electric Field Strength (kV/cm) | Crunchiness (N/mm2) | Firmness (N/mm) |
|---|---|---|
| 0 | 0.070 ± 0.011 a | 1.319 ± 0.259 a |
| 2 | 0.047 ± 0.005 bc | 0.723 ± 0.134 b |
| 3 | 0.035 ± 0.007 c | 0.799 ± 0.087 b |
| 4.5 | 0.050 ± 0.012 bc | 0.839 ± 0.203 b |
| 6 | 0.052 ± 0.009 b | 0.982 ± 0.119 b |
The results are presented as mean values ± standard deviations 5 min after the treatment with pulsed electric fields or washing and destemming (control). Different lowercase letters in the same column represent significant differences between the treatments (α = 0.05); n = 3.
Table 4.
Physicochemical properties of treated and untreated white grapes.
| Electric Field Strength E (kV/cm) | pH | °Bx | Yield (mL) | Red. Sugar (g/L) | TPI (mg/L) |
|---|---|---|---|---|---|
| 0 | 3.44 ± 0.55 ab | 17.90 ± 0.46 b | 164.9 ± 6.6 a | 198.86 ± 21.12 b | 306.20 ± 116.89 b |
| 2 | 3.60 ± 0.10 a | 20.47 ± 2.79 a | 149.5 ± 7.0 a | 206.00 ± 9.45 ab | 281.47 ± 62.02 b |
| 3 | 3.39 ± 0.25 b | 17.89 ± 2.37 b | 160.7 ± 9.5 a | 213.98 ± 15.84 ab | 296.83 ± 55.86 b |
| 4.5 | 3.50 ± 0.16 ab | 20.68 ± 1.13 a | 150.5 ± 6.1 a | 220.97 ± 11.96 a | 398.90 ± 48.47 a |
| 6 | 3.42 ± 0.17 ab | 18.49 ± 2.11 b | 158.7 ± 5.1 a | 210.55 ± 4.57 ab | 367.91 ± 51.04 a |
The results are presented as mean values ± standard deviations. Different lowercase letters in the same column represent significant differences between the treatments (α = 0.05); n = 3.
Table 5.
Overview of the volatile components found in the juice samples of treated and control samples with their retention times and aroma profiles.
Table 5.
Overview of the volatile components found in the juice samples of treated and control samples with their retention times and aroma profiles.
| Peak No. | RT (min) | Hit Name | Aroma Profile–Odor 1 |
|---|---|---|---|
| 1 | 2.836 | Ethanol | Weak; ethereal; vinous |
| 2 | 6.277 | Hexanal | Fruity; strong, green grass; sharp, aldehyde |
| 3 | 7.106 | Isobutanol | Sweet; musty; wine-like; disagreeable |
| 4 | 12.138 | (E)-2-hexenal | Strong, fruity, green, vegetable-like |
| 5 | 18.048 | 1-hexanol | Fruity; freshly mown grass; sweet alcohol |
| 6 | 20.514 | (E)-2-hexen-1-ol | Strong, fruity-green aroma |
Disclaimer/Publisher’s Note: The statements, opinions and data contained in all publications are solely those of the individual author(s) and contributor(s) and not of MDPI and/or the editor(s). MDPI and/or the editor(s) disclaim responsibility for any injury to people or property resulting from any ideas, methods, instructions or products referred to in the content. |
© 2023 by the authors. Licensee MDPI, Basel, Switzerland. This article is an open access article distributed under the terms and conditions of the Creative Commons Attribution (CC BY) license (https://creativecommons.org/licenses/by/4.0/).
Share and Cite
MDPI and ACS Style
Scharf, S.; Sandmann, M. Effects of Pulsed Electric Fields on the Physicochemical and Sensory Properties of Thompson Seedless Grapes. Beverages 2023, 9, 82. https://doi.org/10.3390/beverages9040082
AMA Style
Scharf S, Sandmann M. Effects of Pulsed Electric Fields on the Physicochemical and Sensory Properties of Thompson Seedless Grapes. Beverages. 2023; 9(4):82. https://doi.org/10.3390/beverages9040082
Chicago/Turabian StyleScharf, Sabrina, and Michael Sandmann. 2023. "Effects of Pulsed Electric Fields on the Physicochemical and Sensory Properties of Thompson Seedless Grapes" Beverages 9, no. 4: 82. https://doi.org/10.3390/beverages9040082
Note that from the first issue of 2016, this journal uses article numbers instead of page numbers. See further details here.