
Peculiarities of the Organic Wine in Galicia (NW Spain): Sensory Evaluation and Future Considerations


Estación de Viticultura e Enoloxía de Galicia (EVEGA-AGACAL), Ponte San Clodio S/N, Leiro, 32428 Ourense, Spain
*
Authors to whom correspondence should be addressed.
Beverages 2023, 9(4), 89; https://doi.org/10.3390/beverages9040089
Submission received: 25 August 2023
/
Revised: 25 September 2023
/
Accepted: 12 October 2023
/
Published: 18 October 2023
(This article belongs to the Section Sensory Analysis of Beverages)
Abstract
:Although wine is one of the most studied beverages at a sensory level, there is practically no information on the particularities of organic wines from Galicia. Considering that different regions provide distinctive characteristics to wines, organic and conventional wines from the five Designations of Origin (DO) from Galicia were analyzed at chemical and sensory levels. Sensory analysis showed that organic cultivation favors distinctive quality wines. Organic wines obtained similar scores to conventional wines in the preference tests and, in some cases, they were preferred by the tasters. However, this was not the case with wines produced in climatologically unfavorable seasons. Differences between conventional and organic wines were strongly marked by other factors such as the vintage, the DO, the winemaking techniques, or the yeasts of each winery. The results of this study show that organic wine production favors the differentiation and diversification of Galician wines. This could increase the added value of organic wines and improve their choice in a crowded market.
1. Introduction
Wine’s chemical and sensory characteristics determine its quality and acceptance by consumers [1]. Several factors are involved in wine quality since its final composition depends on the compounds initially present in the grape juice and the ability of the fermentative yeasts to transform them. Grape must composition and sensory attributes are influenced by the terroir, which includes physicochemical soil properties, climatic conditions, cultivation practices, soil microbiome, and grapevine variety [2,3,4]. In addition, the oenological practices applied in the winery and the winemaking conditions also have an effect; for instance, the management of yeast population during fermentation influences the organoleptic quality of the wines. Nevertheless, the production system can also have an influence, for example, it is known that organic vines suffer more biotic stress than conventional ones [5].
Organic products are booming worldwide, and the wine industry is currently shifting toward more sustainable production practices due to consumer demand for healthier and more environmentally friendly food [6,7,8]. This trend is also a fact in Spain, with an increase in both the area of organic vineyards and the number of wineries in recent years. In Galicia (northwest Spain), there are five Designations of Origin (DO) characterized by different climatic conditions that are not always favorable for the organic cultivation of vineyards. Therefore, although wine in the Galician region is an important sector due to its economic importance, enhancement of the rural areas, and its role in environmental conservation, the vineyards under organic management are scarce (77 ha, i.e., <0.3% of the conventional vineyard area) [9]. Nevertheless, to ensure organic wine implementation, this differentiation must be associated with a distinguished quality product. The number of Galician wine companies producing competitive and highly appreciated organic wine in the world market has tripled in the last decade to reach the current 25 wineries [9].
Organic grape growing implies limitations in the products that can be used in the vineyard, especially in fertilization and in the treatment of vine pathogens. In addition, in the winery, there are some small differences or restrictions for organic wine production compared to the conventional one [10,11,12]. Organic wine must be produced exclusively from organic raw materials, and only the addition of certain products and substances authorized under this regulation should be allowed. For example, the maximum sulfur dioxide (SO2) content shall not exceed 100 mg/L for red wines and 150 mg/L for white and rosé wines (all with a residual sugar content of less than 2 g/L). For all other organic wines, the maximum sulfur dioxide content applied shall be reduced by 30 mg/L. Organic yeasts are required if the strain is available and lactic acid bacteria can be used. This regulation includes more specific rules for winemaking, such as labeling and others that do not apply to Galician organic wines more typical of large wineries, such as partial dealcoholization, partial concentration in cold, etc.
Spontaneous fermentation involving the contribution of local yeasts from grapes and the winery is highly valued because they give distinctive characteristics to the wine. Our previous results confirmed that spontaneous fermentation in organic wineries in Galicia favors the existence of a high diversity of autochthonous S. cerevisiae strains, some of which are specific to each winery, contributing to the complexity and differentiation of the wines [13]. Previous studies have shown that organic and biodynamic wines differ from conventional wines in their chemical composition and in their main sensory characteristics [14,15]. Other authors emphasized, based on the chemical and sensory data obtained, that the differences recorded in the intrinsic and perceived quality and the level of typicity of the respective wines did not depend on the type of management [16]. Moreover, the willingness to pay for wine is influenced by the importance each consumer attaches to certification [17]. Organic production can add value to the wine that consumers assess positively. However, does this translate into real organoleptic differences detectable by a taster?
In this study, white and red organic and conventional wines from different Galician DOs have been evaluated at chemical and sensory levels to find differential properties that could add value to organic wines, giving an overview of the quality, as well as the preference between the two types of wine.
2. Materials and Methods
2.1. Wine Samples
Representative organic and conventional wines from the five Galician DOs were obtained directly from wineries. A total of 65 different wines were evaluated (Table 1). Red and white wines were included when available.
2.2. Chemical and Microbiological Analysis of Wines
The basic chemical characteristics of wines were determined using the official methodology [18]. The quantified parameters were: malic acid, alcoholic strength; total acidity, glucose and fructose, tartaric acid, glycerol, volatile acidity, lactic acid, pH, and free and total SO2. For the 2016 red wines, colorimetric and tannin parameters were also analyzed.
2.3. Sensory Evaluation
The sensory evaluation of wines was conducted at the tasting room of Evega in December 2014 (seven sessions) and in July 2016 (six sessions). Each session included between 5 and 7 different wine samples. Each wine (30 mL) was coded and served in standard tasting glasses at room temperature. One sample was duplicated in each session to assess the competence of the tasters.
The panel of judges consisted of 15 tasters in 2014 (6 females and 9 males) and 13 tasters in 2016 (5 females and 8 males) ranging from 25 to 60 years old; all of them had experience in Galician wines. The panelists were trained to recognize all the sensory descriptors before assessing the wines through smell and taste. During the analysis, the judges smelled and tasted the samples, and the perceived descriptors were indicated in a descriptive tasting card, which included several descriptors for aroma, taste, and global quality of the wine. The scorecard for white wine included visual aspects (color intensity, yellow tone, green tone, clarity); aroma descriptors/nose (intensity, lingering, floral, fresh fruit, stone fruit, pome fruit, ripe fruit, honey, dried fruit, tropical fruit, citrus, herbaceous, dried herb, terpenic, others); taste attributes (alcohol, sweetness, acidity, bitter, smoothness, harmony, structure, and overall mouthfeel quality). In addition, the overall quality, understood as the general quality that encompasses all sensory aspects of the wine, as a whole, was scored. The tasting card for red wine also included visual aspects (color intensity, layer and purple, garnet, cherry, and ruby tones); aroma descriptors/nose (intensity, floral, fruity, red fruit, black fruit, ripe fruit, lactic, herbaceous, dried herb, vegetal, others); taste attributes (alcohol, acidity, astringency, tannins, bitter, structure, lingering, balance, overall mouthfeel quality) and global quality. These descriptors, specifically chosen for Galician wines, were scored from 0 (absent) to 9 (most intense). The tasters, who did not know what type of wine they were tasting, also assigned them an order of preference.
2.4. Statistical Analysis
The sensorial results were processed with the Big Sensory Soft (BSS) software [19]. A sample was duplicated in the tastings to observe the deviation or quantification of the tasters’ error; samples with significant deviation were disregarded in the analyses according to the BSS software. Analysis of Variance (ANOVA) tests were also carried out to evaluate the significant differences between the different chemical parameters and sensory attributes. One-way and two-way permutational multivariate ANOVA (PERMANOVA) were performed to find the significant differences in sensory attributes for the different wines and factors DO, farming system, and year. In addition, using the mean values of chemical and sensory analyses, a principal component analysis (PCA) was performed to observe the grouping or dispersion of the wines from the different DOs and production systems. In addition, a canonical correlation analysis (CCA) and Pearson analysis were performed to observe the possible correspondence and correlation between chemical and sensory parameters. Finally, the values of wine preferences were weighted for each DO in each tasting session, applying a correction factor referred to the number of wines tasted (calculated as the quotient between the number of samples from each DO and the maximum number of samples) and a second correction factor referred to the number of tasters for each wine (calculated as the quotient between the number of tasters for each DO and the maximum number of tasters in the session).
3. Results and Discussion
The growth of natural wine requires more comprehensive methodologies and theoretical engagement to understand its market segment, consumers, and relationship with other sustainable certifications. This would enable researchers to provide practical advice to winemakers and marketers [20]. In this sense, consumer perspectives on farming systems that go beyond organic (such as biodynamic agriculture), show mostly positive attitudes with a high appreciation for the environmental and social aspects of market agriculture, valuing its balanced and integrated approach [21]. Wine quality (phenolic and aromatic profile, flavor intensity, and taste attributes) could be influenced by vintage and winemaking protocol and slightly by the growing zone factor [22]. In addition, the effect of viticultural practices influences the fungal community of the grapes, which, in turn, could influence some characteristics of the wines [23].
The heterogeneous climatic conditions in Galicia can also attribute differentiation to the wines. Thus, in the Rías Baixas DO, the climate is Atlantic, with mild temperatures and abundant rainfall (1300 mm on average) throughout the year. The other DOs are characterized by a transitional climate. The Ribeiro DO presents a certain Mediterranean character but is softened by the Atlantic influence. The average annual rainfall is 950 mm, and temperatures are temperate, with significant thermal oscillations between day and night. In the Ribeira Sacra DO, the Atlantic influence is conducive to moderate temperatures and relative humidity during the grape ripening period, which is also characterized by steep slopes that can exceed 40%. The Monterrei DO has a temperate Mediterranean climate with a continental tendency, with hot, dry summers and cold winters. Finally, the Valdeorras DO is characterized by cold winters, warm summers, and mild autumns and springs. The average temperature is 11 °C with rainfall between 850 and 1000 mm per year [24].
3.1. Chemical Characteristics of Wines
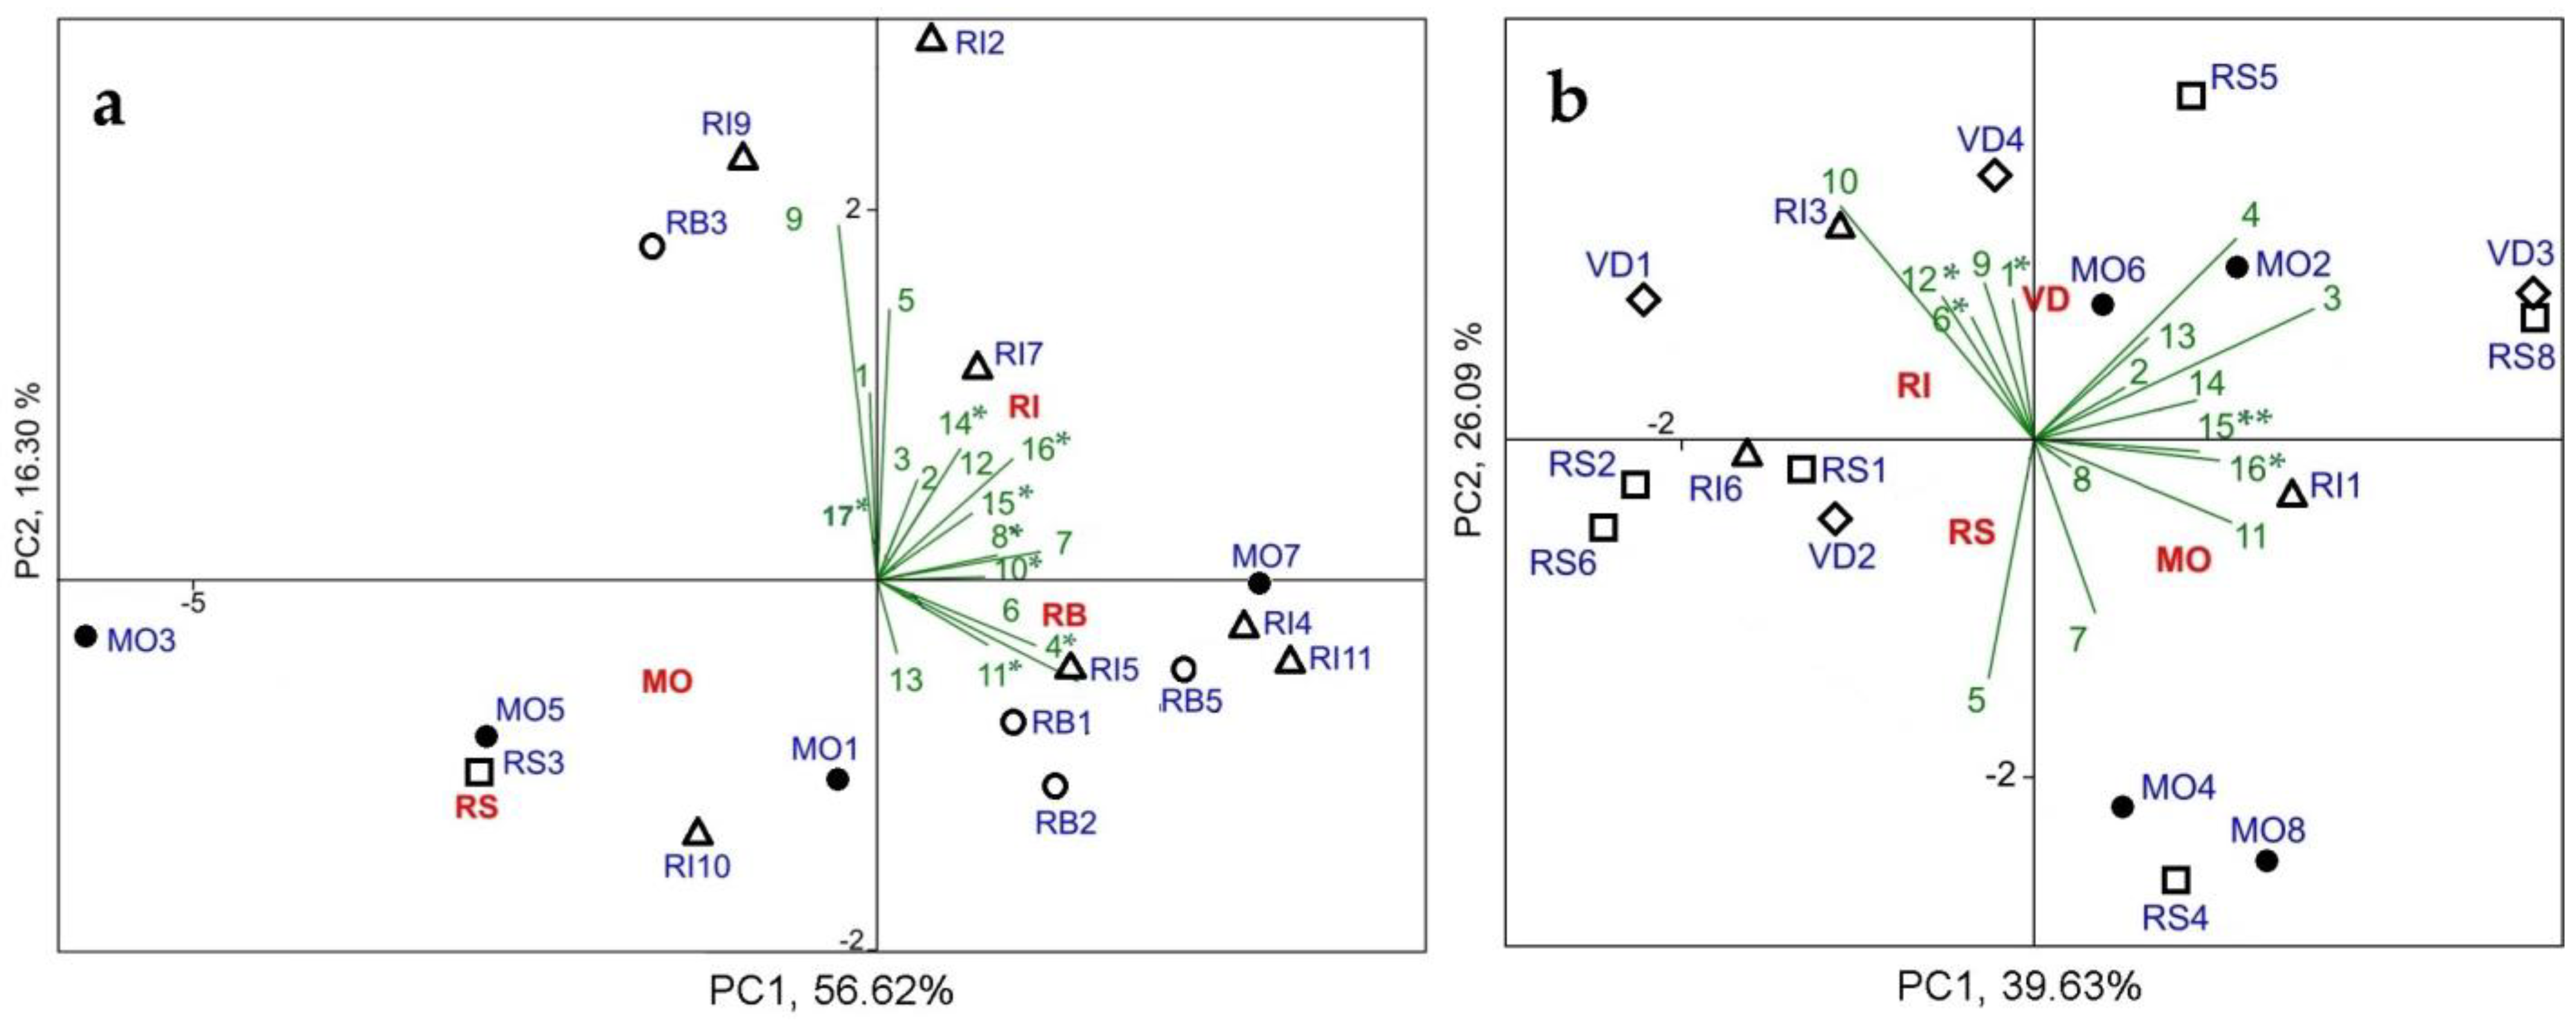
The chemical composition of the wines tasted in this study is summarized in Table 2, Table 3 and Table 4. PCA analyses of these parameters showed a clear separation between white and red wines, as expected (Figure 1). However, the separation or grouping by DO of the samples did not show a total differentiation of the wines analyzed by region. These results would indicate that other parameters, such as aromas by the microbiology present in fermentation or winemaking techniques, farming system, year, etc., should be considered to evaluate this distinction between wines as reported by other authors [25,26,27]. Furthermore, the higher clustering of the samples in the PCA indicates a greater homogeneity of the white wines compared to the red ones in terms of chemical composition. Across the different vintages, the white wines were characterized by a higher concentration of SO2, acidity, and free sugars. The red wines were distributed in the biplot zones of glycerol, pH, and volatile acidity.
White wines from Ribeira Sacra and Rías Baixas in 2014 tasting were characterized by higher concentrations of glycerol, malic acid, and total acidity, while Ribeiro wines showed higher concentrations of reducing sugars, volatile acidity, and alcohol. Most of the above have been proposed as key parameters in biological deacidification strategies for volatile and non-volatile components of white wines [28]. However, it should be noted that a major variety in Rias Baixas, such as Albariño, has acidity as an appreciated varietal characteristic [29]. The red wines from Valdeorras were characterized by higher concentrations of volatile acidity and lactic acid, while those from Monterrei presented higher concentrations of reducing sugars. However, chemical parameters, such as high sugar, acid, or glycerol content, are characteristic indicators of botrytized grapes, which produce a particular aromatic composition [30]. Regarding the chemical composition, the RB6 and RI9 (white samples) and RI8 and VD4 (red samples) were the most dissimilar within each DO. RI 9 is a 2011 biodynamic wine among the favorites, but RB6 in 2012 conventional wine scored lower. RI8 was the least preferred conventional wine, and VD4 was organic with medium preference scores, both from 2013. This would reiterate that some wines maintain a distinctive character of their own, affected by multiple factors. On the other hand, the Ribeiro wines occupied a large area of the PCA, reflecting the greatest differences at the chemical level between them.
The chemical parameters that showed the most variation within their range in the wine tasting of 2014 were (Table 2): volatile acidity and SO2 concentration, while the most stable were pH, dry extract, and alcohol content (the latter except in the Monterrei DO).
Regarding the white wines of 2016 (Table 3), RB1 stood out because it had lower alcoholic degree (as RB5) and higher values of reducing sugars and lactic acid (this latter together with RI9); RI4 and RB3 had the lowest SO2 concentration (around 53 mg/L), unlike RI7, which quadrupled these values (reaching the highest total sulfur concentration = 218 mg/L). It should be noted that, according to ORWINE project (organic viticulture and winemaking: development of environment and consumer-friendly technologies for organic wine quality improvement and scientifically based legislative framework), the amounts of sulfur dioxide depend on the different categories of wines and intrinsic characteristics such as sugar content, which must be taken into account in organic wines [31]. As for the 2016 red wines (Table 3), the following wines stood out: MO4 had lower values of tartaric acid, absorbance, and color intensity (higher clarity) and showed higher values of total sulfur, malic acid and chromatic coordinate a; MO8 had lower pH, glycerol, and anthocyanins (6 times lower anthocyanin concentration than MO8); RI1 for its higher acidity (total, volatile and lactic) and lower alcohol content; RI3 for its higher glycerol concentration; VD1 for its lower clarity and color coordinates; RS6 for its lower tannin concentration, total polyphenol content and volatile acidity; and RS8 for its higher concentration of reducing sugars, alcohol, total polyphenol content, and color intensity. It should be mentioned that the red wines had low SO2 concentrations, even below the maximum allowed for organic wines, comprising values below 55 mg/L (except MO4 = 150 mg/L). As in 2014, PCA shows that there were wines in 2016 that differed from each other and between groups. In addition, barrel-aged wines were chemically similar to others of different vintage, DO, and/or farming system. This supports the idea of multifactorial influence.
Regarding colorimetric parameters (Table 4), ANOVA showed no significant differences at p < 0.05; the largest differences were found in anthocyanins (p = 0.1). Phenolic compounds such as anthocyanins, which confer health-promoting properties, play a crucial role in attributes such as color and mouthfeel [32]. PERMANOVA analysis also showed differences at p = 0.1 in wines between groups by DO and also in Ribeiro wines between pairwise RI-VD (p = 0.08) and RI-RS (p = 0.07) (Table 4). The highest values of color parameters, including the beneficial polyphenols and anthocyanins, were found in the Valdeorras DO and also in some Ribeira Sacra wines, such as RS5 and RS8 and RI3 from Ribeiro.
3.2. Sensory Analysis of Wines
3.2.1. Rías Baixas DO
Rías Baixas DOs is one of the main DOs in Galicia (by vineyard area, production, and value), and its wines, such as Albariño, are recognized worldwide. All wines tasted from DO Rías Baixas were Albariño: They had similar aromatic intensity and overall quality; however, significant differences in various descriptors of the olfactory and/or taste phase (Figure 2) were found. In addition, the wines showed significant differences in color intensity and floral, but not in aromatic intensity or overall quality (in the 2014 tasting). Thus, the organic wines of the 2014 tasting stood out for having greater lingering in the mouth (as RB1) and notes of dried fruit (RB3). Conversely, the conventional wines RB4 and RB5 obtained higher scores for the floral and fresh fruit descriptors (in the 2014 tasting) and ripe fruit (in the 2016 tasting).
3.2.2. Ribeiro DO
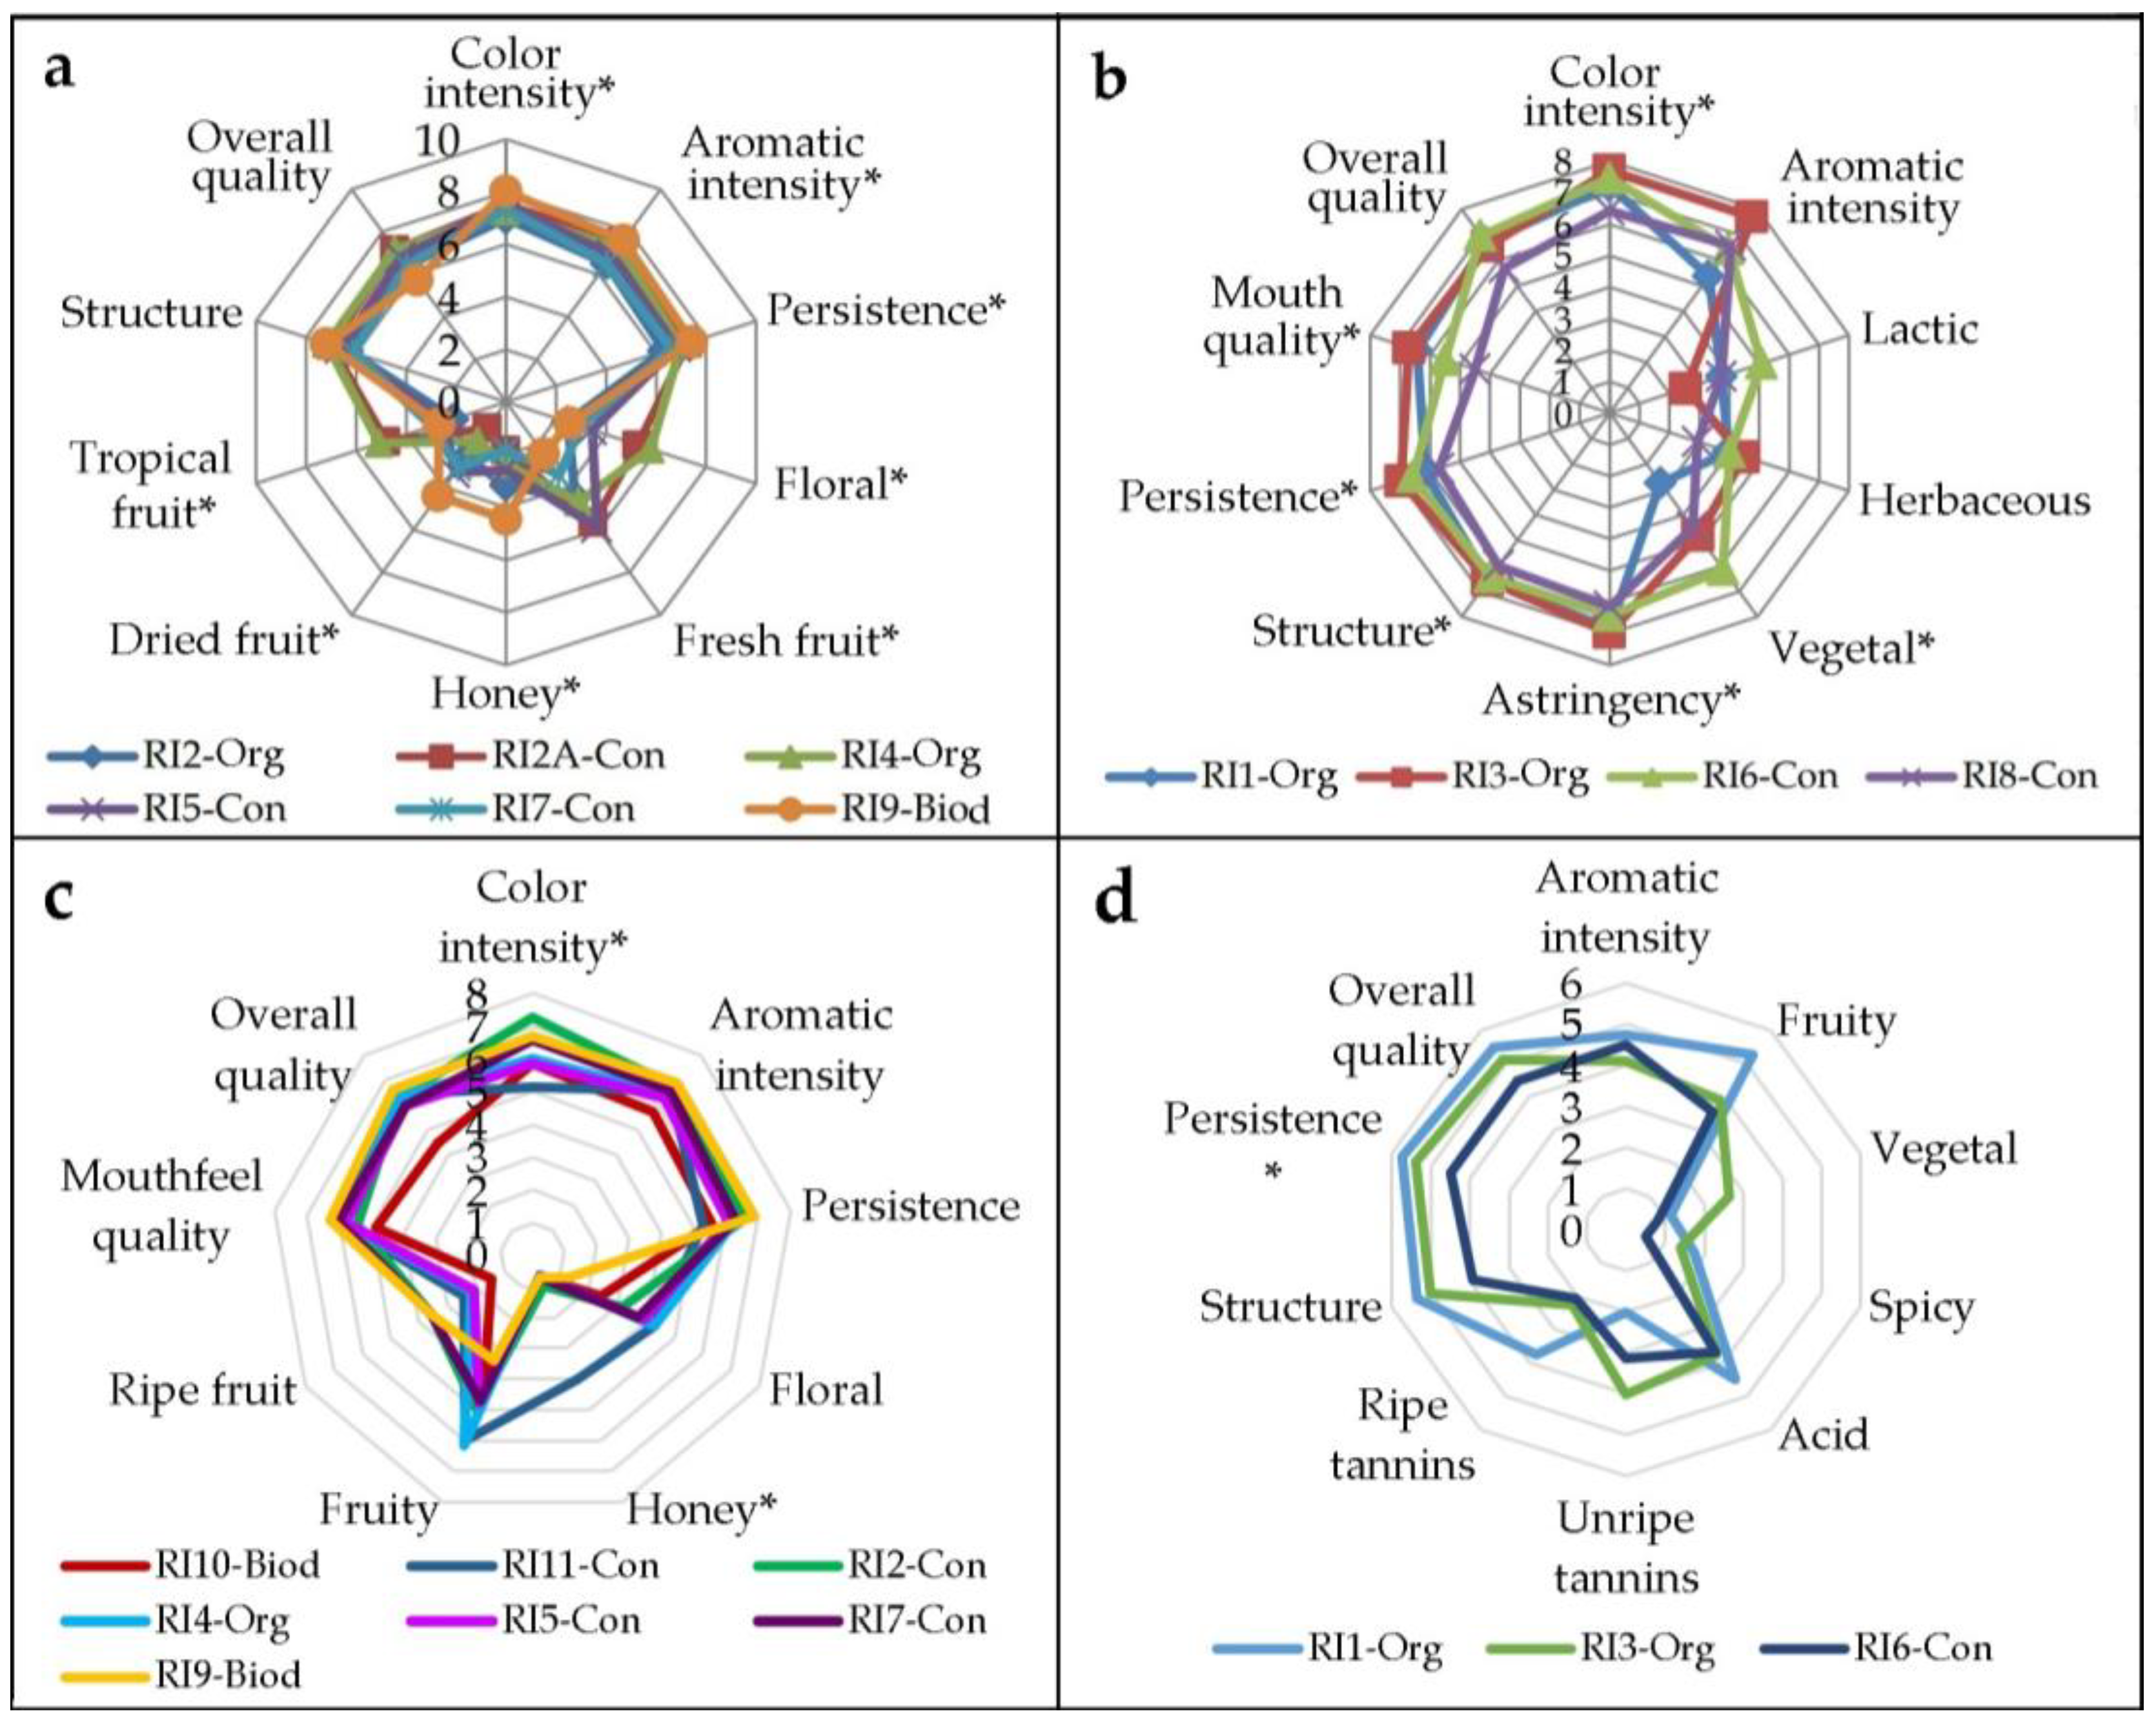
Ribeiro DO is the oldest of the Galician DOs and one of the historic DOs in Europe. The Ribeiro DO wines were highly valued, although the white wines were generally more appreciated than the red ones in the tasting. Overall, significant differences were found in the intensity of color and aromatic intensity between them, as well as in some descriptors both on the nose and in the mouth (Figure 3). In the 2014 tastings, the best-rated white wine was the organic RI4 (39% as the percentage of tasters’ preference score in each category: type of white or red wine for that DO), which stood out for its floral and tropical fruit notes, and RI9 (25%), also an organic (biodynamic) wine, which was highlighted for having more structure and lingering in the mouth and greater aromatic intensity with hints of honey and dried fruit. The families of these types of aromas are especially valued in quality white wines of the Iberian Peninsula [29,33,34,35], even in wine styles made with ancient winemaking techniques [36]. In the 2016 tastings, the conventional wines stood out, RI2 for its color intensity and R11 for its fruity aroma (as well as RI4 organic wine). The sensory analysis of the red wines from DO Ribeiro in the 2014 tastings showed differences in the visual phase, nose, and mouth but not in the overall quality of the wines. The best-rated conventional red wine was RI6, with lactic and vegetal aromas and notes of red fruits. However, in the 2016 tastings, RI6 did not achieve good scores on any of the parameters. In addition, the organic wines RI1 and RI3 showed better quality in the mouth and greater lingering, as well as greater aromatic intensity (RI3) and less vegetal character (RI1).
3.2.3. Ribeira Sacra DO
The Ribeira Sacra DO mainly produces red wines (in 2016 only one white wine was analyzed). The tasting of the Ribeira Sacra DO wines also showed statistically significant differences, especially in the mouth, but also overall and for some aroma descriptors (Figure 4). One of the organic wines, RS4, achieved the highest score in almost all the descriptors in the 2014 tastings, highlighting the notes of black fruits and being well structured in the mouth, but it was not the preferred wine. Another organic wine, RS1, obtained a better score and was noted for fruity character and aromatic intensity. However, the conventional wine RS6, which only stood out for its overall quality in the mouth, was preferred by the tasters. As for the 2016 tasting, the RS4 organic wine stood out for its ripe fruit and ripe tannins, while the RS8 conventional wine was the preferred wine for its higher scores in the desirable attributes of fruit, lingering, mouthfeel, and overall quality. Vilanova et al. [37] showed that the composition of Mencía (the majority variety in red wines) in the Ribeira Sacra was more affected by vintage than by geographical area, which could influence sensory perception.
Among the white wines evaluated from the Ribeira Sacra DO, significant differences were observed in the 2014 tasting in the overall quality in the mouth, lingering, and some fruity notes (Figure 4c). The conventional wine RS5 obtained the highest score in the taste phase descriptors and also in aromatic intensity, lingering, and ripe fruit notes. The other conventional wine, RS8, presented notes of fresh fruit, while the organic wine, RS3, only stood out in the nose for notes of dried fruit. In terms of taster preference, RS8 obtained 37%, followed by the organic wine (35%) (Figure 4d).
3.2.4. Monterrei DO
The sensory profile of the Monterrei DO white wines was different from each other, although the tasters did not show a clear preference for one of them except for the conventional MO7 white wine from the 2016 tastings (Figure 5). In Monterrei, there is only one certified organic winery. The organic wine stood out for presenting notes of ripe fruit, honey, and dried fruit on the nose and being sweet on the palate; in contrast, the conventional wine was rated with notes of fresh fruit and acidity on the palate. With the red wines, no notable differences were observed in the mouth, but the organic wine showed greater aromatic intensity and stood out over the conventional wine for notes of black fruits and ripe fruit; in contrast, the conventional wine presented notes of red fruits.
3.2.5. Valdeorras DO
As in the Monterrei DO, there is only one certified organic producer who produces mainly red wines. Therefore, only red wines were evaluated, with the organic wine standing out for its red fruit notes, while the conventional wine stood out for its black fruit notes and obtained the best score in overall quality (Figure 5). Red wines with high polyphenol values, such as VD3 (or RS8), obtained high mouthfeel values as already proposed [32]. Tasters preferred organic wines in the 2014 tastings and conventional wines in the 2016 tastings.
3.2.6. Regional Differentiation of Wines According to Sensory Attributes
According to the BSS descriptive tests, the descriptors that contributed most to the characterization of the samples were (in order of highest to lowest weight): aromatic intensity, fresh fruit, overall mouthfeel, structure, and lingering.
It is worth mentioning that, in general, less significant differences were found in the sensory attributes of the 2016 tastings compared to those of 2014. Moreover, flavor attributes, including alcohol, were much more homogeneous than aromatic-olfactory attributes.
To observe a clearer differentiation or grouping of the different DO wines, another PCA was made with the main sensory attributes within each type of wine (white or red) (Figure 6).
Comparing the total sum of the explained variance on the horizontal and vertical axes of the PCA from the chemical analysis (Figure 1) and sensory analysis (Figure 6), the percentage is similar in both (around 60%), suggesting the regional differentiation of the wines tasted in 2014 in terms of sensory perception of aromas and taste was similar than with chemical compounds. In addition, sensory perception was more pronounced in white wines, especially between the Ribeiro-Monterrei and Rías Baixas-Ribeira Sacra DOs, as well as Ribeira Sacra-Valdeorras (in the case of red wines). It is worth noting that most sensory descriptors in the biplot were clustered around the Ribeiro and Monterrei DOs both in white and red wines. Ribeiro wines showed a wider range of aromatic descriptors highlighting aromatic intensity, fruity aromas, lingering, smoothness, harmony-structure, and sweetness. White wines from Ribeira Sacra and Rías Baixas were characterized by fresh fruit and floral aromas, greenish reflection, cleanliness, and a more acidic and bitter taste. The red wines from Valdeorras and Ribeira Sacra were characterized by herbaceous and garnet-ruby hue, while those from Monterrei presented higher lingering and overall quality. On the other hand, the wines RI4 and RI9, and RS3 and RS8 (white wines) and RI6, RI8 and RS1, RS7 (red wines) were the furthest from each other in each DO. Moreover, the larger space occupied in the PCA by samples from the Ribeiro DO (and Ribeira Sacra DO in red wines) showed the greatest differentiation of wines within the same DO with important sensory variations between them. The red wines from Valdeorras and Monterrei were more homogeneous. In addition, PCAs showed a distinctive pattern between MO-RI and RB-RS DOs in white wines (Figure 6a). This is consistent with what was found in the biogeographic patterns [38,39] and could explain the high impact of fermentations carried out with indigenous yeasts. In addition, the RS white wines and VD red wines showed greater similarity or homogeneity among themselves (smaller area or separation by sample number in the PCA) (Figure 6). Some of these sensory variations could be related to different crop and canopy management practices, including cluster or leaf thinning, which alter the size of the crop and berries and, consequently, the chemical and sensory composition of the musts and resulting wines [40].
However, in the sensory analysis of the 2016 tastings, no clear regional distribution was found. The PCA also showed that in the white wines, the Ribeiro wines were the most different (greater surface area occupied by the number of samples), while in the red wines, it was the Ribeira Sacra wines (Figure 7).
In addition, significant differences at p < 0.1 were found in the ANOVA test for some sensory attributes in the wines analyzed. In the white wines from the 2014 tastings were: tropical fruit (p = 0.002), alcohol (p = 0.009), dry fruit (p = 0.011), yellow reflection (p = 0.023), sweet (p = 0.030), and aromatic intensity (p = 0.100); in the white wines from the 2016 tastings were: floral, honey and overall mouthfeel (p = 0.001), fruity (p = 0.018), ripe fruit/compote (p = 0.053), stone fruit (p = 0.057), structure (p = 0.078), and citrus (p = 0.080); and color intensity (p2014 = 0.067; p2016 = 0.005) and overall wine quality (p2014 = 0.063; p2016 = 0.001) showed significant differences in both tastings. The sensory parameters that most characterized the differentiation of red wines from the 2014 tastings were: overall mouthfeel (p = 0.001), balance (p = 0.002), floral (p = 0.008), ripe fruit/compote (p = 0.012), layer (p = 0.015), cherry tone (p = 0.024), structure (p = 0.037), and fruity (p = 0.060); in the red wines from the 2016 tastings were: fruity and vegetal (p = 0.008), red fruits (p = 0.012), lingering (p = 0.015), spicy (p = 0.029), and green tannins (p = 0.047); and red fruits (p2014 = 0.013; p2016 = 0.012) and overall wine quality (p2014 = p2016 = 0.001) showed significant differences in both tastings. However, these differences varied when the data were grouped by Dos (Figure 6 and Figure 7). These data confirm that differentiation in wine quality is key and is due to many different factors such as region, year, winemaking techniques, microbiology, production system, grapevine, etc.
Analyzing the whole data set, one-way and two-way PERMANOVA analysis of sensory attributes showed significant differences (p < 0.05) in all samples analyzed for both the wine factor (pwine) and the DO factor (pDO), except for red wine samples tasted in 2016 (pwine = 0.509; pDO = 0.310). For white wines tasted in 2014 (pwine = 0.030; pDO < 0.001) significant differences were found between pairwise RB-RI and RS-RI (p = 0.001), RS-MO (p = 0.027), RB-RS (p = 0.030), and VD-RI (p = 0.034) while for those tasted in 2016 (pwine = 0.002; pDO = 0.001), they were found in pairwise RB-RI (0.002) and RB-MO (0.006). For red wines tasted in 2014 (pwine = 0.003; pDO = 0.011) significant differences were found between pairwise RS-VD (p = 0.040) and RS-RI (p = 0.019). Therefore, the Dos with the most different wines were Ribeiro and Ribeira Sacra.
3.3. Chemical and Sensory Analysis Correspondence and Correlation
Figure S1 shows the influence or correspondence between different factors, such as chemical parameters or geographical distribution, on the sensory descriptors at the visual, olfactory, taste, and general quality levels. Some descriptors such as dried fruit aroma, tropical fruit, or bitter taste (in white wines) and herbaceous, lingering, smoothness, or harmony (in red wines) did not correspond to other parameters at the global level but rather to specific wines. In terms of DOs, Ribeiro white wines and Monterrei and Riberia Sacra red wines showed a wide correspondence between chemical and aromatic compounds. This reinforces the idea of the individuality and uniqueness of each wine, regardless of groups or classifications such as year, cultivation system, DO, and even winery; and a unique typicity that encapsulates the expression of multiple inputs in each wine increases its value [41].
According to the CCA and Pearson analysis (Table 5), the factors that most influence wine differentiation, quality, and preferences were (raverage > 0.7): structure, harmony-balance, lingering, and fruit aromas. According to Pearson, what most penalized the quality of wines were malic acid (in white wines) and green tannins, reduction, fouling, and vegetal aromas (especially in red wines) (data not shown). Moreover, it should be noted that the non-volatile matrix of wine has a powerful effect on aroma perception [42].
3.4. The Different Vintages and Farming System: Preferences and Particularities
In general, differences were observed when evaluating the different vintages. Among the 2012 white wines, the organic wines were those that showed greater lingering compared to the conventional wines, which stood out for their floral and fresh fruit aromas. However, in 2013, these descriptors were reversed, with floral and fresh fruit aromas being higher in organic wines and lower in lingering and citrus aromas. Moreover, in 2013, the organic red wines stood out, especially for their aromatic intensity and red fruit, while the conventional wines showed greater astringency and tannins.
Typically, wines that are derived from grapes that are more mature and/or have a higher sugar content tend to exhibit greater levels of aromatic intensity, complexity, and berry aroma [43,44]. The wines that had a more intense perception of astringency are probably associated with the less ripe grapes and the resulting higher amount of seed proanthocyanidins [45], and even by the higher perception of acidity in the wines [46].
The 2014 campaign (most wines tasted in 2016) was climatologically unfavorable with abundant rainfall (some of them in critical stages of the vine cycle and/or just before harvest) and did not show as good results in organic wines as in previous years. The sensory attributes of Ribeira Sacra wines under heroic viticultural zone conditions, especially in organic production due to the lower use of phytosanitary products, could be influenced by phytopathogens [47]. In this campaign, fungal attacks caused significant losses not only due to decreases in production but also in quality due to the sanitary state of the grapes, even with the application of repeated phytosanitary treatments. In the sensory evaluation of these wines, tasters showed, in general, a greater preference for conventional wines than for organically produced wines, especially white wines (Figure 8). The 2016 campaign, similar to 2014, also presented a large decrease in yields, especially in organic production in Galicia.
The cultivation system did not show significant differences in the overall quality of wines in all cases, probably due to the greater influence of the other factors. Picchi et al. [7] found significant differences between organic (biodynamic) and conventional wine samples. Although the overall perceived quality and typicity of the Sangiovese wines studied were not affected, the biodynamic wineries used fewer resources in the vinification process.
The scores of the tasters’ preferences for the wines (unweighted) are shown in Figure 8. However, by applying weighting, some wines slightly improved their weighted score percentage. In the 2014 tastings, conventional wines were slightly preferred by tasters (55% in white wines and 61% in red wines). The most valued white wines tasted in 2014 were RI4 (an organic wine with 21% of all white wines), RB4 and RB5 (both 12%), and RB6 (both 10%), while the red wines were the most valued RI6 (23% of all red wines), RS6 (17%), RS1 (11%), and RI3 (9%). Likewise, in the 2016 tastings, the white wines preferred by tasters were also conventional (69% in weighted scores), being the most valued MO7 (14% of all white wines tasted in 2016), RI2 and RI11 (both 11%), and RB2 (9%), while in the red wines had a similar weight in importance organic and conventional (equal to 50% without weighting compared to 41% for organic wines when the weighted score was applied), being the most valued RS8 (12% of all red wines tasted in 2016), VD3 and RS4 (both 11%), and RI1 (8%). Taking into account preferences for all wines, tasters preferred conventional wines over organic wines (58% and 63% with weighted scores in the 2014 and 2016 tastings, respectively).
Two-way PERMANOVA performed on the data set showed significant differences between organic and conventional commercial wines (Table 6). Laureati et al. (2014) [48] also identified pronounced differences between organic and conventional red wines: higher concentration of phenolic compounds and astringent sensation in organic wines; in contrast, the conventional wine had a more pronounced bitterness. Some studies [49,50] found similar differences in a large consumer study that did not influence taste, as organic and conventional wines were hedonically comparable. The results suggest that producing and marketing sustainable wine as local and organic is a promising quality differentiation strategy.
According to the PERMANOVA analyses (Table 6), significant differences were found in all cases, both between growing systems and vintages, except for the red wines tasted in 2014. The white wines tasted in 2016 also showed no significant differences since most of the wines were from the same vintage.
However, when the data were enough to group by DO and year, significant differences were only found in 2015 overall red wines: (p = 0.033), with Ribeira Sacra being the DO that showed the most significant differences (p2015 = 0.087; p2013 = 0.116). Similarly, significant differences were only found between organic and conventional overall white wines in 2014 (p = 0.003), with Monterrei being the DO that showed the most significant differences (p2014 = 0.001) followed by Rías Baixas (p2014 = 0.143).
Furthermore, taking into consideration that the percentage of organic and conventional samples was almost equal, in some cases, the farming system factor was as strong or stronger than the year factor.
Considering that organic wine production does not require significantly different processes from conventional ones, a greater influence could be attributed to the cultivation system factor than to the winemaking techniques. However, the fact that no significant differences were found between cultivation systems suggests that the winery’s techniques and yeasts also play a role [38,39,51]. In addition, in the graphical analyses, no separation of samples by DO, year, or farming system was found. This indicates that the DO, year, and cultivation system factors are weak in the total count and confirms that many other factors influence the differentiation and quality of Galician wines. Soil management in humid areas is another factor related to the farming system, which has been shown to influence the sensory attributes of Galician wines [52]. Varietal aromatic profiling could be expected to be another influential factor in the aromas of Galician wines [53].
3.5. Current and Future Considerations
Organic grape production requires special care and the application of knowledge based on the plant–soil–climate balance on which it is based [10]. In Galician wineries, careful monitoring of the fermentation process is usually applied using the must’s own indigenous yeasts [53]. Under these conditions, obtaining a differentiated quality product involves the application of traditional knowledge in symbiosis with current oenological advances. In climatologically unfavorable years, producing good organic wine in Galicia is a significant challenge for producers. However, the credibility of organic wine depends on ensuring that the bottles contain not only a label but also the quality with which it is associated.
4. Conclusions
Sensory analysis showed significative differences between organic and conventional wines, DOs, and years; therefore, organic cultivation can favor the diversification of Galician wines, but results were limited and do not prove conclusively that organic cultivation favors the differentiation of the wines. In addition, the organic wines obtained similar scores to those of conventional production in the preference tests and, in some cases, were preferred by the tasters but they are conditioned by the climatic conditions of each year. However, differentiation by DO, vintages, and the farming system did not show clear separation in each of the factors in the graphical analyses, indicating the influence and interaction of multiple other factors in the chemical and sensory composition of Galician wines.
Supplementary Materials
The following supporting information can be downloaded at: https://www.mdpi.com/article/10.3390/beverages9040089/s1, Figure S1: CCA of principal chemical components and sensory attributes.
Author Contributions
P.B. and D.C. conceived and designed the study; Both contribute equally to methodology, formal analysis of the data; writing—original draft preparation, D.C.; writing—review and editing, D.C. and P.B.; supervision, D.C. and P.B.; project administration and funding acquisition, P.B. All authors have read and agreed to the published version of the manuscript.
Funding
This research was funded by Instituto Nacional de Tecnología Agraria y Alimentaria (INIA) grant number RTA2012–00021-C03–01 and cofinanced with FEDER funds (European Regional Development Fund).
Data Availability Statement
Not applicable.
Acknowledgments
David Castrillo thanks INIA and the European Social Fund for his FPI predoctoral contract. We thank the Galician wineries that gave us their wines for this study.
Conflicts of Interest
The authors declare no conflict of interest.
References
- King, E.S.; Kievit, R.L.; Curtin, C.; Swiegers, J.H.; Pretorius, I.S.; Bastian, S.E.P.; Leigh Francis, I. The effect of multiple yeasts co-inoculations on Sauvignon Blanc wine aroma composition, sensory properties and consumer preference. Food Chem. 2010, 122, 618–626. [Google Scholar] [CrossRef]
- van Leeuwen, C. 9—Terroir: The effect of the physical environment on vine growth, grape ripening, and wine sensory attributes. In Woodhead Publishing Series in Food Science, Technology and Nutrition, 2nd, ed.; Reynolds, A.G.B.T.-M.W.Q., Ed.; Woodhead Publishing: Oxford, UK, 2022; pp. 341–393. ISBN 978-0-08-102067-8. [Google Scholar] [CrossRef]
- Belda, I.; Zarraonaindia, I.; Perisin, M.; Palacios, A.; Acedo, A. From vineyard soil to wine fermentation: Microbiome approximations to explain the “terroir” Concept. Front. Microbiol. 2017, 8, 821. [Google Scholar] [CrossRef]
- Roullier-Gall, C.; Boutegrabet, L.; Gougeon, R.D.; Schmitt-Kopplin, P. A grape and wine chemodiversity comparison of different appellations in Burgundy: Vintage vs terroir effects. Food Chem. 2014, 152, 100–107. [Google Scholar] [CrossRef]
- Patrignani, F.; Montanari, C.; Serrazanetti, D.I.; Braschi, G.; Vernocchi, P.; Tabanelli, G.; Parpinello, G.P.; Versari, A.; Gardini, F.; Lanciotti, R. Characterisation of yeast microbiota, chemical and sensory properties of organic and biodynamic Sangiovese red wines. Ann. Microbiol. 2017, 67, 99–109. [Google Scholar] [CrossRef]
- Raineau, Y.; Giraud-Héraud, É.; Lecocq, S.; Pérès, S.; Pons, A.; Tempère, S. When health-related claims impact environmental demand: Results of experimental auctions with Bordeaux wine consumers. Ecol. Econ. 2023, 204, 107663. [Google Scholar] [CrossRef]
- Apaolaza, V.; Hartmann, P.; Echebarria, C.; Barrutia, J.M. Organic label’s halo effect on sensory and hedonic experience of wine: A pilot study. J. Sens. Stud. 2017, 32, e12243. [Google Scholar] [CrossRef]
- Castellini, A.; Mauracher, C.; Troiano, S. An overview of the biodynamic wine sector. Int. J. Wine Res. 2017, 9, 1–11. [Google Scholar] [CrossRef]
- CRAEGA Estadísticas. Memoria anual de actividades do ano 2022 do Consello Regulador da Agricultura Ecolóxica de Galicia 2022.Memoria 2022 (craega.es). Available online: https://www.craega.es/wp-content/uploads/2023/05/Memoria-2022.pdf (accessed on 18 September 2023).
- REU 2018/848 Regulation (EU) 2018/848 of the European Parliament and of the Council of 30 May 2018 on Organic Production and Labelling of Organic Products and Repealing Council Regulation (EC) No 834/2007. Available online: https://eur-lex.europa.eu/eli/reg/2018/848/oj (accessed on 18 September 2023).
- European Commission EU 2021/1165. Commission Implementing Regulation (EU) 2021/1165 of 15 July 2021 Authorising Certain Products and Substances for Use in Organic Production and Establishing Their Lists.C/2021/5149. Off. J. Eur. Union 2021, 253, 13–48. [Google Scholar]
- La Comisión Europea Reglamento Delegado (Ue) 2019/934 de la Comisiónde 12 de Marzo de 2019; 2019. Available online: http://data.europa.eu/eli/reg_del/2019/934/oj (accessed on 18 September 2023).
- Blanco, P.; Castrillo, D.; Graña, M.J.; Lorenzo, M.J.; Soto, E. Evaluation of autochthonous non-saccharomyces yeasts by sequential fermentation for wine differentiation in galicia (Nw spain). Fermentation 2021, 7, 183. [Google Scholar] [CrossRef]
- Sáenz-Navajas, M.-P.; Sánchez, C.; Gonzalez-Hernandez, M.; Bueno, M.; Peña, C.; Fernández-Zurbano, P.; Ballester, J.; Parga-Dans, E.; González, P.A. Natural versus conventional production of Spanish white wines: An exploratory study. J. Sci. Food Agric. 2023, 103, 3540–3549. [Google Scholar] [CrossRef]
- Perpetuini, G.; Rossetti, A.P.; Battistelli, N.; Zulli, C.; Cichelli, A.; Arfelli, G.; Tofalo, R. Impact of vineyard management on grape fungal community and Montepulciano d’Abruzzo wine quality. Food Res. Int. 2022, 158, 111577. [Google Scholar] [CrossRef]
- Maioli, F.; Picchi, M.; Millarini, V.; Domizio, P.; Scozzafava, G.; Zanoni, B.; Canuti, V. A Methodological Approach to Assess the Effect of Organic, Biodynamic, and Conventional Production Processes on the Intrinsic and Perceived Quality of a Typical Wine: The Case Study of Chianti DOCG. Foods 2021, 10, 1894. [Google Scholar] [CrossRef]
- Ugaglia, A.A.; Niklas, B.; Rinke, W.; Moscovici, D.; Gow, J.; Valenzuela, L.; Mihailescu, R. Consumer preferences for certified wines in France: A comparison of sustainable labels. Wine Econ. Policy 2021, 10, 75–86. [Google Scholar]
- OIV Office International de la Vigne et du Vin Compendium of International Methods of Wine and Must Analysis. 2014, Vol. 1 and 2. Available online: https://www.oiv.int/standards/compendium-of-international-methods-of-wine-and-must-analysis (accessed on 18 September 2023).
- Rodrigues, N.; Gonçalves, G.; Pereira-da-Silva, S.; Malfeito-Ferreira, M.; Loureiro, V. Development and use of a new medium to detect yeasts of the genera Dekkera/Brettanomyces. J. Appl. Microbiol. 2001, 90, 588–599. [Google Scholar] [CrossRef]
- Odello, L.; Ugolini, A.; Violoni, M. Analisi Sensoriale. I test descrittivi. L’Assaggio 2007, 14, 49–62. [Google Scholar]
- Alonso González, P.; Parga-Dans, E. Natural wine: Do consumers know what it is, and how natural it really is? J. Clean. Prod. 2020, 251, 119635. [Google Scholar] [CrossRef]
- Jaeger, S.R.; Harker, F.R.; Ares, G. Consumer insights about sustainable and ‘beyond organic’ agriculture: A study of biodynamics in the United Kingdom, Australia, Singapore, and Germany. J. Clean. Prod. 2023, 401, 136744. [Google Scholar] [CrossRef]
- Picchi, M.; Canuti, V.; Bertuccioli, M.; Zanoni, B. The Influence of Conventional and Biodynamic Winemaking Processes on the Quality of Sangiovese Wine. Int. J. Wine Res. 2020, 12, 1–16. [Google Scholar] [CrossRef]
- Rossetti, A.P.; Perpetuini, G.; Battistelli, N.; Zulli, C.; Arfelli, G.; Suzzi, G.; Cichelli, A.; Tofalo, R. Capturing the fungal community associated with conventional and organic Trebbiano Abruzzese grapes and its influence on wine characteristics. Food Biosci. 2023, 52, 102382. [Google Scholar] [CrossRef]
- Trigo-Córdoba, E.; Bouzas-Cid, Y.; Orriols-Fernández, I.; Mirás-Avalos, J.M. Irrigation effects on the sensory perception of wines from three white grapevine cultivars traditional from Galicia (Albariño, Godello and Treixadura). Cienc. Tec. Vitivinic. 2014, 29, 71–80. [Google Scholar] [CrossRef]
- Parpinello, G.P.; Rombolà, A.D.; Simoni, M.; Versari, A. Chemical and sensory characterisation of Sangiovese red wines: Comparison between biodynamic and organic management. Food Chem. 2015, 167, 145–152. [Google Scholar] [CrossRef]
- Tufariello, M.; Fragasso, M.; Pico, J.; Panighel, A.; Castellarin, S.D.; Flamini, R.; Grieco, F. Influence of Non-Saccharomyces on Wine Chemistry: A Focus on Aroma-Related Compounds. Molecules 2021, 26, 644. [Google Scholar] [CrossRef]
- van Leeuwen, C.; Barbe, J.-C.; Darriet, P.; Geffroy, O.; Gomès, E.; Guillaumie, S.; Helwi, P.; Laboyrie, J.; Lytra, G.; Le Menn, N.; et al. Recent advancements in understanding the terroir effect on aromas in grapes and wines: This article is published in cooperation with the XIIIth International Terroir Congress November 17-18 2020, Adelaide, Australia. Guest editors: Cassandra Collins and R. OENO One 2020, 54, 985–1006. [Google Scholar] [CrossRef]
- Gardoni, E.; Benito, S.; Scansani, S.; Brezina, S.; Fritsch, S.; Rauhut, D. Biological Deacidification Strategies for White Wines. S. Afr. J. Enol. Vitic. 2021, 42, 114–122. [Google Scholar] [CrossRef]
- Diéguez, S.C.; Lois, L.C.; Gómez, E.F.; de la Peña, M.L.G. Aromatic composition of the Vitis vinifera grape Albariño. LWT Food Sci. Technol. 2003, 36, 585–590. [Google Scholar] [CrossRef]
- Magyar, I. Chapter 6–Botrytized Wines. In Speciality Wines; Jackson, R.S., Ed.; Academic Press: Cambridge, MA, USA, 2011; Volume 63, pp. 147–206. ISBN 1043-4526. [Google Scholar] [CrossRef]
- ORWINE Project. Available online: https://cordis.europa.eu/docs/results/22/22769/123869711-6_en.pdf (accessed on 7 October 2023).
- Nemzer, B.; Kalita, D.; Yashin, A.Y.; Yashin, Y.I. Chemical Composition and Polyphenolic Compounds of Red Wines: Their Antioxidant Activities and Effects on Human Health—A Review. Beverages 2022, 8, 1. [Google Scholar] [CrossRef]
- Moreno-Olivares, J.D.; Giménez-Bañón, M.J.; Paladines-Quezada, D.F.; Gómez-Martínez, J.C.; Cebrián-Pérez, A.; Fernández-Fernández, J.I.; Bleda-Sánchez, J.A.; Gil-Muñoz, R. Aromatic Characterization of New White Wine Varieties Made from Monastrell Grapes Grown in South-Eastern Spain. Molecules 2020, 25, 3917. [Google Scholar] [CrossRef]
- Vilanova, M.; Genisheva, Z.; Masa, A.; Oliveira, J.M. Correlation between volatile composition and sensory properties in Spanish Albariño wines. Microchem. J. 2010, 95, 240–246. [Google Scholar] [CrossRef]
- Piras, S.; Brazão, J.; Ricardo-da-Silva, J.M.; Anjos, O.; Caldeira, I. Volatile and sensory characterization of white wines from three minority Portuguese grapevine varieties. Ciência Téc. Vitiv. 2020, 35, 49–62. [Google Scholar] [CrossRef]
- Harutyunyan, M.; Malfeito-Ferreira, M. Historical and Heritage Sustainability for the Revival of Ancient Wine-Making Techniques and Wine Styles. Beverages 2022, 8, 10. [Google Scholar] [CrossRef]
- Vilanova, M.; Rodríguez, I.; Canosa, P.; Otero, I.; Gamero, E.; Moreno, D.; Talaverano, I.; Valdés, E. Variability in chemical composition of Vitis vinifera cv Mencía from different geographic areas and vintages in Ribeira Sacra (NW Spain). Food Chem. 2015, 169, 187–196. [Google Scholar] [CrossRef]
- Castrillo, D.; Blanco, P. Influence of vintage, geographical location and agricultural management on yeast populations in Galician grape musts (NW Spain). OENO One 2022, 56, 65–79. [Google Scholar] [CrossRef]
- Castrillo, D.; Rabuñal, E.; Neira, N.; Blanco, P. Oenological potential of non-Saccharomyces yeasts to mitigate effects of climate change in winemaking: Impact on aroma and sensory profiles of Treixadura wines. FEMS Yeast Res. 2019, 19, foz065. [Google Scholar] [CrossRef]
- Bubola, M.; Rossi, S.; Váczy, K.Z.; Hegyi, Á.I.; Persic, M.; Zdunić, G.; Bestulić, E.; Orbanić, F.; Zsofi, Z.; Radeka, S. Modification of Cv. Merlot Berry Composition and Wine Sensory Characteristics by Different Leaf Area to Fruit Ratios TI2—Applied Sciences. Appl. Sci. 2023, 13, 5465. [Google Scholar] [CrossRef]
- Souza Gonzaga, L.; Capone, D.L.; Bastian, S.E.P.; Jeffery, D.W. Defining wine typicity: Sensory characterisation and consumer perspectives. Aust. J. Grape Wine Res. 2021, 27, 246–256. [Google Scholar] [CrossRef]
- Sáenz-Navajas, M.-P.; Campo, E.; Culleré, L.; Fernández-Zurbano, P.; Valentin, D.; Ferreira, V. Effects of the Nonvolatile Matrix on the Aroma Perception of Wine. J. Agric. Food Chem. 2010, 58, 5574–5585. [Google Scholar] [CrossRef]
- Sherman, E.; Greenwood, D.R.; Villas-Boâs, S.G.; Heymann, H.; Harbertson, J.F.; Antalick, G.; Šuklje, K.; Blackman, J.W.; Schmidtke, L.M.; Deloire, A. Impact of Grape Maturity and Ethanol Concentration on Sensory Properties of Washington State Merlot Wines. OENO One 2021, 55, 344–356. [Google Scholar] [CrossRef]
- Antalick, G.; Šuklje, K.; Blackman, J.W.; Schmidtke, L.M.; Deloire, A. Performing sequential harvests based on berry sugar accumulation (mg/berry) to obtain specific wine sensory profiles. OENO One 2021, 55, 131–146. [Google Scholar] [CrossRef]
- Allegro, G.; Pastore, C.; Valentini, G.; Filippetti, I. The Evolution of Phenolic Compounds in Vitis vinifera L. Red Berries during Ripening: Analysis and Role on Wine Sensory—A Review. Agronomy 2021, 11, 999. [Google Scholar] [CrossRef]
- Soares, S.; Brandão, E.; Guerreiro, C.; Soares, S.; Mateus, N.; de Freitas, V. Tannins in Food: Insights into the Molecular Perception of Astringency and Bitter Taste. Molecules 2020, 25, 2590. [Google Scholar] [CrossRef]
- Cortiñas, J.A.; Fernández-González, M.; Vázquez-Ruiz, R.A.; Aira, M.J.; Rodríguez-Rajo, F.J. The understanding of phytopathogens as a tool in the conservation of heroic viticulture areas. Aerobiologia 2022, 38, 177–193. [Google Scholar] [CrossRef]
- Laureati, M.; Gaeta, D.; Pagliarini, E. Qualitative and sensory evaluation of Sangiovese red wine obtained from organically and conventionally grown grapes. Ital. J. Food Sci. 2014, 26, 355–362. [Google Scholar]
- Pagliarini, E.; Laureati, M.; Gaeta, D. Sensory descriptors, hedonic perception and consumer’s attitudes to Sangiovese red wine deriving from organically and conventionally grown grapes. Front. Psychol. 2013, 4, 896. [Google Scholar] [CrossRef]
- Schäufele, I.; Hamm, U. Wine consumers’ reaction to prices, organic production and origins at the point of sale: An analysis of household panel data. Renew. Agric. Food Syst. 2018, 35, 261–273. [Google Scholar] [CrossRef]
- Castrillo, D.; Neira, N.; Blanco, P. Saccharomyces cerevisiae Strain Diversity Associated with Spontaneous Fermentations in Organic Wineries from Galicia (NW Spain). Fermentation 2020, 6, 89. [Google Scholar] [CrossRef]
- Bouzas-Cid, Y.; Trigo-Córdoba, E.; Orriols, I.; Falqué, E.; Mirás-Avalos, J. Influence of Soil Management on the Red Grapevine (Vitis vinifera L.) Mencía Must Amino Acid Composition and Wine Volatile and Sensory Profiles in a Humid Region. Beverages 2018, 4, 76. [Google Scholar] [CrossRef]
Figure 1.
PCA of the main parameters of chemical composition in white (w, green dots) and red (r, black dots) wines from different DOs (RI: Ribeiro, RS: Ribeira Sacra, MO: Monterrei, RB: Rías Baixas, VD: Valdeorras) tasted in 2014 (a) and in 2016 (b); (a): Ma, malic acid; FS, free SO2; TS, total SO2; A, alcoholic strength by volume (%vol); Ta, total acidity; G+F, reducing sugars (glucose and fructose); Taa, tartaric acid; G, glycerol; pH; Va, volatile acidity; La, lactic acid; Te, total dry extract; (b): 1, pH; 2, free SO2; 3, total SO2; 4, total acidity; 5, volatile acidity; 6, lactic acid; 7, malic acid; 8, tartaric acid; 9, reducing sugars; 10, total dry extract; 11, glycerol; 12, alcoholic strength by volume.

Figure 2.
Sensory profile of white wines of 2014 tasting (a) and 2016 tasting (b) from Rías Baixas DO (RB). * Indicates significant differences between wines (ANOVA at p < 0.05) for that descriptor. Con: Conventional; Org: Organic; Persistence: lingering.
Figure 2.
Sensory profile of white wines of 2014 tasting (a) and 2016 tasting (b) from Rías Baixas DO (RB). * Indicates significant differences between wines (ANOVA at p < 0.05) for that descriptor. Con: Conventional; Org: Organic; Persistence: lingering.

Figure 3.
Sensory profile of white (a,c) and red (b,d) wines from Ribeiro DO (RI) of 2014 (a,b) and 2016 tastings (c,d). * Indicates significant differences between wines (ANOVA at p < 0.05) for that descriptor. Org: Organic; Biod: Organic (biodynamic); Con: Conventional; Persistence: lingering.
Figure 3.
Sensory profile of white (a,c) and red (b,d) wines from Ribeiro DO (RI) of 2014 (a,b) and 2016 tastings (c,d). * Indicates significant differences between wines (ANOVA at p < 0.05) for that descriptor. Org: Organic; Biod: Organic (biodynamic); Con: Conventional; Persistence: lingering.

Figure 4.
Sensory profile of white (a) and red wines from Ribeira Sacra DO (RS) of 2014 (b) and 2016 tastings (c) and red wines from Valdeorras DO (VD) of the 2016 tastings (d). * Indicates significant differences between wines (ANOVA at p < 0.05) for that descriptor. Org: Organic; Con: Conventional; Persistence: lingering.

Figure 5.
Sensory profile of white wines from Monterrei DO (MO) in 2014 tastings (a) and 2016 tastings (together with RS3 wine from the Ribeira Sacra DO) (c). Sensory profile of red wines from Monterrei DO and Valdeorras DO (VD) in 2014 tastings (b) and from Monterrei DO in 2016 tastings (d). * Indicates significant differences between wines (ANOVA at p < 0.05) for that descriptor. Org: Organic; Con: Conventional; Persistence: lingering.

Figure 6.
PCA of sensorial analysis (aromatic and taste descriptors) of 2014 tastings in white wines (a): color intensity (1), greenish reflection (2), yellow reflection (3), cleanliness (4), aromatic intensity (5), floral (6), fresh fruit (7), white fruit (8), dried fruit (9), tropical fruit (10), citrus (11), herbaceous (12), terpenic (13), lingering (14), sweet (15), acid (16), bitter (17), smoothness (18), harmony (19), alcohol (20), structure (21), overall wine quality (22) and red wines (b): color intensity (1), wine layer (2), violet hue (3), garnet hue (4), cherry hue (5), ruby hue (6), intensity aromatic (7), floral (8), fruity (9), red fruits (10), black fruits (11), ripe fruit compote (12), lactic (13), herbaceous vegetable (14), alcohol (15), acidity (16), astringency (17), green tannins (18), ripe tannins (19), bitterness (20), structure (21), lingering (22), balance (23), overall quality in the mouth (24), overall quality of the wine (25). * Indicates significant differences between DOs (ANOVA at p < 0.05). ** Indicates significant differences (ANOVA at p < 0.1).

Figure 7.
PCA of sensorial analysis (aromatic and taste descriptors) of 2016 tastings in white wines (a): color intensity (1), aromatic intensity (2), lingering (3), floral (4), honey (5), fruity (6), stone fruit (7), pip fruit (8), ripe fruit compote (9), tropical fruit (10), citrus (11), alcohol (12), acid (13), structure (14), overall mouthfeel (15), overall wine quality (16), bitterness (17) and red wines (b): color intensity (1), aromatic intensity (2), fruity (3), red fruits (4), ripe fruit (5), vegetal-green (6), spicy (7), alcohol (8), astringency (9), green tannins (10), ripe tannins (11), bitterness (12), structure (13), lingering (14), overall mouthfeel (15), overall wine quality (16). * Indicates significant differences between Dos (ANOVA at p < 0.05). ** Indicates significant differences (ANOVA at p < 0.1).

Figure 8.
Taster preference scores for white (a,b) and red (c,d) wines in 2014 (left column) and 2016 (right column).
Figure 8.
Taster preference scores for white (a,b) and red (c,d) wines in 2014 (left column) and 2016 (right column).


Table 1.
Organic and conventional wines analyzed in this study in 2014 and 2016: designation of origin, production system, and vintage.
Table 1.
Organic and conventional wines analyzed in this study in 2014 and 2016: designation of origin, production system, and vintage.
| Designation of Origin | Wine Code | Type | Production System | Vintage |
|---|---|---|---|---|
| 2014 Tasting | ||||
| Rías Baixas DO | RB1 | W | Org | 2012 |
| RB3 | W | Org | 2011 | |
| RB4 | W | Con | 2012 | |
| RB5 | W | Con | 2013 | |
| RB6 | W | Con | 2012 | |
| Ribeiro DO | RI1 | R | Org | 2012 |
| RI2 | W | Org | 2012 | |
| RI2A | W | Con | 2013 | |
| RI3 | R | Org | 2013 | |
| RI4 | W | Org | 2013 | |
| RI5 | W | Con | 2013 | |
| RI6 | R | Con | 2013 | |
| RI7 | W | Con | 2013 | |
| RI8 | R | Con | 2013 | |
| RI9 | W | Org-Biod | 2011 | |
| Ribeira Sacra DO | RS1 | R | Org | 2012 |
| RS2 | R | Con | nd | |
| RS3 | W | Org | 2013 | |
| RS4 | R | Org | 2011 | |
| RS5 | W | Con | 2013 | |
| RS6 | R | Con | 2013 | |
| RS7 | R | Org | 2012 | |
| RS8 | W | Con | 2013 | |
| RS9 | R | Con | 2013 | |
| Monterrei DO | MO1 | W | Con | 2013 |
| MO2 | R | Con | 2013 | |
| MO3 | W | Org | 2010 | |
| MO4 | R | Org | 2011 | |
| Valdeorras DO | VD1 | R | Org | nd |
| VD2 | W | nd | nd | |
| VD3 | R | Con | 2013 | |
| VD4 | R | Org | 2013 | |
| 2016 Tasting | ||||
| Rías Baixas DO | RB1 | W | Org | 2014 |
| RB2 | W | Con | 2014 | |
| RB3 | W | Org | 2014 | |
| RB5 | W | Con | 2014 | |
| Ribeiro DO | RI1 | R | Org Ba | 2014 |
| RI2 | W | Con | 2014 | |
| RI3 | R | Org | 2014 | |
| RI4 | W | Org | 2014 | |
| RI5 | W | Con | 2014 | |
| RI6 | R | Con | 2014 | |
| RI7 | W | Con | nd | |
| RI9 | W | Org-Biod | 2014 | |
| RI10 | W | Org-Biod | 2014 | |
| RI11 | W | Con | 2014 | |
| Ribeira Sacra DO | RS1 | R | Org | 2014 |
| RS2 | R | Org | 2014 | |
| RS3 | W | Org | 2014 | |
| RS4 | R | Org Ba | 2013 | |
| RS5 | R | Con | 2015 | |
| RS6 | R | Org | 2015 | |
| RS8 | R | Con | 2015 | |
| Monterrei DO | MO1 | W | Con | 2014 |
| MO2 | R | Con | 2014 | |
| MO3 | W | Org | 2014 | |
| MO4 | R | Org | 2012 | |
| MO5 | W | Org | 2014 | |
| MO6 | R | Org | 2014 | |
| MO7 | W | Con | 2014 | |
| MO8 | R | Con | 2012 | |
| Valdeorras DO | VD1 | R | Org | 2014 |
| VD2 | R | Con | 2014 | |
| VD3 | R | Con | 2015 | |
| VD4 | R | Org | 2015 | |
R: red wine, W: white wine, Org: organic, Con: conventional, Biod: biodynamic (organic), Ba: barrel-aged wine, nd: not defined.
Table 2.
Chemical composition of the 2014 tasting wines from the different DOs in Galicia.
| Wines (2014) | Total Acidity * (gtart/L) | Volatile Acidity ** (g acetic/L) | Lactic Acid (g/L) | Malic Acid * (g/L) | Tartaric Acid (g/L) | Total SO2 (mg/L) | Free SO2 (mg/L) | Alcohol by Volume (%ABV) | Glycerol (g/L) | pH | Glucose + Fructose (g/L) |
|---|---|---|---|---|---|---|---|---|---|---|---|
| White | |||||||||||
| RB1 | 6.6 | 0.44 | 0.1 | 2.9 | 1.0 | 113 | 15 | 12.1 | 4.5 | 3.26 | 1.6 |
| RB3 | 7.1 | 0.37 | 0.1 | 2.4 | 2.0 | 76 | 12 | 13.2 | 6.2 | 3.19 | 1.2 |
| RB4 | 6.4 | 0.43 | 0.1 | 2.4 | 1.6 | 115 | 13 | 12.9 | 4.7 | 3.33 | 1.4 |
| RB5 | 6.4 | 0.50 | 0.6 | 2.3 | 0.5 | 100 | 26 | 12.7 | 4.9 | 3.40 | 0.8 |
| RB6 | 6.8 | 0.65 | 0.8 | 2.8 | 0.1 | 105 | 38 | 12.8 | 5.9 | 3.54 | 1.5 |
| RI2 | 5.7 | 0.52 | 0.9 | 0.9 | 2.2 | 133 | 12 | 12.7 | 4.7 | 3.26 | 2.5 |
| RI4 | 5.6 | 0.42 | 0.1 | 1.8 | 1.7 | 98 | 31 | 14.3 | 5.4 | 3.52 | 0.6 |
| RI5 | 5.8 | 0.45 | 0.1 | 2.1 | 1.4 | 102 | 7 | 12.9 | 4.9 | 3.36 | 3.3 |
| RI7 | 5.7 | 0.28 | 0.1 | 2.2 | 1.2 | 137 | 31 | 12.9 | 5.0 | 3.37 | 0.6 |
| RI9 | 6.2 | 0.52 | 0.3 | 0.9 | 3.1 | 68 | 5 | 14.4 | 3.3 | 3.17 | 0.8 |
| RS3 | 6.1 | 0.30 | 0.1 | 1.8 | 2.0 | 67 | 5 | 13.3 | 5.4 | 3.30 | 0.4 |
| RS5 | 5.8 | 0.33 | 0.1 | 2.1 | 1.6 | 139 | 10 | 12.6 | 4.4 | 3.33 | 1.1 |
| RS8 | 6.0 | 0.26 | 0.1 | 1.8 | 1.8 | 127 | 28 | 12.4 | 6.3 | 3.22 | 0.5 |
| MO1 | 5.8 | 0.33 | 0.1 | 1.8 | 2.0 | 13 | 16.0 | 5.3 | |||
| MO3 | 6.6 | 0.32 | 0.1 | 1.6 | 2.4 | 14 | 8.0 | 5.0 | |||
| VD2 | 6.0 | 0.29 | 0.1 | 1.7 | 2.2 | 104 | 23 | 13.2 | 5.0 | 3.26 | 1.6 |
| Red | |||||||||||
| RI1 | 4.6 | 0.46 | 1.4 | 0.1 | 1.3 | 60 | 8 | 12.5 | 7.1 | 3.55 | 0.2 |
| RI3 | 5.8 | 0.75 | 2.3 | 0.1 | 2.7 | 16 | 5 | 12.1 | 8.0 | 3.52 | 0.2 |
| RI6 | 5.4 | 0.48 | 1.9 | 0.1 | 1.4 | 10 | 5 | 12.9 | 7.8 | 3.58 | 0.5 |
| RI8 | 6.0 | 0.52 | 1.9 | 0.1 | 2.8 | 86 | 31 | 10.7 | 5.9 | 3.25 | 0.2 |
| RS1 | 5.6 | 0.70 | 1.4 | 0.1 | 1.6 | 72 | 15 | 12.8 | 7.5 | 3.46 | 0.6 |
| RS4 | 5.3 | 0.66 | 2.4 | 0.1 | 1.2 | 33 | 5 | 13.3 | 9.3 | 3.74 | 0.5 |
| RS6 | 5.4 | 0.64 | 2.5 | 0.1 | 1.2 | 58 | 9 | 12.6 | 8.7 | 3.65 | 0.7 |
| RS7 | 5.1 | 0.67 | 2.2 | 0.1 | 1.6 | 41 | 19 | 12.8 | 7.4 | 3.69 | 0.2 |
| RS9 | 5.1 | 0.72 | 1.4 | 0.1 | 2.0 | 82 | 28 | 12.4 | 7.9 | 3.56 | 0.2 |
| MO 2 | 4.9 | 0.46 | 2.3 | 0.1 | 1.2 | 13 | 14.0 | 7.7 | |||
| MO4 | 5.7 | 0.86 | 2.0 | 0.1 | 1.0 | 13 | 6.0 | 7.2 | |||
| VD1 | 5.9 | 0.98 | 2.0 | 0.1 | 1.9 | 10 | 5 | 12.3 | 7.4 | 3.51 | 0.2 |
| VD3 | 5.1 | 0.77 | 2.1 | 0.1 | 1.5 | 16 | 5 | 12.8 | 8.8 | 3.82 | 0.5 |
| VD4 | 5.4 | 1.02 | 3.3 | 0.1 | 0.6 | 10 | 5 | 13.1 | 9.0 | 3.92 | 0.2 |
Significant differences (p < 0.05 according to ANOVA taking DOs as a group): * in white wines, ** in both white and red wines.
Table 3.
Chemical composition of the 2016 tasting wines from the different DOs in Galicia.
| Wines (2016) | Total Acidity * (gtart/L) | Volatile Acidity (g acetic/L) | Lactic Acid (g/L) | Malic Acid (g/L) | Tartaric Acid ** (g/L) | Total SO2 (mg/L) | Free SO2 ** (mg/L) | Alcohol by Volume * (%ABV) | Glycerol (g/L) | pH ** | Glucose + Fructose * (g/L) |
|---|---|---|---|---|---|---|---|---|---|---|---|
| White | |||||||||||
| MO1 | 4.9 | 0.32 | 0.1 | 2.3 | 1.1 | 121 | 15 | 13.2 | 4.9 | 3.53 | 0.7 |
| MO3 | 6.1 | 0.42 | 0.2 | 2.2 | 2.2 | 189 | 10 | 12.8 | 5.3 | 3.21 | 0.3 |
| MO5 | 5.3 | 0.43 | 0.1 | 2.0 | 1.2 | 116 | 17 | 13.4 | 5.3 | 3.31 | 1.0 |
| MO7 | 5.4 | 0.42 | 0.1 | 2.6 | 1.2 | 110 | 15 | 13.0 | 4.8 | 3.33 | 1.5 |
| RS3 | 5.9 | 0.48 | 0.2 | 2.5 | 1.4 | 197 | 10 | 13.1 | 5.4 | 3.35 | 0.6 |
| RB1 | 6.2 | 0.58 | 1.9 | 1.6 | 1.4 | 111 | 14 | 11.5 | 5.1 | 3.45 | 2.4 |
| RB2 | 6.6 | 0.49 | 0.6 | 3.6 | 0.5 | 131 | 36 | 12.4 | 5.8 | 3.50 | 2.0 |
| RB3 | 6.6 | 0.39 | 0.3 | 2.9 | 1.8 | 54 | 10 | 12.6 | 5.4 | 3.45 | 1.1 |
| RB5 | 5.9 | 0.48 | 1.3 | 2.8 | 0.8 | 94 | 21 | 11.8 | 4.6 | 3.56 | 1.6 |
| RI2 | 5.6 | 0.30 | 0.1 | 2.2 | 1.8 | 83 | 10 | 13.0 | 5.8 | 3.50 | 0.6 |
| RI4 | 5.4 | 0.40 | 0.1 | 2.3 | 2.0 | 52 | 10 | 13.8 | 4.9 | 3.52 | 0.6 |
| RI5 | 4.9 | 0.45 | 0.1 | 2.4 | 1.0 | 96 | 16 | 12.8 | 5.0 | 3.40 | 1.5 |
| RI7 | 6.0 | 0.59 | 0.1 | 2.8 | 2.2 | 218 | 18 | 12.2 | 4.9 | 3.35 | 1.4 |
| RI9 | 4.6 | 0.61 | 1.8 | 0.3 | 2.2 | 71 | 10 | 13.2 | 4.5 | 3.50 | 0.5 |
| RI10 | 6.4 | 0.47 | 1.2 | 1.4 | 2.8 | 109 | 10 | 12.7 | 5.5 | 3.24 | 0.3 |
| RI11 | 5.0 | 0.45 | 0.1 | 2.5 | 0.9 | 108 | 21 | 12.9 | 5.0 | 3.41 | 1.3 |
| Red | |||||||||||
| MO2 | 4.4 | 0.53 | 2.4 | 0.1 | 1.7 | 38 | 12 | 12.8 | 8.9 | 3.61 | 0.8 |
| MO4 | 4.8 | 0.68 | 2.2 | 0.5 | 0.8 | 150 | 11 | 12.7 | 7.2 | 3.52 | 0.2 |
| MO6 | 5.1 | 0.60 | 2.2 | 0.1 | 2.0 | 43 | 12 | 12.9 | 8.8 | 3.47 | 0.3 |
| MO8 | 5.2 | 0.59 | 1.9 | 0.1 | 2.3 | 20 | 10 | 12.2 | 6.6 | 3.32 | 0.3 |
| RI1 | 6.3 | 1.07 | 4.0 | 0.1 | 2.0 | 20 | 10 | 11.6 | 8.0 | 3.63 | 0.2 |
| RI3 | 5.6 | 0.86 | 2.8 | 0.1 | 2.3 | 20 | 10 | 13.0 | 11.1 | 3.56 | 0.5 |
| RI6 | 4.7 | 0.50 | 2.0 | 0.1 | 2.2 | 20 | 10 | 12.4 | 7.1 | 3.47 | 0.4 |
| VD1 | 5.5 | 0.87 | 3.7 | 0.1 | 1.4 | 20 | 10 | 13.2 | 8.7 | 3.60 | 0.4 |
| VD2 | 3.9 | 0.48 | 1.6 | 0.1 | 1.2 | 20 | 10 | 12.6 | 8.7 | 3.61 | 0.5 |
| VD3 | 3.8 | 0.55 | 2.4 | 0.1 | 1.1 | 20 | 10 | 13.1 | 9.3 | 3.88 | 0.6 |
| VD4 | 4.5 | 0.68 | 2.3 | 0.1 | 2.2 | 20 | 10 | 13.6 | 8.7 | 3.83 | 0.4 |
| RS1 | 5.4 | 0.79 | 2.0 | 0.1 | 2.5 | 20 | 10 | 12.2 | 7.1 | 3.62 | 0.2 |
| RS2 | 4.6 | 0.66 | 2.1 | 0.1 | 2.4 | 20 | 10 | 11.8 | 8.9 | 3.51 | 0.2 |
| RS4 | 4.7 | 0.84 | 2.1 | 0.1 | 1.7 | 55 | 10 | 13.3 | 8.1 | 3.69 | 0.4 |
| RS5 | 4.4 | 0.49 | 2.0 | 0.1 | 2.1 | 20 | 10 | 13.5 | 9.0 | 3.76 | 0.4 |
| RS6 | 4.3 | 0.45 | 1.7 | 0.1 | 2.4 | 30 | 10 | 12.6 | 9.0 | 3.77 | 0.2 |
| RS8 | 4.6 | 0.58 | 2.1 | 0.1 | 2.1 | 20 | 10 | 14.0 | 8.4 | 3.75 | 1.1 |
Significant differences (p < 0.05 according to ANOVA taking DOs as a group): * in white wines, ** in red wines.
Table 4.
Chromatic composition of the red wines from the different DOs in Galicia of the 2016 tasting.
Table 4.
Chromatic composition of the red wines from the different DOs in Galicia of the 2016 tasting.
| Red Wines | MO2 | MO4 | MO6 | MO8 | RI1 | RI3 | RI6 | VD1 | VD2 | VD3 | VD4 | RS1 | RS2 | RS4 | RS5 | RS6 | RS8 |
|---|---|---|---|---|---|---|---|---|---|---|---|---|---|---|---|---|---|
| Total tannins (g/L) | 2.70 | 2.90 | 2.90 | 2.80 | 2.10 | 2.80 | 2.85 | 2.90 | 2.40 | 2.40 | 3.00 | 2.10 | 2.40 | 2.60 | 2.20 | 1.90 | 3.00 |
| Absorbance 420 nm | 2.664 | 2.585 | 3.337 | 4.073 | 3.286 | 4.118 | 3.185 | 4.094 | 3.267 | 3.517 | 3.901 | 3.435 | 3.251 | 2.963 | 3.821 | 2.813 | 3.925 |
| Absorbance 520 nm | 3.362 | 2.936 | 4.341 | 4.718 | 4.211 | 4.748 | 4.012 | 5.274 | 4.439 | 5.134 | 5.535 | 4.540 | 4.905 | 3.647 | 5.833 | 4.280 | 6.036 |
| Absorbance 620 nm | 0.824 | 0.699 | 1.047 | 1.223 | 1.034 | 1.313 | 0.9395 | 1.489 | 1.131 | 1.226 | 1.443 | 1.125 | 1.047 | 0.872 | 1.334 | 0.920 | 1.313 |
| Anthocyanins (mg/L) | 238.00 | 104.12 | 273.88 | 78.75 | 189.00 | 137.81 | 153.56 | 176.75 | 269.50 | 501.38 | 344.75 | 150.50 | 226.19 | 172.38 | 412.12 | 367.50 | 396.38 |
| Clarity L | 20.30 | 23.90 | 15.20 | 12.40 | 15.70 | 10.80 | 17.75 | 8.40 | 14.40 | 13.00 | 9.60 | 13.80 | 15.90 | 19.20 | 11.30 | 18.10 | 11.80 |
| Chromatic coordinate a | 49.81 | 51.24 | 45.66 | 42.42 | 46.24 | 40.39 | 47.63 | 37.22 | 45.17 | 43.88 | 39.45 | 43.63 | 47.38 | 49.20 | 41.81 | 48.62 | 42.68 |
| Chromatic coordinate b | 31.95 | 37.50 | 25.60 | 21.36 | 26.45 | 18.43 | 30.95 | 14.40 | 24.27 | 22.12 | 16.50 | 23.43 | 27.02 | 31.80 | 19.38 | 29.56 | 20.23 |
| Total polyphenol content | 40.0 | 42.0 | 48.0 | 38.0 | 39.0 | 51.0 | 43.0 | 44.0 | 44.0 | 51.0 | 52.0 | 43.0 | 44.0 | 44.0 | 44.0 | 36.0 | 55.0 |
| Modified color intensity | 6.850 | 6.220 | 8.726 | 10.014 | 8.532 | 10.179 | 8.138 | 10.858 | 8.839 | 9.879 | 10.880 | 9.101 | 9.205 | 7.483 | 10.989 | 8.013 | 11.275 |
Table 5.
Pearson’s main correlations (r) with values > 0.60 and significant differences at p < 0.05.
Table 5.
Pearson’s main correlations (r) with values > 0.60 and significant differences at p < 0.05.
| Lactic Acid | Free SO2 | Glycerol | Layer—Tone | Yellow Reflection | Cherry Tone | Red Fruits | Black Fruits | Fresh Fruit | Dried Fruit | Compote | Tropical Fruit | Citrus Fruit | Terpenic | Dried Grass | Herbaceous | Spicy | Reduction | Astringent | Lingering | Sweet | Acid | Smoothness | Harmony-Balance | Structure | Overall Quality | |
|---|---|---|---|---|---|---|---|---|---|---|---|---|---|---|---|---|---|---|---|---|---|---|---|---|---|---|
| Color intensity | 0.74 | 0.80 | 0.67 | 0.67 | 0.78 | |||||||||||||||||||||
| Yellow reflection | 0.68 | |||||||||||||||||||||||||
| Fructose + glucose | 0.70 | 0.70 | ||||||||||||||||||||||||
| Flower | 0.80 | |||||||||||||||||||||||||
| Aromatic intensity | 0.72 | 0.68 | ||||||||||||||||||||||||
| Total SO2 | 0.82 | |||||||||||||||||||||||||
| Tartaric acid | 0.66 | |||||||||||||||||||||||||
| pH | 0.64 | 0.62 | 0.84 | 0.66 | ||||||||||||||||||||||
| Floral | 0.75 | |||||||||||||||||||||||||
| Fresh fruit | 0.65 | |||||||||||||||||||||||||
| Fruity and black fruits | 0.68 | 0.81 | 0.61 | 0.72 | 0.79 | 0.85 | 0.87 | |||||||||||||||||||
| Tropical fruit | 0.73 | 0.69 | 0.62 | |||||||||||||||||||||||
| Dried fruit | 0.80 | |||||||||||||||||||||||||
| Tannins | 0.61 | 0.69 | 0.71 | 0.69 | 0.79 | 0.64 | 0.81 | 0.71 * | ||||||||||||||||||
| Dirty | 0.64 | 0.68 | 0.65 | |||||||||||||||||||||||
| Wood | 0.67 | |||||||||||||||||||||||||
| Aromatic intensity | 0.62 | 0.79 | ||||||||||||||||||||||||
| Acidity | 0.77 | 0.61 | 0.68 | |||||||||||||||||||||||
| Lingering | 0.77 | 0.74 | 0.64 | 0.77 | 0.92 | |||||||||||||||||||||
| Delicacy | 0.68 | |||||||||||||||||||||||||
| Alcohol | 0.63 | 0.72 | 0.70 | 0.67 | 0.70 | 0.81 | ||||||||||||||||||||
| Structure | 0.81 | 0.66 | 0.71 | 0.92 | 0.64 | 0.79 0.84 | ||||||||||||||||||||
| Overall quality | 0.81 | 0.66 | 0.71 | 0.64 | 0.64 0.70 | 0.67 | 0.80 0.91 | 0.76 0.85 |
White wines in normal font. Red wines in italics. * Mature tannins.
Table 6.
Significant differences between farming systems (organic and conventional) and wine vintage according to one-way and two-way PERMANOVA.
Table 6.
Significant differences between farming systems (organic and conventional) and wine vintage according to one-way and two-way PERMANOVA.
| One-Way PERMANOVA | |||||
|---|---|---|---|---|---|
| Red | 2011 | 2012 | 2013 | 2014 | 2015 |
| 2011 | 0.973 | 0.501 | 0.290 | 0.024 | |
| 2012 | 0.389 | 0.449 | 0.614 | 0.095 | |
| 2013 | 0.898 | 0.951 | 0.008 | 0.010 | |
| 2014 | 1.161 | 0.793 | 2.733 | 0.076 | |
| 2015 | 2.202 | 1.624 | 2.592 | 1.742 | |
| White | 2011 | 2012 | 2013 | 2014 | |
| 2011 | 0.015 | 0.001 | 0.001 | ||
| 2012 | 2.436 | 0.251 | 0.001 | ||
| 2013 | 5.225 | 1.236 | 0.001 | ||
| 2014 | 11.020 | 8.575 | 10.460 | ||
| Two-way PERMANOVA | |||||
| White 14 + 16 | F | p | Red 14 + 16 | F | p |
| Farming | 62.794 | 0.001 | Farming | 2.651 | 0.007 |
| Year | 47.612 | 0.001 | Year | 16.004 | 0.009 |
| White 14 | F | p | Red 14 | F | p |
| Farming | 23.561 | 0.022 | Farming | 19.901 | 0.038 |
| Year | 20.957 | 0.003 | Year | 0.886 | 0.595 |
| White 16 | F | p | Red 16 | F | p |
| Farming | 40 | 0.001 | Farming | 24.182 | 0.011 |
| Year | 0.620 | 0.816 | Year | 16.542 | 0.018 |
Significant differences (p < 0.05) in bold. In the one-way PERMANOVA, the F value is below the diagonal, and p is above the diagonal. Fourteen and 16, wines of the 2014 and 2016 tastings, respectively.
Disclaimer/Publisher’s Note: The statements, opinions and data contained in all publications are solely those of the individual author(s) and contributor(s) and not of MDPI and/or the editor(s). MDPI and/or the editor(s) disclaim responsibility for any injury to people or property resulting from any ideas, methods, instructions or products referred to in the content. |
© 2023 by the authors. Licensee MDPI, Basel, Switzerland. This article is an open access article distributed under the terms and conditions of the Creative Commons Attribution (CC BY) license (https://creativecommons.org/licenses/by/4.0/).
Share and Cite
MDPI and ACS Style
Castrillo, D.; Blanco, P. Peculiarities of the Organic Wine in Galicia (NW Spain): Sensory Evaluation and Future Considerations. Beverages 2023, 9, 89. https://doi.org/10.3390/beverages9040089
AMA Style
Castrillo D, Blanco P. Peculiarities of the Organic Wine in Galicia (NW Spain): Sensory Evaluation and Future Considerations. Beverages. 2023; 9(4):89. https://doi.org/10.3390/beverages9040089
Chicago/Turabian StyleCastrillo, David, and Pilar Blanco. 2023. "Peculiarities of the Organic Wine in Galicia (NW Spain): Sensory Evaluation and Future Considerations" Beverages 9, no. 4: 89. https://doi.org/10.3390/beverages9040089
Note that from the first issue of 2016, this journal uses article numbers instead of page numbers. See further details here.