
A MODIS/ASTER Airborne Simulator (MASTER) Imagery for Urban Heat Island Research

GeoDa Center for Geospatial Analysis and Computation, School of Geographical Sciences and Urban Planning, Arizona State University, Tempe, AZ 85287-5302, USA
*
Author to whom correspondence should be addressed.
Data 2016, 1(1), 7; https://doi.org/10.3390/data1010007
Submission received: 24 April 2016
/
Revised: 20 May 2016
/
Accepted: 31 May 2016
/
Published: 6 June 2016
(This article belongs to the Special Issue Temperature of the Earth)
Abstract
:Thermal imagery is widely used to quantify land surface temperatures to monitor the spatial extent and thermal intensity of the urban heat island (UHI) effect. Previous research has applied Landsat images, Advanced Spaceborne Thermal Emission and Reflection Radiometer (ASTER) images, Moderate Resolution Imaging Spectroradiometer (MODIS) images, and other coarse- to medium-resolution remotely sensed imagery to estimate surface temperature. These data are frequently correlated with vegetation, impervious surfaces, and temperature to quantify the drivers of the UHI effect. Because of the coarse- to medium-resolution of the thermal imagery, researchers are unable to correlate these temperature data with the more generally available high-resolution land cover classification, which are derived from high-resolution multispectral imagery. The development of advanced thermal sensors with very high-resolution thermal imagery such as the MODIS/ASTER airborne simulator (MASTER) has investigators quantifying the relationship between detailed land cover and land surface temperature. While this is an obvious next step, the published literature, i.e., the MASTER data, are often used to discriminate burned areas, assess fire severity, and classify urban land cover. Considerably less attention is given to use MASTER data in the UHI research. We demonstrate here that MASTER data in combination with high-resolution multispectral data has made it possible to monitor and model the relationship between temperature and detailed land cover such as building rooftops, residential street pavements, and parcel-based landscaping. Here, we report on data sources to conduct this type of UHI research and endeavor to intrigue researchers and scientists such that high-resolution airborne thermal imagery is used to further explore the UHI effect.
Data Set: http://dx.doi.org/10.6073/pasta/dd5f47bd551ee9bfdd6e6105bd6c28fa or https://sustainability.asu.edu/caplter/data/data-catalog/view/knb-lter-cap.629.1/
Data Set License: The data set is made available under a CC-BY license.
1. Summary
With more than 50% of the world’s population living in cities [1], a well-known phenomenon defined as the urban heat island (UHI) effect is negatively impacting human lives. As a result of the transformation of land surfaces and energy use, the UHI results in higher nighttime air and surface temperatures in urban areas compared to the surrounding rural areas [2,3,4]. The impact of the UHI includes increases in energy and water consumption, more intense heat waves during the summer, and higher risks of heat-related morbidity and mortality, particularly for young children, the aged, and low-income urban residents [5,6,7,8,9]. To understand the drivers of the UHI phenomenon and propose and implement mitigation effects, various methods are used to measure, monitor, and model the urban land surface and air temperatures. Examples include in-situ field measurements [10], surface energy balance simulation [11], and satellite imagery derivation [12,13,14,15,16]. In-situ field measurements provide detailed and accurate surface and air temperature records, but the results are typically limited to a few discrete observations in small geographic areas rather than spatially continuous observations. Surface energy balance simulations apply urban energy balance models to predict urban surface temperatures based on surface properties and geometries, solar angles, and weather conditions. It provides continuous temperature estimates, but the simulation process is computationally expensive, which makes it difficult to extend the simulation to a large geographic area. Compared to in-situ field measurements and surface energy balance simulations, satellite thermal imagery provides rich spatial and temporal temperature information and serves as a complementary data source to other methods.
Various satellite imagery products provide the thermal infrared images for the land surface temperature derivation from low spatial resolution to high spatial resolution (see Table 1). Moderate Resolution Imaging Spectroradiometer (MODIS) images and Advanced Very High Resolution Radiometer (AVHRR) images have low spatial resolution (1000 m) but very high temporal resolution (one-day revisit time). They are widely used to detect temporal changes in the UHI effect at the regional or city level scale [15,17]. The Landsat Thematic Mapper (TM), Enhanced Thematic Mapper Plus (ETM+), Operational Land Imager/Thermal Infrared Sensor (OLI/TIRS) and Advanced Spaceborne Thermal Emission and Reflection Radiometer (ASTER) thermal imagery all have a moderate spatial resolution around 100 m. These data sources are widely used to understand seasonal or yearly changes of UHI effects across different land cover types because the temporal resolution of the thermal images is limited due to cloud cover and satellite revisit period (16 days) [18,19,20,21]. By combining TM, ETM+, and OLI/TIRS imagery, long-term time-series data to support longitudinal UHI research can be achieved with data sources of moderate spatial resolution [21]. Image fusion algorithms have been proposed to produce daily land surface temperature at Landsat resolution by fusing MODIS and Landsat data [22]. The image fusion algorithms make it possible to estimate moderate spatial resolution with high temporal-resolution thermal image products from existing satellite imagery. Although all of the data sets we mentioned here can be used to derive surface temperature and analyze UHI patterns, the resolution limitation makes it impossible to use these thermal images to quantify detailed variations in the UHI due to specific urban land cover or urban objects at fine spatial resolution.
The MODIS/ASTER airborne simulator (MASTER) instrument has provided high-resolution (5–50 m) hyperspectral imagery since 1998 [23]. MASTER was developed to obtain a higher-spatial-resolution imagery in order to compare spaceborne data set (MODIS and ASTER) and in-situ field measurements. The MASTER instrument is carried by the King Air Beachcraft B200 aircraft from Department of Energy. The imagery has 50 spectral bands, which measure the visible wavelengths through mid-infrared wavelengths (0.46–12.817 um). As a hyperspectral image, MASTER images are widely used for applications such as discriminating burned areas [24], land cover classification [25], and coral reef habitat mapping [26]. However, there is limited usage of the high-resolution thermal bands of MASTER to analyze UHI patterns and phenomena in urban areas.
With the availability of high-resolution thermal imagery from MASTER, researchers are able to study environmental urban processes at a fine spatial resolution, such as landscape and climate modification, surface energy balance, evapotranspiration, and the societal implications of the UHI. For example, Stefanov et al. [27] investigated the human modifications of climate and landscape by using MASTER data in Phoenix metropolitan area. Social survey data such as ethnicity groups and income level were used to make correlations with neighborhood temperature. Research outcomes explained that inequity existed in the microclimate experience of Phoenix residents. Jenerette et al. [14] analyzed MASTER imagery with a social survey to investigate residential neighborhoods and parcel scale temperature variations under different land cover and landscapes. Results showed that vegetation was effective at cooling residential neighborhoods, and heat-related illness was correlated with daytime surface temperature at parcel level. Zhao et al. [28] utilized MASTER, Quickbird, and Light Detection and Ranging (LIDAR) data to explore the relationships among rooftop surface temperature, rooftop configuration, and nearby outdoor landscaping. The results demonstrated that outdoor landscaping and rooftop albedo significantly contributed to lower daytime rooftop surface temperatures. Vanos et al. [29] compared MASTER surface temperature with in-situ urban surface temperature to explore the relationships between hot playgrounds and children’s health in Gilbert, Arizona. MASTER data proved to be a valuable complementary data source to represent the playground temperature. These examples illustrate the research opportunities that MASTER thermal infrared imagery serves as the data source for researchers to conduct micro-level urban surface temperature analysis.
2. Data Description
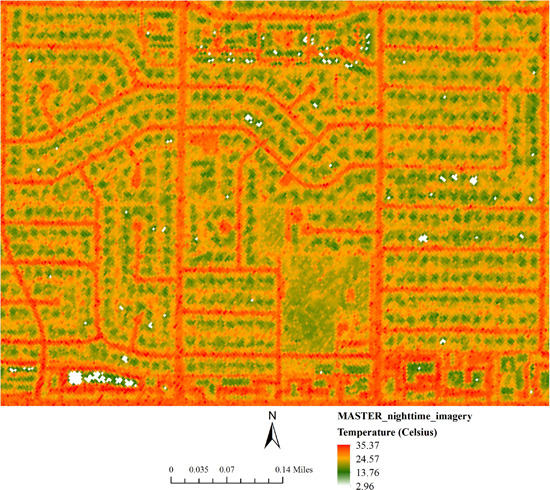
The data reported here were collected from the MASTER superspectral sensor that flew over the Phoenix metropolitan area on 12–13 July (daytime) and 15–16 July (nighttime). The spatial resolution is ~7 m/pixel. There are small variations in the pixel size due to distortion. Figure 1 shows the MASTER nighttime temperature imagery of our study area in Tempe, Arizona, USA. We generated this data set by applying atmospheric and geometric correction, then reducing the spatial extent to the specific study area. Our research focused on a residential neighborhood with mostly single family parcels. The MASTER data described in this paper were used to support the rooftop analysis reported by Zhao et al. (2015) [28].
In our data set (see Figure 1), major roads exhibit the highest surface temperature (red), followed by residential roads/pavement (orange) and household parcel/urban parks (green). The raster cells with the minimum temperature values (white pixels in Figure 1) are small clouds in the sky. These cells need to be removed before using the MASTER data set.
Table 2 provides a summary of the final data set characteristics of the MASTER nighttime image shown in Figure 1. The data are a single IMAGINE Image referenced in a latitude/longitude grid with a file size of 3.45 MB. This image was collected on 15th July 2011 (15.7.2011) with the pixel value reported in degrees Celsius (°C). The nighttime data ranged from 2.96 to 35.37 °C, with the mean of 23.94 °C and standard deviation of 3.68 °C.
3. Materials and Methods
3.1. Raw MASTER and Reference Imagery
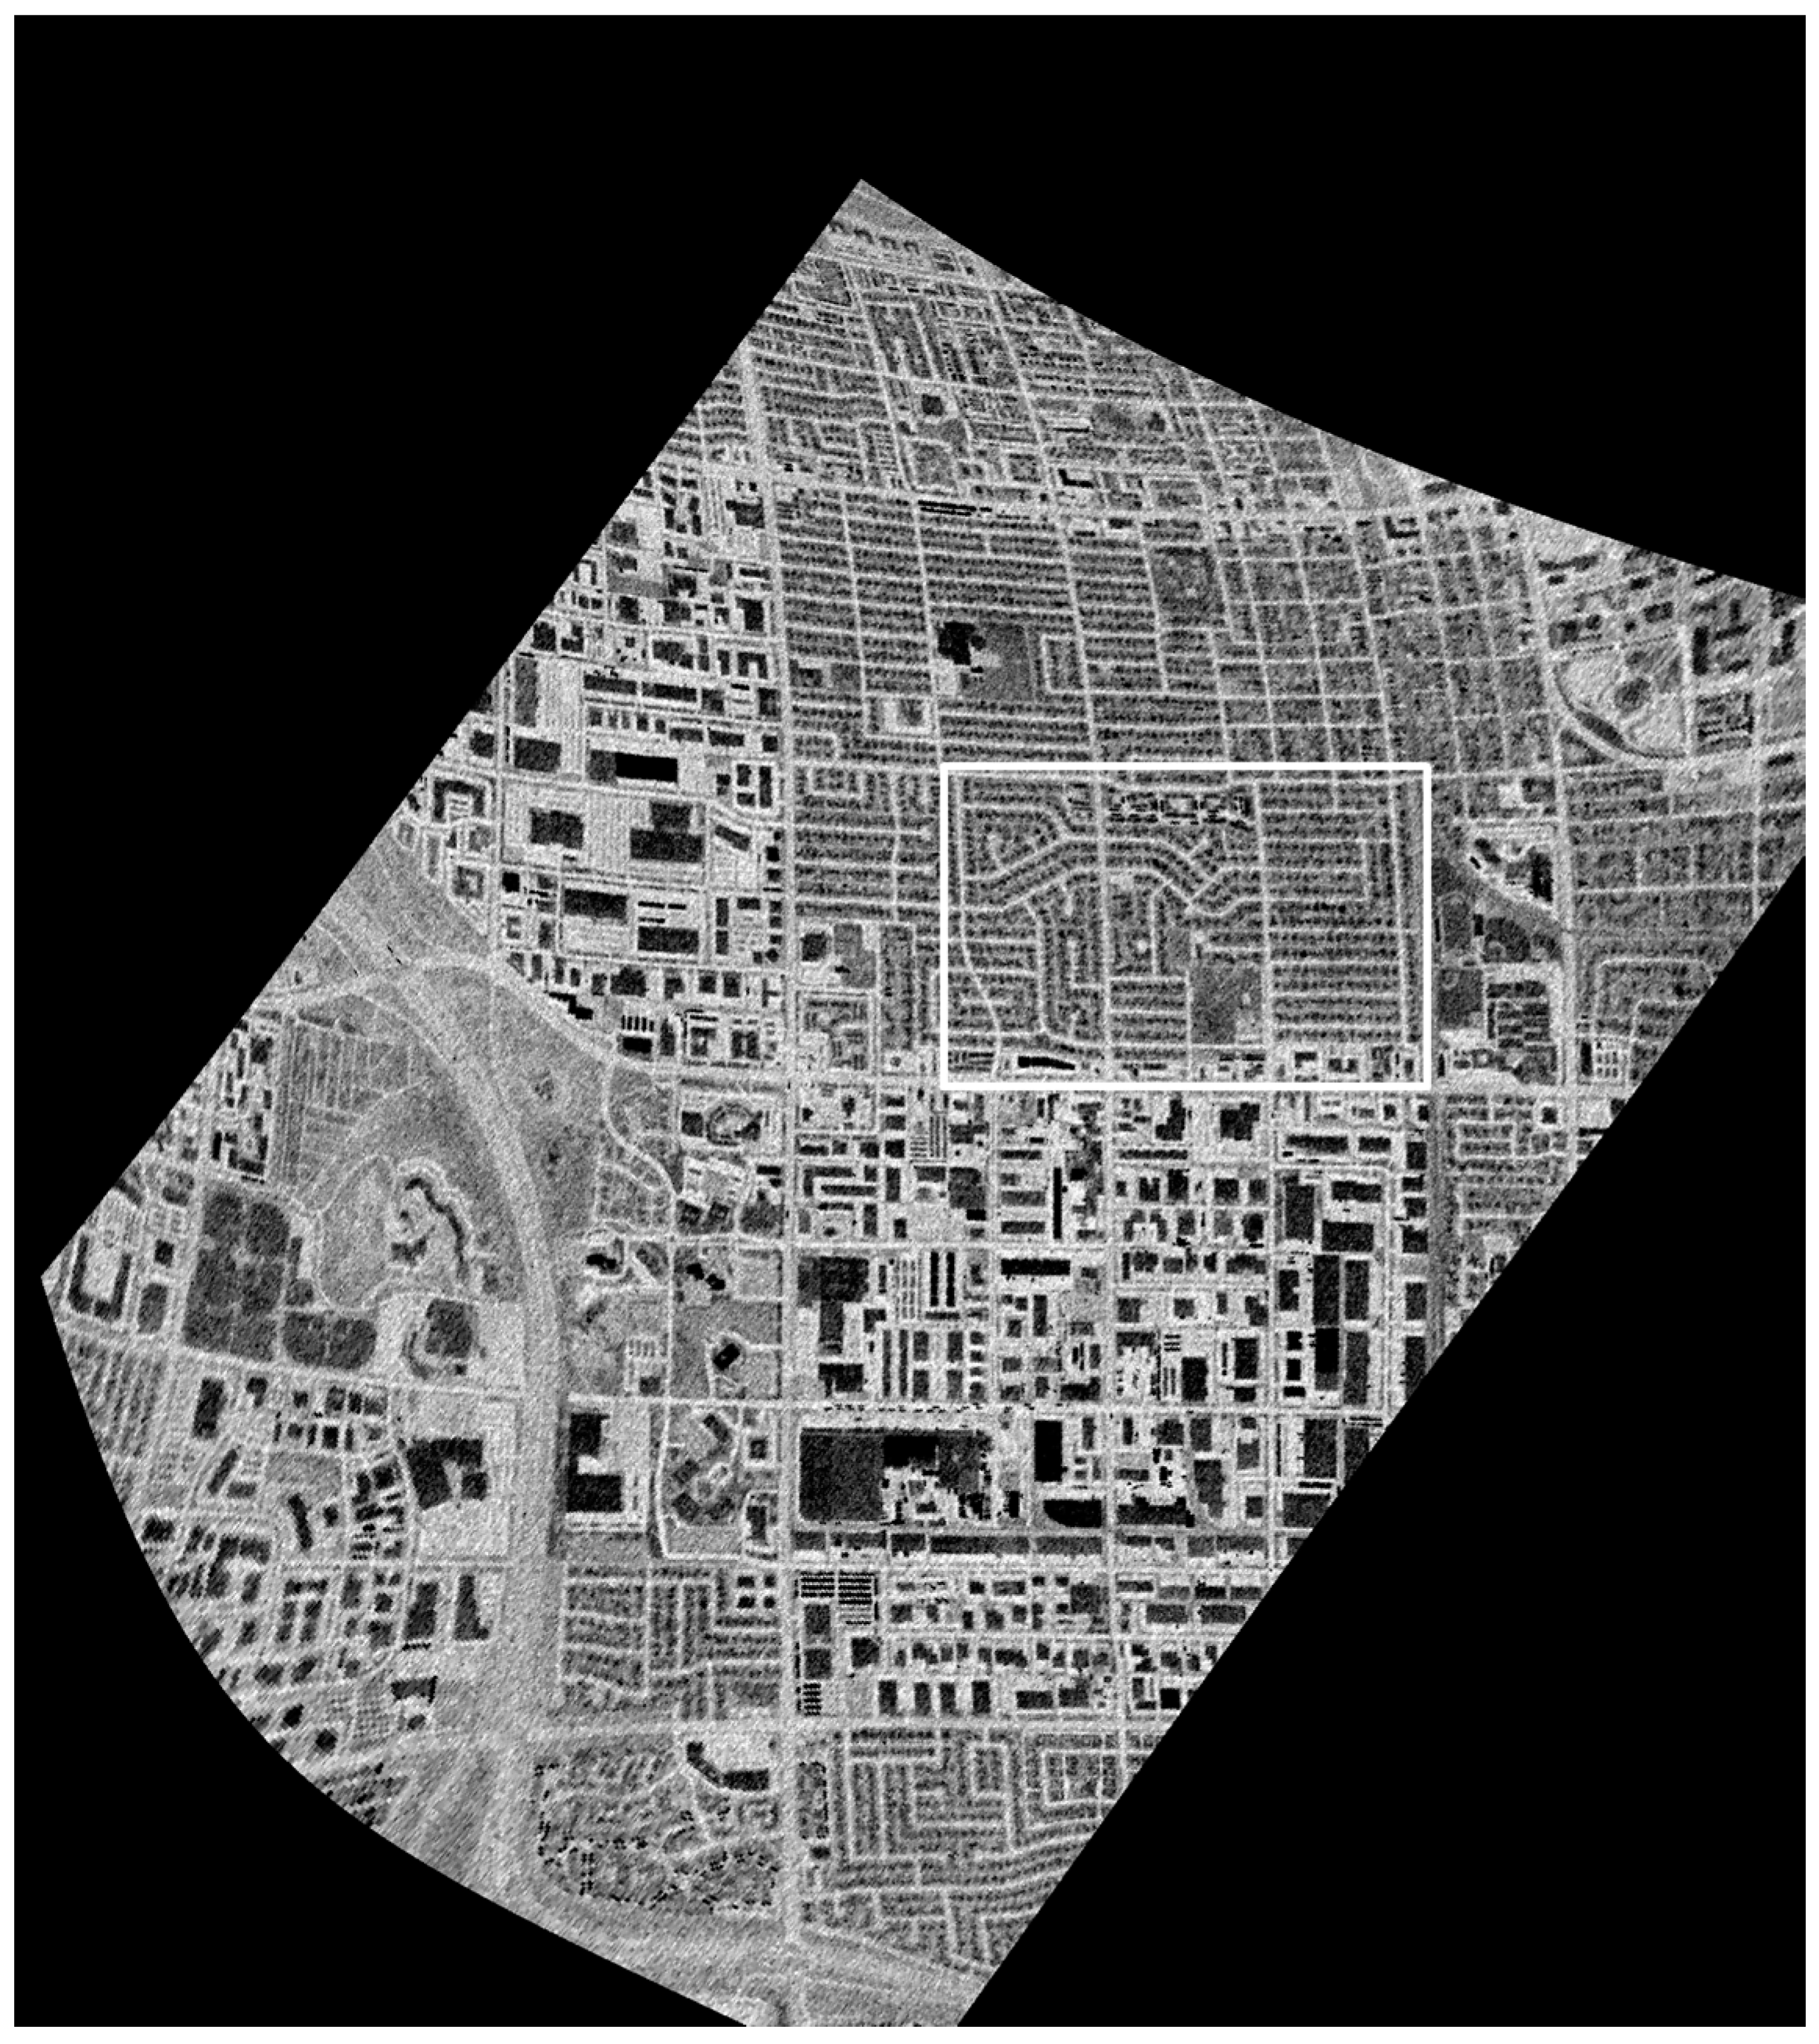
Any of the raw MASTER L1B and L2 level data (without atmospheric and geometric correction) can be freely downloaded from MASTER’s official website at National Aeronautics and Space Administration (NASA) [30]. The raw MASTER imagery used in Zhao et al. (2015) [28] was downloaded from the NASA website for the Phoenix area [31] (see Figure 2). Because the original MASTER data does not include any geolocation information and includes distorted areas due to the aircraft wobble, high-quality reference imagery is required for geometric correction.
For the Phoenix metropolitan area, we used the National Agriculture Imagery Program (NAIP) data as the reference imagery. NAIP data are 1-meter orthorectified images collected by the United States Departments of Agriculture (USDA) during the agricultural growing season in the United States. NAIP imagery has a combination of four multispectral bands (blue, green, red, and near-infrared bands). While NAIP focuses on agricultural areas, the USDA extends the data collection to cover the complete state. All the NAIP images can be freely downloaded from the USDA website [32]. These data are ideal for georeferencing MASTER data because the pixel size and feature discrimination are similar to the MASTER imagery. Figure 3 illustrates the NAIP imagery used for geometric correction in our study area.
3.2. Atmospheric and Geometric Correction
The MASTER thermal infrared data (temperature) were atmospherically corrected by using an in-scene atmospheric compensation (ISAC) technique. This involved separating the emissivity and surface temperature with an emissivity normalization approach [33,34,35,36,37] using the basic version of ENVI/IDL software (Exelis Visual Information Solutions, Boulder, CO, USA).
After importing MASTER thermal infrared bands into ENVI/IDL software, the raw radiance was scaled to W/m2/μm/sr. To apply ISAC algorithm, the assumption is a near-blackbody surface exists in the scene and the atmosphere is uniform all over the data scene. After running the ISAC algorithm, per pixel values for emissivity and surface temperature were derived. A detailed description and mathematical equations of the ISAC algorithm can be found at Young et al. (2002) [37]. Then, an emissivity normalization method was utilized to separate surface temperature and emissivity of the thermal infrared bands. This method calculates the temperature for every band and pixel by using a fixed emissivity value.
The MASTER data were geometrically corrected using an image warping approach with the second-order polynomial nearest neighbor resampling method, also completed with the basic version of ENVI/IDL. We manually identified 80 ground control points in both the MASTER image and NAIP image to geometrically align the MASTER image with the NAIP. In the end, the MASTER nighttime imagery was geographically referenced with a root-mean-square (RMS) error of 0.26 m.
4. User Notes
All the georeferenced MASTER image and other related data set from Zhao et al. (2015) [28] are available at United States Long-Term Ecological Research (LTER) network data portal [38] and Central Arizona-Phoenix Long-Term Ecological Research (CAPLTER) data portal [39]. The data are available for use, but careful attention should be given to the distortion areas and cloud pixels.
Other MASTER images are available for downloading and processing for analyzing the thermal dynamics in urban areas. The key points here serve to guide users in processing these images in other geographical settings. First, because the MASTER images are acquired by aircraft with different flight heights and under different weather conditions, it is important to check the metadata before processing and applying the MASTER image. The metadata describe flight conditions needed for data processing. Second, sensor limitation and data acquisition through aircraft results in warping particularly along the edges of the data set. Consequently, careful selection of both MASTER data and high-resolution geographically referenced data are critical for accurate geometric correction.
5. Conclusions
With the availability of high-resolution multispectral remotely sensed imagery and detailed social and health survey data, MASTER images can serve as an important surface temperature data source to analyze UHI effects with health conditions, water usage, energy consumption, and various social factors. The aim of this paper is to attract geographers, sociologist, urban planners, and remote sensing scientists’ attention of using MASTER data set in their urban heat related research. Detailed neighborhood-level understanding of urban heat and heat-related problems can be analyzed with MASTER data. In a desert city such as Phoenix, Arizona, the tradeoff between water usages, outdoor landscaping design (xeric or mesic landscape), energy saving, and UHI mitigation is a long-standing research area for creating a sustainable desert community. Future work will focus on using MASTER imagery to analyze the temperature variation in the residential parcels under different vegetation conditions, and explore the optimal outdoor landscaping design with the best heat mitigation and water efficiency. Further, combining social and health survey data with MASTER temperature data will identify more research opportunities for understanding urban heat within different community demography conditions and social inequity.
Acknowledgments
This material is based upon work supported by the National Science Foundation under Grant SES-0951366, Decision Center for a Desert City II: Urban Climate Adaptation. The acquisition and processing of the MASTER data was supported by the National Science Foundation under Grant BCS-1026865: Central Arizona-Phoenix Long-Term Ecological Research and GEO-0816168: Urban Vulnerability to Climate Change. Qunshan Zhao is partly supported by the Graduate Grant of the Central Arizona-Phoenix Long-Term Ecological Research and the National Natural Science Foundation of China (No. 51378399 and 41331175). Any opinions, findings, and conclusions or recommendations expressed in this material are those of the authors and do not necessarily reflect the views of the National Science Foundation. The authors also want to thank Jessica Jia for processing MASTER imagery and the anonymous reviewers for their valuable comments and suggestions to improve the manuscript.
Author Contributions
Both authors contribute to the research and analysis of the data, as well as writing this article.
Conflicts of Interest
The authors declare no conflict of interest.
Abbreviations
The following abbreviations are used in this manuscript:
| NOAA | National Oceanic and Atmospheric Administration |
| NASA | National Aeronautics and Space Administration |
| EOS | Earth Observing System |
| USDA | United States Departments of Agriculture |
| TM | Thematic Mapper |
| ETM+ | Enhanced Thematic Mapper Plus |
| OLI/TIRS | Operational Land Imager/Thermal Infrared Sensor |
| MODIS | Moderate Resolution Imaging Spectroradiometer |
| AVHRR | Advanced Very High Resolution Radiometer |
| MASTER | MODIS/ASTER airborne simulator |
| HyTES | Hyperspectral Thermal Emission Spectrometer |
| NAIP | National Agriculture Imagery Program |
| LIDAR | Light Detection and Ranging |
| UHI | Urban Heat Island |
| ASTER | Advanced Spaceborne Thermal Emission and Reflection Radiometer |
| ISAC | In-scene Atmospheric Compensation |
References
- United Nations. World Urbanization Prospects: The 2014 Revision; United Nations, Department of Economic and Social Affairs & Population Division: New York, NY, USA, 2014. [Google Scholar]
- Bornstein, R.D. Observations of the urban heat island effect in New York City. J. Appl. Meteorol. 1968, 7, 575–582. [Google Scholar] [CrossRef]
- Kim, H.H. Urban heat island. Int. J. Remote Sens. 1992, 13, 2319–2336. [Google Scholar] [CrossRef]
- Oke, T.R. The energetic basis of the urban heat island. Q. J. R. Meteorol. Soc. 1982, 108, 1–24. [Google Scholar] [CrossRef]
- Bassil, K.L.; Cole, D.C. Effectiveness of Public Health Interventions in Reducing Morbidity and Mortality during Heat Episodes: A Structured Review. Int. J. Environ. Res. Public. Health 2010, 7, 991–1001. [Google Scholar] [CrossRef] [PubMed]
- Bi, P.; Williams, S.; Loughnan, M.; Lloyd, G.; Hansen, A.; Kjellstrom, T.; Dear, K.; Saniotis, A. The Effects of Extreme Heat on Human Mortality and Morbidity in Australia: Implications for Public Health. Asia. Pac. J. Public Health 2011. [Google Scholar] [CrossRef]
- Harlan, S.L.; Brazel, A.J.; Prashad, L.; Stefanov, W.L.; Larsen, L. Neighborhood microclimates and vulnerability to heat stress. Soc. Sci. Med. 2006, 63, 2847–2863. [Google Scholar] [CrossRef] [PubMed]
- McGeehin, M.A.; Mirabelli, M. The potential impacts of climate variability and change on temperature-related morbidity and mortality in the United States. Environ. Health Perspect. 2001, 109, 185–189. [Google Scholar] [CrossRef] [PubMed]
- Tomlinson, C.J.; Chapman, L.; Thornes, J.E.; Baker, C.J. Including the urban heat island in spatial heat health risk assessment strategies: A case study for Birmingham, UK. Int. J. Health Geogr. 2011, 10. [Google Scholar] [CrossRef] [PubMed] [Green Version]
- Stoll, M.J.; Brazel, A.J. Surface-air temperature relationships in the urban environment of Phoenix, Arizona. Phys. Geogr. 1992, 13, 160–179. [Google Scholar]
- Krayenhoff, E.S.; Voogt, J.A. A microscale three-dimensional urban energy balance model for studying surface temperatures. Bound.-Layer Meteorol. 2007, 123, 433–461. [Google Scholar] [CrossRef]
- Myint, S.W.; Wentz, E.A.; Brazel, A.J.; Quattrochi, D.A. The impact of distinct anthropogenic and vegetation features on urban warming. Landsc. Ecol. 2013, 28, 959–978. [Google Scholar] [CrossRef]
- Fan, C.; Myint, S.W.; Zheng, B. Measuring the spatial arrangement of urban vegetation and its impacts on seasonal surface temperatures. Prog. Phys. Geogr. 2015, 39, 199–219. [Google Scholar] [CrossRef]
- Jenerette, G.D.; Harlan, S.L.; Buyantuev, A.; Stefanov, W.L.; Declet-Barreto, J.; Ruddell, B.L.; Myint, S.W.; Kaplan, S.; Li, X. Micro-scale urban surface temperatures are related to land-cover features and residential heat related health impacts in Phoenix, AZ USA. Landsc. Ecol. 2016, 31, 745–760. [Google Scholar] [CrossRef]
- Tran, H.; Uchihama, D.; Ochi, S.; Yasuoka, Y. Assessment with satellite data of the urban heat island effects in Asian mega cities. Int. J. Appl. Earth Obs. Geoinform. 2006, 8, 34–48. [Google Scholar] [CrossRef]
- Zhang, X.; Aono, Y.; Monji, N. Spatial Variability of Urban Surface Heat Fluxes Estimated from Landsat TM Data under Summer and Winter Conditions. J. Agric. Meteorol. 1998, 54, 1–11. [Google Scholar] [CrossRef]
- Gallo, K.P.; McNab, A.L.; Karl, T.R.; Brown, J.F.; Hood, J.J.; Tarpley, J.D. The use of NOAA AVHRR data for assessment of the urban heat island effect. J. Appl. Meteorol. 1993, 32, 899–908. [Google Scholar] [CrossRef]
- Chen, X.-L.; Zhao, H.-M.; Li, P.-X.; Yin, Z.-Y. Remote sensing image-based analysis of the relationship between urban heat island and land use/cover changes. Remote Sens. Environ. 2006, 104, 133–146. [Google Scholar] [CrossRef]
- Zhang, H.; Qi, Z.; Ye, X.; Cai, Y.; Ma, W.; Chen, M. Analysis of land use/land cover change, population shift, and their effects on spatiotemporal patterns of urban heat islands in metropolitan Shanghai, China. Appl. Geogr. 2013, 44, 121–133. [Google Scholar] [CrossRef]
- Sun, R.; Chen, L. How can urban water bodies be designed for climate adaptation? Landsc. Urban Plan. 2012, 105, 27–33. [Google Scholar] [CrossRef]
- Shen, H.; Huang, L.; Zhang, L.; Wu, P.; Zeng, C. Long-term and fine-scale satellite monitoring of the urban heat island effect by the fusion of multi-temporal and multi-sensor remote sensed data: A 26-year case study of the city of Wuhan in China. Remote Sens. Environ. 2016, 172, 109–125. [Google Scholar] [CrossRef]
- Weng, Q.; Fu, P.; Gao, F. Generating daily land surface temperature at Landsat resolution by fusing Landsat and MODIS data. Remote Sens. Environ. 2014, 145, 55–67. [Google Scholar] [CrossRef]
- Hook, S.J.; Myers, J.J.; Thome, K.J.; Fitzgerald, M.; Kahle, A.B. The MODIS/ASTER airborne simulator (MASTER)—A new instrument for earth science studies. Remote Sens. Environ. 2001, 76, 93–102. [Google Scholar] [CrossRef]
- Veraverbeke, S.; Harris, S.; Hook, S. Evaluating spectral indices for burned area discrimination using MODIS/ASTER (MASTER) airborne simulator data. Remote Sens. Environ. 2011, 115, 2702–2709. [Google Scholar] [CrossRef]
- Li, P.; Moon, W.M. Land cover classification using MODIS–ASTER airborne simulator (MASTER) data and NDVI: A case study of the Kochang area, Korea. Can. J. Remote Sens. 2004, 30, 123–126. Available online: http://www.tandfonline.com/doi/abs/10.5589/m03-061#.VxU_avkrIuU (accessed on 18 April 2016). [Google Scholar] [CrossRef]
- Capolsini, P.; Andréfouët, S.; Rion, C.; Payri, C. A comparison of Landsat ETM+, SPOT HRV, Ikonos, ASTER, and airborne MASTER data for coral reef habitat mapping in South Pacific islands. Can. J. Remote Sens. 2003, 29, 187–200. [Google Scholar] [CrossRef]
- Stefanov, W.L.; Prashad, L.; Eisinger, C.; Brazel, A.; Harlan, S.L. Investigation of human modifications of landscape and climate in the Phoenix Arizona Metropolitan area using MASTER data. Pan 2004, 2, 2–8. [Google Scholar]
- Zhao, Q.; Myint, S.W.; Wentz, E.A.; Fan, C. Rooftop Surface Temperature Analysis in an Urban Residential Environment. Remote Sens. 2015, 7, 12135–12159. [Google Scholar] [CrossRef]
- Vanos, J.K.; Middel, A.; McKercher, G.R.; Kuras, E.R.; Ruddell, B.L. Hot playgrounds and children’s health: A multiscale analysis of surface temperatures in Arizona, USA. Landsc. Urban Plan. 2016, 146, 29–42. [Google Scholar] [CrossRef]
- MASTER—The MODIS/ASTER Airborne Simulator. Available online: http://master.jpl.nasa.gov/ (accessed on 1 June 2016).
- MASTER—Level-1B Available Data Flight #11-004-04. Available online: http://master.jpl.nasa.gov/data/MissionView.htm?Missionid=100796 (accessed on 1 June 2016).
- United States Department of Agriculture Geospatial Data Gateway. Available online: https://gdg.sc.egov.usda.gov/ (accessed on 1 June 2016).
- Kealy, P.S.; Hook, S.J. Separating temperature and emissivity in thermal infrared multispectral scanner data: Implications for recovering land surface temperatures. IEEE Trans. Geosci. Remote Sens. 1993, 31, 1155–1164. [Google Scholar] [CrossRef]
- Johnson, B.R.; Young, S.J. In-Scene Atmospheric Compensation: Application to SEBASS Data Collected at the ARM Site; Space and Environment Technology Center, The Aerospace Corporation: Los Angeles, CA, USA, 1998. [Google Scholar]
- Hernandez-Baquero, E.D. Characterization of the Earths Surface and Atmosphere from Multispectral and Hyperspectral Thermal Imagery. Ph.D. Thesis, Rochester Institute of Technology, Chester F. Carlsom Center for Imaging Science, Rochester, NY, USA, 2000. [Google Scholar]
- Hook, S.J.; Gabell, A.R.; Green, A.A.; Kealy, P.S. A comparison of techniques for extracting emissivity information from thermal infrared data for geologic studies. Remote Sens. Environ. 1992, 42, 123–135. [Google Scholar] [CrossRef]
- Young, S.J.; Johnson, B.R.; Hackwell, J.A. An in-scene method for atmospheric compensation of thermal hyperspectral data. J. Geophys. Res. 2002, 107. [Google Scholar] [CrossRef]
- Zhao, Q. Analysis of Rooftop Surface Temperatures in an Urban Residential Environment. Long Term Ecological Research Network. Available online: http://dx.doi.org/10.6073/pasta/dd5f47bd551ee9bfdd6e6105bd6c28fa (accessed on 2 June 2016).
- Central Arizona-Phoenix Long-Term Ecological Research Data Catalog—Analysis of rooftop surface temperatures in an urban residential environment. Available online: https://sustainability.asu.edu/caplter/data/data-catalog/view/knb-lter-cap.629.1/ (accessed on 1 June 2016).
Figure 1.
MASTER nighttime temperature imagery in the study area.

Figure 2.
Raw MASTER nighttime imagery. Outline defines the study area for the research and the portion of the data used for analysis.
Figure 2.
Raw MASTER nighttime imagery. Outline defines the study area for the research and the portion of the data used for analysis.

Figure 3.
NAIP imagery. Outline defines the study area for the research and the portion of the data used for analysis.
Figure 3.
NAIP imagery. Outline defines the study area for the research and the portion of the data used for analysis.


| Satellite (Sensor) | Spatial Resolution (Thermal Band) | Revisit Time (Days) | Years of Operation |
|---|---|---|---|
| Low spatial resolution | |||
| NOAA (AVHRR) | 1000 m | 1 | 1979 to present |
| EOS (MODIS) | 1000 m | 1 | 1999 to present |
| Moderate spatial resolution | |||
| Landsat (TM) | 120 m | 16 | 1984–2011 |
| Landsat (ETM+) | 60 m | 16 | 1999 to present |
| Landsat (OLI/TIRS) | 100 m | 16 | 2013 to present |
| EOS (ASTER) | 90 m | (on demand) | 1999 to present |
| High spatial resolution | |||
| Airborne (MASTER) | Depending on flight height (5–50 m) | (on demand) | 1998 to present |
| Airborne (HyTES) | Depending on flight height (3.41 m with 2000 flight altitude) | (on demand) | 2013 to present |
| Characteristic | Description |
|---|---|
| Data format | IMAGINE Image |
| Epoch | 15 July 2011 |
| Coordinate system and projection | NAD_1983_UTM_Zone_12N |
| Image dimensions | 1106 × 817 (columns × rows) |
| Size | 3.45 MB |
| Number of layers | 1 |
| Value | Land surface temperature in Celsius |
| Maximum value | 35.37 |
| Minimum value | 2.96 |
| Mean value | 23.94 |
| Value of standard deviation | 3.68 |
© 2016 by the authors; licensee MDPI, Basel, Switzerland. This article is an open access article distributed under the terms and conditions of the Creative Commons Attribution (CC-BY) license (http://creativecommons.org/licenses/by/4.0/).
Share and Cite
MDPI and ACS Style
Zhao, Q.; Wentz, E.A. A MODIS/ASTER Airborne Simulator (MASTER) Imagery for Urban Heat Island Research. Data 2016, 1, 7. https://doi.org/10.3390/data1010007
AMA Style
Zhao Q, Wentz EA. A MODIS/ASTER Airborne Simulator (MASTER) Imagery for Urban Heat Island Research. Data. 2016; 1(1):7. https://doi.org/10.3390/data1010007
Chicago/Turabian StyleZhao, Qunshan, and Elizabeth A. Wentz. 2016. "A MODIS/ASTER Airborne Simulator (MASTER) Imagery for Urban Heat Island Research" Data 1, no. 1: 7. https://doi.org/10.3390/data1010007