Data Descriptor

A New Integrated High-Latitude Thermal Laboratory for the Characterization of Land Surface Processes in Alaska’s Arctic and Boreal Regions

1
HyLab, Geophysical Institute, University of Alaska Fairbanks, 903 Koyukuk Dr., Fairbanks, AK 99775, USA
2
Institute of Northern Engineering, University of Alaska Fairbanks, Fairbanks, AK 99775, USA
3
Flemish Institute for Technological Research (VITO), Remote Sensing Unit, Boeretang 200, Mol B-2400, Belgium
*
Author to whom correspondence should be addressed.
Submission received: 27 June 2016 / Revised: 7 September 2016 / Accepted: 8 September 2016 / Published: 21 September 2016
(This article belongs to the Special Issue Temperature of the Earth)

Abstract

:
Alaska’s Arctic and boreal regions, largely dominated by tundra and boreal forest, are witnessing unprecedented changes in response to climate warming. However, the intensity of feedbacks between the hydrosphere and vegetation changes are not yet well quantified in Arctic regions. This lends considerable uncertainty to the prediction of how much, how fast, and where Arctic and boreal hydrology and ecology will change. With a very sparse network of observations (meteorological, flux towers, etc.) in the Alaskan Arctic and boreal regions, remote sensing is the only technology capable of providing the necessary quantitative measurements of land–atmosphere exchanges of water and energy at regional scales in an economically feasible way. Over the last decades, the University of Alaska Fairbanks (UAF) has become the research hub for high-latitude research. UAF’s newly-established Hyperspectral Imaging Laboratory (HyLab) currently provides multiplatform data acquisition, processing, and analysis capabilities spanning microscale laboratory measurements to macroscale analysis of satellite imagery. The specific emphasis is on acquiring and processing satellite and airborne thermal imagery, one of the most important sources of input data in models for the derivation of surface energy fluxes. In this work, we present a synergistic modeling framework that combines multiplatform remote sensing data and calibration/validation (CAL/VAL) activities for the retrieval of land surface temperature (LST). The LST Arctic Dataset will contribute to ecological modeling efforts to help unravel seasonal and spatio-temporal variability in land surface processes and vegetation biophysical properties in Alaska’s Arctic and boreal regions. This dataset will be expanded to other Alaskan Arctic regions, and is expected to have more than 500 images spanning from 1984 to 2012.
Data Set License: The LST Arctic Dataset is made available under a CC-BY-NC license

1. Introduction

Warming in high latitudes is causing widespread melting of snow, ice, and permafrost degradation across Arctic tundra and boreal ecosystems, changing plant communities and increasing wildfire and drought occurrence [1,2,3,4,5,6,7,8,9,10]. Increasing surface temperatures in the Arctic will produce changes in the surface energy balance that ultimately controls how the water cycle responds to climate change [11]. As a result of these changes, the distribution, abundance, and seasonal availability of local subsistence resources (including berries, fish, mammals, and birds) are likely to change, having an impact on the food security of Arctic communities [12]. Therefore, quantifying the surface energy balance and its spatio-temporal trends in Arctic and boreal ecosystems is key to better understanding ecosystem response and vulnerability to changing climate conditions in the Arctic, and it requires improved techniques for the spatiotemporal characterization of land–atmosphere exchanges of water and energy at regional scales.
Land surface temperature (LST) is one of the most important sources of input data in models used to derive surface energy fluxes [13,14,15,16], and serves as a valuable input for many ecological applications, such as mapping the presence or absence of near surface permafrost [17], for salmon habitat mapping [18,19,20], among others. Due to remoteness, harsh winter conditions, and the high costs of maintaining ground-based measurement networks in Alaska’s Arctic ecosystems, temperature and other data acquired from instrumented towers in the field is spatially and temporally inhomogeneous [21]. Remote sensing, then, represents the only economically feasible and reliable source of information for the derivation of land surface temperatures and changes in surface temperature over time for large heterogeneous regions [22].
Currently, there are several operational airborne or satellite sensors that collect thermal imagery for the estimation of land surface temperature at local, regional, and global scales. However, there are only two satellite programs that have provided more than 30 years of thermal information of great value: Television InfraRed Operational Satellite/National Oceanic and Atmospheric Administration (TIROS/NOAA and Landsat. Since Landsat-4 Thematic Mapper (TM) was launched in 1982, the Landsat satellite series is the only remote sensing program that has been providing uninterrupted thermal images at medium spatial resolution (from 60 to 120 m) over the globe. Although Landsat revisits the same area approximately every 16 days at the Equator, this repeat frequency can be as high as 3–4 days in high-latitude Arctic regions, allowing for the mapping of land surface processes at better temporal resolutions than in lower-latitude areas.
In the last two decades, diagnostic methods have demonstrated their utility in modeling surface energy balance using remote sensing data [14,23,24,25,26,27,28]. With large volumes of Arctic field-based measurements and remote sensing data (such as Landsat, the Advanced Very High Resolution Radiometer (AVHRR), or MODIS) freely available for the research community, the next challenge is to ascertain the seasonal and spatio-temporal variability in surface energy fluxes in the Arctic and boreal regions.
In this study, we present a freely-available medium-resolution LST Arctic dataset derived from Landsat imagery (Landsat-5 TM and Landsat-7 Enhanced Thematic Mapper (ETM)+) from 2009 to 2013 over Alaska’s boreal forest, processed at the University of Alaska Fairbanks’s (UAF’s) Hyperspectral Imaging Laboratory (HyLab) through a synergistic modeling framework that combines multiplatform remote sensing data and calibration/validation (CAL/VAL) activities to retrieve land surface temperature (LST). This dataset is currently growing for other regions in Alaska, and will be used to retrieve spatio-temporal surface energy fluxes as well as other land surface processes in Arctic ecosystems.

2. High-Latitude Thermal and Hyperspectral Laboratory: HyLab

Over the last decades, the University of Alaska Fairbanks has become the research hub for high-latitude research. UAF’s Hyperspectral Imaging Laboratory was established in 2014 with a Major Research Instrumentation grant from the National Science Foundation (NSF), and currently provides multiplatform data acquisition, processing, and analysis capabilities spanning microscale laboratory measurements to macroscale analysis of satellite imagery. The HyLab facility consists of a lab for instrument calibration and laboratory spectroscopy as well as much-needed local airborne and satellite multispectral, hyperspectral, and thermal imaging capability for Arctic regions using the NEO HySpex sensors in combination with a Forward Looking Infrared Radiometer (FLIR) camera. Data provided by these sensors are currently contributing to ecological modeling efforts to help unravel seasonal and spatio-temporal variability in land surface processes such as surface energy fluxes, vegetation biophysical properties, permafrost, greening and browning of Arctic vegetation, aquatic ecosystems, and wildfire investigations in Alaska’s Arctic and boreal regions. Sample data and products are available on the HyLab website at http://www.hyperspectral.alaska.edu/resources_data_products.html.

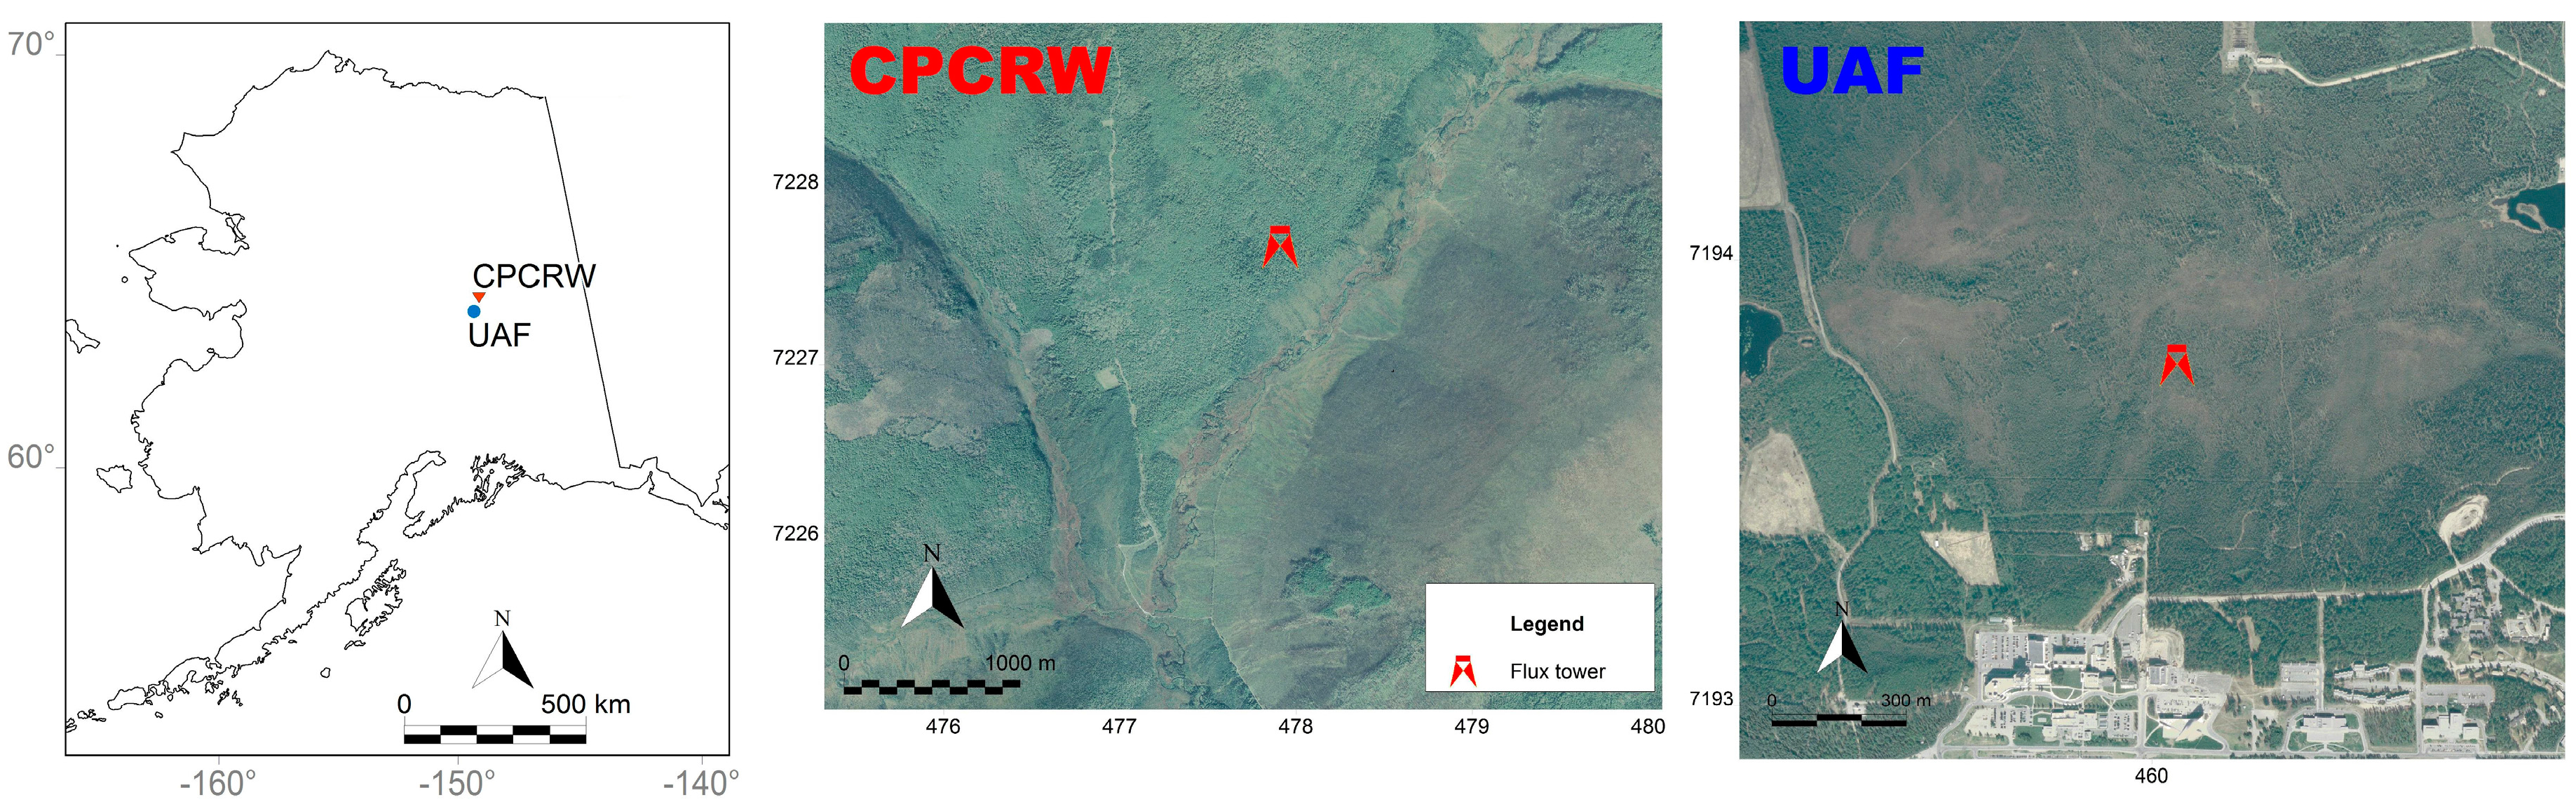
Field Instrumentation for CAL/VAL Activities

As part of two funded projects by the National Aeronautics and Space Administration (NASA), we established two experimental sites in 2011–2012 in two representative ecosystems of the circum-Arctic boreal forest (sub-Arctic region) to calibrate and validate remote sensing surface energy balance models (Figure 1). The first site, UAF north campus, is located in a black spruce forest (Picea mariana) with a canopy cover of around 60% and a rich understory of shrubs and mosses (Lat, Long: N 64.86577878, W 147.84282061). The second site, Caribou-Poker Creeks Research Watershed (CPCRW), is in a deciduous forest mainly composed of paper birch (Betula neoalaskana) with a summer canopy cover of around 80% (Lat, Long: N 65.17165605, W 147.47142696). Both field sites are equipped with advanced micrometeorology instruments to measure surface energy fluxes (Table 1) and have a pyrgeometer (from the four-component net radiation instrument sent to the manufacturer for recalibration every 3 years) measuring incoming and outgoing longwave radiation at 1 min timesteps that may be used to validate LST.

3. LST Arctic Dataset Data Description

3.1. Image Data

The freely-available LST Arctic Dataset consists of 10 images derived from Landsat-5 and 7 satellite data acquired from 2009 to 2013 (see Section 4.1. “Land surface temperature retrieval”) can be accessed at http://www.hyperspectral.alaska.edu/resources_data_products.html. Data is provided in degrees Kelvin and in two file formats: GeoTiff (*.tif) and MiraMon remote sensing and GIS software (*.img) [29]. In order to decrease the image file size, LST is stored as temperature times 100 using an unsigned short integer. To use the imagery, LST needs to be divided by 100 to obtain temperature in degrees Kelvin. The coordinate system and the spatial resolution are the same that United Stated Geological Survey uses to distribute Landsat imagery (see Section 4.1. “Land surface temperature retrieval”), thus avoiding image resampling. The image file formats can be displayed by MiraMon or any other software able to open TIFF imagery, such as ENVI or ArcGIS. Table 2 provides a summary of the main characteristics of the data set.

3.2. Image Metadata

Image metadata was set according to [30,31], including tags and fields proposed by the European Prestandard (1997, 1998) and the Open Geospatial Consortium. In addition, careful attention was given to properly documenting image metadata complying with ISO standards (19115, 19115-2, 19139 and 19139-2). An example of metadata tags and fields can be found in Table 3. For each image, a structured XML file containing the metadata is provided.

4. Methods

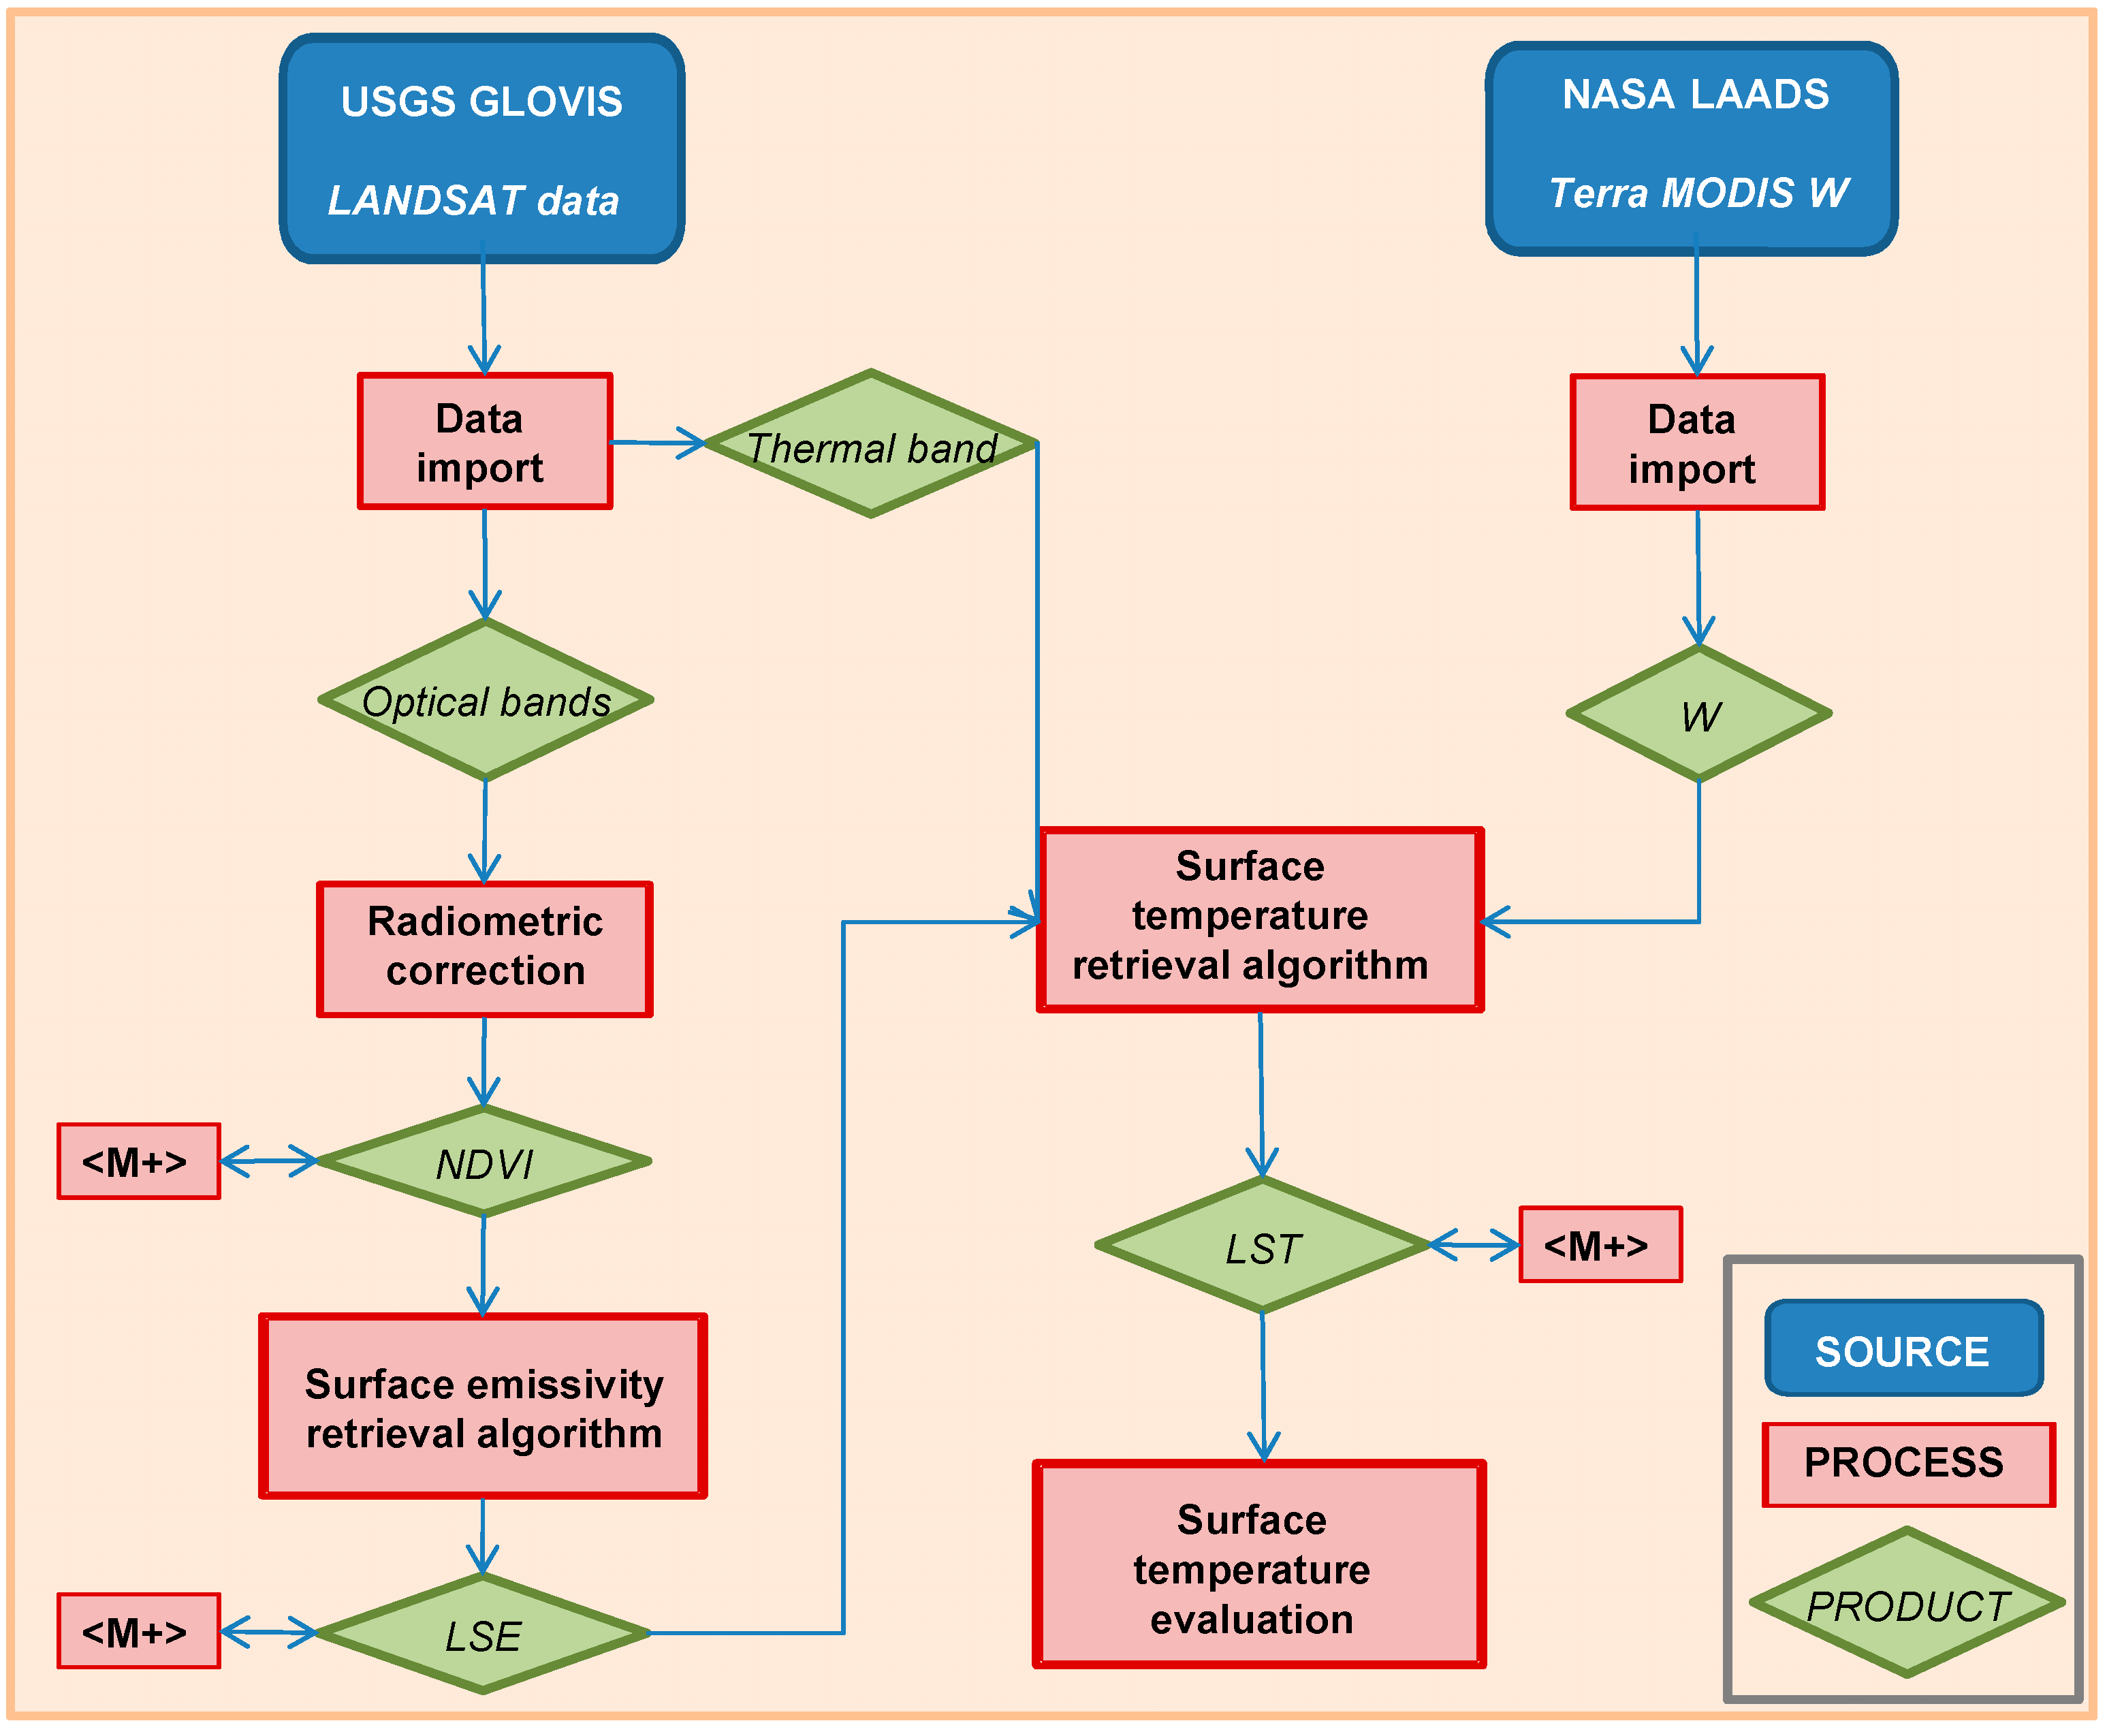
4.1. Land Surface Temperature Retrieval

A modeling framework that synergistically combines multiplatform remote sensing data from Landsat time series and Terra MODIS imagery was developed to map LST at medium spatial resolution (from 60 to 120 m) at regional scales in Alaska’s boreal forest (see Figure 1). Landsat imagery with a mean cloud clover of around 13% from paths 68–69 and rows 14–15 from (dd/mm/yyyy) 16/06/2009, 03/08/2009, 14/09/2010, 12/05/2011, 13/04/2012, 06/05/2012, 10/08/2012, 25/05/2013, 26/06/2013, and 28/07/2013 was downloaded from the USGS Global Visualization Viewer (GLOVIS, http://glovis.usgs.gov/), already geometrically corrected (Figure 2). Terra MODIS water vapor product (MOD05) from the same day and the closest time was downloaded from the Level 1 and Atmosphere Archive and Distribution System (LAADS) web site (https://ladsweb.nascom.nasa.gov/). Geometric correction and image export was performed with the MODIS re-projection tool (MRT, https://lpdaac.usgs.gov/tools/modis_reprojection_tool). Landsat images were processed using MiraMon, ensuring a complete image and metadata processing (see Section 3.2 “Image metadata”). Once geometrically corrected, MODIS water vapor was exported to MiraMon file format and an IDL script was used to export the metadata embedded in the HDF file into the MiraMon metadata file format.
LST was retrieved using the single-channel methodology proposed by [22,32], which is based on the radiative transfer equation and needs water vapor as an input variable. In this methodology, atmospheric functions to retrieve LST are obtained as a function of the total atmospheric water vapor content derived from a global atmospheric radiosoundings database. This methodology yielded a root mean square error (RMSE) of about 1 K, and it was designed for a wide range of water vapor values (0 to 8 g·cm−2) to take into account global conditions. The Terra MODIS water vapor product (MOD05) was used as an input of water vapor. This dataset has been freely available since 1999; however, to retrieve LST prior to 1999, NOAA AVHRR imagery may be used as a water vapor source by using a channel differencing method [33] known to be reliable under cloud-free conditions. Land surface emissivity (LSE) is also required to retrieve LST. The Normalized Difference Vegetation Index (NDVI) Threshold Method proposed by [34,35] was used to estimate LSE. For vegetation and soil, this methodology uses certain NDVI thresholds (NDVI >0.5 and <0.2, respectively) to distinguish between bare soil, fully vegetated, and mixed pixels. In order to compute the NDVI, a radiometric correction of Landsat optical imagery was carried out following the methodology proposed by [36]. This method mainly needs two external parameters: the radiance received by the sensor from an area where only atmospheric contribution exists, and the atmospheric optical depths that are obtained from pseudo-invariant areas according to [36] (remaining parameters, such as acquisition time, are obtained from image metadata). This method allowed us to reduce the number of undesired artifacts due to the effects of the atmosphere or to differential illumination which is, in turn, due to the time of the day, the location on the Earth, and the relief (some zones are more illuminated than others, cast shadows, etc.). Finally, all steps performed in the LST processing chain were stored in the final LST image metadata (Figure 2).

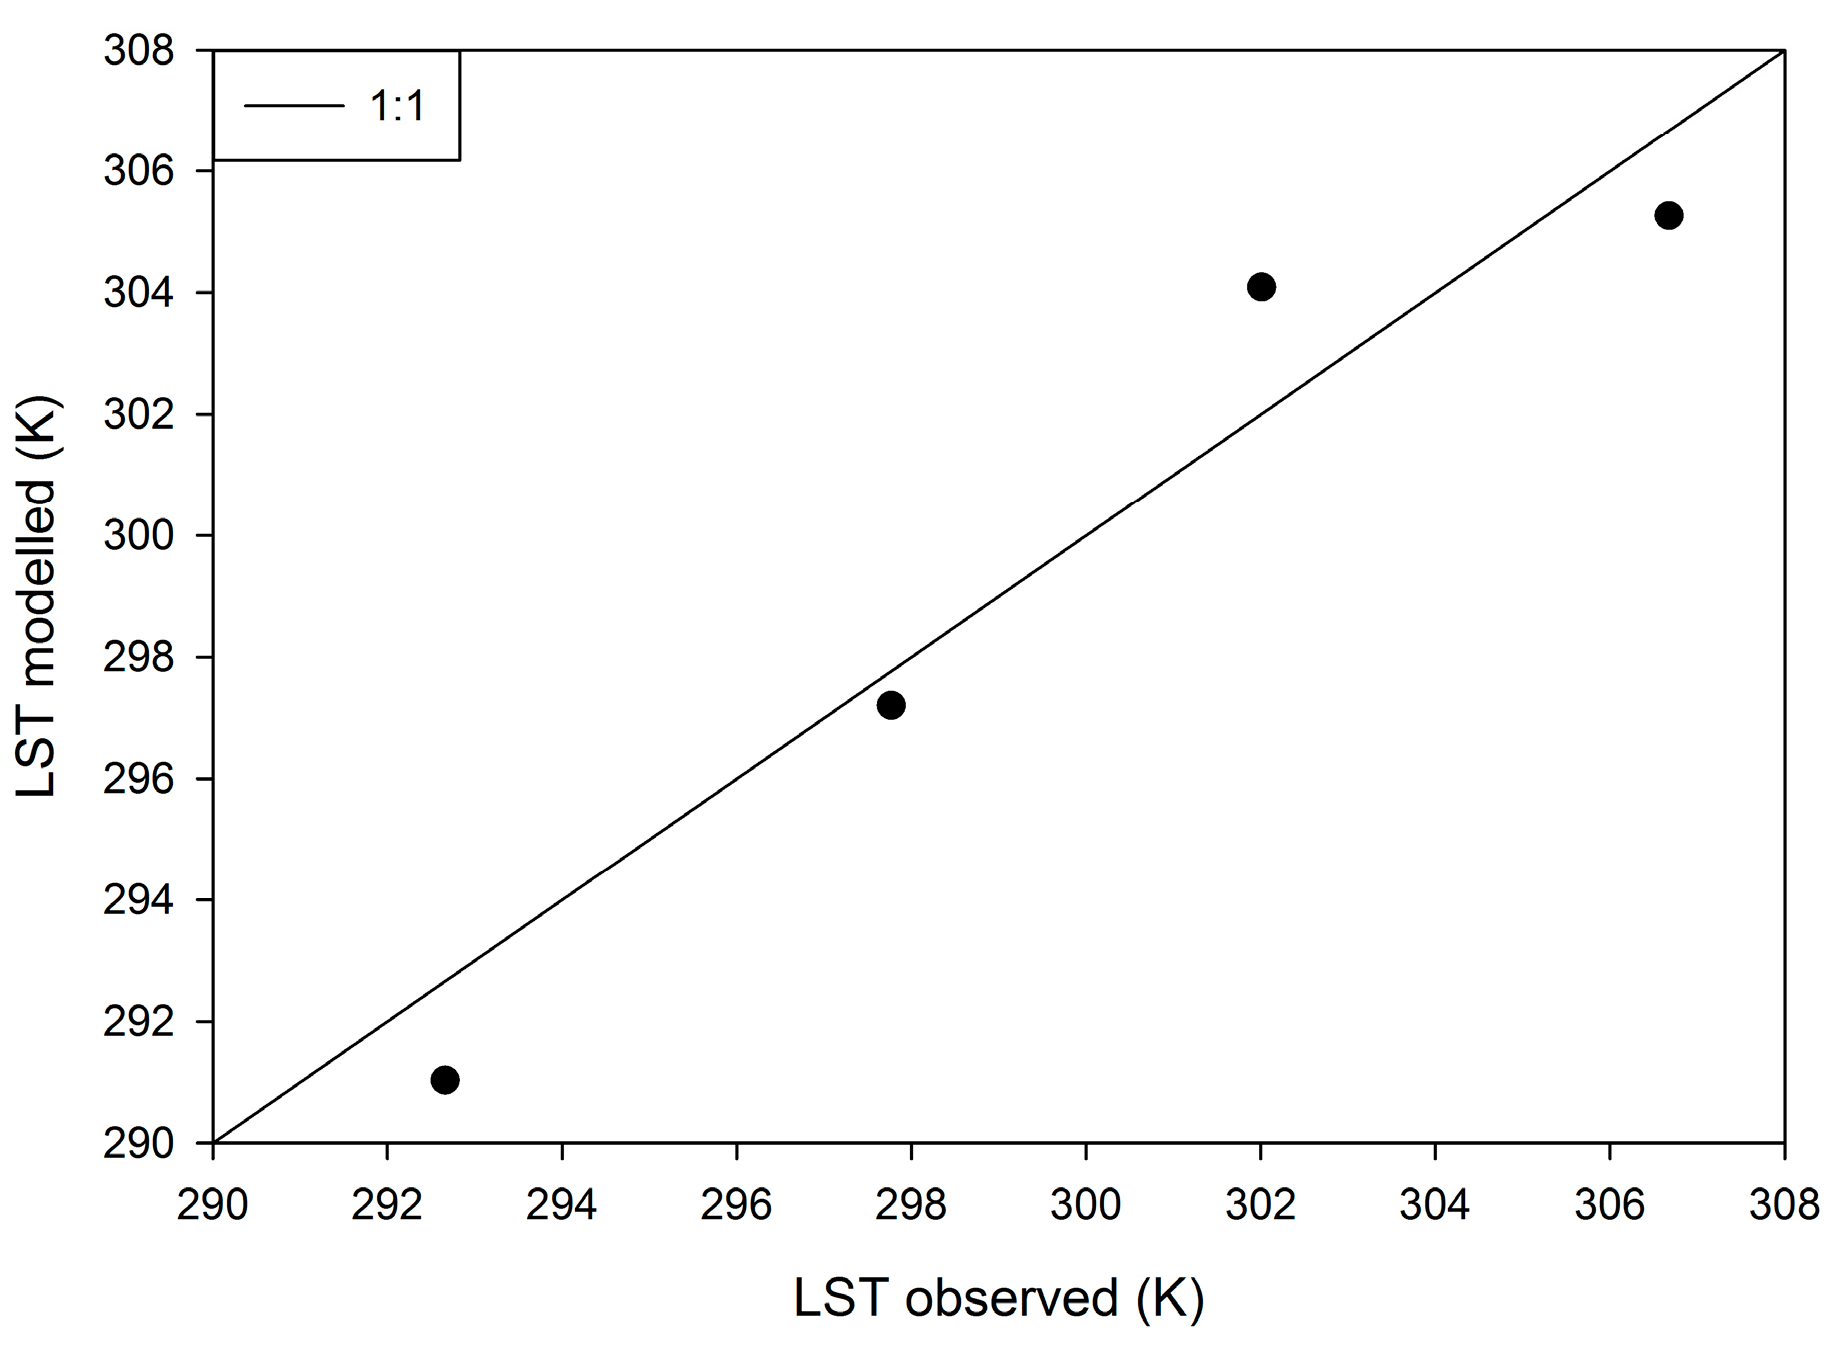
4.2. Land Surface Temperature Evaluation

In order to assure the LST product quality, validation and accuracy assessment methodologies were designed for each stage of the analysis workflow (Figure 3) using the upwelling and downwelling longwave radiation data from the pyrgeometer sensor at UAF and CPCRW flux towers (Figure 1). Pyrgeometer data can be converted to LST according to [37]:
LST p   =   ( L u p     ( 1 ε )   L d o w n ε σ ) 1 / 4
where Lup is the is surface upwelling longwave radiation, ε is the LSE, σ is the Stefan–Boltzmann’s constant (5.67 × 10⁻⁸ W·m−2·K−4), and Ldown is the atmospheric downwelling longwave radiation at the surface, and p subscript means pyrgeometer. Once converted to surface temperature, LSTp data was used to evaluate remote sensing LST. To evaluate the model, four days in which data from both the flux towers and Landsat-7 ETM+ thermal imagery were available (25 May 2013, 10 August 2013, 26 June 2013, and 28 July 2013) were used. Unfortunately, flux tower data was not available to evaluate LST retrieved using Landsat-5 TM data. Results with Landsat-7 ETM+ data showed a good agreement between both observed and modelled LST with a RMSE of 1.5 K and a R2 of 0.94 (see Figure 3). Although RMSE in the original methodology was about 1 K, results showed a slight increase of 0.5 K in the model error performance. This might be due to uncertainties in water vapor and LSE retrievals, as well as degradation of the Landsat-7 ETM+ thermal sensor that is currently in need of a new calibration update [38], although further research is needed to evaluate this bias.

5. Plans for Expanding the LST Arctic Dataset

Through an NSF Alaska Experimental Program to Stimulate Competitive Research (EPSCoR) grant, the current version of the LST Arctic Dataset will be expanded to three other sites in Alaska: Nuiqsut, Kenai Peninsula, and Berners Bay (see https://www.alaska.edu/epscor/ for further details) using the same methodology. LST, LSE, NDVI, and radiometrically-corrected optical imagery from 1984 to 2012 will be processed and distributed through the EPSCoR web portal.

Acknowledgments

Authors would like to acknowledge the funding support from National Science Foundation (NSF) Major Research Instrumentation (MRI) Program, (NSF award number 1338193 and project title “MRI: Acquisition of a hyperspectral imaging system to support scientific research and research training, applied studies, and education in the state of Alaska”) and the University of Alaska Fairbanks that helped to establish HyLab. Land surface temperature image processing and validation research activities are based in part upon work supported by the Alaska NASA EPSCoR Program (awards NNX13AB28A and NNX10AN02A, and project titles “Estimating Spatio-Temporal Variability in Evapotranspiration in Interior Alaska Using Field Measurements, Modeling and Remote Sensing” and “Estimating year-round surface energy fluxes in Alaska Arctic and sub-Arctic watershed through remote sensing and field measurements”, respectively), Alaska EPSCoR NSF (award #OIA-1208927 and project title: “Integrating multiplatform remote sensing and field data to estimate energy fluxes under snow conditions in Arctic ecosystems”), the Alaska Space Grant Program and the state of Alaska. Authors would like to thank W.P. Kustas, M.C. Anderson and J. Alfieri from the U.S. Department of Agriculture—ARS Hydrology and Remote Sensing Laboratory for supplying part of the instrumentation at the CPCRW tower.

Author Contributions

Jordi Cristóbal conceived and designed the research, lead the data processing and analysis, and the manuscript write-up; Patrick Graham assisted with Landsat data processing and analysis; Anupma Prakash provided assistance with composing and editing the manuscript as well as active participation in the research projects that this work is derived from and, Marcel Buchhorn provided assistance in data management, manuscript write-up and editing..

Conflicts of Interest

The authors declare no conflict of interest.

Abbreviations

The following abbreviations are used in this manuscript:
AVHRRAdvanced Very High Resolution Radiometer
CPCRWCaribou-Poker Creeks Research Watersheds
EPSCoRExperimental Program to Stimulate Competitive Research
ETMEnhanced Thematic Mapper
FLIRForward Looking Infrared Radiometer
HyLabHyperspectral Imaging Laboratory
LSELand surface emissivity
LSTLand Surface Temperature
MODISModerate Resolution Imaging Spectroradiometer
NASANational Aeronautics and Space Administration
NDVINormalized Difference Vegetation Index
NSFNational Science Foundation
RMSERoot Mean Square Error
TMThematic Mapper
UAFUniversity of Alaska Fairbanks

References

  1. The Arctic Monitoring and Assessment Programme (AMAP). Arctic Climate Issues 2011: Changes in Arctic Snow, Water, Ice and Permafrost, SWIPA 2011 overview report; AMAP: Oslo, Norway, 2012; 96.
  2. Bates, B.C.; Kundzewicz, Z.W.; Wu, S.; Palutikof, J.P. Climate Change and Water; IPCC: Geneva, Switzerland, 2008. [Google Scholar]
  3. Bintanja, R.; Selten, F.M. Future increases in arctic precipitation linked to local evaporation and sea-ice retreat. Nature 2014, 509, 479–482. [Google Scholar] [CrossRef] [PubMed]
  4. Duffy, P.A.; Epting, J.; Graham, J.M.; Rupp, T.S.; McGuire, A.D. Analysis of Alaskan burn severity patterns using remotely sensed data. Int. J. Wildland Fire 2007, 16, 277–284. [Google Scholar] [CrossRef]
  5. Jorgenson, M.T.; Shur, Y.L.; Pullman, E.R. Abrupt increase in permafrost degradation in arctic Alaska. Geophys. Res. Lett. 2006, 33, L02503. [Google Scholar] [CrossRef]
  6. McGuire, A.D.; Wirth, C.; Apps, M.; Beringer, J.; Clein, J.; Epstein, H.; Kicklighter, D.W.; Bhatti, J.; Chapin, F.S.; de Groot, B.; et al. Environmental variation, vegetation distribution, carbon dynamics and water/energy exchange at high latitudes. J. Veg. Sci. 2002, 13, 301–314. [Google Scholar] [CrossRef]
  7. Osterkamp, T.E.; Jorgenson, M.T.; Schuur, E.A.G.; Shur, Y.L.; Kanevskiy, M.Z.; Vogel, J.G.; Tumskoy, V.E. Physical and ecological changes associated with warming permafrost and thermokarst in interior Alaska. Permafr. Periglac. Process. 2009, 20, 235–256. [Google Scholar] [CrossRef]
  8. Serreze, M.C.; Barry, R.G. Processes and impacts of arctic amplification: A research synthesis. Glob. Planet. Chang. 2011, 77, 85–96. [Google Scholar] [CrossRef]
  9. Verbyla, D. The greening and browning of Alaska based on 1982–2003 satellite data. Glob. Ecol. Biogeogr. 2008, 17, 547–555. [Google Scholar] [CrossRef]
  10. Brown, D.; Jorgenson, M.; Kielland, K.; Verbyla, D.; Prakash, A.; Koch, J. Landscape effects of wildfire on permafrost distribution in interior alaska derived from remote sensing. Remote Sens. 2016, 8, 654. [Google Scholar] [CrossRef]
  11. Vörösmarty, C.J.; Hinzman, L.D.; Peterson, B.J.; Bromwich, D.H.; Hamilton, L.C.; Morison, J.; Romanovsky, V.E.; Sturm, M.; Webb, R.S. The Hydrologic Cycle and Its Role in Arctic and Global Environmental Change: A Rationale and Strategy for Synthesis Study; ARCUS: Fairbanks, AK, USA, 2001. [Google Scholar]
  12. Wesche, S.D.; Chan, H.M. Adapting to the impacts of climate change on food security among Inuit in the western Canadian arctic. Ecohealth 2010, 7, 361–373. [Google Scholar] [CrossRef] [PubMed]
  13. Kustas, W.; Anderson, M. Advances in thermal infrared remote sensing for land surface modeling. Agric. For. Meteorol. 2009, 149, 2071–2081. [Google Scholar] [CrossRef]
  14. Cristóbal, J.; Poyatos, R.; Ninyerola, M.; Llorens, P.; Pons, X. Combining remote sensing and GIS climate modelling to estimate daily forest evapotranspiration in a Mediterranean mountain area. Hydrol. Earth Syst. Sci. 2011, 15, 1563–1575. [Google Scholar] [CrossRef]
  15. Pons, X.; Cristóbal, J.; González, O.; Riverola, A.; Serra, P.; Cea, C.; Domingo, C.; Díaz, P.; Monterde, M.; Velasco, E. Ten years of local water resource management: Integrating satellite remote sensing and geographical information systems. Eur. J. Remote Sens. 2012, 45, 317–332. [Google Scholar] [CrossRef]
  16. Li, Z.L.; Tang, B.H.; Wu, H.; Ren, H.Z.; Yan, G.J.; Wan, Z.M.; Trigo, I.F.; Sobrino, J.A. Satellite-derived land surface temperature: Current status and perspectives. Remote Sens. Environ. 2013, 131, 14–37. [Google Scholar] [CrossRef]
  17. Hachem, S.; Allard, M.; Duguay, C. Using the MODIS land surface temperature product for mapping permafrost: An application to northern Quebec and Labrador, Canada. Permafr. Periglac. Process. 2009, 20, 407–416. [Google Scholar] [CrossRef]
  18. Smikrud, K.M.; Prakash, A.; Nichols, J.V. Decision-based fusion for improved fluvial landscape classification using digital aerial photographs and forward looking infrared images. Photogramm. Eng. Remote Sens. 2008, 74, 903–911. [Google Scholar] [CrossRef]
  19. Woll, C.; Prakash, A.; Sutton, T. A case-study of in-stream juvenile salmon habitat classification using decision-based fusion of multispectral aerial images. Appl. Remote Sens. J. 2011, 2, 37–46. [Google Scholar]
  20. Wirth, L.; Rosenberger, A.; Prakash, A.; Gens, R.; Margraf, F.J.; Hamazaki, T. A remote-sensing, GIS-based approach to identify, characterize, and model spawning habitat for fall-run chum salmon in a sub-arctic, glacially fed river. Trans. Am. Fish. Soc. 2012, 141, 1349–1363. [Google Scholar] [CrossRef]
  21. Cristóbal, J.; Prakash, A.; Starkenburg, D.P.; Fochesatto, G.J.; Anderson, M.A.; Kustas, W.P.; Alfieri, J.G.; Gens, R.; Kane, D.L. Energy fluxes retrieval on an alaskan arctic and sub-arctic vegetation by means modis imagery and the dtd method. In American Geophysical Union Fall meeting; American Geophysical Union: San Francisco, USA, 2012. [Google Scholar]
  22. Cristóbal, J.; Prakash, A.; Starkenburg, D.P.; Fochesatto, G.J.; Anderson, M.A.; Kustas, W.P.; Alfieri, J.G.; Gens, R.; Kane, D.L. Energy fluxes retrieval on an Alaskan Arctic and Sub-Arctic vegetation by means MODIS imagery and the DTD method. In Proceedings of the American Geophysical Union Fall Meeting, San Francisco, CA, USA, 3–7 December 2012.
  23. Bastiaanssen, W.G.M.; Menenti, M.; Feddes, R.A.; Holtslag, A.A.M. A remote sensing surface energy balance algorithm for land (SEBAL)—1. Formulation. J. Hydrol. 1998, 212, 198–212. [Google Scholar] [CrossRef]
  24. Anderson, M.C.; Norman, J.M.; Mecikalski, J.R.; Torn, R.D.; Kustas, W.P.; Basara, J.B. A multiscale remote sensing model for disaggregating regional fluxes to micrometeorological scales. J. Hydrometeorol. 2004, 5, 343–363. [Google Scholar] [CrossRef]
  25. Kalma, J.D.; McVicar, T.R.; McCabe, M.F. Estimating land surface evaporation: A review of methods using remotely sensed surface temperature data. Surv. Geophys. 2008, 29, 421–469. [Google Scholar] [CrossRef]
  26. Kustas, W.P.; Norman, J.M. A two-source energy balance approach using directional radiometric temperature observations for sparse canopy covered surfaces. Agron. J. 2000, 92, 847–854. [Google Scholar] [CrossRef]
  27. Roerink, G.J.; Su, Z.; Menenti, M. S-SEBI: A simple remote sensing algorithm to estimate the surface energy balance. Phys. Chem. Earth Part B Hydrol. Oceans Atmos. 2000, 25, 147–157. [Google Scholar] [CrossRef]
  28. Schmugge, T.J.; Kustas, W.P.; Ritchie, J.C.; Jackson, T.J.; Rango, A. Remote sensing in hydrology. Adv. Water. Resour. 2002, 25, 1367–1385. [Google Scholar] [CrossRef]
  29. MiraMon, version 8. Geographical Information System and Remote Sensing Software. Center for Ecological Research and Forestry Applications (CREAF): Bellaterra, Spain, 2004.
  30. Zabala, A.; Pons, X. Image Metadata: Compiled Proposal and Implementation. In Geoinformation for European-Wide Integration; Benes, T., Ed.; Millpress: Rotterdam, The Netherlands, 2003; pp. 647–652. [Google Scholar]
  31. Yang, X.; Blower, J.D.; Bastin, L.; Lush, V.; Zabala, A.; Maso, J.; Cornford, D.; Diaz, P.; Lumsden, J. An integrated view of data quality in earth observation. Philos. Trans. A Math. Phys. Eng. Sci. 2013, 371, 20120072. [Google Scholar] [CrossRef] [PubMed]
  32. Jimenez-Munoz, J.C.; Cristobal, J.; Sobrino, J.A.; Soria, G.; Ninyerola, M.; Pons, X. Revision of the single-channel algorithm for land surface temperature retrieval from Landsat thermal-infrared data. IEEE Trans. Geosci. Remote Sens. 2009, 47, 339–349. [Google Scholar] [CrossRef]
  33. Sobrino, J.A.; Raissouni, N.; Simarro, J.; Nerry, F.; Petitcolin, F. Atmospheric water vapor content over land surfaces derived from the AVHRR data: Application to the Iberian Peninsula. IEEE Trans. Geosci. Remote Sens. 1999, 37, 1425–1434. [Google Scholar] [CrossRef]
  34. Sobrino, J.A.; Raissouni, N.; Li, Z.L. A comparative study of land surface emissivity retrieval from NOAA data. Remote Sens. Environ. 2001, 75, 256–266. [Google Scholar] [CrossRef]
  35. Sobrino, J.A.; Jimenez-Munoz, J.C.; Soria, G.; Romaguera, M.; Guanter, L.; Moreno, J.; Plaza, A.; Martincz, P. Land surface emissivity retrieval from different VNIR and TIR sensors. IEEE Trans. Geosci. Remote Sens. 2008, 46, 316–327. [Google Scholar] [CrossRef]
  36. Pons, X.; Pesquer, L.; Cristóbal, J.; González-Guerrero, O. Automatic and improved radiometric correction of Landsat imagery using reference values from MODIS surface reflectance images. Int. J. Appl. Earth Obs. Geoinform. 2014, 33, 243–254. [Google Scholar] [CrossRef]
  37. Wang, K.C.; Liang, S.L. Evaluation of ASTER and MODIS land surface temperature and emissivity products using long-term surface longwave radiation observations at SURFRAD sites. Remote Sens. Environ. 2009, 113, 1556–1565. [Google Scholar] [CrossRef]
  38. Schott, J.R.; Hook, S.J.; Barsi, J.A.; Markham, B.L.; Miller, J.; Padula, F.P.; Raqueno, N.G. Thermal infrared radiometric calibration of the entire Landsat 4, 5, and 7 archive (1982–2010). Remote Sens. Environ. 2012, 122, 41–49. [Google Scholar] [CrossRef]
Figure 1. Location of the University of Alaska Fairbanks (UAF) and the Caribou-Poker Creeks Research Watersheds (CPCRW) flux towers in Alaska’s boreal forest.
Data 01 00013 g001
Figure 2. LST processing flow chart. <M+> is medatada enrichment. GLOVIS: Global Visualization Viewer; LAADS: Level 1 and Atmosphere Archive and Distribution System; LSE: land surface emissivity; NDVI: normalized difference vegetation index.
Data 01 00013 g002
Figure 3. Scatterplot of observed vs. modelled LST in degrees K.
Data 01 00013 g003
Table 1. Instrumentation list for CPCRW and UAF flux towers. PAR: photosynthetically-active radiation.
InstrumentDescriptionUAFCPCRW
UnitsHeight/Depth (m)UnitsHeight/Depth (m)
Campbell Sci. CSAT3Three-Dimensional Sonic Anemometer115123
Campbell EC-150Open Path Infrared Gas Analyzer (CO2 and H2O)115123
Vaisalla HMP45CTemperature and Relative Humidity Probe32.5–7–1422.5–23.5
Hukseflux HFP0SCSoil Heat Flux Plate40.140.1
Campbell Sci. TCAVType E Thermocouple Soil Temperature Probe20.02–0.0620.02–0.06
Campbell Sci. CS616Water Content Reflectometer 20.0420.04
Licor LI190SBPAR Sensor (incoming)114123
Licor LI190SBPAR Sensor (outgoing)114123
Kipp & Zonen CNR4Four-component net radiometer114--
Hukseflux NR-01Four-component net radiometer--123
Campbell SR50ASnow depth sonic ranging sensor12.512.5
Texas Electronics TE525MMRainfall gauge11.5--
Apogee IRR-PInfraRed Radiometer Sensor21.5–3--
Table 2. Data set characteristics of the land surface temperature (LST) Arctic Dataset.
CharacteristicDescription
Data formatGeoTiff/MiraMon
Epoch2009–2013
Coordinate systemUTM-6N WGS84
Image dimensions~8531, ~9211 (rows, columns)
Spatial resolution30 m
Size55 Mb per image
Data typeUnsigned Short Integer
No Data value−9999
Number of layers10
UnitK
Value divider100
Table 3. Example of image metadata embedded in the XML file.
TagFields
General dataSummary, Coordinator, Promotor, Editor, Distributor, Layer creation date, Layer update date
Technical aspectsFile type, Layer size, User size, User size description, Data model, Object type, Number of objects, Disk Location, Alternative location, Alphanumeric database, Alternative alphanumeric database, Comments, Columns, Rows, Platform and instrument information
Spatial reference systemDescription, Units, Resolution , Resolution units, Equivalent scale, Cell size , Horizontal reference system quality
ExtentMinimum X, Maximum X , Minimum Y, Maximum Y
Thematic informationContent maintenance, Content date
QualityParameter, Indicator, Measure, Type of values, Measurement value, Measurement units

