Data Descriptor

Data on Healthy Food Accessibility in Amsterdam, The Netherlands

1
Department of Human Geography and Spatial Planning, Utrecht University, 3584 CS Utrecht, The Netherlands
2
Leibniz Institute of Ecological Urban and Regional Development, 01217 Dresden, Germany
*
Author to whom correspondence should be addressed.
Submission received: 16 November 2016 / Revised: 14 January 2017 / Accepted: 22 January 2017 / Published: 26 January 2017
(This article belongs to the Special Issue Geospatial Data)

Abstract

:
This data descriptor introduces data on healthy food supplied by supermarkets in the city of Amsterdam, The Netherlands. In addition to two neighborhood variables (i.e., share of autochthons and average housing values), the data comprises three street network-based accessibility measures derived from analyses using a geographic information system. Data are provided on a spatial micro-scale utilizing grid cells with a spatial resolution of 100 m. We explain how the data were collected and pre-processed, and how alternative analyses can be set up. To illustrate the use of the data, an example is provided using the R programming language.
Data Set License: CC-BY

1. Introduction

Spatial accessibility to healthy food is important for people’s health [1]. In that respect, supermarkets play an essential role by offering healthy and fresh foods at more competitive prices than smaller grocery stores or convenience stores [2]. However, supermarket access is not constant, but varies significantly across cities, resulting in dietary inequalities across urban neighborhoods. The body of knowledge thus far suggests that particularly people residing in socially-distressed neighborhoods (i.e., having a low socioeconomic status) as well as those neighborhoods where predominantly ethnic minorities live have poorer spatial supermarket accessibility. Such areas are often denoted as “food deserts” [3].
While food deserts seem to be omnipresent in the U.S., evidence concerning their existence in Canadian or European cities is mixed and far from conclusive [1]. Reasons for divergent findings include the applied methodology, which is mainly based on geographic information systems (GIS) to compute accessibility indicators, and the applied statistical models [4]. Present studies are often conceptually simple, applying a single accessibility measure on a less detailed analytical scale (e.g., administrative units). Therefore, multidimensional accessibility indicators combining proximity to, and density and variety of, supermarkets are suggested [5,6,7]. Although promoting a straightforward operationalization, food deserts are frequently identified by means of descriptive approaches (e.g., quartiles), disregarding that both accessibility and neighborhood characteristics are key for food desert mapping which calls for multivariate data clustering [4]. Finally, to the best of our knowledge, the conducted studies do not make the underlying research data (e.g., primary data, secondary data, and derived measures) available to the public, even though the reproducibility of findings on which knowledge is built is imperative, and a fundamental aspect in scientific investigations. Brunsdon [8] critically highlights several benefits when methods and data repositories are shared. The benefits include clear documentation, transparency concerning pre-processing, and the possibility to validate results, to apply alternative analytical approaches, to serve as a basis for follow-up studies, etc. All these issues will ultimately lead to more reliable research.
This data descriptor addresses the aforementioned research gaps by describing in detail and sharing the data related to the research article Food Deserts? Healthy Food Access in Amsterdam [9]. It describes both the data collection and the procedures used in pre-processing the data, and gives an overview of how the data can be used. Note that the interpretation of the results is given in the companion article. The provided data is not only relevant to map healthy food accessibility but is also of relevance for other studies dealing with, for example, the analyses of health behavior and can be linked to on-going area-based or register studies in Amsterdam.

2. Data Description

Table 1 summarizes key characteristics of the dataset.

3. Materials and Methods

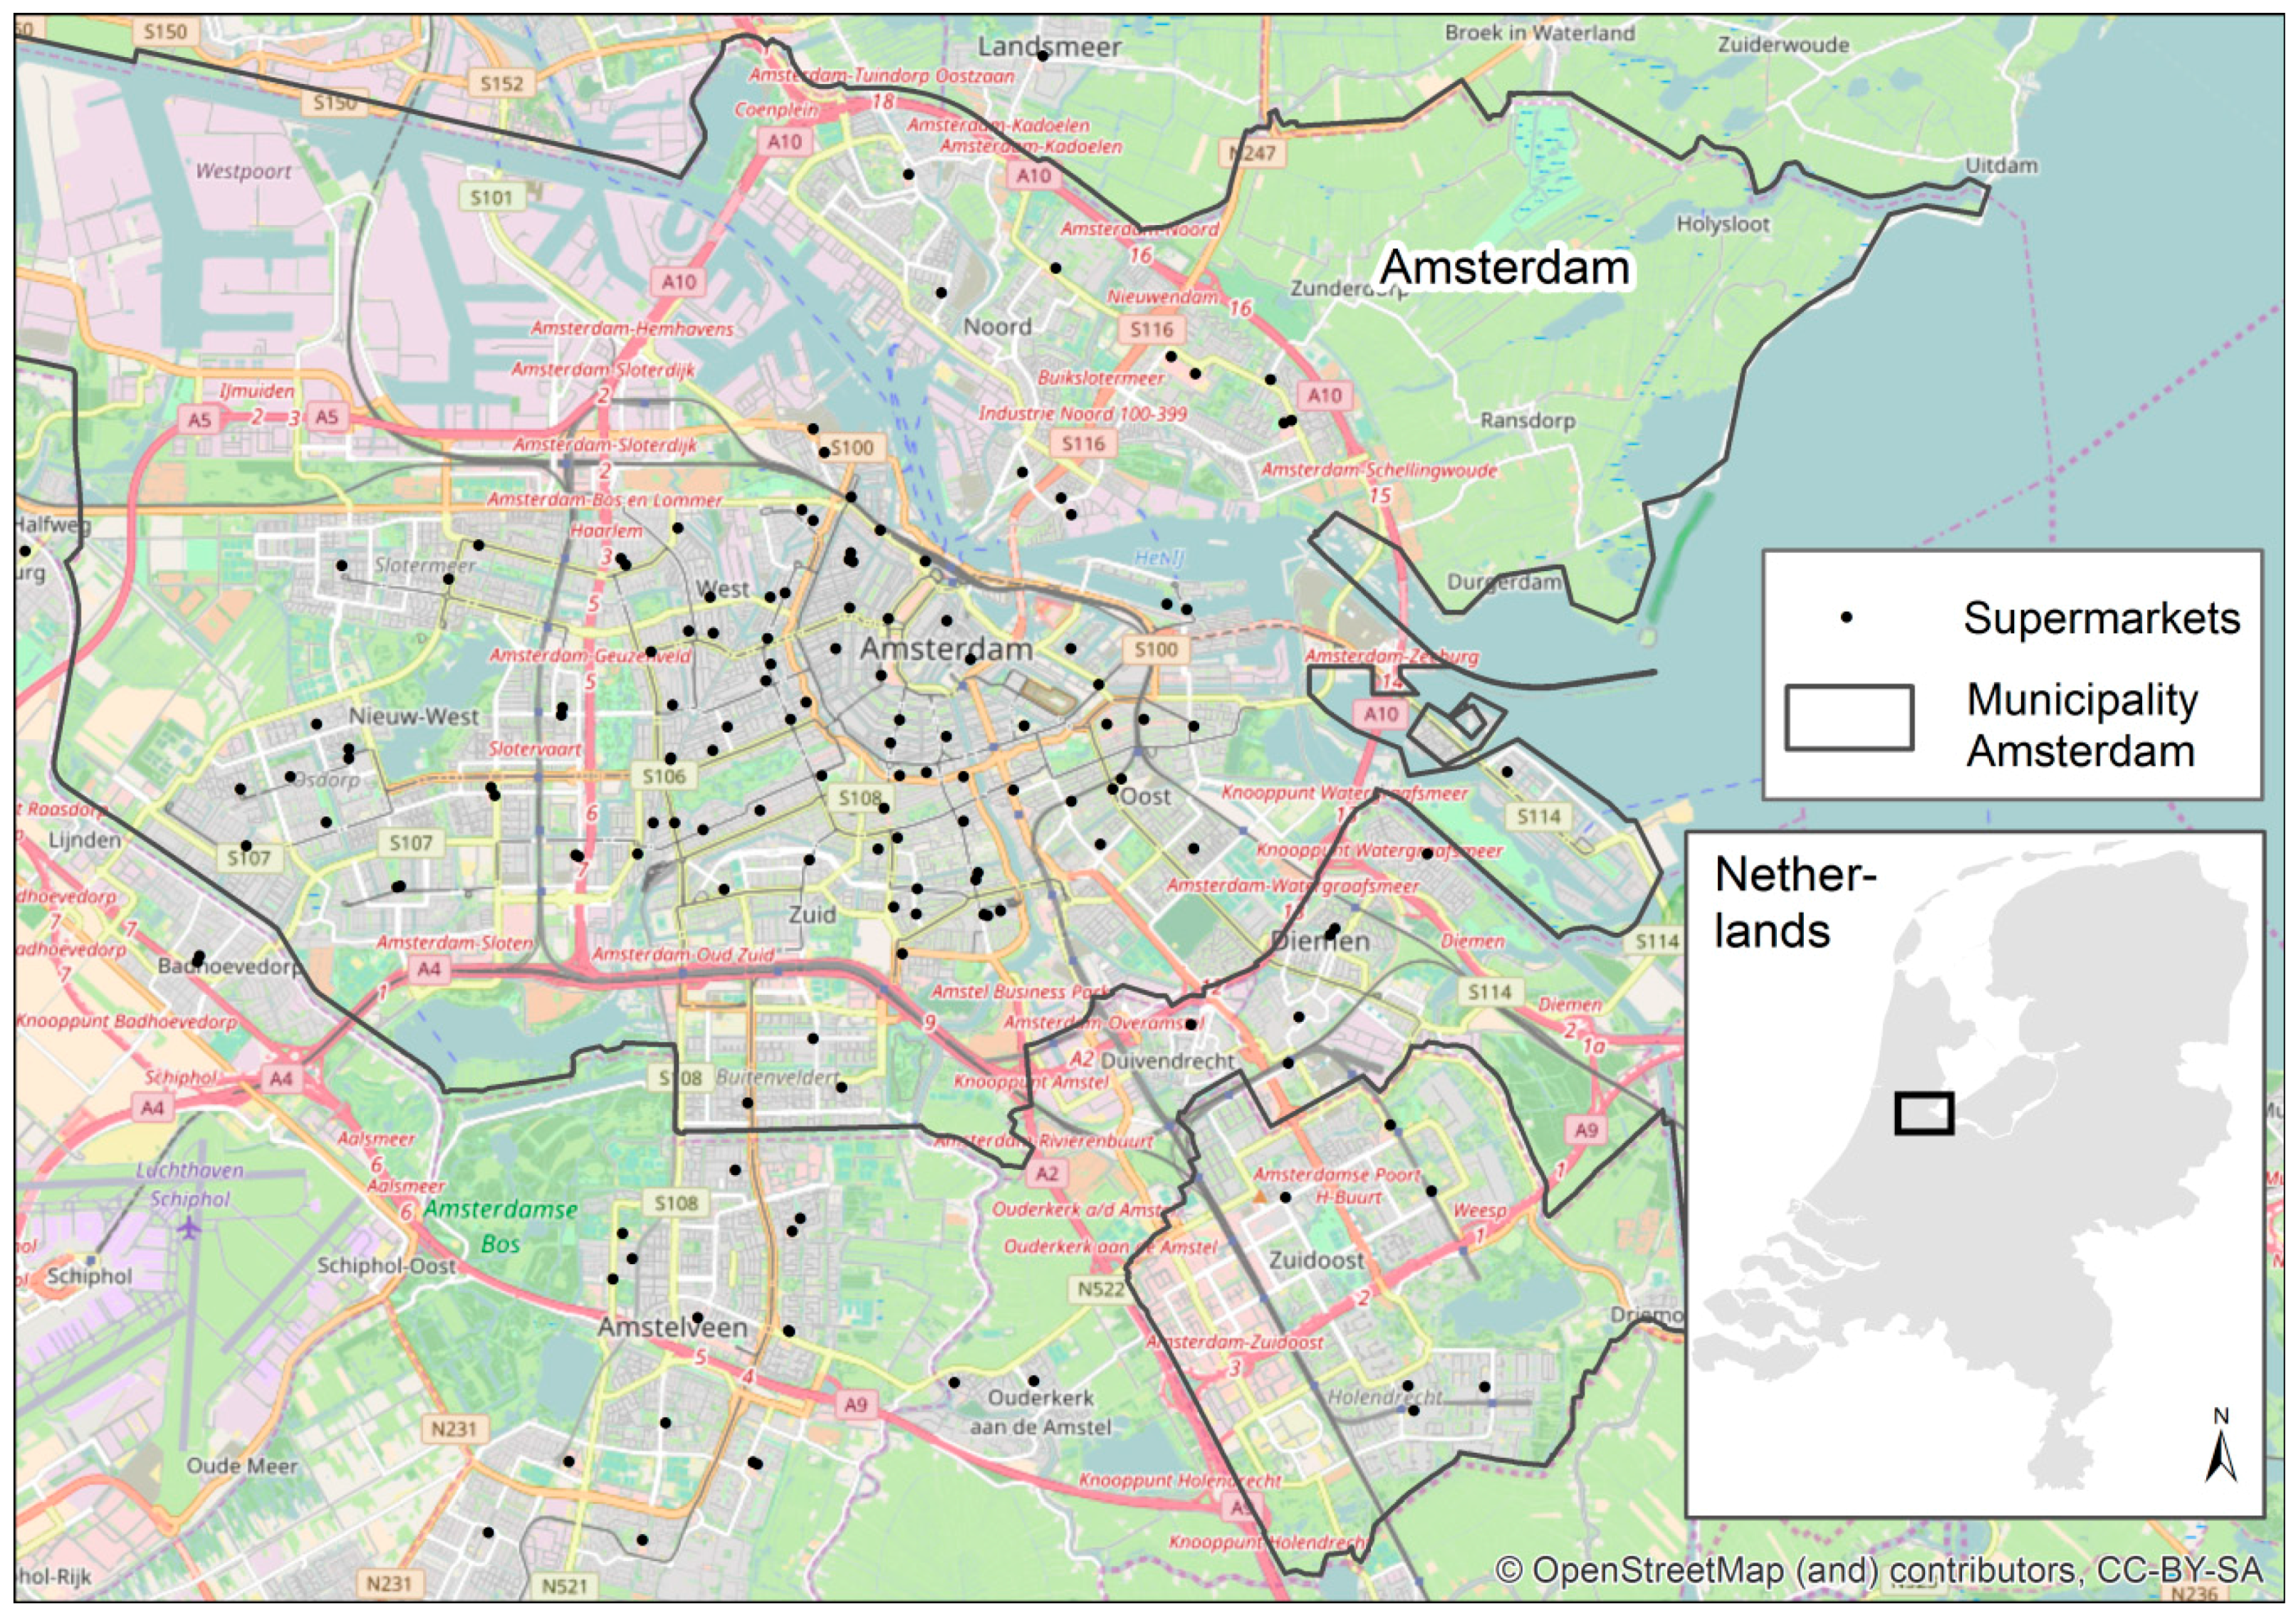
3.1. Study Area and Analysis Scale

The study area was the city of Amsterdam, The Netherlands. The city is located at 52°22′ N, 4°53′ O. Figure 1 shows the location of the study area. We selected Amsterdam because the health monitor [10] reported distinct differences in overweight and obesity prevalence. For example, 40% of the residents are overweight, and 75% of the adults do not consume the recommended amount of fruit and vegetables. Significant spatial variation in overweight prevalence exists as well. With 22% pronounced overweight, prevalence can be found in the central areas and the rates increase even further in the northern parts of Amsterdam.
In contrast to most food desert studies, we tried to circumvent methodological complications arising from the application of census areas (e.g., an uneven size). In order to go beyond administrative units, we overlaid the study area with a grid in which each cell had a spatial resolution of 100 × 100 m. Thus, information is available for 5242 cells in total. Note that the data provided here only includes cells where people reside; cells without a residential population were queried and excluded from further analyses. Furthermore, an ID (e.g., E1281N4931) introduced by Statistic Netherlands [11] was attached to each cell, allowing a straightforward linkage with other administrative data. The grid cells are provided as an ESRI™ shapefile and R data object (see Section 4).

3.2. Data Sources and Pre-Processing

3.2.1. Supermarket Data

The initial search for all supermarket chains operating in The Netherlands was guided by an overview published in Wikipedia [12] and the newspaper Levensmiddelen Krant [13]. The number of stores per supermarket chain located within the administrative unit of Amsterdam, including those within a buffer zone of two kilometers around the city, were collected. The consideration of a buffer zone was necessary to avoid edge effects for the accessibility measures. Due to theoretical considerations, organic supermarkets and “to go” stores were disregarded. Each company’s webpage was queried to obtain the store addresses (i.e., the street name and the building number). A total of 144 supermarkets were identified during the data collection phase in November 2015; of them, 122 are located within the administrative area of Amsterdam. Table 2 provides some information about the stores. The Dutch cadastral data Basisregistraties Adressen en Gebouwen [14] and ArcGIS Online were then used to convert the individual store addresses into geographic coordinates, which were then projected onto the local coordinate system (i.e., EPSG code 28992). A detailed description of the projection is given in Section 4.

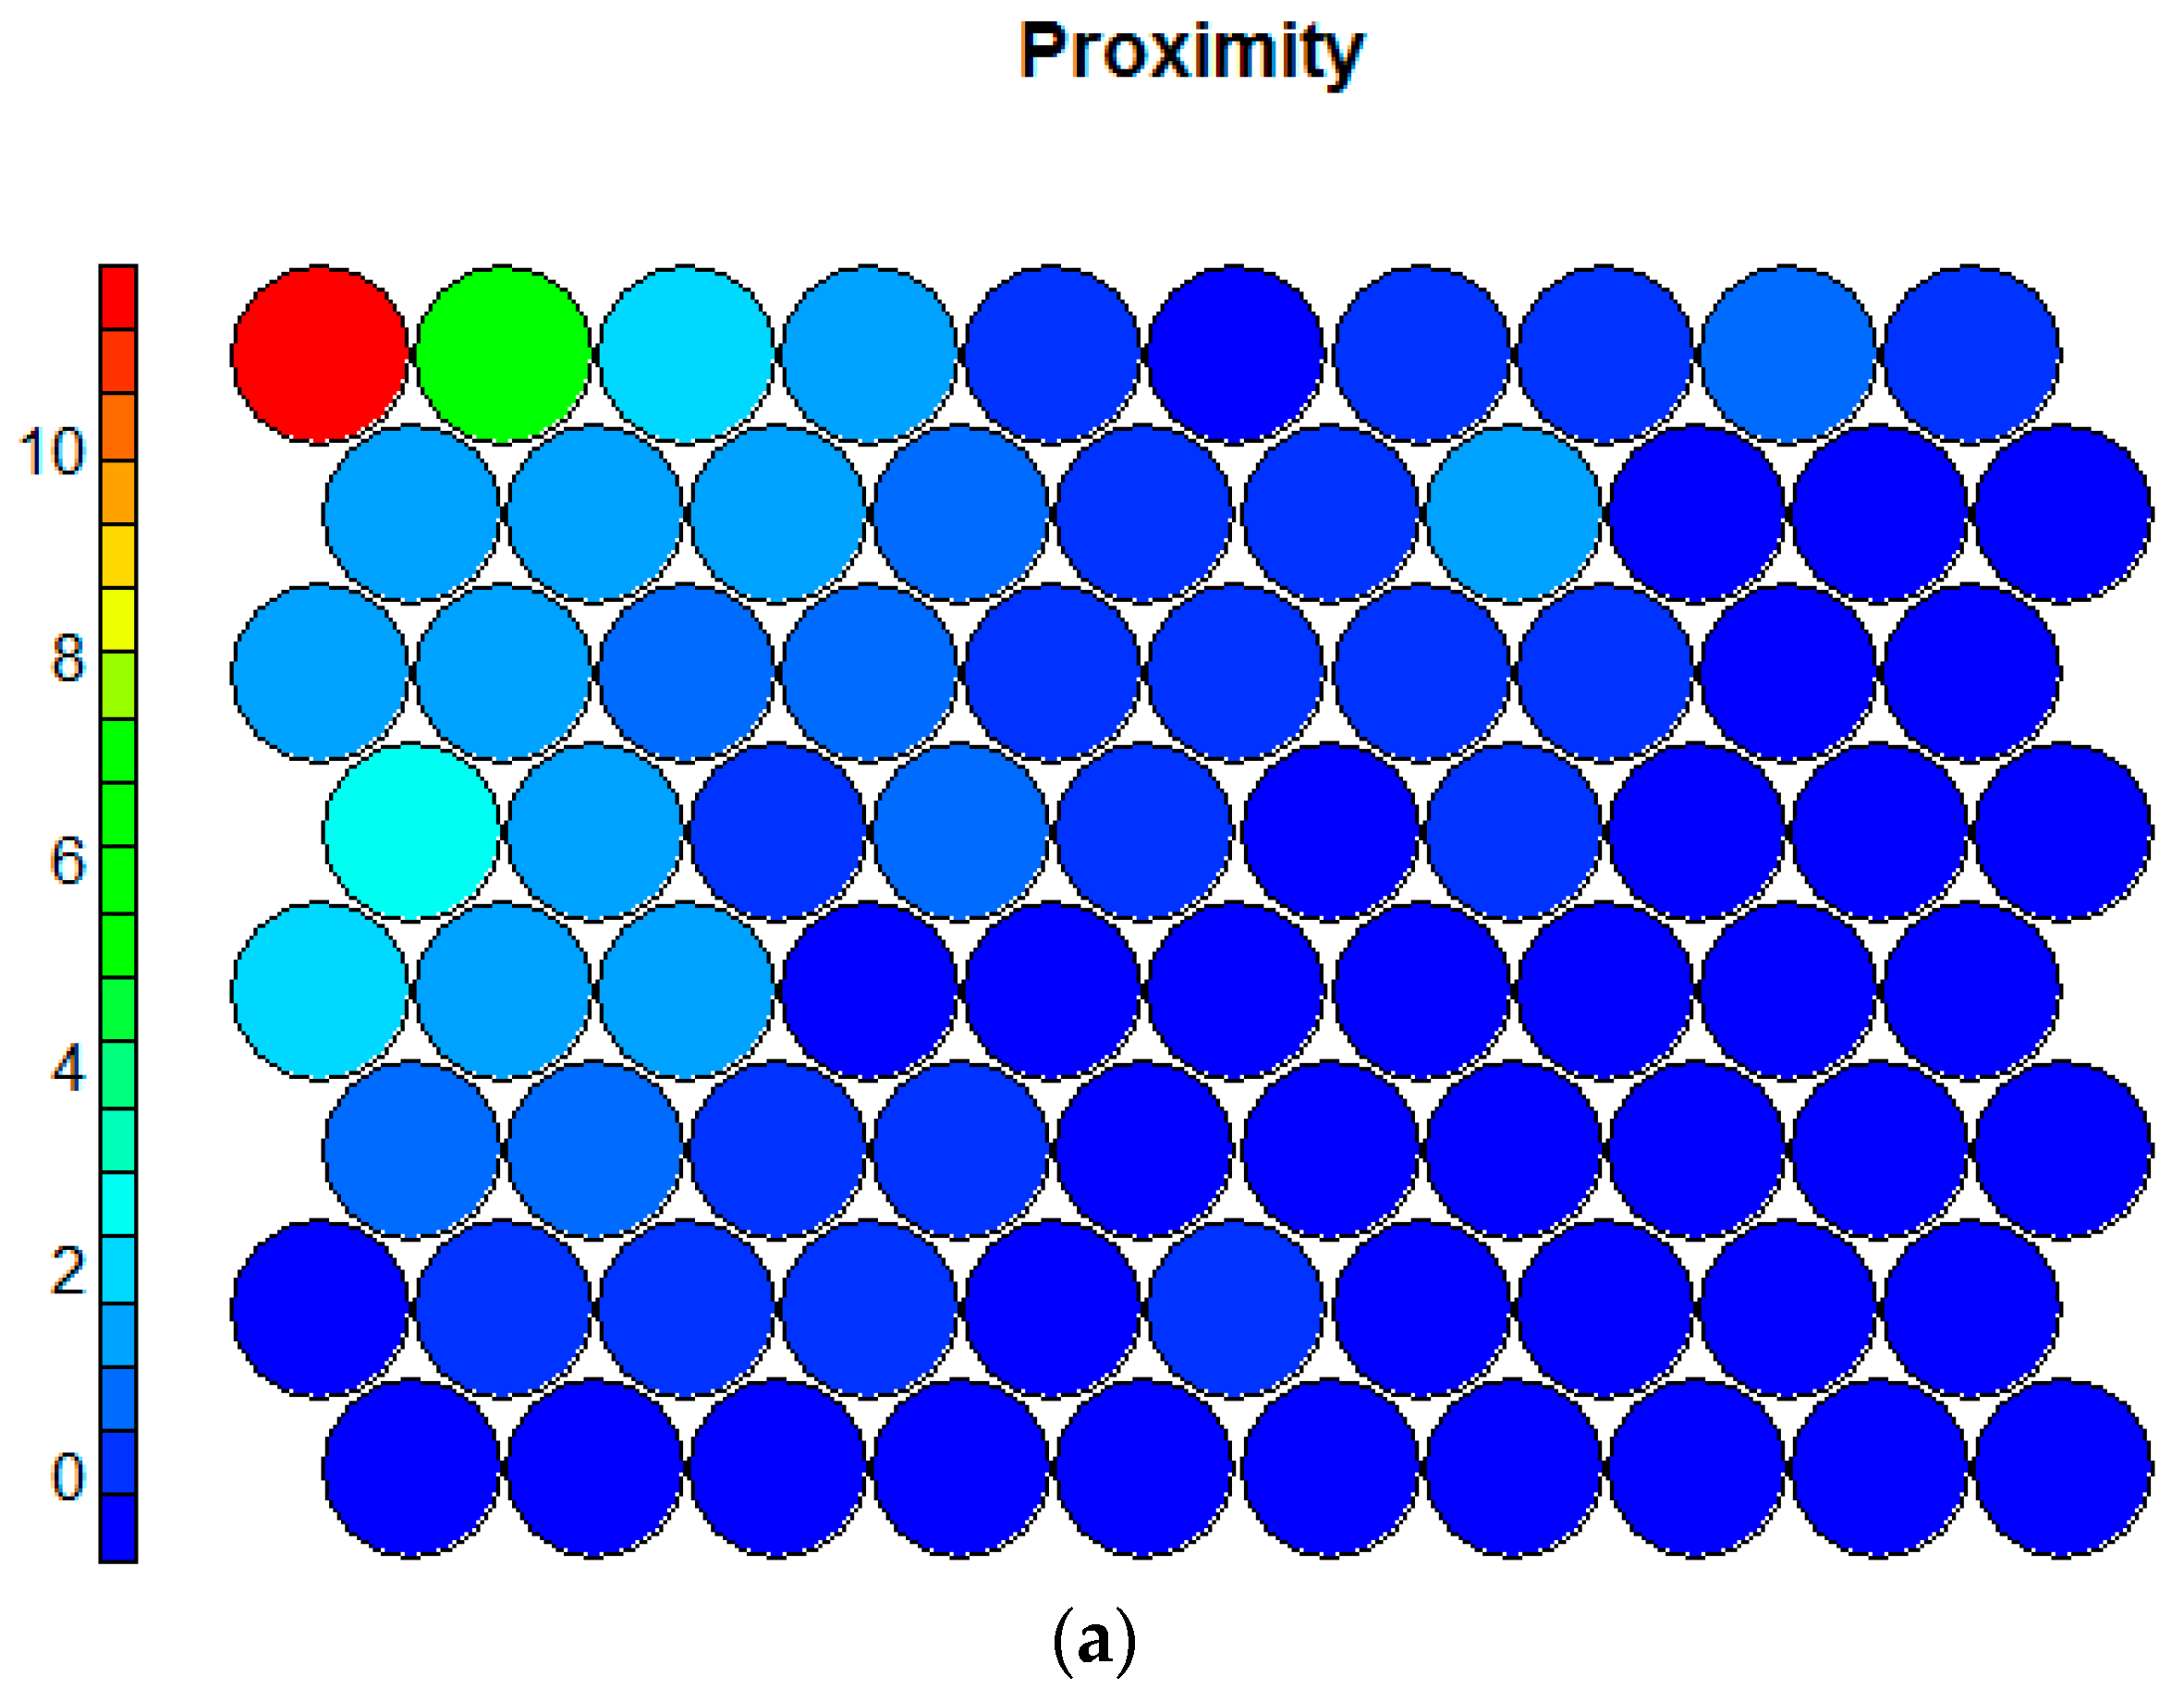
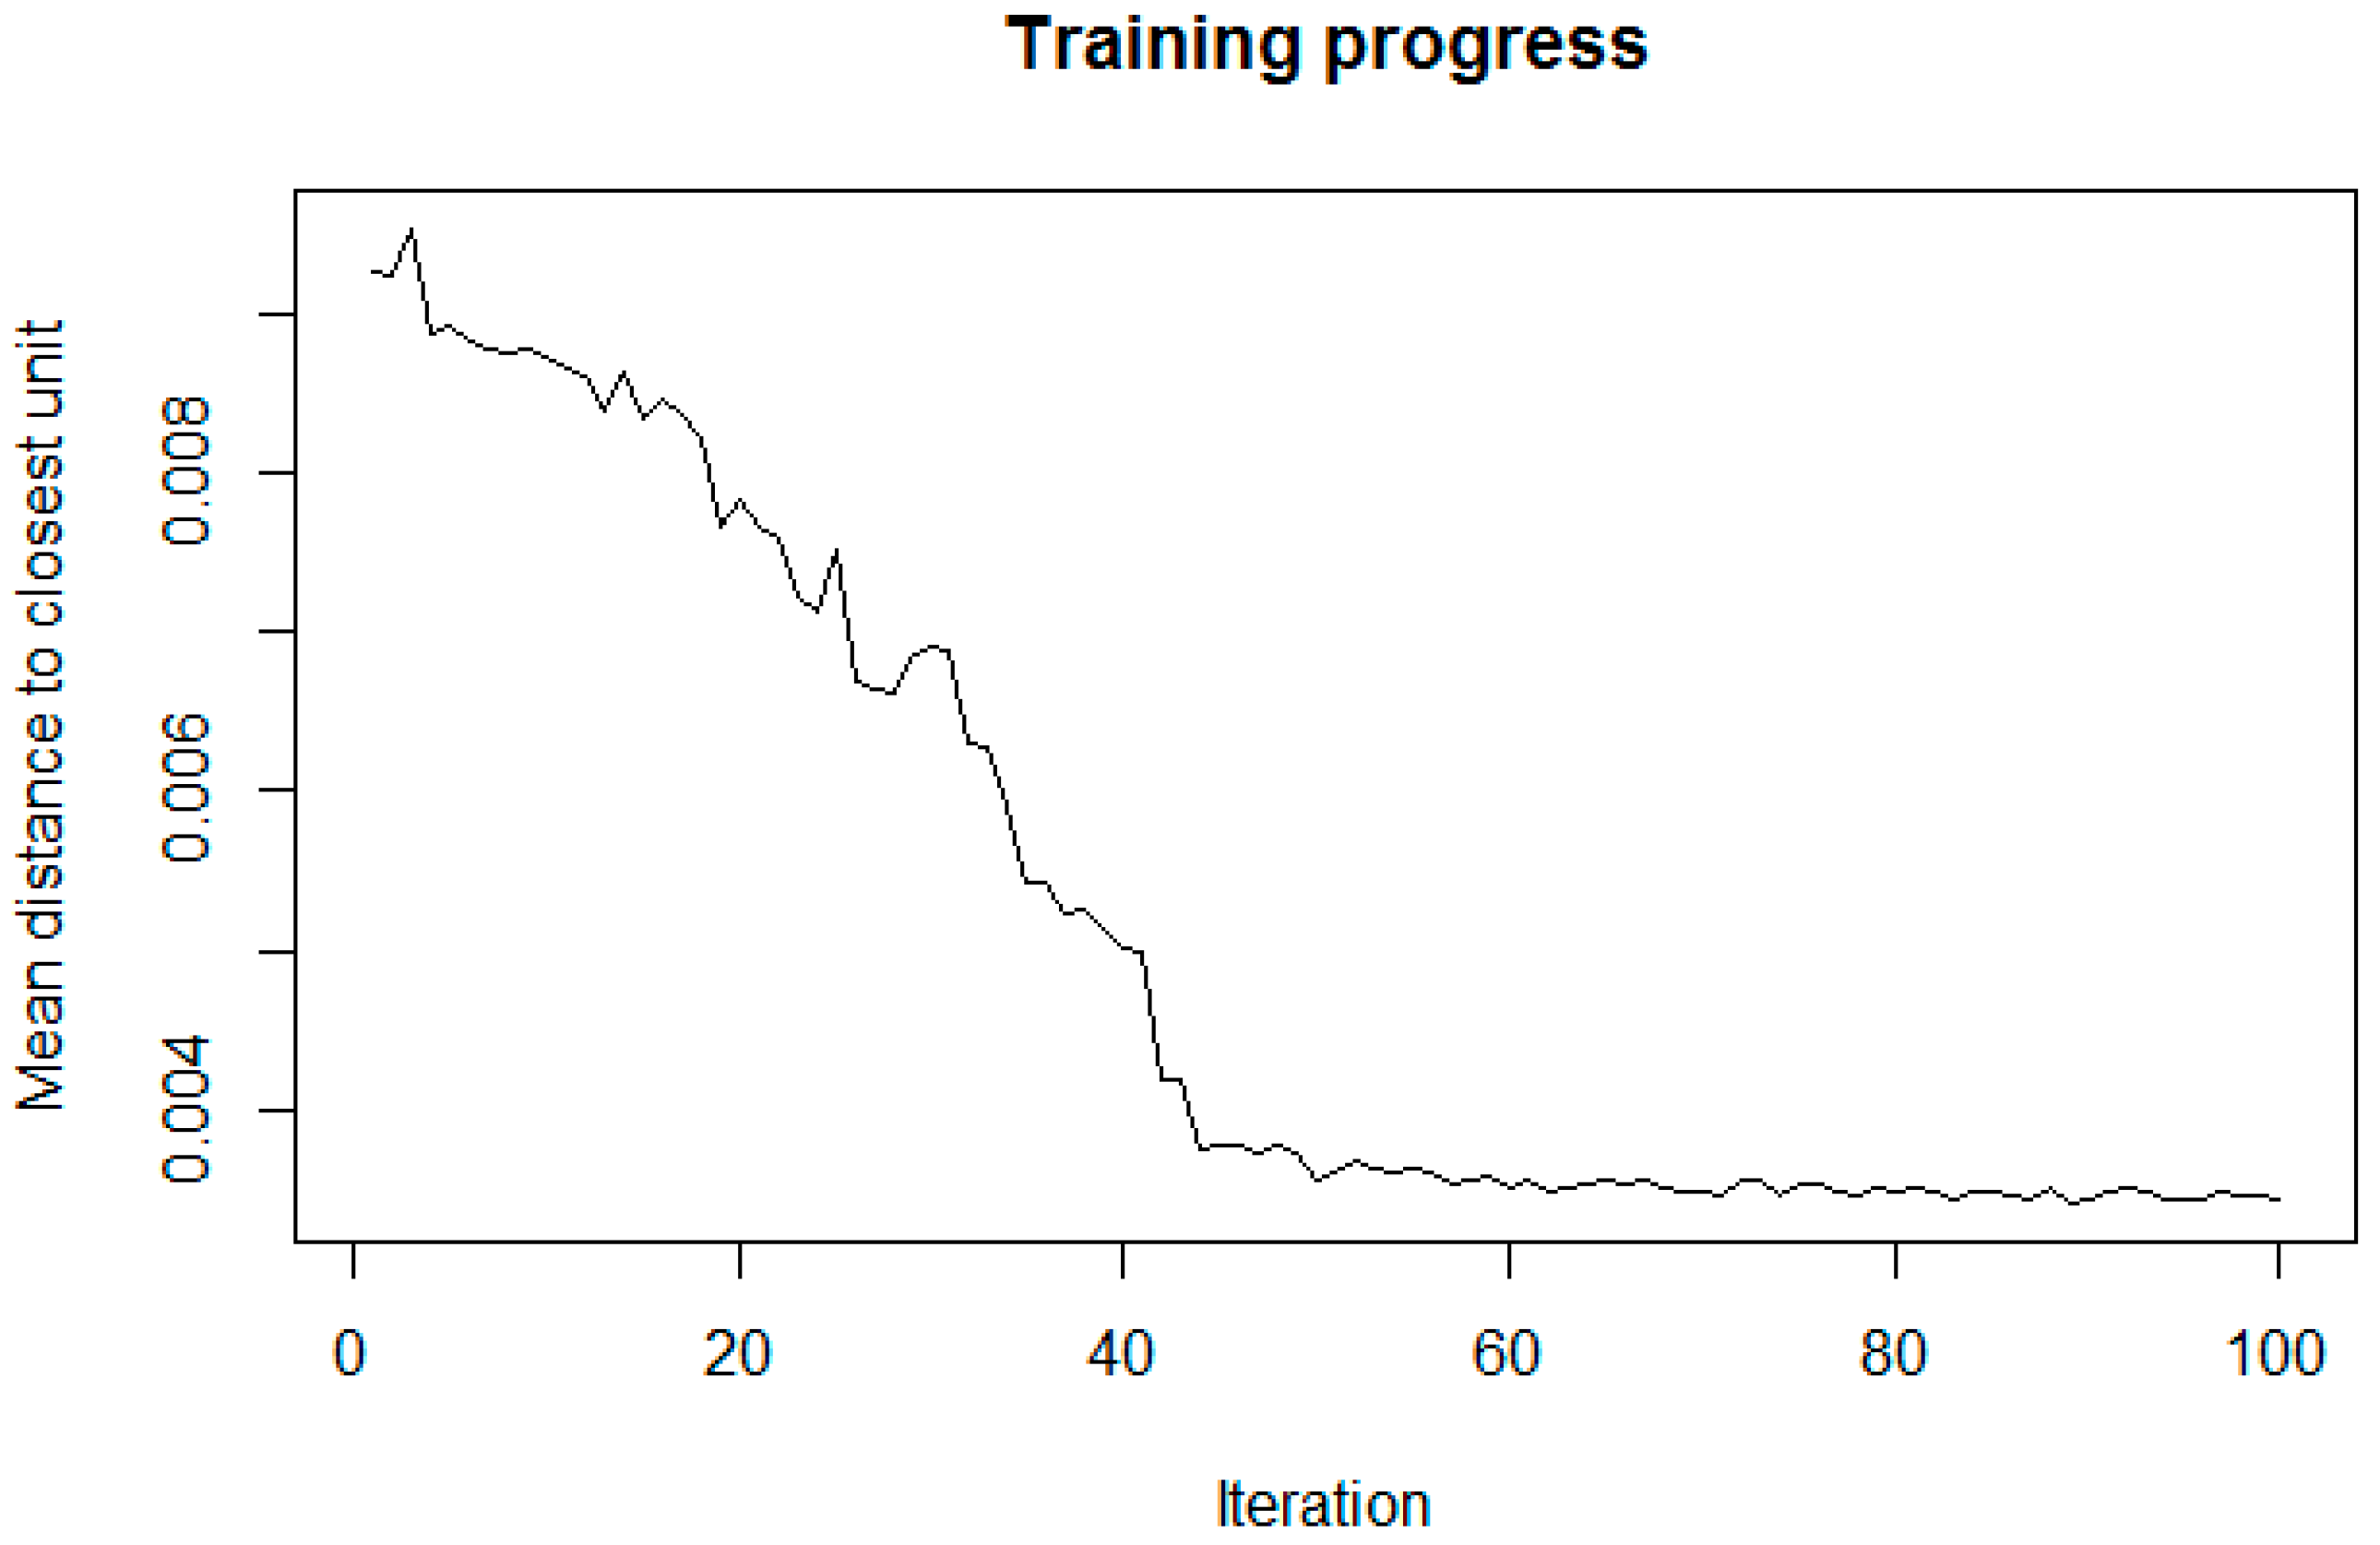
3.2.2. Accessibility Measures

For the accessibility measures, the coordinates of the centroid of each cell, serving as origin, were computed, while the supermarket locations served as destinations. The accessibility indicators were calculated on the basis of the street network provided by ESRI (version 2008) as input and a function iterated over all origins (cells).
Based on a literature review (e.g., [4,5]), three complementing supermarket accessibility measures were considered. The first indicator is based on the network distance (in meters) from cell i to the closest supermarket j of any chain (proximity measure). For the second measure, we first computed a street network buffer (service area) of 1000 m around each cell centroid, and then applied GIS-based point-in-polygon analyses to determine the number of available stores within this area (density measure). The threshold distance is based on a review of the literature and represents a 12-min walk for an adult [4]. The final accessibility measure differentiates between supermarket chains, and represents the mean network distance (in meters) from each centroid i to the three nearest supermarkets j from k different chains (variety measure). The variety measure considers that different chains offer different products.
To derive these measures, the ArcGIS 10.3 network analyst extension was used with the centroids as incidents and the supermarket locations as facilities. For all analyses, all the routing restrictions were disabled (e.g., one-ways).

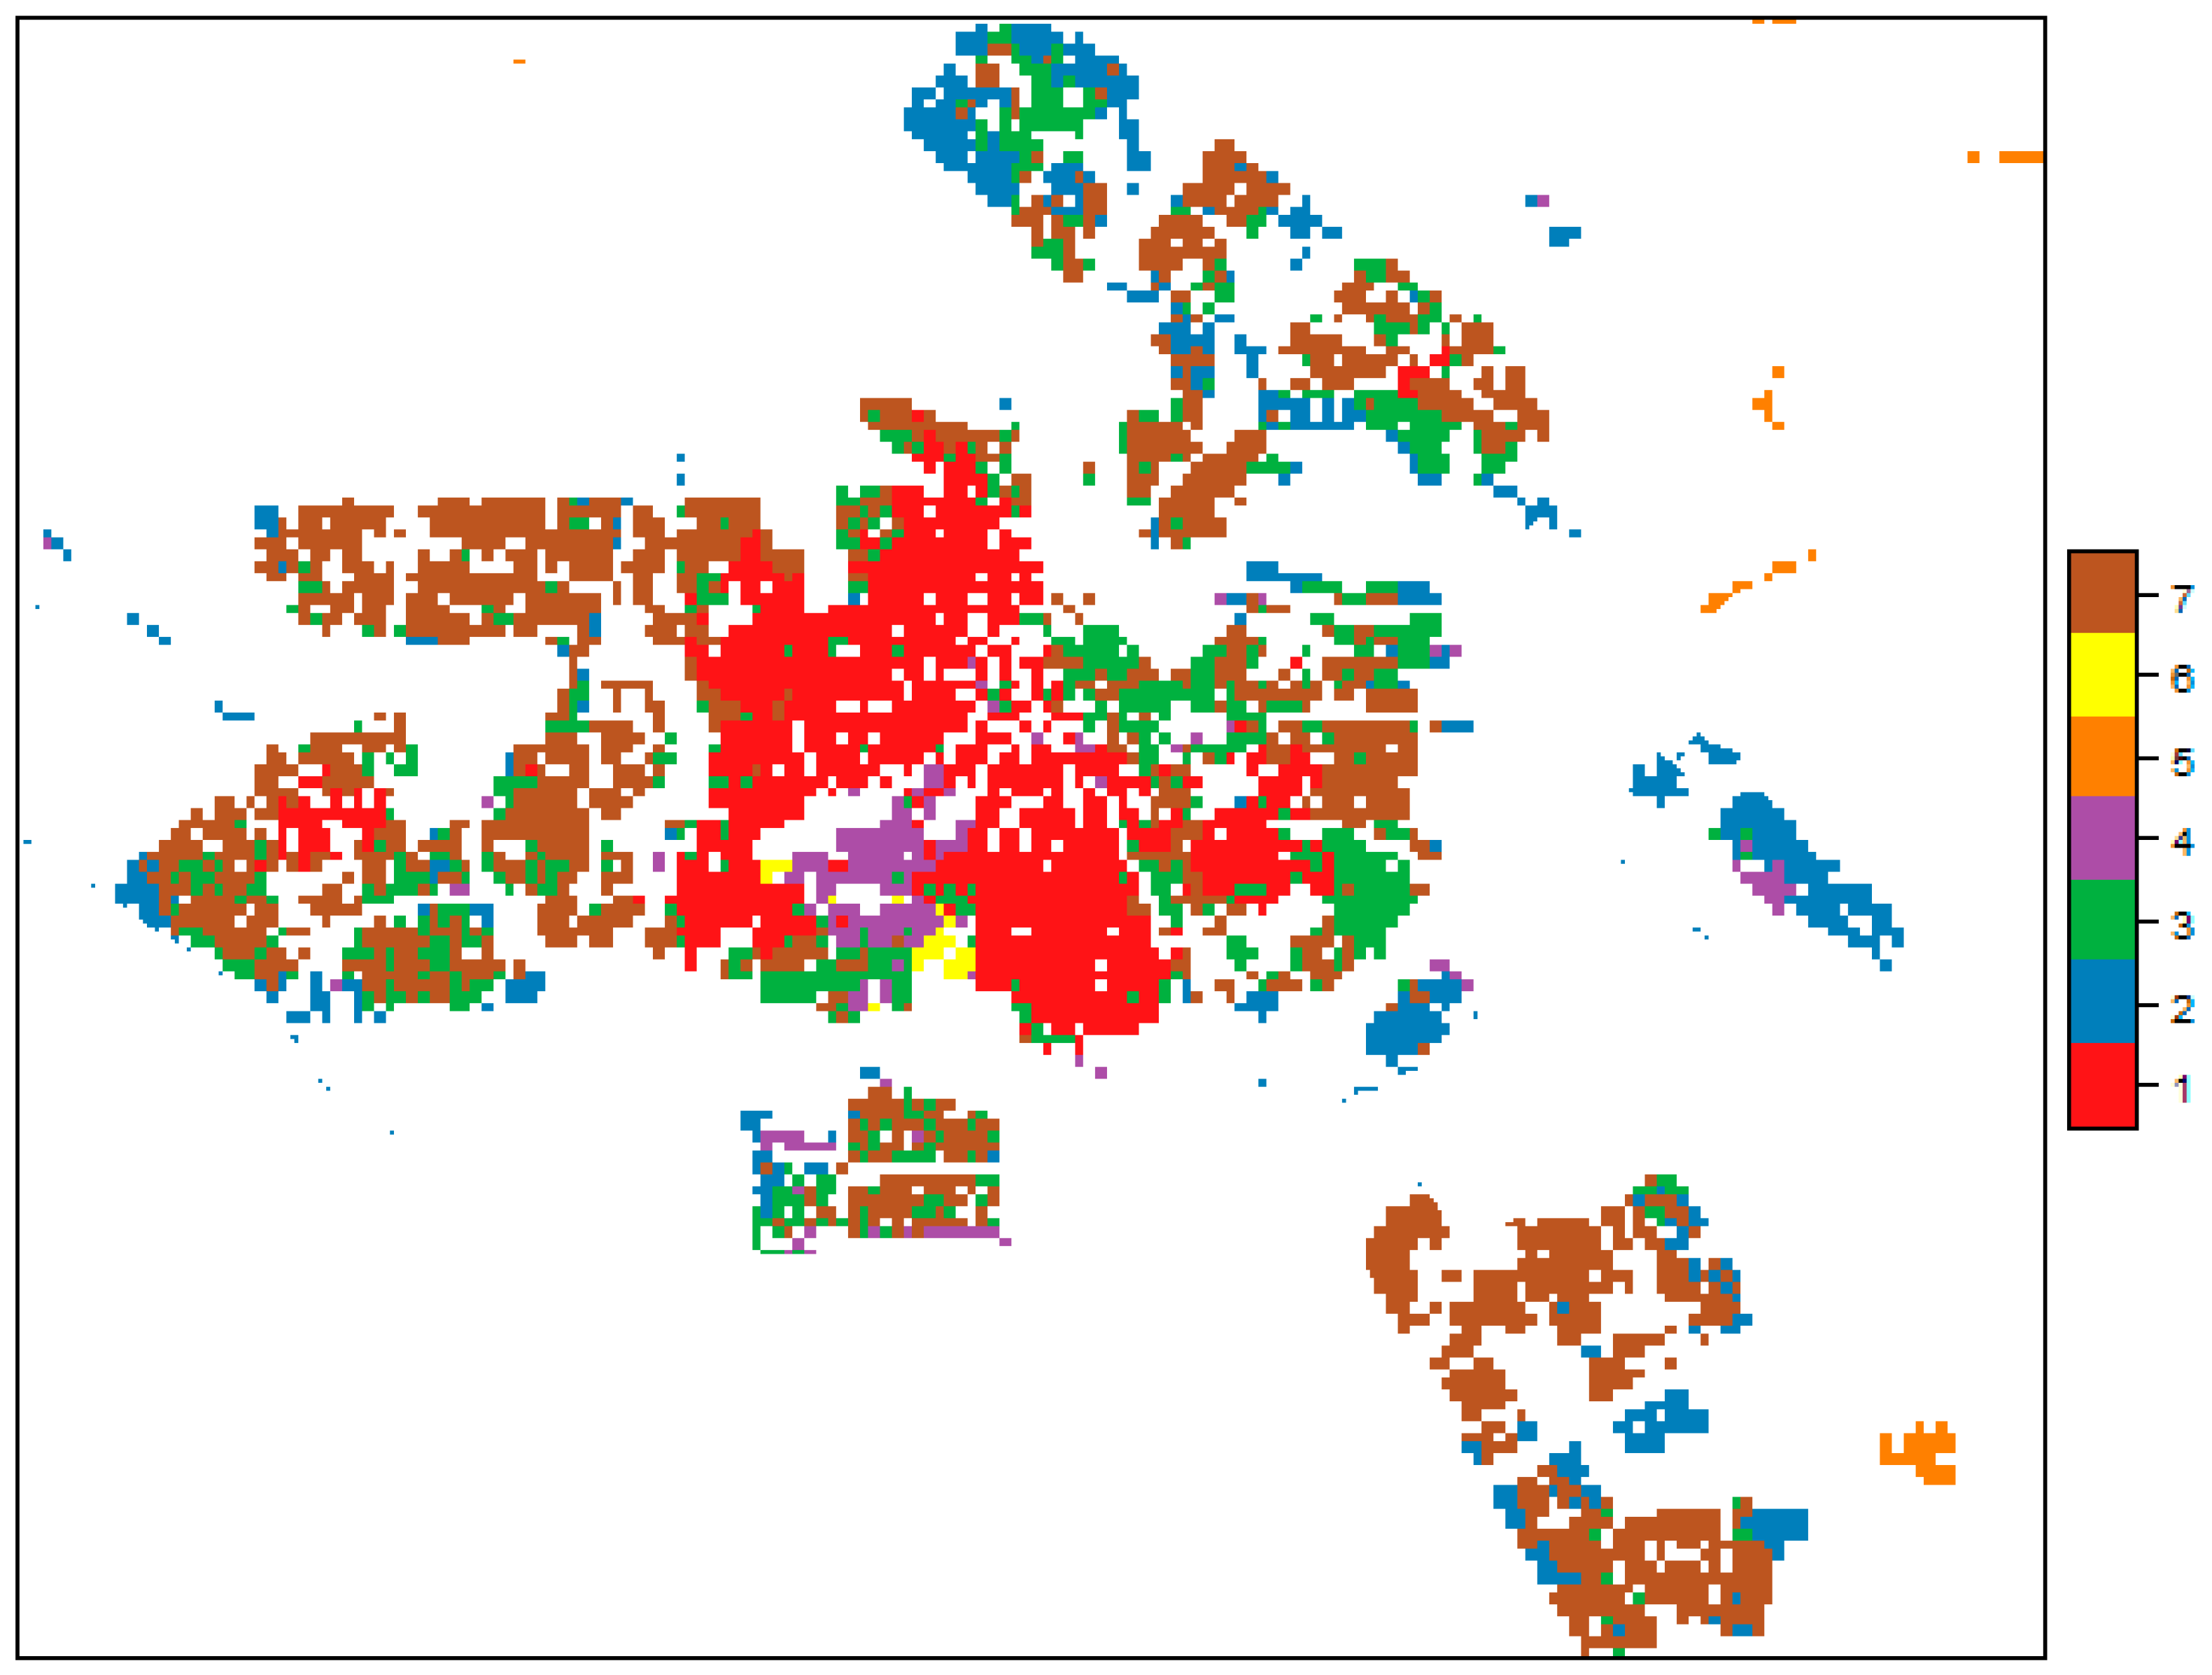
3.2.3. Neighborhood Data

We extracted neighborhood information for two variables for each cell from the raster dataset (vierkanten) maintained by Statistics Netherlands (www.cbs.nl) [11].
The first variable represents ethnicity and is based on the municipal personal records database (Structuurtelling Gemeentelijke Basisadministratie). The variable ethnicity represents the proportion of autochthons, that is, the proportion of people whose parents were born in The Netherlands, irrespective of their country of origin [11]. The variable was originally coded as follows: (1) ≥90% autochthons; (2) 75%–90% autochthons; (3) 60%–75% autochthons; (4) 40%–60% autochthons; and (5) <40% autochthons. In order to perform statistical analyses, the initial classes were reclassified from a string data type to integer values ranging from 1 (i.e., ≥90% natives) to 5 (i.e., <40%).
The second variable is the average housing value per cell, mimicking area-based socioeconomic status. The housing values are in €1000. To be considered a building, the construction must have at least 14 m2 of living space, a toilet, a kitchen, etc. For each cell, the average housing value in the year 2011/12 is given. It represents the average housing value on the basis of the property register (Woningregister), which includes only houses that serve as main residences and in which no commercial activities take place. For a detailed discussion, see the original data description [11].

4. Data Usage and Application

To be independent of proprietary software and to facilitate easy use of the data, we compiled the dataset for the R language and environment for statistical computing [15]. The R software is open-source, is available for all platforms, can be extended with a myriad of add-on packages, etc. The data is shipped as zipped shapefile and R data object. The R object represents a SpatialPolygonsDataFrame comprising both locational information (i.e., cells) and attached attribute information. To access and illustrate the usage of the data, this section provides R code and briefly shows an alternative analysis.
While the original research paper [9] applied contextual neural gas [16,17] to account for spatial autocorrelation [18], we complement this spatially explicit approach with a non-spatial analysis using widely applied self-organizing maps (SOMs) [19,20] (other options can be found in [21]). A SOM is an unsupervised artificial neural network for data clustering and visualization [19]. However, the interpretation of the results is beyond the scope of this article and can be found elsewhere [9]. Note that the supermarket location data can also be used to apply, for example, cluster detection algorithms [22,23]. To facilitate quick access and use, the first code snippet loads the required R packages [24,25,26,27,28], sets the workspace, and unzips the data.
Data 02 00007 i001
The ESRI shapefile is then read from the workspace and the projection is queried. The bounding box of the extended study area is also plotted.
Data 02 00007 i002
Additional summary statistics of the variables are reported below.
Data 02 00007 i003
Data 02 00007 i004
Next, the input variables for the SOM are selected. These variables are scaled before the SOM topology (10 × 8) is set up. This grid serves as input for the SOM algorithm.
Data 02 00007 i005
The key strengths of SOMs are their rich visualization capabilities. The SOM training progress in Figure 2 shows considerable improvements after a few iterations and convergence after approximately 50 training cycles. Moreover, the U-matrix [19] can be plotted to investigate clusters, while the component planes are useful to discover correlations among the variables. Figure 3 depicts two component planes as an example.
Data 02 00007 i006
Data 02 00007 i007
Data 02 00007 i008
In the next step, the grid of the SOM is clustered by means of the k-means algorithm. To analyze an appropriate number of clusters, we loop through between two and ten clusters, and for each clustering, the within cluster sum of squares is computed. Plotting these values shows an elbow at seven clusters, referring to a suitable solution.
Data 02 00007 i009
The clustering results are matched with the initial data and visualized as the geographic map shown in Figure 4.
Data 02 00007 i010
Data 02 00007 i011
Exploring the descriptives of each cluster indicate that cluster 5 could be related to pockets of food deserts, even though the corresponding cells are exclusively located in the urban periphery. This challenges the classic interpretation of food deserts but confirms differences in spatial accessibility to healthy food supplied by supermarkets and area-based socioeconomic characteristics within the city of Amsterdam. In conclusion, no empirical evidence was found supporting the notion of pronounced inequalities in access to healthy food.

Acknowledgments

This study was supported by the interdisciplinary research program Healthy Urban Living of Utrecht University (www.uu.nl/hul).

Author Contributions

M.H. developed the idea and the study design. M.H. and J.H. did the data analysis. M.H. wrote the first draft of the manuscript. Both authors read and approved the final manuscript.

Conflicts of Interest

The authors declare no conflict of interest.

References

  1. Beaulac, J.; Kristjansson, E.; Cummins, S. A systematic review of food deserts: 1966–2007. Prev. Chronic Dis. 2009, 6, 1–10. [Google Scholar]
  2. Zenk, S.N.; Schulz, A.J.; Israel, B.A.; James, S.A.; Bao, S.; Wilson, M.L. Neighborhood racial composition, neighborhood poverty, and the spatial accessibility of supermarkets in metropolitan Detorit. Am. J. Public Health 2005, 95, 660–667. [Google Scholar] [CrossRef] [PubMed]
  3. Cummins, S.; Macintyre, S. “Food deserts”—Evidence and assumption in health policy making. Br. Med. J. 2002, 25, 436–438. [Google Scholar] [CrossRef]
  4. Charreire, H.; Casey, R.; Salze, P.; Simon, C.; Chaix, B.; Banos, A.; Badariotti, D.; Weber, C.; Oppert, J.M. Measuring the food environment using geographical information systems: A methodological review. Public Health Nutr. 2010, 13, 1773–1785. [Google Scholar] [CrossRef] [PubMed]
  5. Apparicio, P.; Cloutier, M.; Shearmur, R. The case of Montreal’s missing food deserts: Evaluation of accessibility to food supermarkets. Int. J. Health Geogr. 2007, 6, 4. [Google Scholar] [CrossRef] [PubMed]
  6. Russell, S.; Heidkamp, C. “Food desertification”: The loss of a major supermarket in New Haven, Connecticut. Appl. Geogr. 2011, 31, 1197–1209. [Google Scholar] [CrossRef]
  7. Wang, H.; Qiu, F.; Swallow, B. Can community gardens and farmers’ markets relieve food desert problems? A study of Edmonton, Canada. Appl. Geogr. 2014, 55, 127–137. [Google Scholar] [CrossRef]
  8. Brunsdon, C. Quantitative methods I: Reproducible research and quantitative geography. Prog. Hum. Geogr. 2015, 1–10. [Google Scholar] [CrossRef]
  9. Helbich, M.; Schadenberg, B.; Hagenauer, J.; Poelman, M. Food Deserts? Healthy Food Access in Amsterdam. 2017. under revision. [Google Scholar]
  10. GGD Amsterdam. Amsterdammers Gezond en Wel? Available online: http://www.ggd.amsterdam.nl/beleid-onderzoek/gezondheidsmonitors/amsterdamse/ (accessed on 2 October 2016).
  11. Centraal Bureau voor de Statistiek. Statistische Gegevens per Vierkant. Den Haag/Heerlen. Available online: http://www.cbs.nl/NR/rdonlyres/E29D852E-0AD5–40AD-AF57-C42F811487B6/0/Statistischegegevenspervierkantupdateoktober2014.pdf (accessed on 2 October 2016).
  12. Wikipedia. Lijst van Supermarkten. Available online: https://nl.wikipedia.org/wiki/Lijst_van_supermarkten (accessed on 2 October 2016).
  13. Levensmiddelen Krant. Available online: http://www.levensmiddelenkrant.nl/ (accessed on 2 October 2016).
  14. BAG. Kadaster. Available online: https://www.kadaster.nl/bag (accessed on 2 October 2016).
  15. R Core Team. R: A Language and Environment for Statistical Computing; R Foundation for Statistical Computing: Vienna, Austria. Available online: http://www.R-project.org/ (accessed on 2 October 2016).
  16. Hagenauer, J.; Helbich, M. Contextual neural gas for spatial clustering and analysis. Int. J. Geogr. Inf. Sci. 2013, 27, 251–266. [Google Scholar] [CrossRef]
  17. Hagenauer, J.; Helbich, M. SPAWNN: A toolkit for spatial analysis with self-organizing neural networks. Trans. GIS 2016, 20, 755–774. [Google Scholar] [CrossRef]
  18. Helbich, M.; Blüml, V.; Leitner, M.; Kapusta, N.; Stadsgeografie, S. Does altitude moderate the impact of lithium on suicide? The case of Austria. Geospat. Health 2013, 7, 209–218. [Google Scholar] [CrossRef] [PubMed]
  19. Kohonen, T. Self-Organizing Maps; Springer: New York, NY, USA, 2001. [Google Scholar]
  20. Helbich, M.; Hagenauer, J.; Leitner, M.; Edward, R. Exploration of unstructured narrative crime reports—An unsupervised neural network and point pattern analysis approach. Cartogr. Geogr. Inf. Sci. 2013, 40, 326–336. [Google Scholar] [CrossRef]
  21. Helbich, M.; Brunauer, W.; Hagenauer, J.; Leitner, M. Data-driven regionalization of housing markets. Ann. Assoc. Am. Geogr. 2013, 103, 871–889. [Google Scholar] [CrossRef]
  22. Kulldorff, M. A spatial scan statistic. Commun. Stat. Theory Methods 1997, 26, 1481–1496. [Google Scholar] [CrossRef]
  23. Helbich, M. Beyond postsuburbia? Multifunctional service agglomeration in Vienna’s urban fringe. Tijdschrift voor Economische en Sociale Geografie 2012, 103, 39–52. [Google Scholar] [CrossRef]
  24. Pebesma, E.; Bivand, R. Classes and methods for spatial data in R. R News 2005, 5. Available online: http://cran.r-project.org/doc/Rnews/ (accessed on 10 October 2016). [Google Scholar]
  25. Bivand, R.; Keitt, T.; Rowlingson, B. Rgdal: Bindings for the Geospatial Data Abstraction Library. R Package Version 1.1-10. 2016. Available online: https://CRAN.R-project.org/package=rgdal (accessed on 10 October 2016).
  26. Bivand, R.; Piras, G. Comparing implementations of estimation methods for spatial econometrics. J. Stat. Softw. 2015, 63, 1–36. [Google Scholar] [CrossRef]
  27. Wehrens, R.; Buydens, L. Self- and super-organising maps in R: The kohonen package. J. Stat. Softw. 2007, 21, 1–19. [Google Scholar] [CrossRef]
  28. Neuwirth, E. RColorBrewer: ColorBrewer Palettes. R Package Version 1.1-2. 2014. Available online: https://CRAN.R-project.org/package=RColorBrewer (accessed on 10 October 2016).
Figure 1. Study area.
Data 02 00007 g001
Figure 2. Training progress of the self-organizing map.
Data 02 00007 g002
Figure 3. Component planes for the variables (a) proximity and (b) density.
Data 02 00007 g003aData 02 00007 g003b
Figure 4. Result of the SOM-based clustering.
Data 02 00007 g004
Table 1. Metadata specification.
Key FeaturesDescription
Subject areaHealth, nutrition, geography, transportation
Data source locationAmsterdam, The Netherlands
Data acquisitionDerived attributes and official data (Statistic Netherlands)
Type and formatR object (SpatialPolygonsDataFrame), ESRI™ shapefile
Spatial resolutioncells with 100 m widths
Dimension5242 × 8
Projection and reference systemEPSG code: 28992
Attributes
 Proximity (PROX)Numeric, distance to the closest supermarket from each cell (in meters)
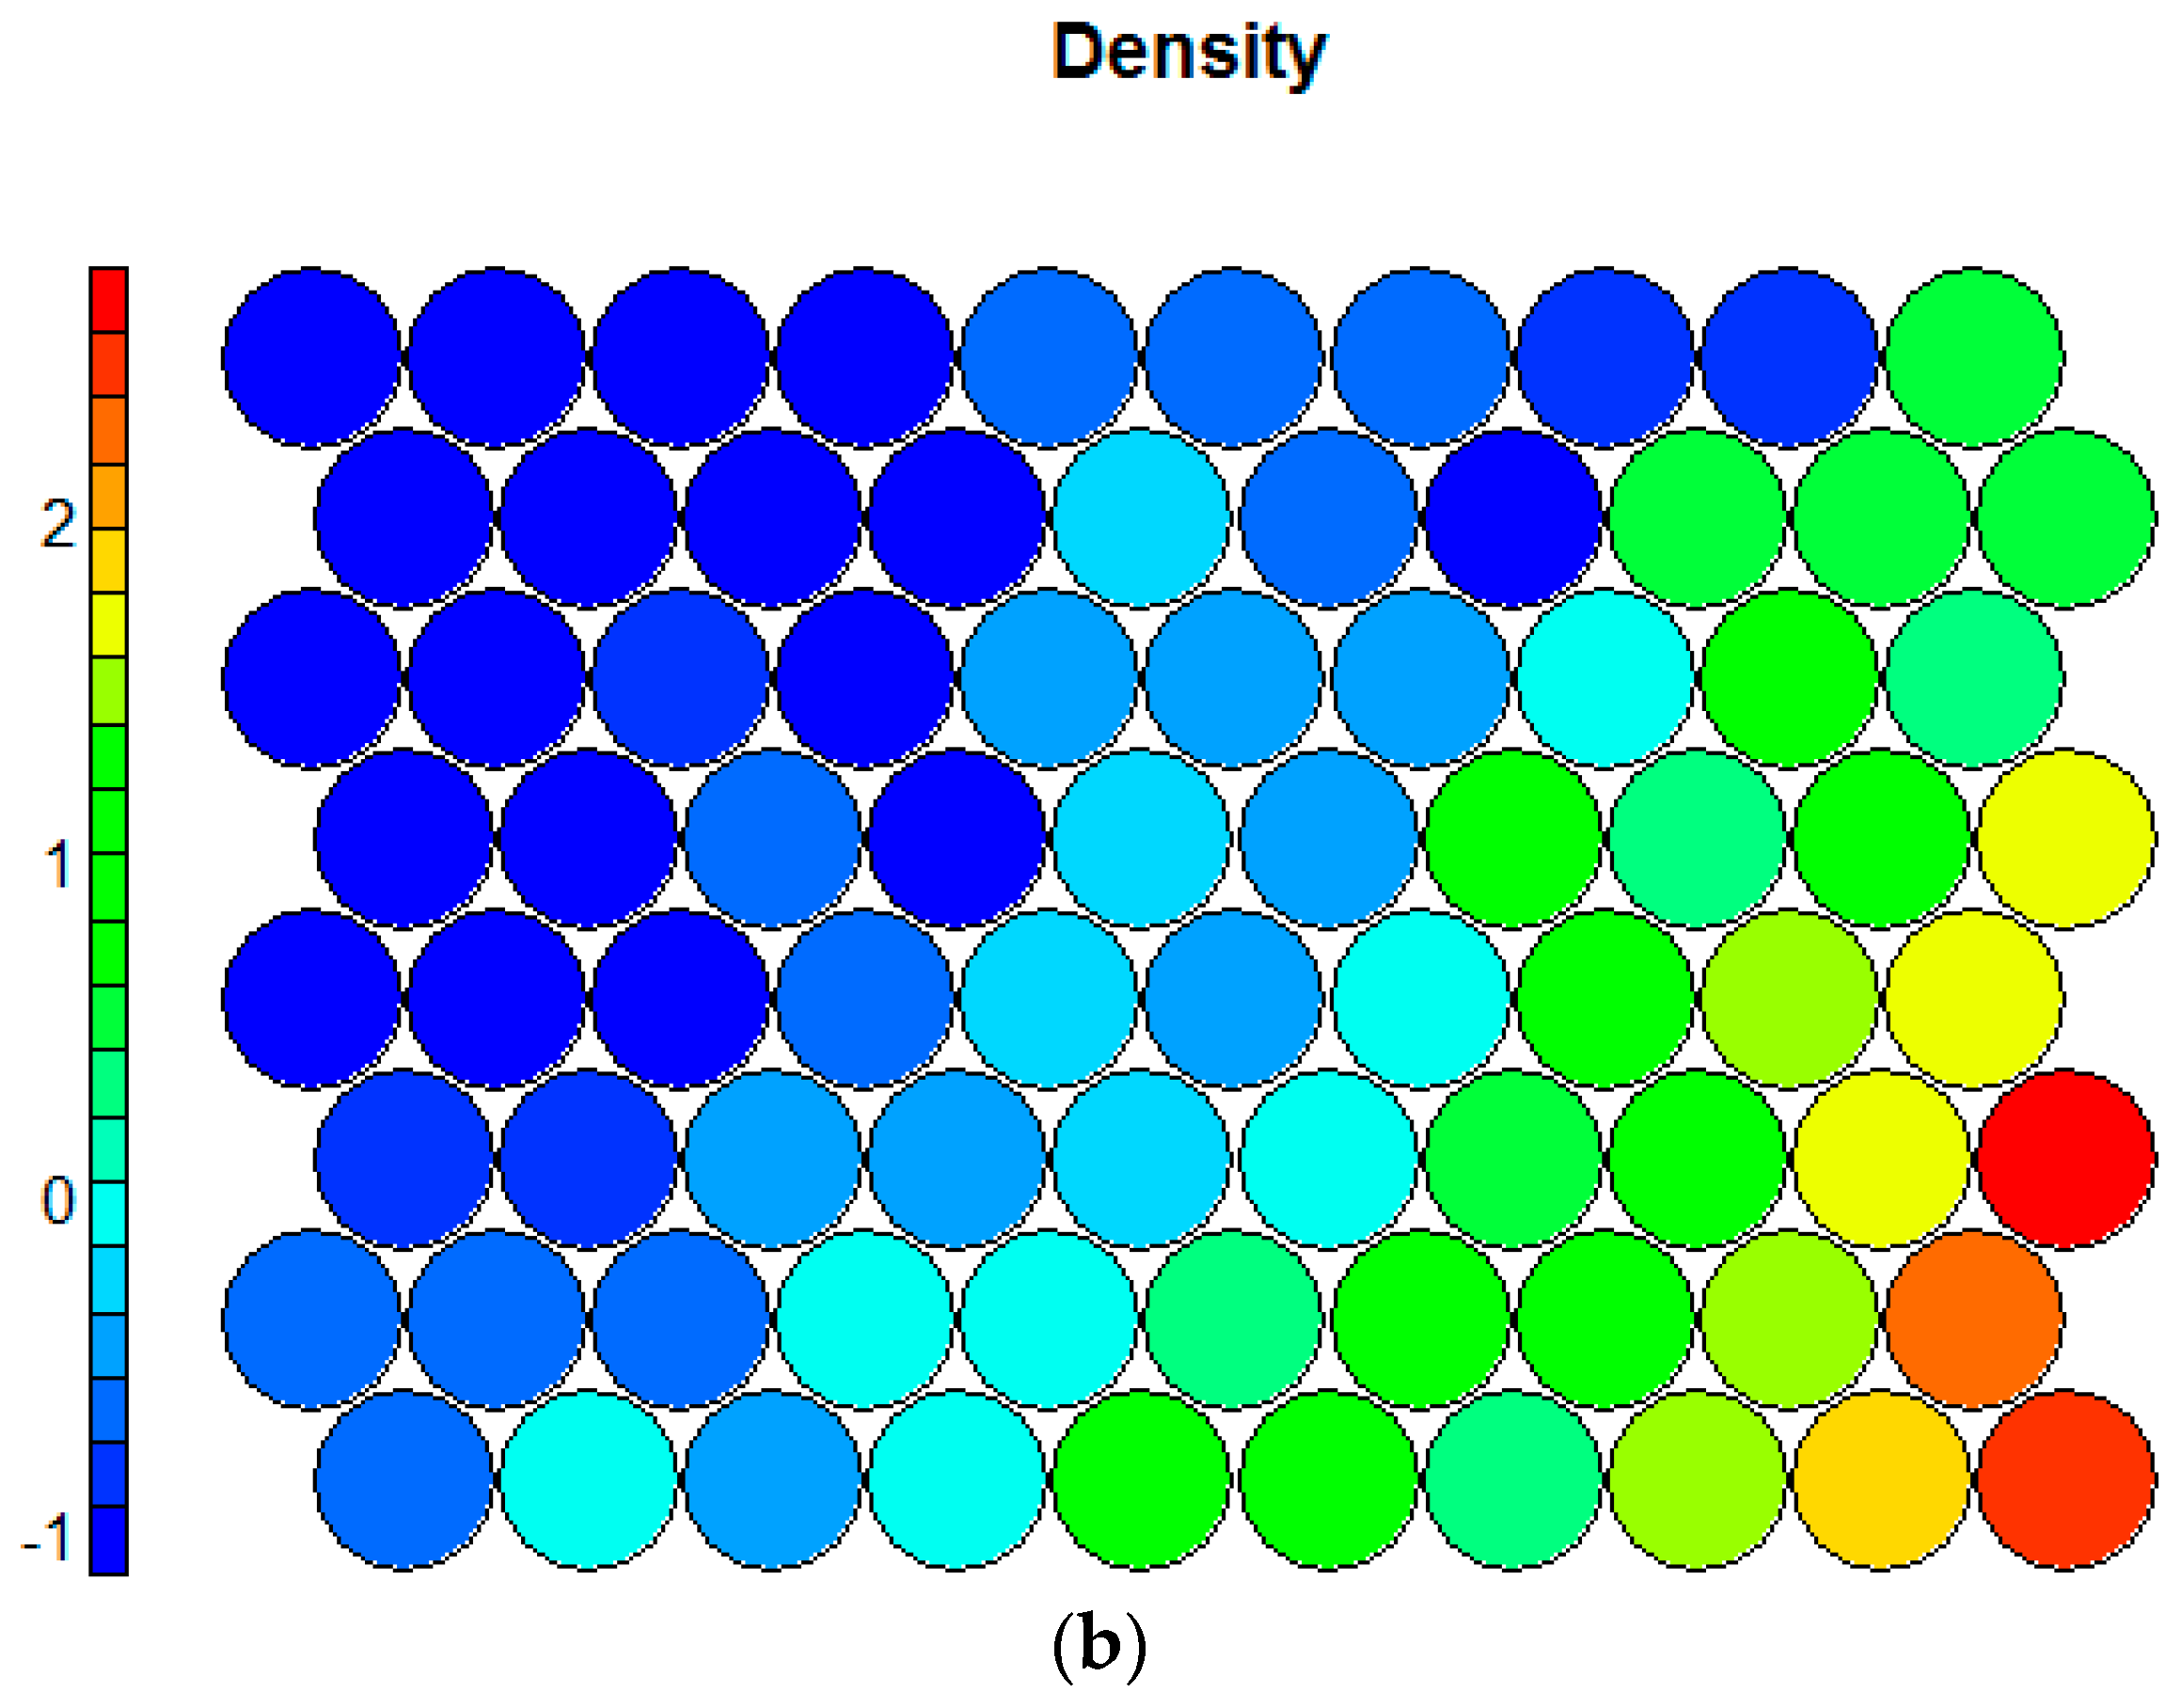
 Density (DENS)Numeric, number of stores within a 1000 m street network buffer around each cell
 Variety (VARI)Numeric, mean distance to three supermarkets of three different chains from each cell (in meters)
 Ethnicity (NATI)Numeric, proportion of native Dutch within a cell in the year 2014 (converted to the following numeric values: 5 = >90%, 4 = 75%–90%, 3 = 60%–75%, 2 = 40%–60%, 1 = <40%)
 Housing (HOUS)Numeric, average housing price per cell in the year 2011/12 (in €1000)
 IDUnique identifier
Version 11.0
1 In case the data will be updated, the version number will be changed. Older versions will be archived.
Table 2. Supermarket chains.
ChainNumber of StoresChainNumber of Stores
Albert Heijn79Coop3
Dirk15Plus4
Jumbo15Spar3
Lidl10Dekamarkt2
Aldi5C10001
Deen6Boni1

