1. Introduction
Similarity and distance matrices (SMs and DMs) are common data structures to represent interrelationships within a given set of objects. These matrices can be used for the identification of clusters of the objects, inference of networks and communities, estimation of density of distribution, and other applications requiring quantitative measures of relatedness between the objects. While the field of analyzing and visualizing these matrices is well established, challenges remain for presenting large datasets and providing interactive means for data browsing and analysis.
Heatmaps, dendrograms, circular relationship diagrams, networks, and dimensionality reduction scatterplots are popular methods for visualizing similarity and distance matrices. Heatmaps resemble a grid, with each cell colored according to the distance between a given pair of objects. The colors are normally a gradient of shades to represent the min–max range of all distances in the matrix. The main diagonal can be left blank or contain additional information pertaining to a given single object (e.g., size, weight, or any other individual quantitative property). While such visualization is intuitive and revealing, it is not well suited for large matrices (e.g., with thousands objects), which would be difficult to accommodate simultaneously on a single plot on any medium, such as paper or a computer screen.
Dendrograms are tree diagrams based on a hierarchical clustering derived from the symmetric dissimilarity scores (or distances). Branching points in dendrograms represent distances between the clusters of objects. Dendrograms offer the benefit of reordering the data and grouping together closely related items, which are then easy to recognize visually. The distance axis in a dendrogram is scalable, but the data axis needs to accommodate all data points, which for large datasets is impractical to visualize all at the same time. Navigation through large data is also a challenge.
Circular relationship diagrams are useful for visualizing pairwise relationships in a compact manner. Objects located on circumference are connected by arcs that may represent distances via thickness or color and reveal “hubs”—the most connected objects. However, these diagrams are again limited by the number of objects whose labels can appear in a practical view. In addition, for highly connected data, the connections within the circular diagram become too cumbersome to infer any relationships visually.
Networks are a natural way of displaying the interconnected objects. For example, a Voronoi decomposition (Voronoi diagram) can be uniquely determined by a given DM. However, for complex datasets, its visual representation may be not intuitive. Force-directed graphs (FDGs) are an alternative and more intuitive network representation of DMs. Following the notion of spring-like interactions, FDG balance the attractive and repulsive forces to lay out the nodes representing the objects. These forces can be defined using different functions beyond laws of gravity, charged particles, etc., and may account for specific nature of the objects or their relationships. Again, the main challenge for network representation is to visualize large datasets, which may appear as cumbersome clump of nodes.
Dimensionality reduction can be used to scale distance matrices down to lower dimension coordinates such that they can be rendered on a two- or three-dimensional scatter plot. One such commonly used method is multidimensional scaling (MDS). For large datasets, it may present a challenge to visualize the data, especially when point labels are needed to locate individual objects. An interactive view with zooming capability may facilitate the visual inspection of MDS data.
To address the aforementioned limitations of the existing approaches to visualizing large similarity and distance matrices, we present a web-based platform that combines heatmaps, dendrograms, circular relationship diagrams, and MDS plots into one interactive data visualization tool, with all components synchronized as the user examines the data. To illustrate the data visualization platform, we apply it to the analysis of a covariance matrix for the multi-domain protein, human estrogen receptor-alpha (ESR1), which contains almost six hundred amino acid residues. The presented platform is a further improvement of the previously developed web-server CoeViz [
1].
CoeViz can generate a covariance matrix for amino acid residues within a given protein based on multiple sequence alignment (MSA), and using different metrics, including mutual information (MI), chi-squared (χ2), and Pearson correlation (r). These matrices are further transformed into distance matrices. Since proteins frequently have long sequences—hundreds or even thousands of residues—there was a need to develop a web-based platform for interactive visualization of such large SMs and DMs to enable an efficient analysis of the covariance data for the identification of couplings of either individual positions or clusters of amino acids that may have shared structural or functional constraints through evolution of a given protein.
2. Results
2.1. An Integrative Platform for Similarity/Distance Data Visualization
This work represents a major update of CoeViz with regard to the online visualization of covariance matrixes. Specifically, we incorporated an interactive cladogram of the hierarchical clustering tree, which now allows for the manual highlighting of clusters, reacts to the selection of tree leaves by refocusing other visual components to a newly selected residue, and auto-scrolls to a tree leaf when the user selects a residue in other views. We also added a new component—3D MDS scatterplot—that allows the user to view a distance matrix interactively in 3D and identify groupings of residues. All visual components are now synchronized and automatically update all views upon changing focus in one component.
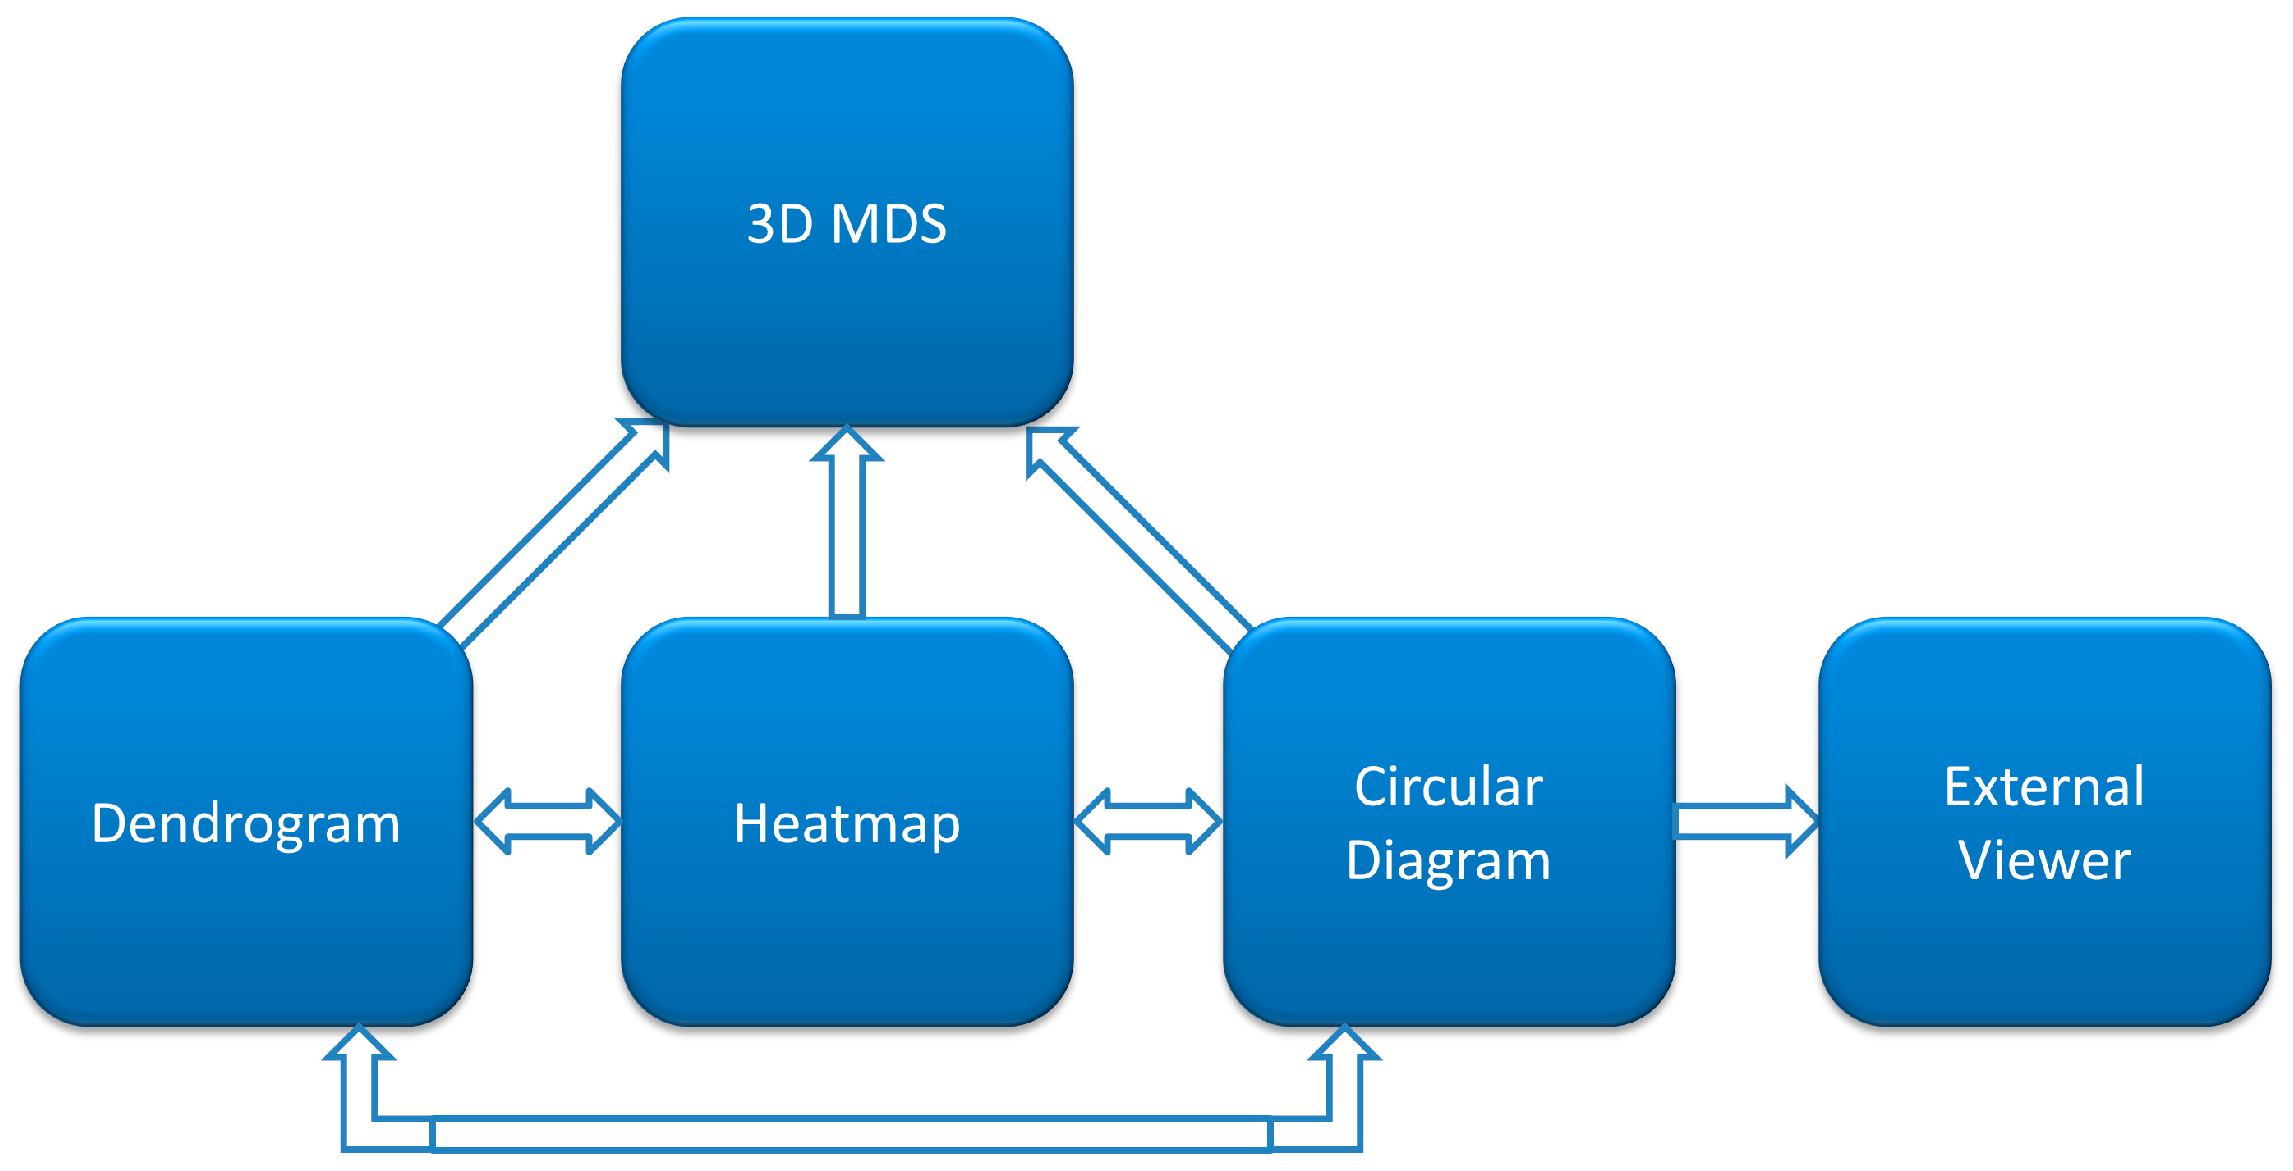
The developed web-based platform for interactive visualization of similarity and distance matrices consists of four major interconnected components: heatmap, dendrogram, circular diagram, and three-dimensional MDS scatterplot.
Figure 1 illustrates interaction of these components in CoeViz. Their specific implementation is described below.
The heatmap presents covariance data (or similarity data, in general) based on one of the implemented covariance metrics [
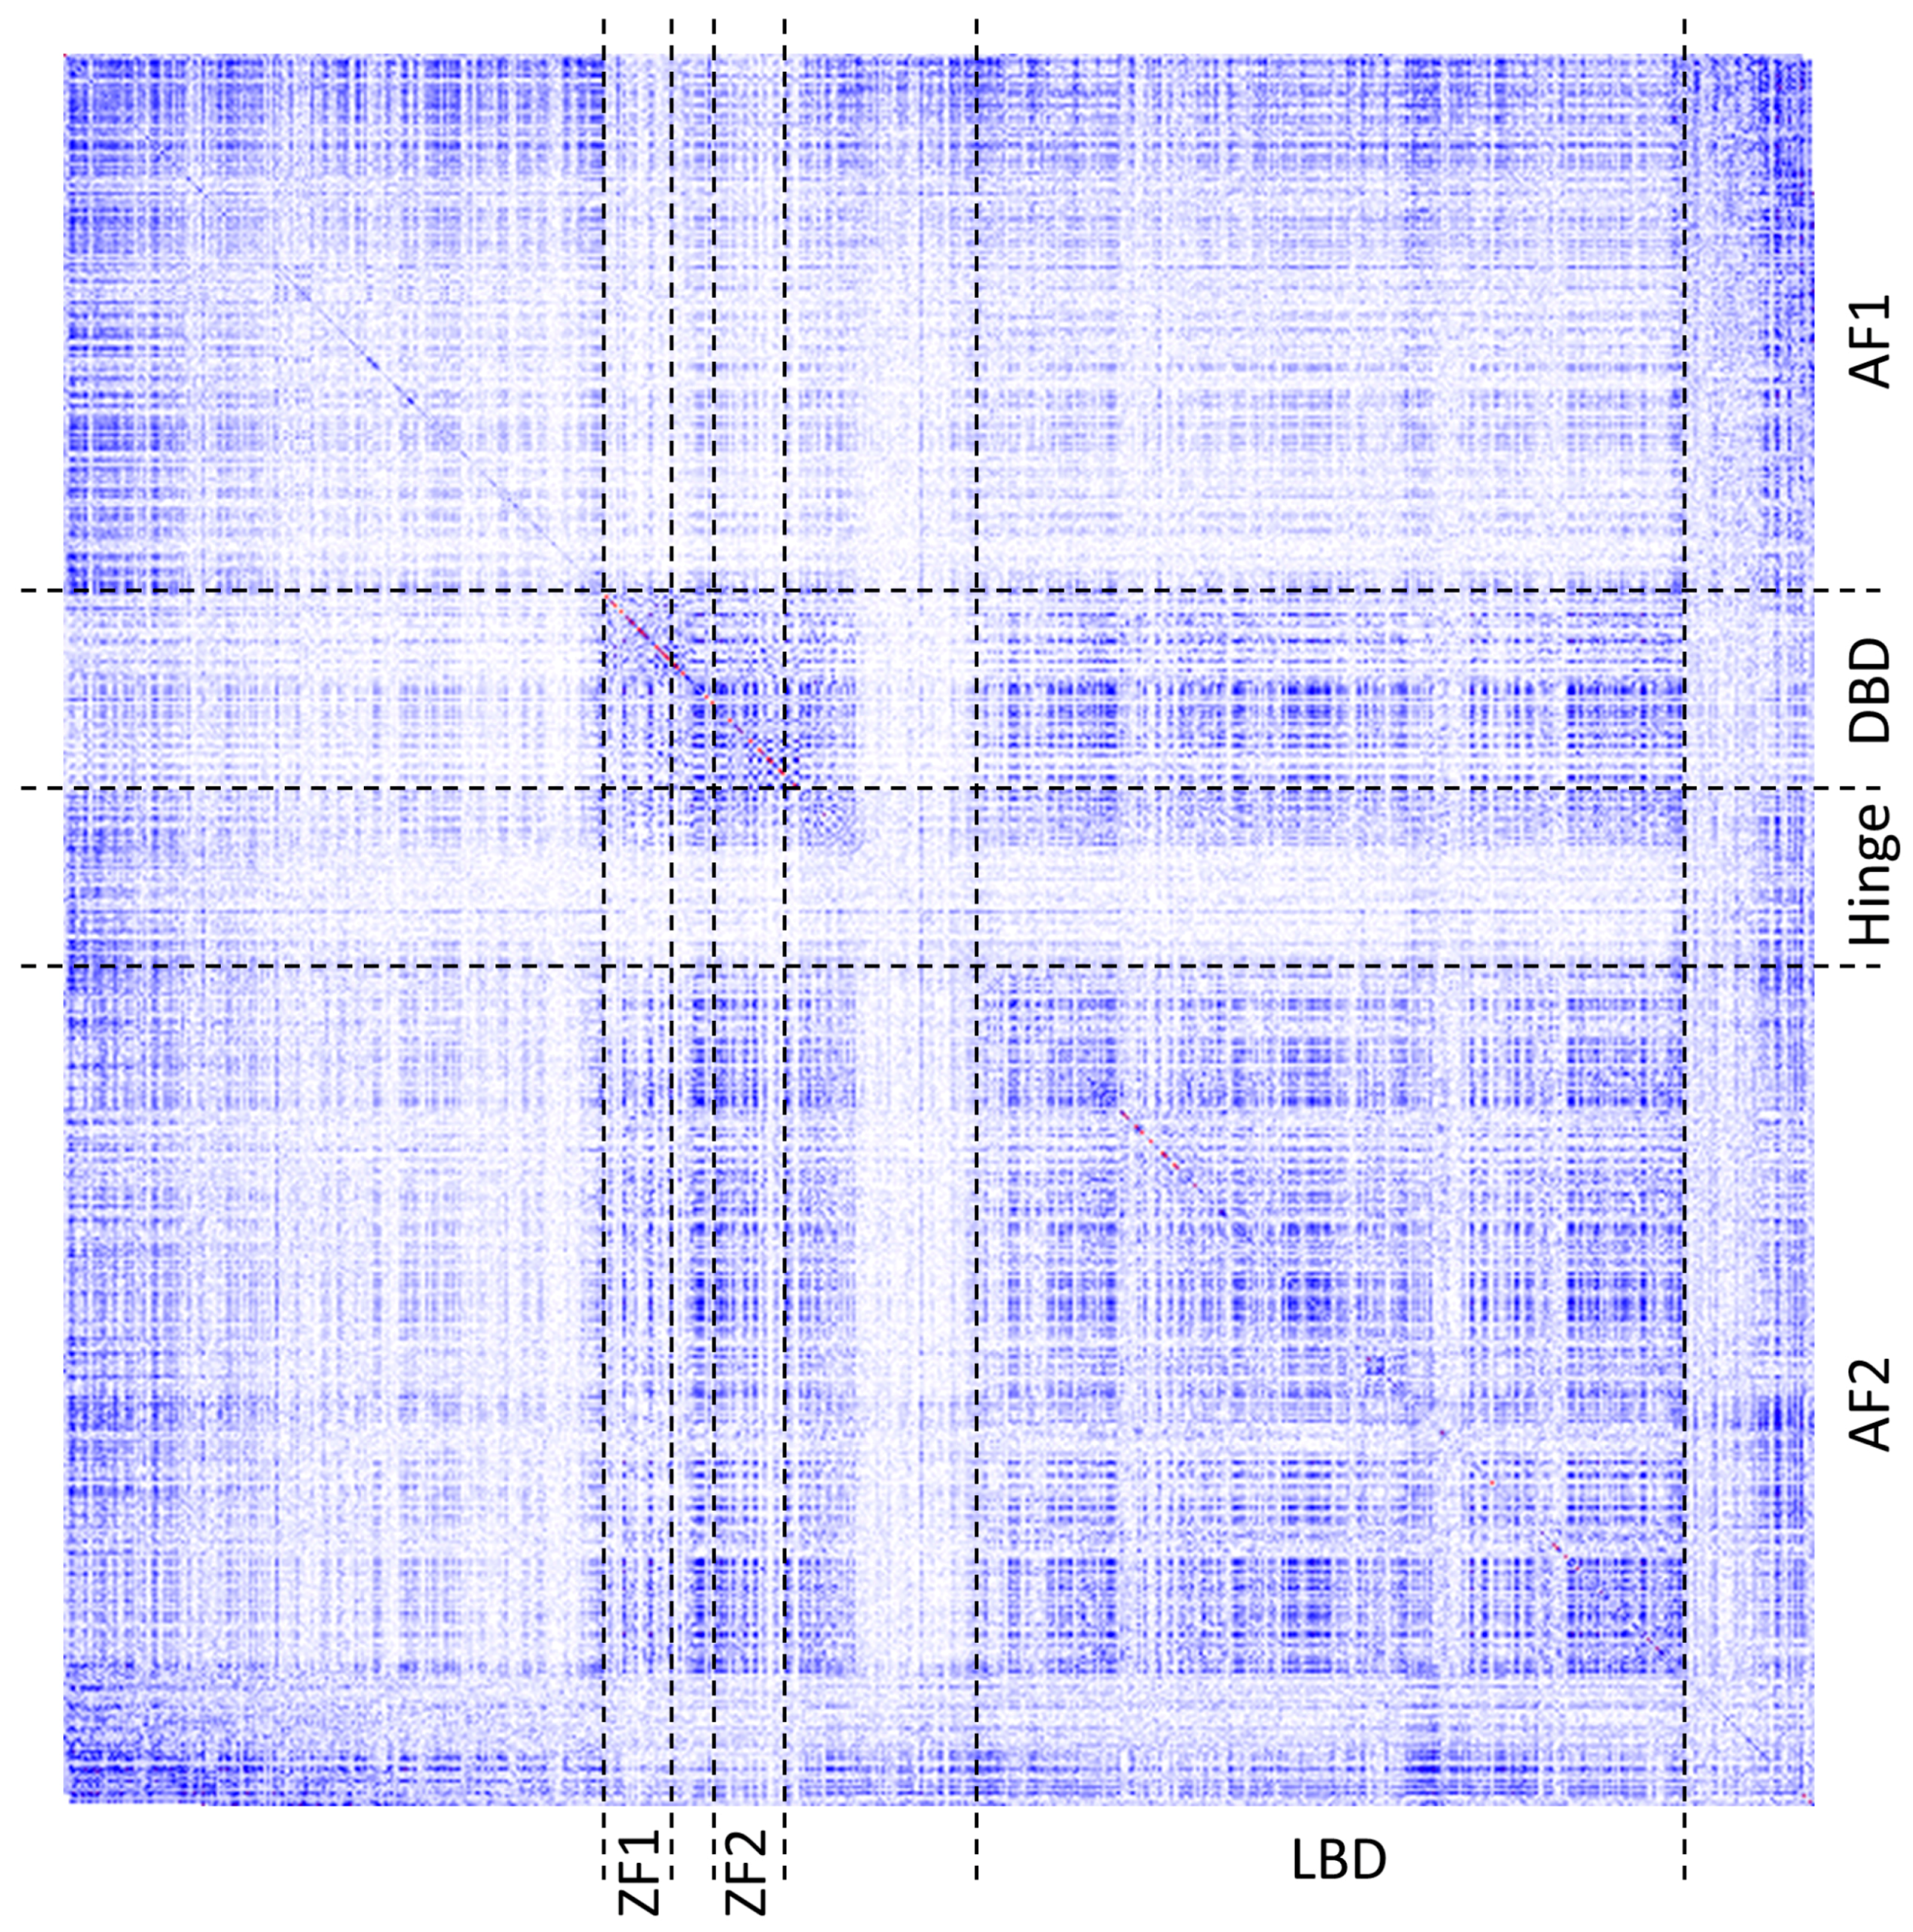
1]. The color gradient spans from white (representing no covariance, 0), through blue (moderate, 0.5) to red (high covariance, 1). The main diagonal contains frequencies of given amino acids observed at the individual positions in a given MSA. Heatmaps are zoomable from single pixel per position to large grid cells presenting detailed information, such as row and column indexes, corresponding residue labels and covariance scores. For quick navigation, heatmaps can be dragged with a mouse to pan to another part of the grid or be refocused using either a navigation pane or another visualization component.
Figure 2 shows the same heatmap at different zoom levels.
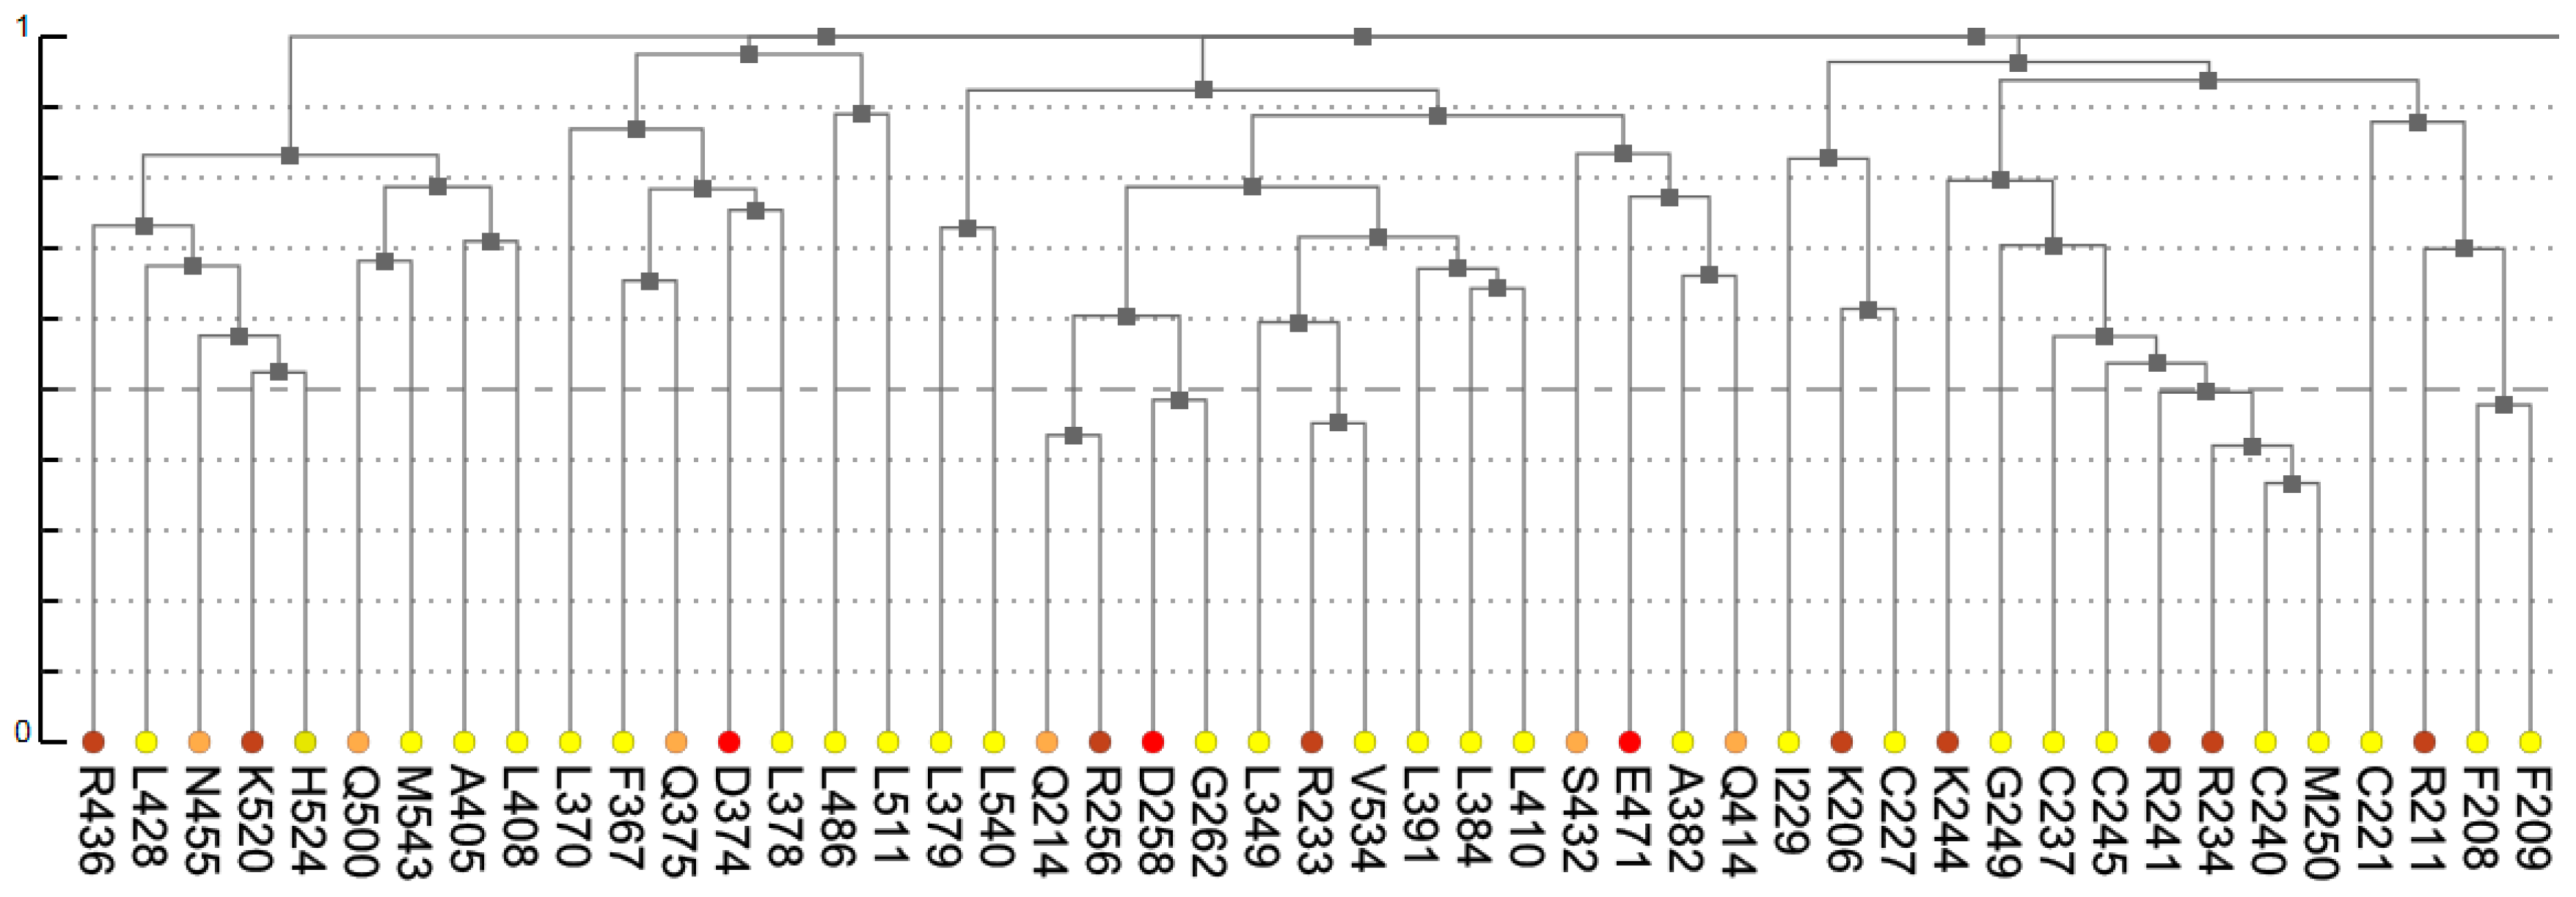
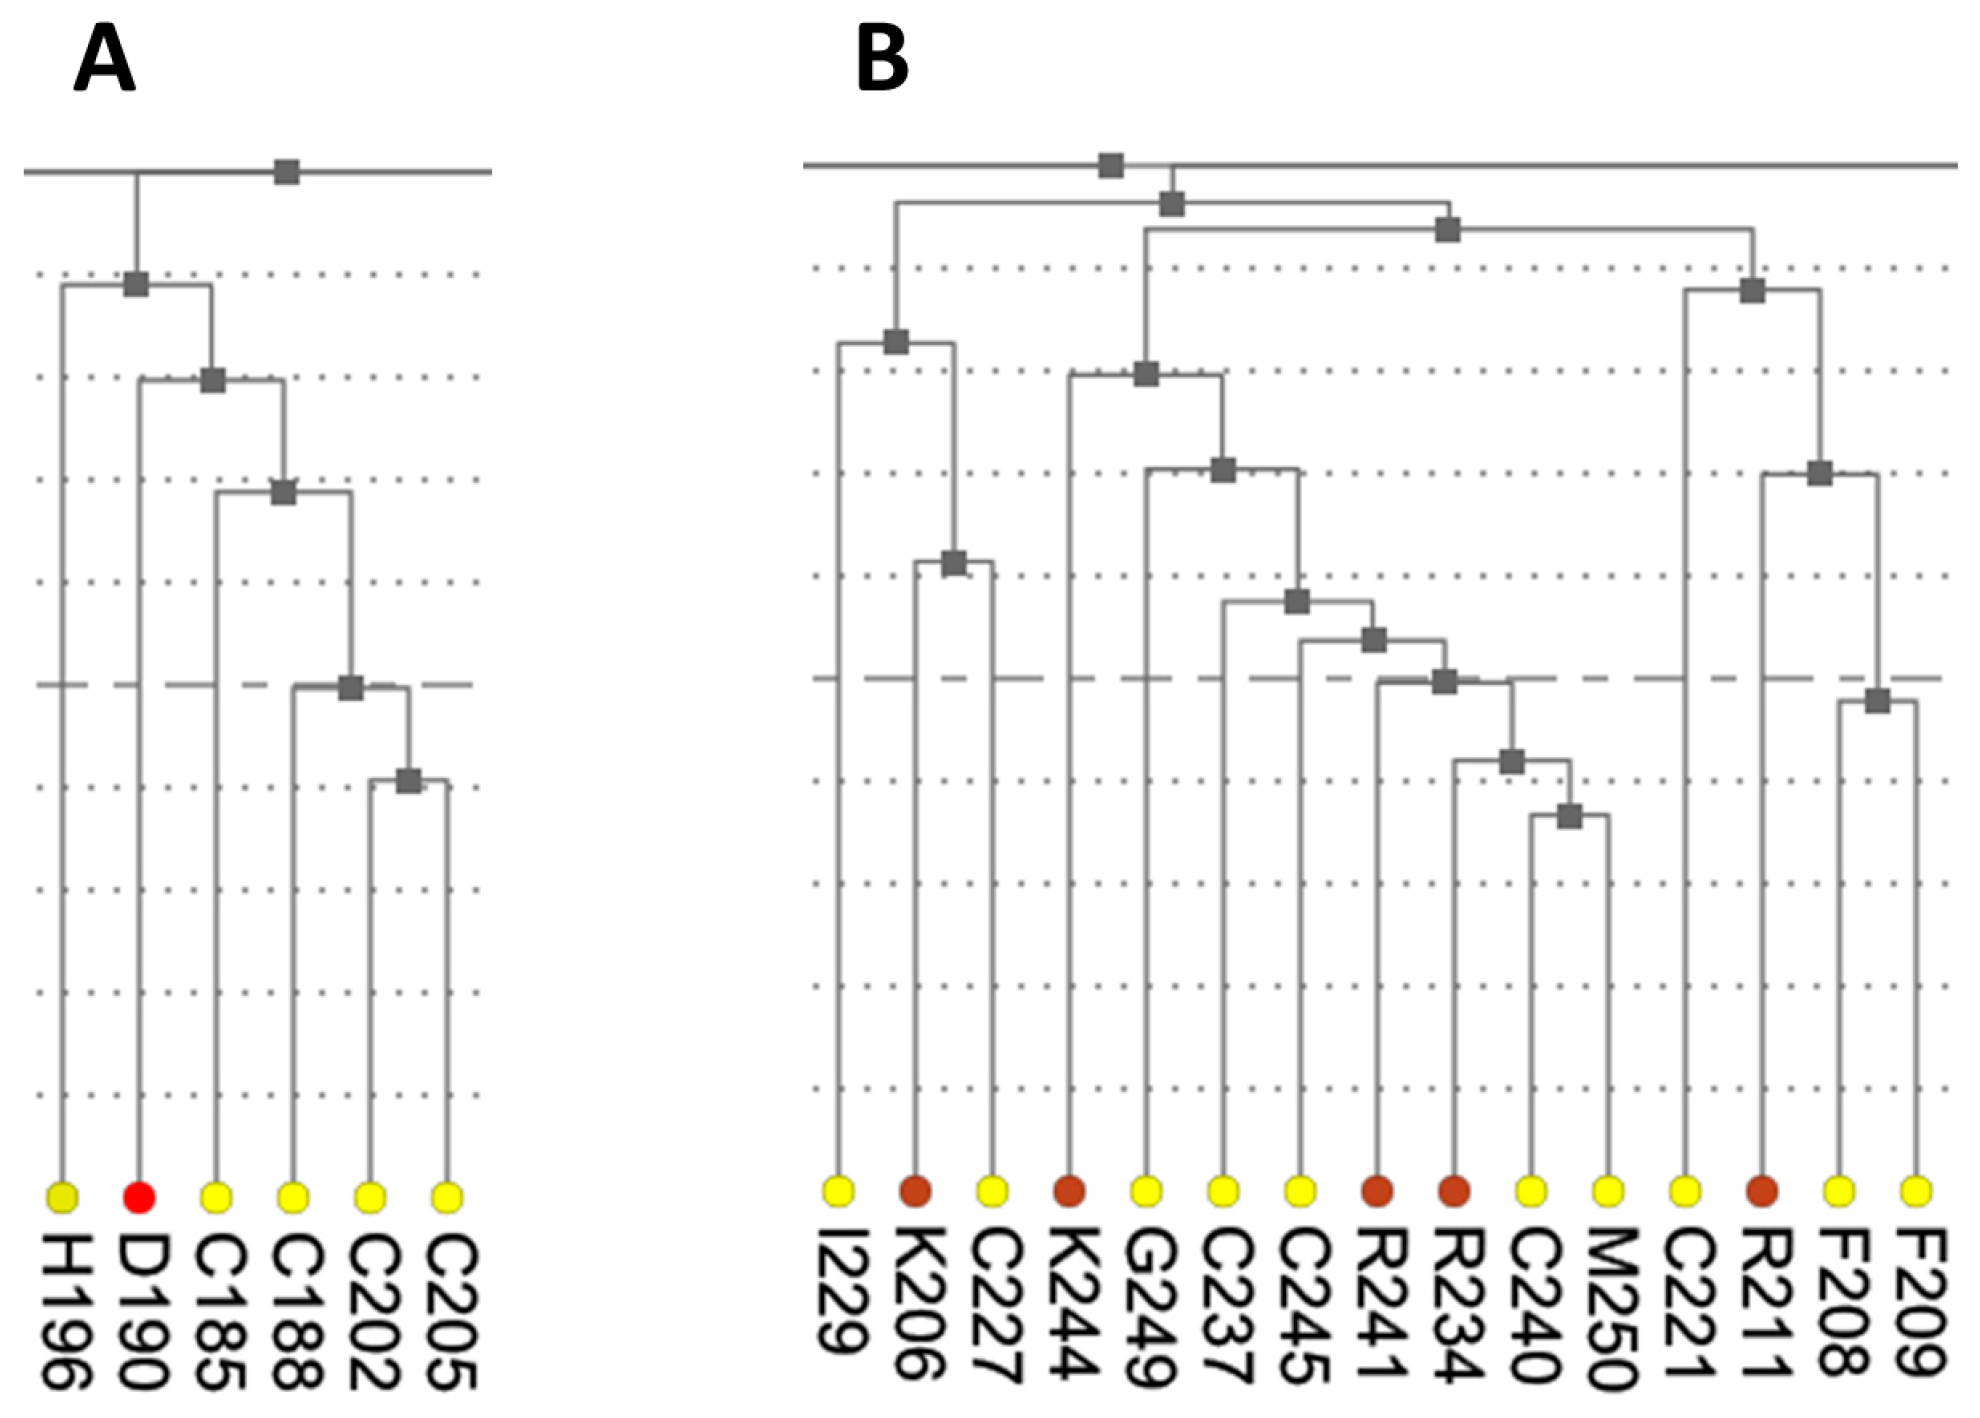
The dendrogram presents results of hierarchical clustering of covariance data transformed into a distance matrix. In the context of protein data, leaves of the tree dendrogram are colored according to physico-chemical properties of amino acids (
Figure 3). The added interactivity of the dendrogram greatly improves navigation through the data and synchronization of visualization. When a leaf in the dendrogram is clicked, it highlights the cell in the main diagonal of the heatmap and opens (or refocuses) the circular relationship diagram for that residue. To account for large proteins, the tree view is scrollable and automatically refocuses on a residue when it is chosen by the user in another interactive visualization component.
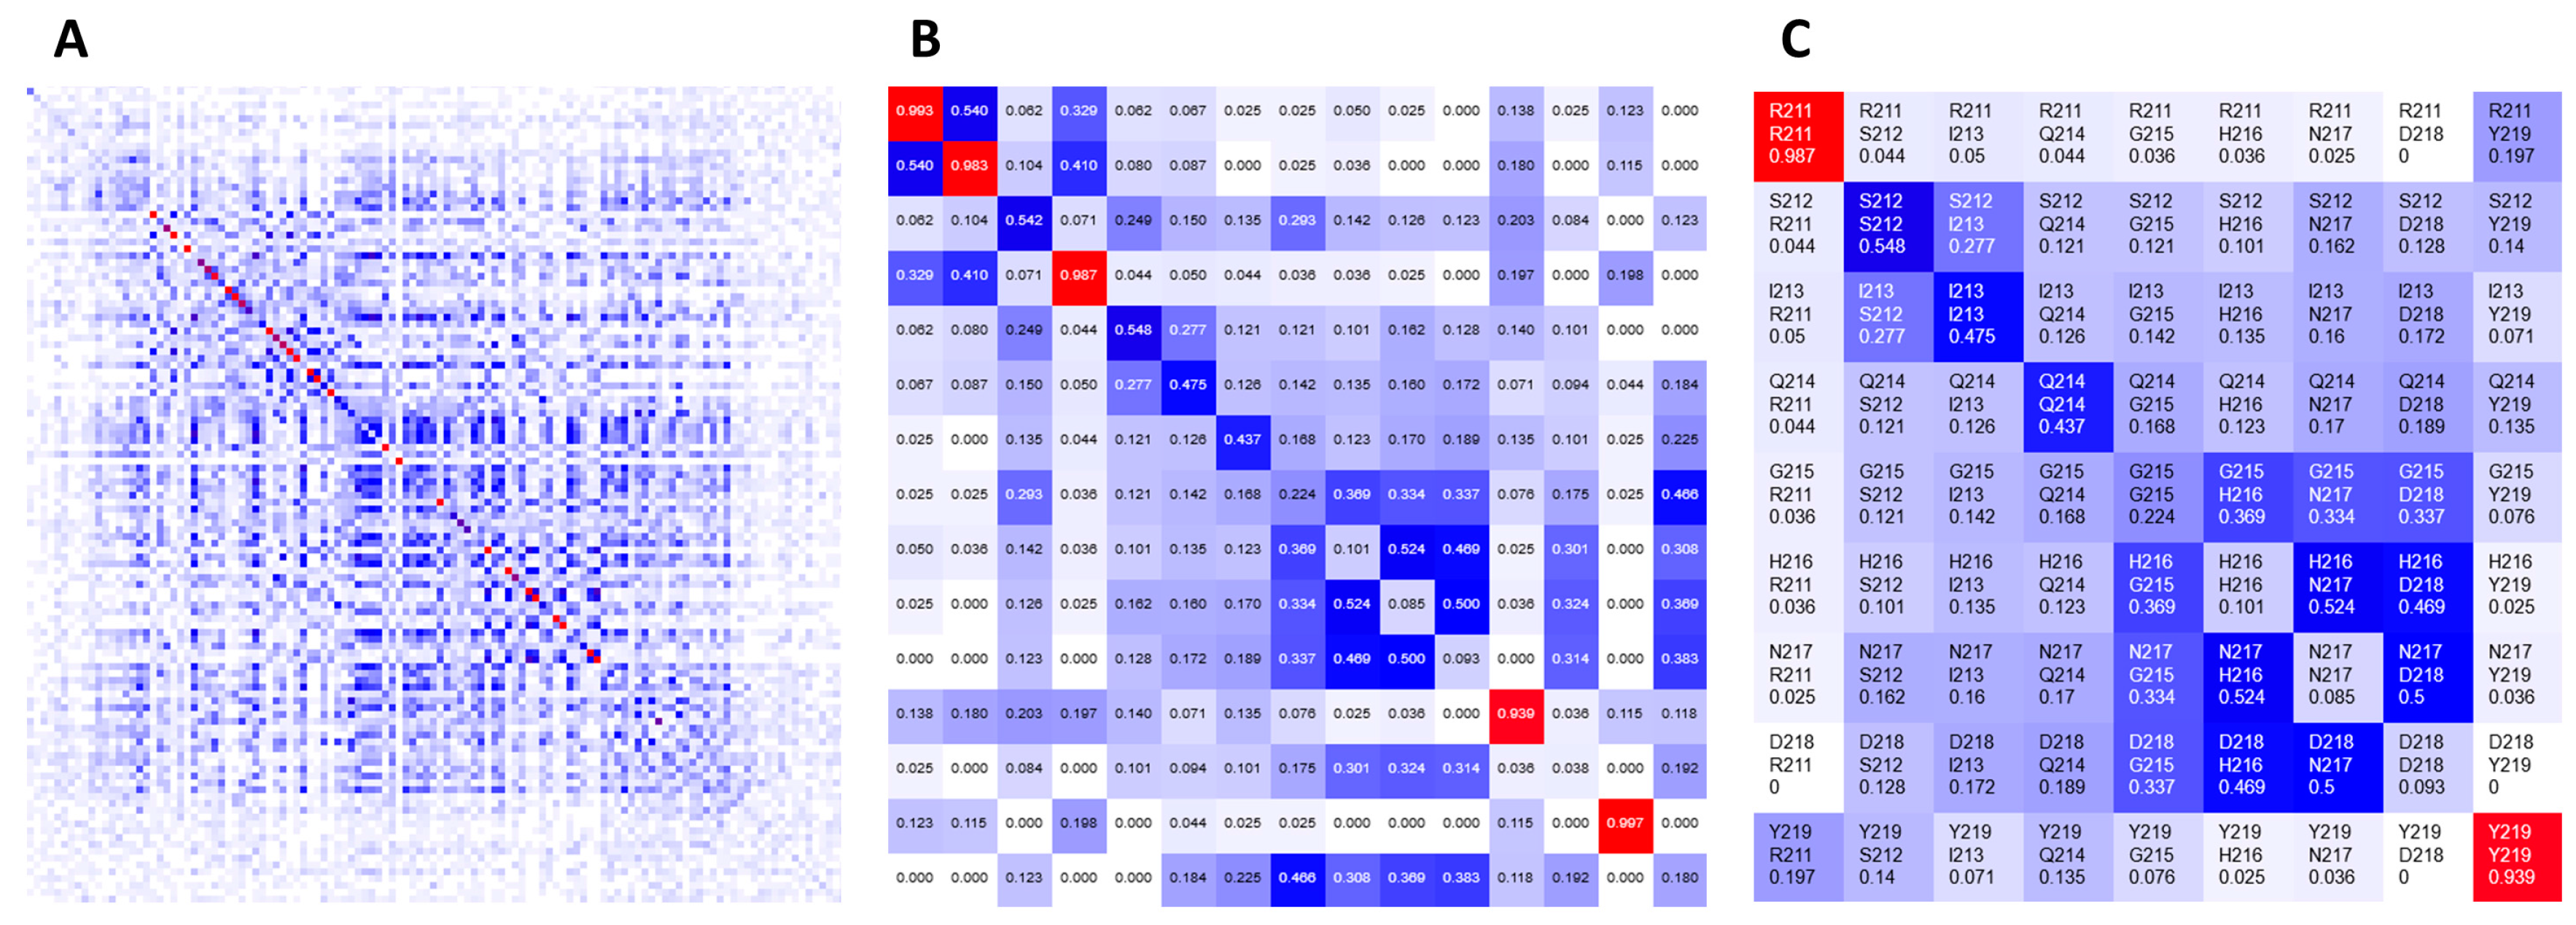
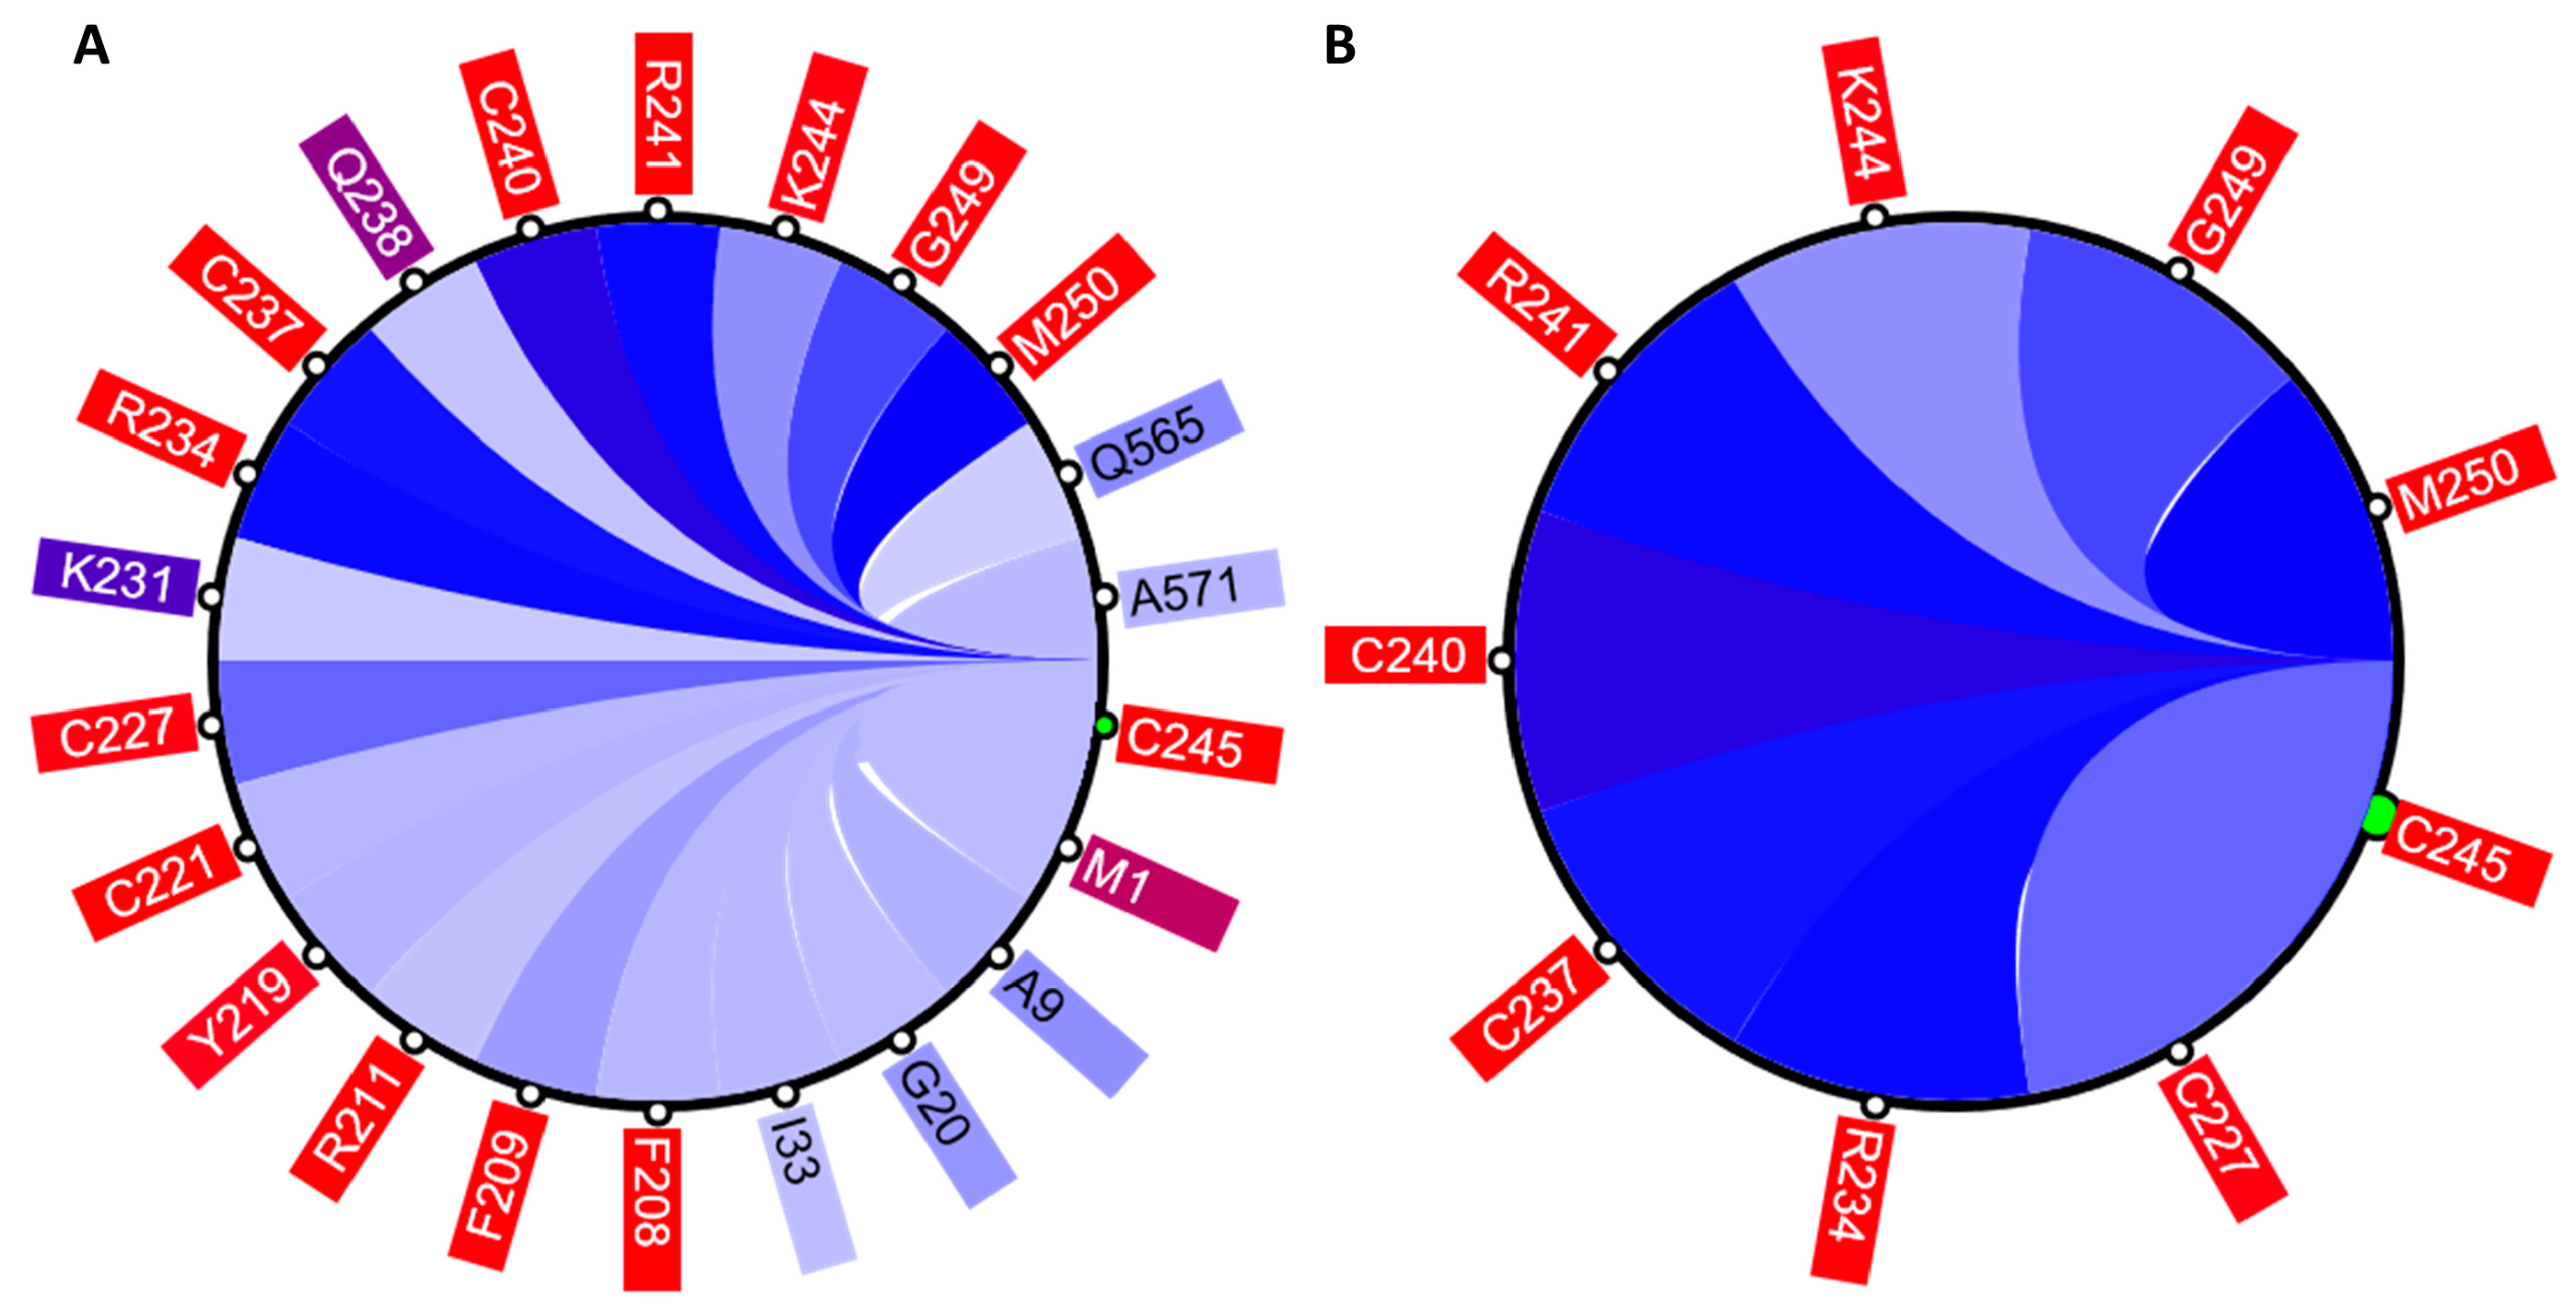
The circular relation diagram (CD) is automatically updated for each newly chosen residue and, by default, displays top 5% of the most co-varying residues with the chosen residue. The number of residues shown can be altered by changing the cutoff of covariance scores (
Figure 4). The diagram can be interactively expanded to show the same data in the table format. One can refocus the view to any residue in the diagram to reveal its own set of the top co-varying residues. Such refocus invokes an instant update of the three other visual components to reflect the change in focus. The CD also enables the external visualization of the residues displayed in the diagram using the POLYVIEW web-based platform: POLYVIEW-2D [
2], POLYVIEW-3D [
3], and Jmol [
4]. The latter two options are available only when a protein 3D structure was used as an input for CoeViz analysis. The Jmol view enables the interactive analysis of the structural arrangement of the selected co-varying residues facilitating the inference of their structural and/or functional relationships.
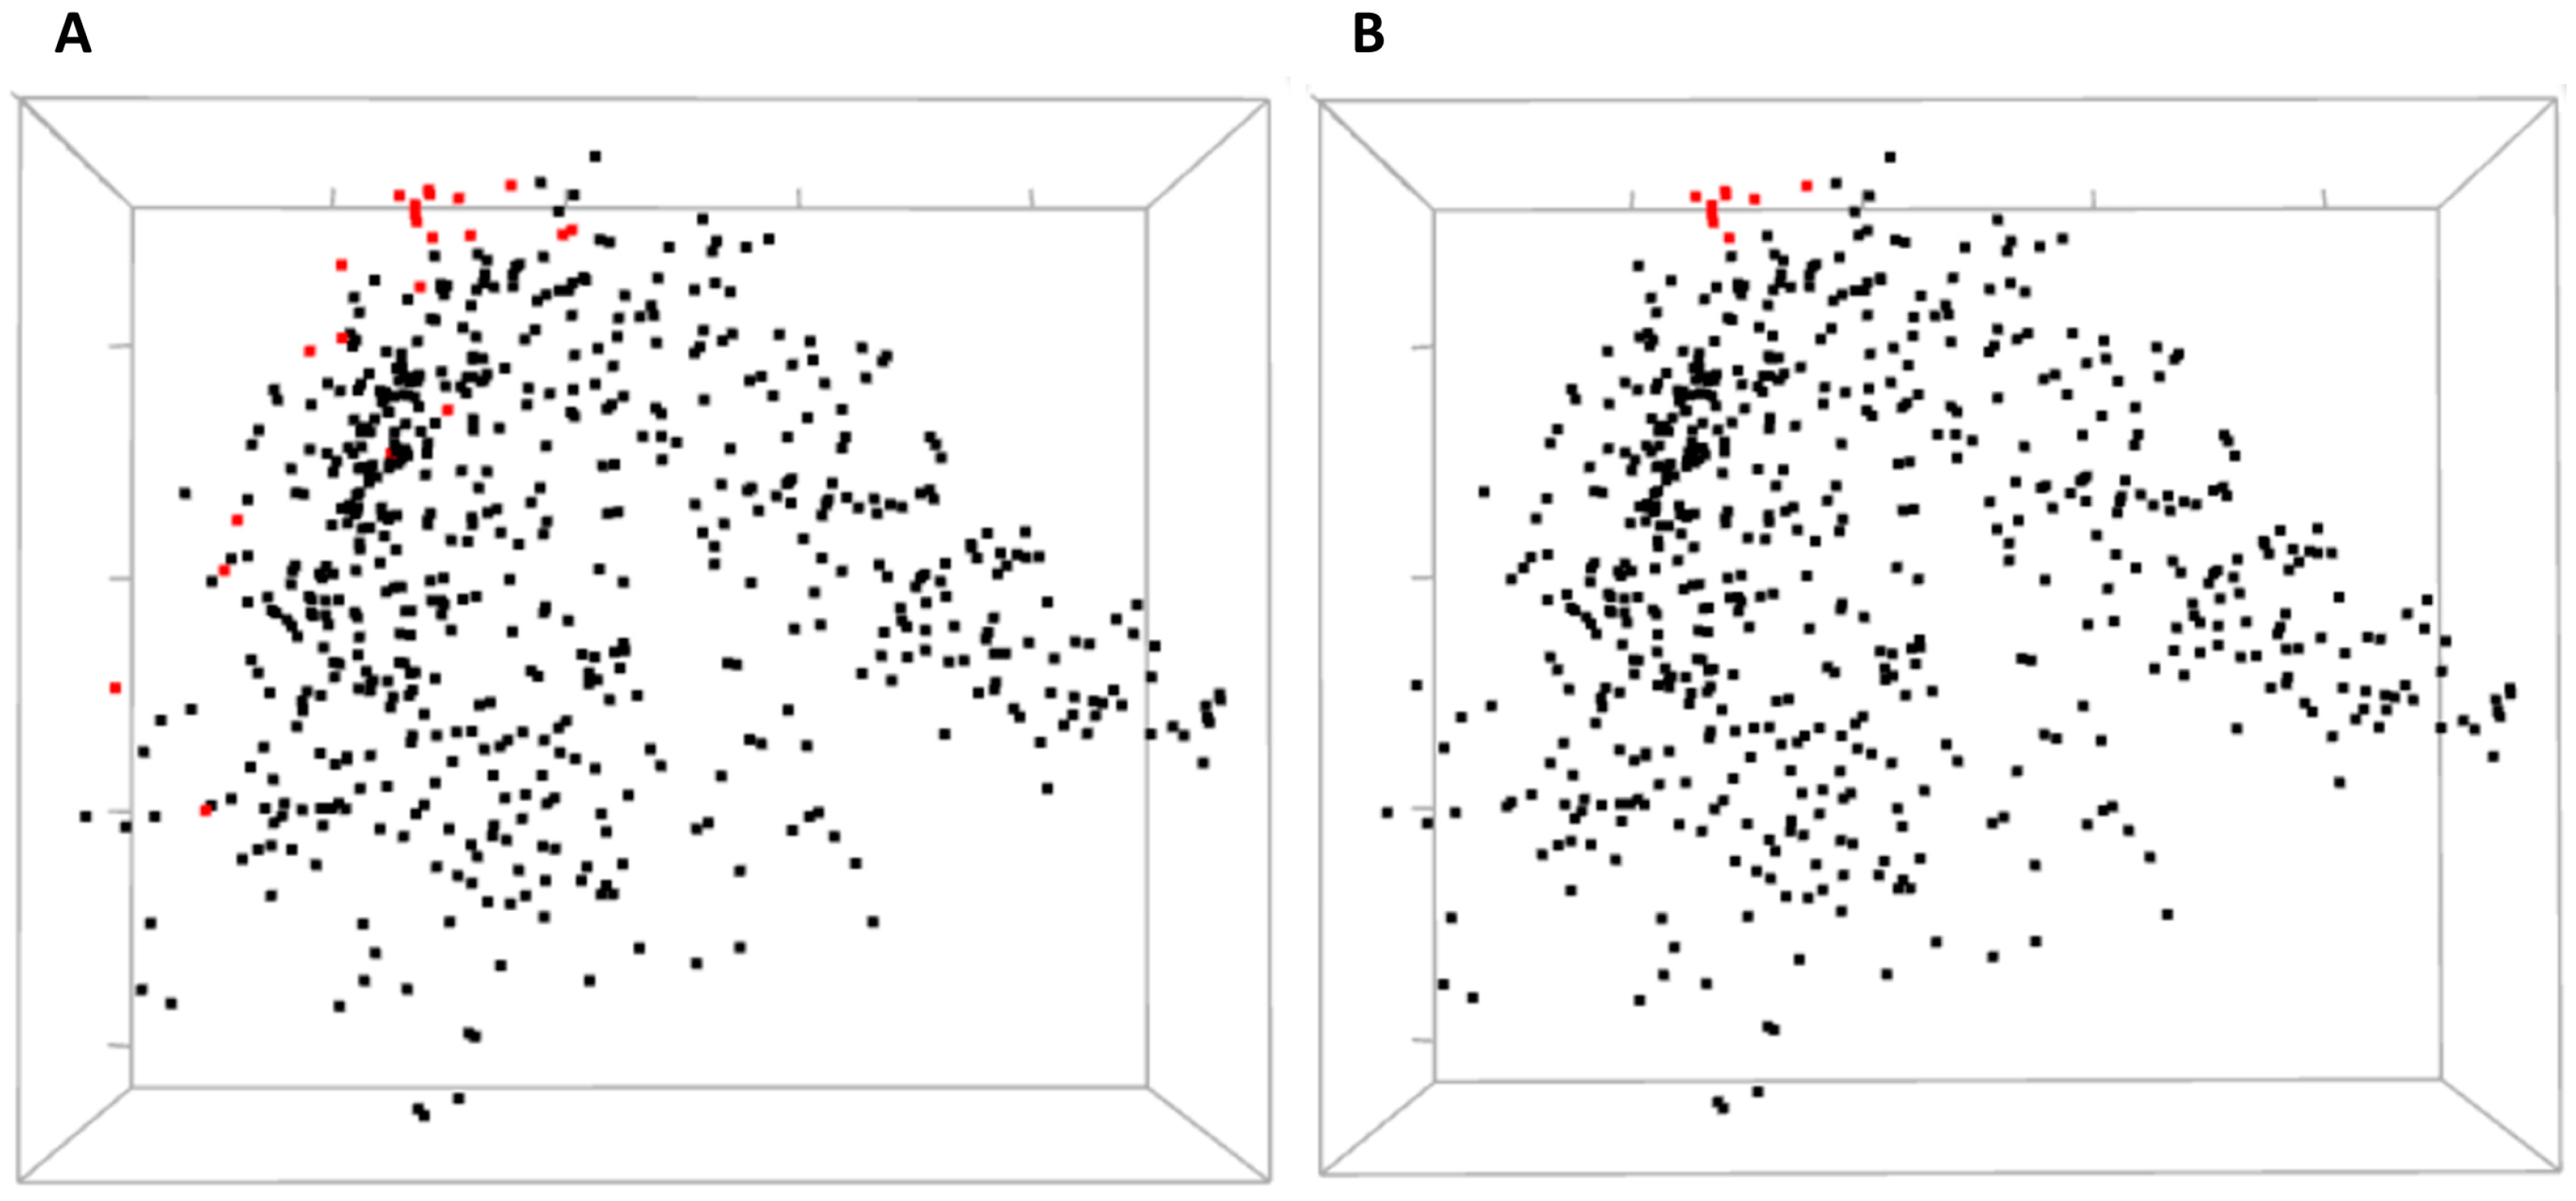
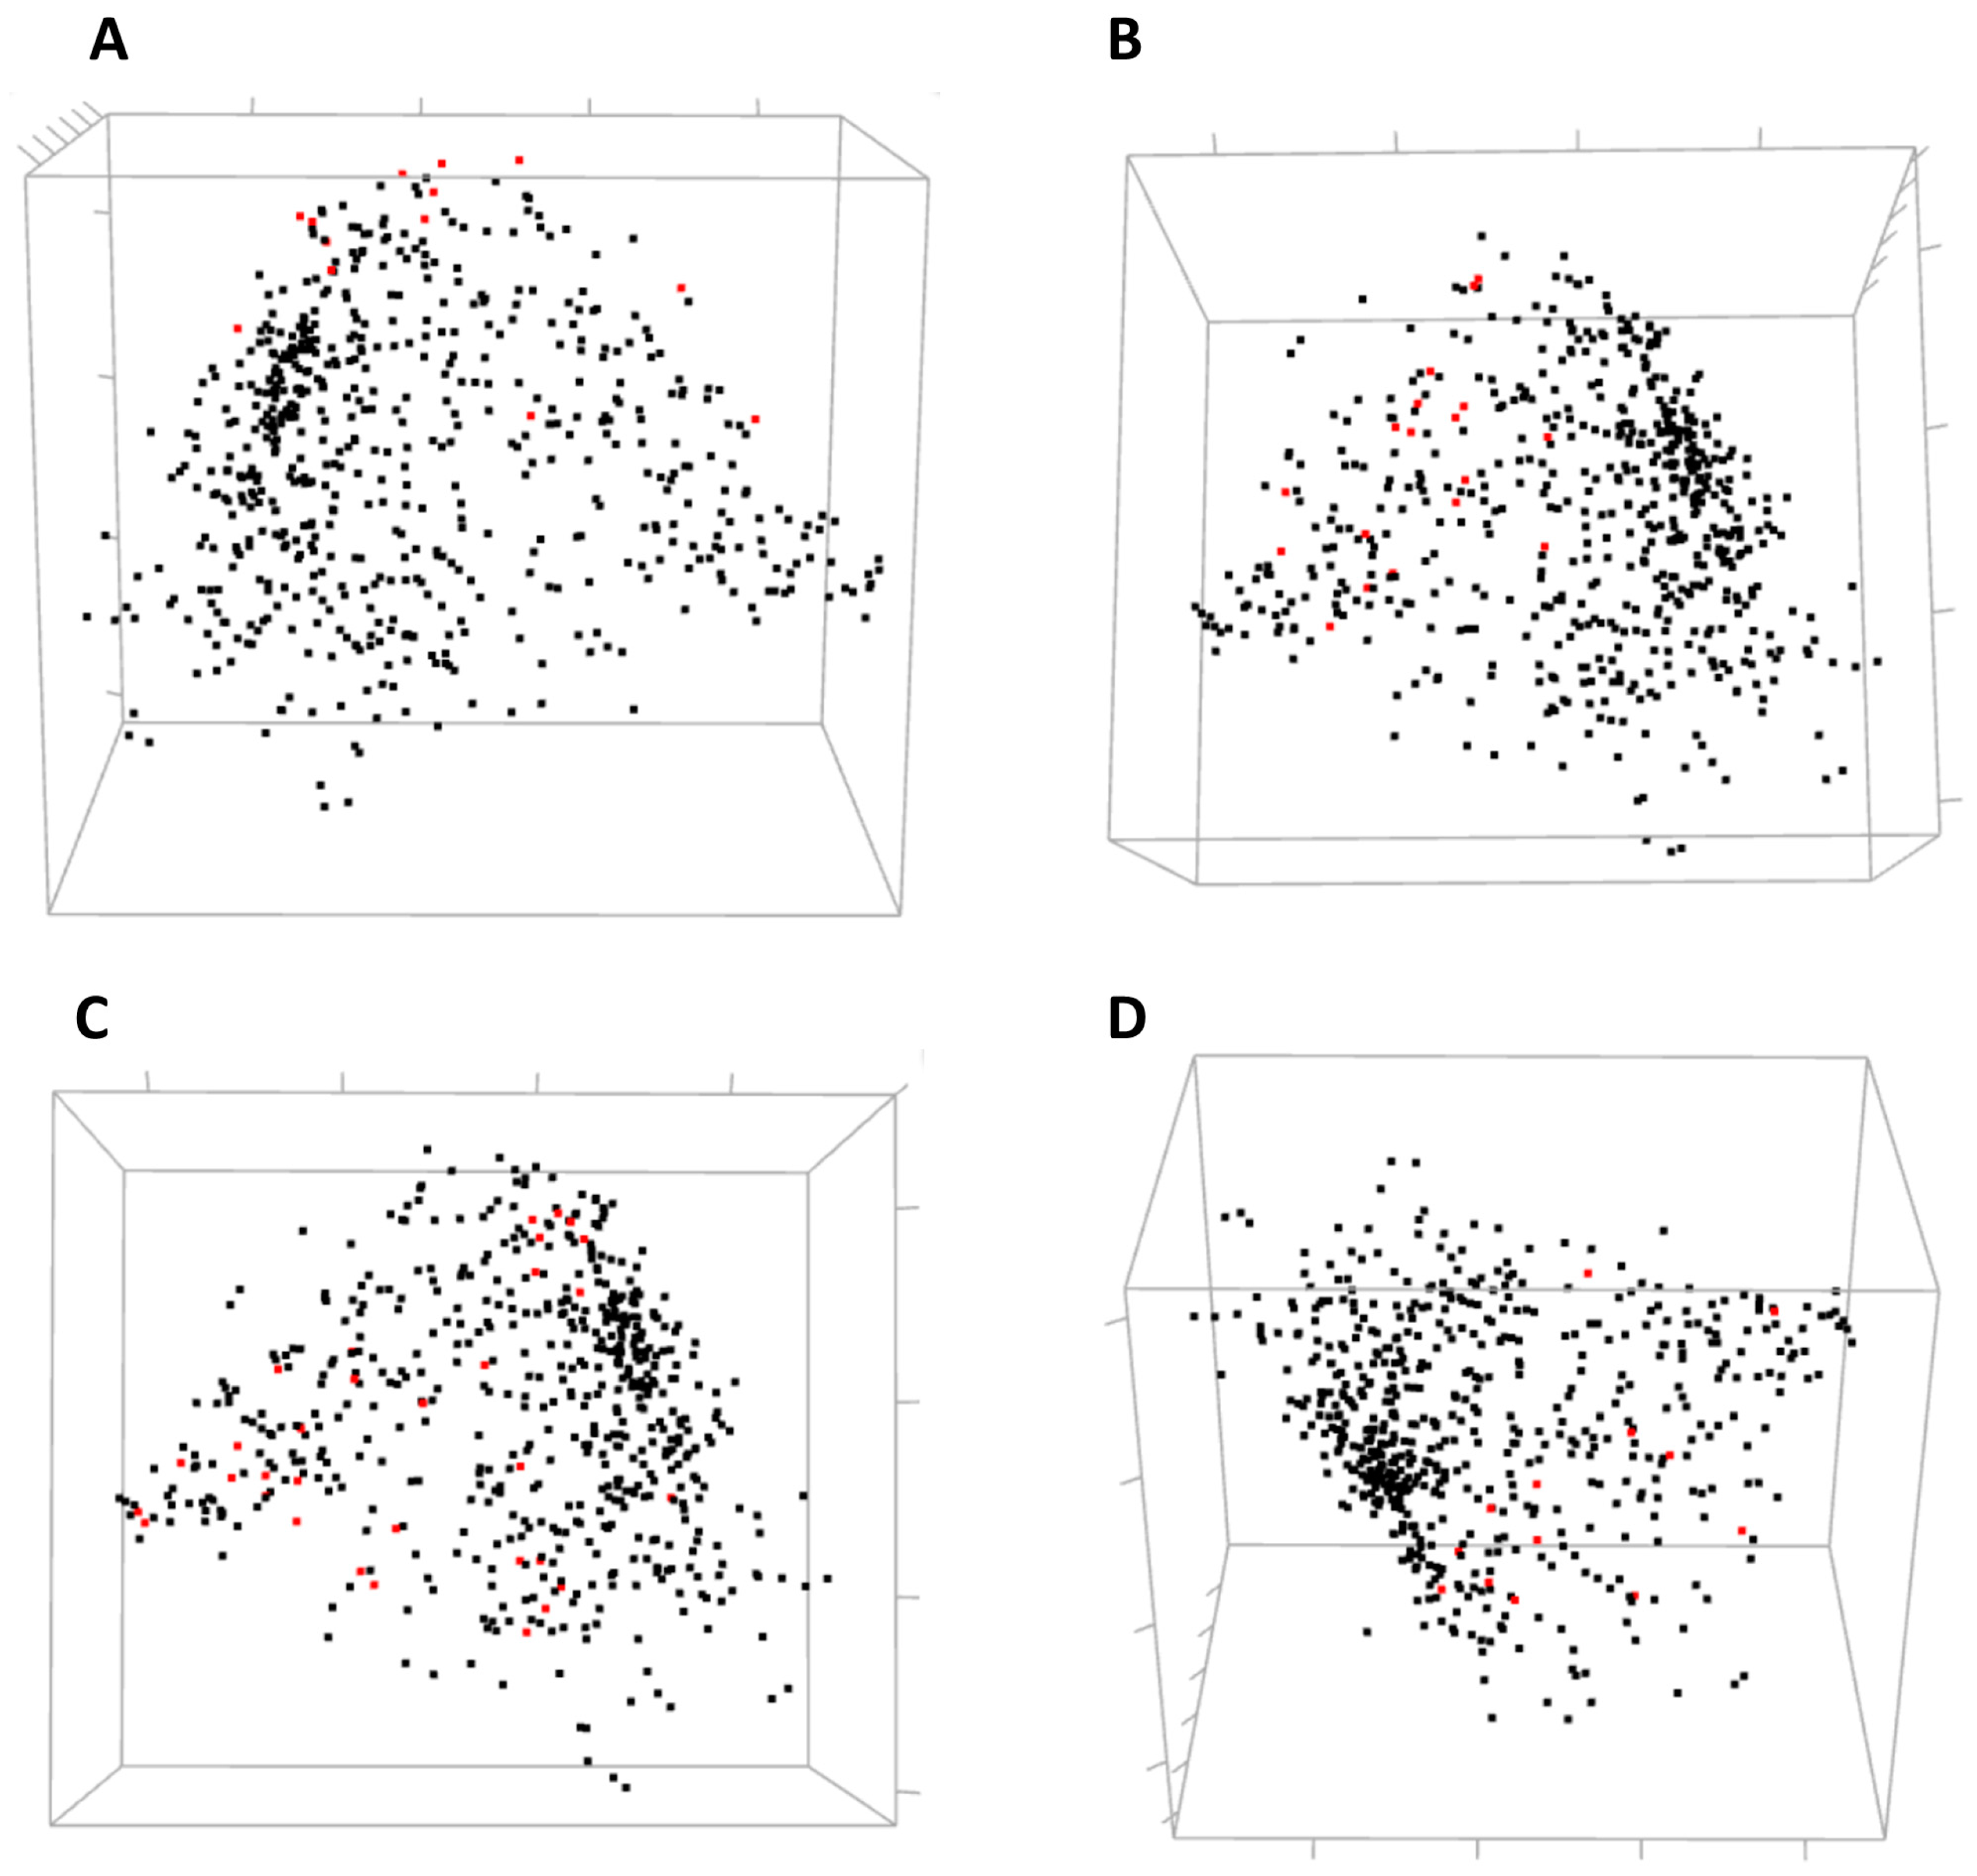
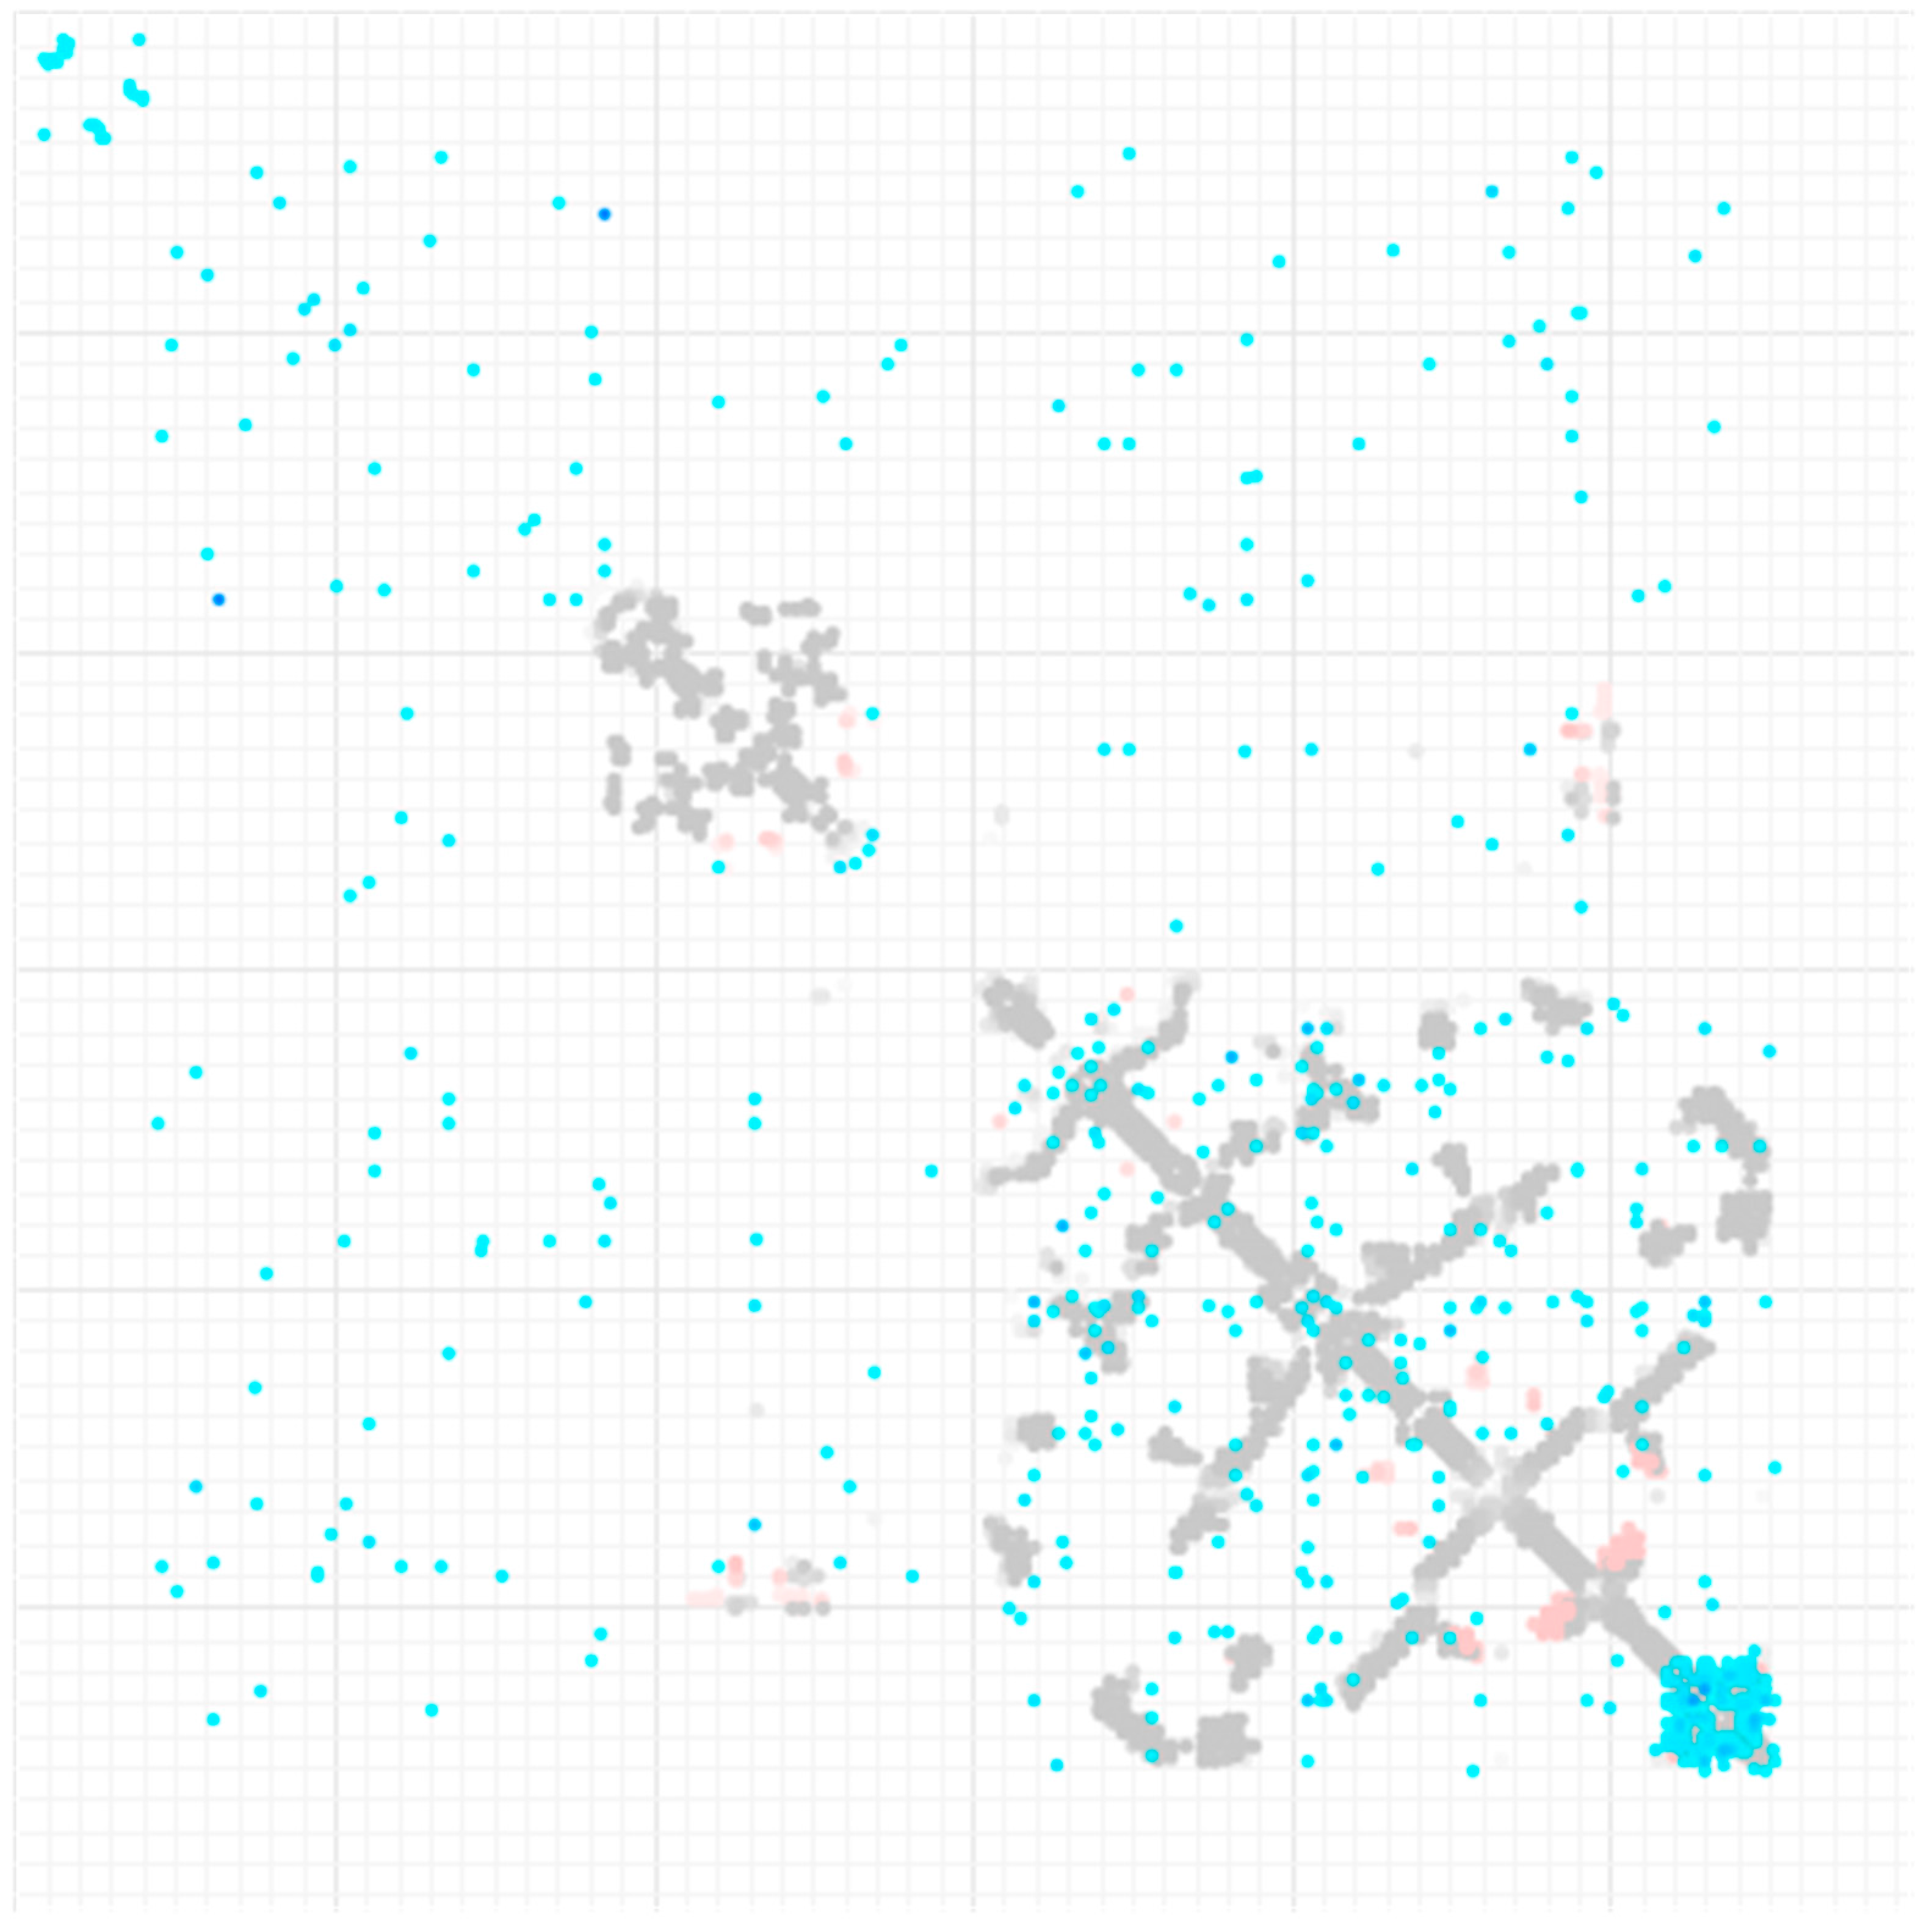
Three-dimensional view of MDS allows for a global yet compact presentation of relationships between the residues (
Figure 5). From covariance data projected into 3D by MDS, one can identify domains of the protein, some small clusters of functionally relevant residues, and residues standing away from the rest. The 3D view pane provides interactive zoom-in and rotation capabilities, as well as the labeling of selected residues. Current implementation of the MDS view does not allow for the interactive selection of individual residues on the scatterplot to be used for refocusing views in other CoeViz components due to limitations of the R library used.
2.2. Analysis of Human ESR1
Human estrogen receptor alpha (ESR1) is a multi-domain protein that belongs to the family of nuclear receptors. It represents an interesting object for the amino acid covariance analysis and visualization since its domains, while all serve the purpose of a transcription factor, play distinct molecular functions detailed below. The domains also contain additional functional regions, such as zinc coordinating residues (Zinc fingers) in the DNA-binding domain and ligand binding residues in the transactivation domain AF2.
Full protein sequence of ESR1 (595 amino acids) was submitted for the analysis by CoeViz using the χ
2 covariance metric adjusted for phylogenetic bias in the MSA.
Figure 6 shows a heatmap of covariance scores for residues across the entire protein. As can be seen from the figure, the boundaries of the patterns of co-varying residues by and large coincide with the known domains and functional regions of the protein.
We further interrogated as to whether residues involved in distinct functions, such as metal coordination, DNA- and ligand-binding, or those involved in protein–protein interaction can be identified as separate clusters or what other residues they are clustered with.
As was mentioned earlier, ESR1 comprises two Zn fingers in its DNA-binding domain. From each Zn finger, we picked the first residue that is known to coordinate a Zn
2+ ion: C185 and C221 from ZF1 and ZF2, respectively.
Figure 7 shows that these residues were clustered with their partners, metal coordinating residues C188, C202, and C205 and C227, C237, and C240, respectively. The same two clusters also contain residues directly binding DNA: H196, K206, R211, R234, and R241. Other DNA binding residues—Y195, Y197, E203, G204, A207, K210, K235, and Q238—did not form a distinct cluster.
Residues involved in direct ligand (estradiol) binding or in protein dimerization and interaction with a co-activator were not clustered together by hierarchical clustering. Still, one can analyze their mutual covariance-based distances using an interactive 3D MDS scatterplot (
Figure 8).
2.3. Comparison with Other Existing Tools
The presented tool is meant to illustrate the general concept of the visualization of large (dis-)similarity matrixes via synchronized orthogonal views. However, since the examples presented here pertain to the covariance data in proteins, a number of existing servers for coevolution analysis in proteins were evaluated. Based on the original publications, where some visualization means for the results were presented, we tried ConEVA [
5], EVcouplings [
6], and GREMLIN [
7] using the same human ESR1 protein.
The ConEVA web-server was not responsive after multiple attempts, so it may be no longer supported. EVcouplings accepted the protein input with the remaining parameters used as defaults. No results were returned after two days post submission. It is possible that the server is not meant for large or multi-domain proteins. GREMLIN accepted the input with the warning “Note, due to limited resources, your submission may take forever to complete (Jobs Running: 0).” Nevertheless, the server found identical query protein submitted previously by another user and returned results with the input parameters used as specified by that user.
Figure 9 contains the output provided by GREMLIN, where covariance analysis is overlaid with the pairwise residue contact information collected through the Protein Databank entries containing homologous protein chains.
The contact map for ESR1 from GREMLIN is static, with no interactive functionality or mouse hover information provided, which makes it difficult to locate what pair of residues a given pixel/shade represents. It should be noted that GREMLIN does provide an interactive analysis for generated covariance data when a 3D structure is available for a given protein sequence. Collectively, other existing servers either do not provide as versatile visualization techniques as CoeViz does or are not capable of processing large and/or multi-domain proteins in a reasonable time frame.
3. Discussion
Similarity or distance matrices are a natural way of presenting relationships between objects. However, analysis and visualization of such matrices for large datasets remain challenging. Different clustering algorithms and visualization methods usually have various strengths and weaknesses. To improve the process of visualization and navigation through the data, we have implemented an online platform for interactive visualization that combines a zoomable heatmap, an auto-scrolling hierarchical clustering tree, a scalable circular relationship diagram, and an interactive 3D multidimensional scaling scatterplot. All components are interconnected and synchronized, which greatly facilitates the large data analysis.
The purpose of this work is to demonstrate the concept of interactive multi-faceted analysis of large SMs and DMs. The analysis of covariance data in proteins was used as an illustration of the platform utility; when using the different approaches combined, one could easily browse the data and infer related objects from the sparse, noisy data. None of the individual methods alone would allow for such efficient data navigation and analysis.

