1. Introduction
The growing importance of the Internet of Things (IoT) creates a rapidly increasing necessity for wide area communication standards that guarantee reliable connectivity between a multitude of IoT devices. For this purpose, researchers have been developing various Low Power Wide Area Network (LPWAN) standards. IoT requires LPWAN standards to support long-range communication and high scalability of end-devices at a low cost. Also, ubiquitous indoor and outdoor connectivity as well as ultra-low power consumption are crucial aspects for reliable, transparent IoT applications that work for years on small batteries [
1]. To meet these requirements, numerous measures have to be considered for LPWAN design, such as modulation techniques, network topology, hardware complexity, use of radio frequent spectrum and regulations. In general, a trade-off between these measures and data rate has to be made [
2].
Context-awareness is an important aspect of IoT applications. This means that, depending on the application, an IoT device can alter its behavior based on the measurements it has conducted in its environment. In order to create context-awareness for IoT applications, the location of the device has to be obtained with minimal location error. Currently, Global Navigation Satellite Systems (GNSS) are the most commonly used method to do so. Although GNSS systems provide accurate location estimations, they have a few drawbacks which oppose some of the aforementioned IoT requirements. Firstly, GNSS receivers generally consume a lot of power, which limits the overall battery lifetime significantly. For instance, Global Positioning System (GPS) receivers consume 30–50 mA while obtaining a GPS fix, which can take tens of seconds [
3]. Furthermore, the GNSS location data will only be available on the device itself; forwarding the data through wireless communication involves additional power consumption. On the other hand, wireless positioning techniques can be applied to LPWAN communication messages without having to send additional messages which contain location information. Consequently, a device can be located without increasing power consumption. Secondly, GNSS systems tend to lose connectivity in indoor environments. Since many LPWAN standards operate in sub-GHz ISM bands, they can be used outdoor as well as indoor. Of course, GNSS remains a favorable solution for applications which require continuous high accuracy localization. However, many IoT use cases do not require such accurate location estimations and have more interest in long battery life-time. Therefore, wireless positioning based on LPWAN communication is an interesting alternative for long-term, low power localization.
Wireless positioning has been a prominent research topic for decades [
4,
5,
6]. Many techniques which were developed over the years are still suitable for localization with modern wireless technologies. These techniques estimate the location of a transmitter or receiver by analyzing physical characteristics of the communication link such as Received Signal Strength (RSS), timing information, signal phase, etc. This paper presents datasets which can be used for a RSS localization method called fingerprinting. With this method, a training database of communication messages is built by storing their transmitter location as well as the Received Signal Strength Indicator (RSSI) for all receiving base stations. Afterwards, RSSI measurements of new messages are matched to the fingerprints in the training database to estimate the transmitter’s location, e.g., by applying a
k-Nearest-Neighbor (
kNN) analysis, probabilistic methods, support vector machines, decision trees, etc [
5]. A main advantage of fingerprinting is that the locations of the base stations do not have to be known. In order to minimize the location estimation error, an extensive site survey has to be conducted to create a complete training database. Therefore, fingerprinting techniques are mostly used in constricted, indoor areas [
7,
8].
This paper presents three LPWAN datasets which can be used to evaluate fingerprinting methods in outdoor environments. All datasets were collected in real outdoor environments, no simulations or propagation models were used. Firstly, we created a Sigfox dataset in a large rural area between Antwerp and Ghent, Belgium. Secondly, an urban Sigfox dataset was built in the city center of Antwerp. Lastly, an urban LoRaWAN dataset was also built in the city center of Antwerp. In the near future, we also intend to create a rural LoRaWAN dataset in the large area between Antwerp and Ghent, as well as a rural and urban NB-IoT dataset.
The remainder of the paper is structured as follows.
Section 2 describes three state-of-the-art LPWAN standards, two of which were used to create our datasets.
Section 3 explains how the messages were collected and stored in a fingerprint database.
Section 4 illustrates how the dataset can be used by the research community. In
Section 5, the results of our analysis are listed. These results are then discussed in
Section 6. Finally,
Section 7 concludes the paper and states the intended future work.
2. Low Power Wide Area Networks
In recent years, numerous operators have been investing in the IoT by rolling out nation-wide LPWAN networks such as Sigfox [
9], LoRaWAN [
10] and Narrowband-IoT (NB-IoT) [
11]. This section discusses these technologies and their constraints. Although our current datasets only include Sigfox and LoRaWAN data, this section also describes the NB-IoT standard to provide the reader with a complete overview of the state of the art. In the near future, we will conduct measurement campaigns to create NB-IoT datasets as well.
Table 1 displays a summary of the aforementioned LPWAN standards.
2.1. Sigfox
Sigfox is a proprietary technology which operates on 868 MHz in Europe and on 902 MHz in the US. Because it uses an Ultra-Narrow Bandwidth (UNB) modulation technique which is called Differential Binary Phase Shift Keying (DBPSK), numerous devices can communicate over ranges up to 10 to 50 km with low power consumption, low-cost hardware setup and easy implementation [
9]. However, this modulation technique has a few downsides as well. Due to the narrow bandwidth, the maximum uplink throughput that can be achieved is only 100 bps. Also, regional regulations impose a limited duty cycle of 1%, i.e., 36 s per hour and six seconds per message [
12]. Therefore, the daily limit for a Sigfox device equals 140 uplink messages (twelve bytes each) and four downlink messages (eight bytes each). Downlink messages are modulated with Gaussian Frequency Shift Keying (GFSK) and have to be requested by the end-device itself, direct communication between user and device is not possible. To improve the likelihood of successful reception, messages can be sent multiple times (three by default) on random frequency channels. Due to the Sigfox network architecture, messages from a single end-device are received by multiple base stations.
Since Sigfox uses UNB modulation, timing methods for localization are not a suitable option [
13]. Therefore, several other localization methods have been researched. Firstly, Sigfox Geolocation is built on probabilistic distance calculation using RSSI measurements. If a message is received by three or more base stations, the location of the transmitter can be estimated via triangulation. For a location accuracy below 500 m, Sigfox advises to use Sigfox Geolocation as a complementary method to other positioning systems such as WiFi localization or GPS. Secondly, Sallouha et al demonstrated RSSI fingerprinting as a feasible approach [
14]. By providing their Sigfox nodes with GPS modules, the researchers were able to apply fingerprinting to subdivide a large region into classes. Within these classes, location estimation is improved by distance estimation between end-devices and GPS nodes within the same class. However, the radius of a class was limited to 200 m to minimize the location error, as errors of over 60 m were measured for classes with a larger radius. This approach would demand many GPS nodes, which impedes scalability. Lastly, Janssen et al implemented a WiFi fingerprinting method in a large urban area [
15]. A mobile device was carried around in the city of Antwerp, Belgium while sniffing for WiFi BSSIDs. Every 10 minutes, the device simulated a Sigfox message containing the two BSSIDs with the highest RSSI, which were compared to open source WiFi BSSID databases to obtain a location estimate. This approach led to estimation errors of 23 m to 45 m. However, the Sigfox transmissions had to be dedicated for localization purposes, whereas other methods benefit from the physical characteristics of the Sigfox communication link.
2.2. LoRaWAN
Another widely used proprietary long range technology is LoRaWAN. Contrary to Sigfox, LoRaWAN applies a proprietary Chirp Spread Spectrum (CSS) modulation technique called LoRa, which stands for ‘Long Range’ [
16]. In Europe, LoRa operates in the license free 433 and 868 MHz bands; in the US, 915 MHz is used. Symbols are encoded using a number of chirps, which causes the signal to be spread over a wider channel bandwidth. This technique reduces interference with other signals, protects the signal against jamming and cancels out multi-path and fading effects. The number of chirps is determined by the spreading factor, which can range from 7 to 12. By altering this parameter, a balance between data rate and range can be mediated. With a high spreading factor, long ranges can be achieved at the expense of a low 300 bit/s data rate. On the other hand, the data rate can be raised up to 37.5 kbit/s for shorter distances by using a low spreading factor. Because LoRaWAN supports multiple channels simultaneously, end-devices are able to exchange data for a longer period of time without violating duty cycle regulations. Subsequently, payloads of up to 250 B can be sent.
Compared to Sigfox, LoRa works with a higher bandwidth which enables localization with Time Difference Of Arrival (TDoA). However, very accurate synchronization between the receiving base stations is required for such a method. Distances between the transmitter and the base stations are estimated based on the time of flight of a signal, a location estimation is obtained via triangulation. Semtech has implemented a proprietary geolocation feature in LoRaWAN, which is based on TDoA. The LoRa Alliance claims that this feature achieves an estimation error of 20 to 200 m, depending on the conditions [
17]. Fargas et al evaluated a TDoA method, and concluded that it is possible to obtain a location accuracy of around 100 m for static transmitters [
3]. Further research has to be conducted to improve the location accuracy for real-time tracking of dynamic targets.
2.3. NB-IoT
In 2016, the 3rd Generation Partnership Project (3GPP) has introduced the NB-IoT standard. One of the main advantages of this new standard is its compatibility with traditional cellular networks. A 200 kHz GSM carrier can be re-purposed as an NB-IoT carrier. Also, NB-IoT can be implemented in the guardband of the LTE carrier or inside an LTE carrier by assigning a 180 kHz Physical Resource Block (PRB). Numerous properties such as MAC protocols are inherited from LTE. For instance, Orthogonal Frequency Division Multiple Access (OFDMA) is used for downlink and Single Carrier Frequency Division Multiple Access (SC-FDMA) is implemented for uplink. As a result, data rates are limited to 250 kbps for downlink, and 20 kbps for uplink [
11]. Raza et al summarize a few flaws of NB-IoT [
2]. Firstly, not all messages are acknowledged due to limited downlink capacity. Secondly, implementation of packet aggregation introduces additional latency which is undesirable for time-critical communication. Thirdly, the performance of NB-IoT may decline when the network is being heavily used for voice- and data traffic. Lastly, NB-IoT is a very recent LPWAN technology. Thus, the amount of commercial applications has been limited up to now. More research has to be conducted in order to obtain more knowledge about real world performance and battery life of and NB-IoT end-device.
In order to locate an NB-IoT end device, Observed Time Difference of Arrival (OTDoA) localization could be used. A number of synchronized base stations transmit a Positioning Reference Signal (PRS), which is received by the end device. The end device forwards the TOA per transmitting base station to a localization server, where the difference between these TOA’s and the PRS is used to calculate the estimated location of the end device [
18].
In the remainder of this paper, we describe how our Sigfox and LoRaWAN datasets were collected and analyzed. Future work includes a similar measurement campaign and analysis for NB-IoT messages.
3. Collection Methodology
From 16 November 2017 until 5 February 2018, three LPWAN datasets were collected in two different environments. Firstly, a Sigfox dataset was recorded in a large area between Antwerp and Ghent (±1068 ), which was delineated because of its overall rural characteristics. Secondly, another Sigfox dataset was recorded in an urban area in and around the city center of Antwerp (52.97 ). Lastly, a LoRaWAN dataset was collected in the same urban area. The messages in these datasets contain GPS coordinates, which allows the user to correlate accurate location information with RSSI measurements on that location. For the Sigfox datasets, a proprietary, nation-wide Sigfox network which was deployed by EngieM2M was used. The LoRaWAN dataset was collected over a proprietary, nation-wide network that was rolled out by Proximus. In this section, the collection and structure of each dataset is discussed.
3.1. Sigfox Rural
As shown in
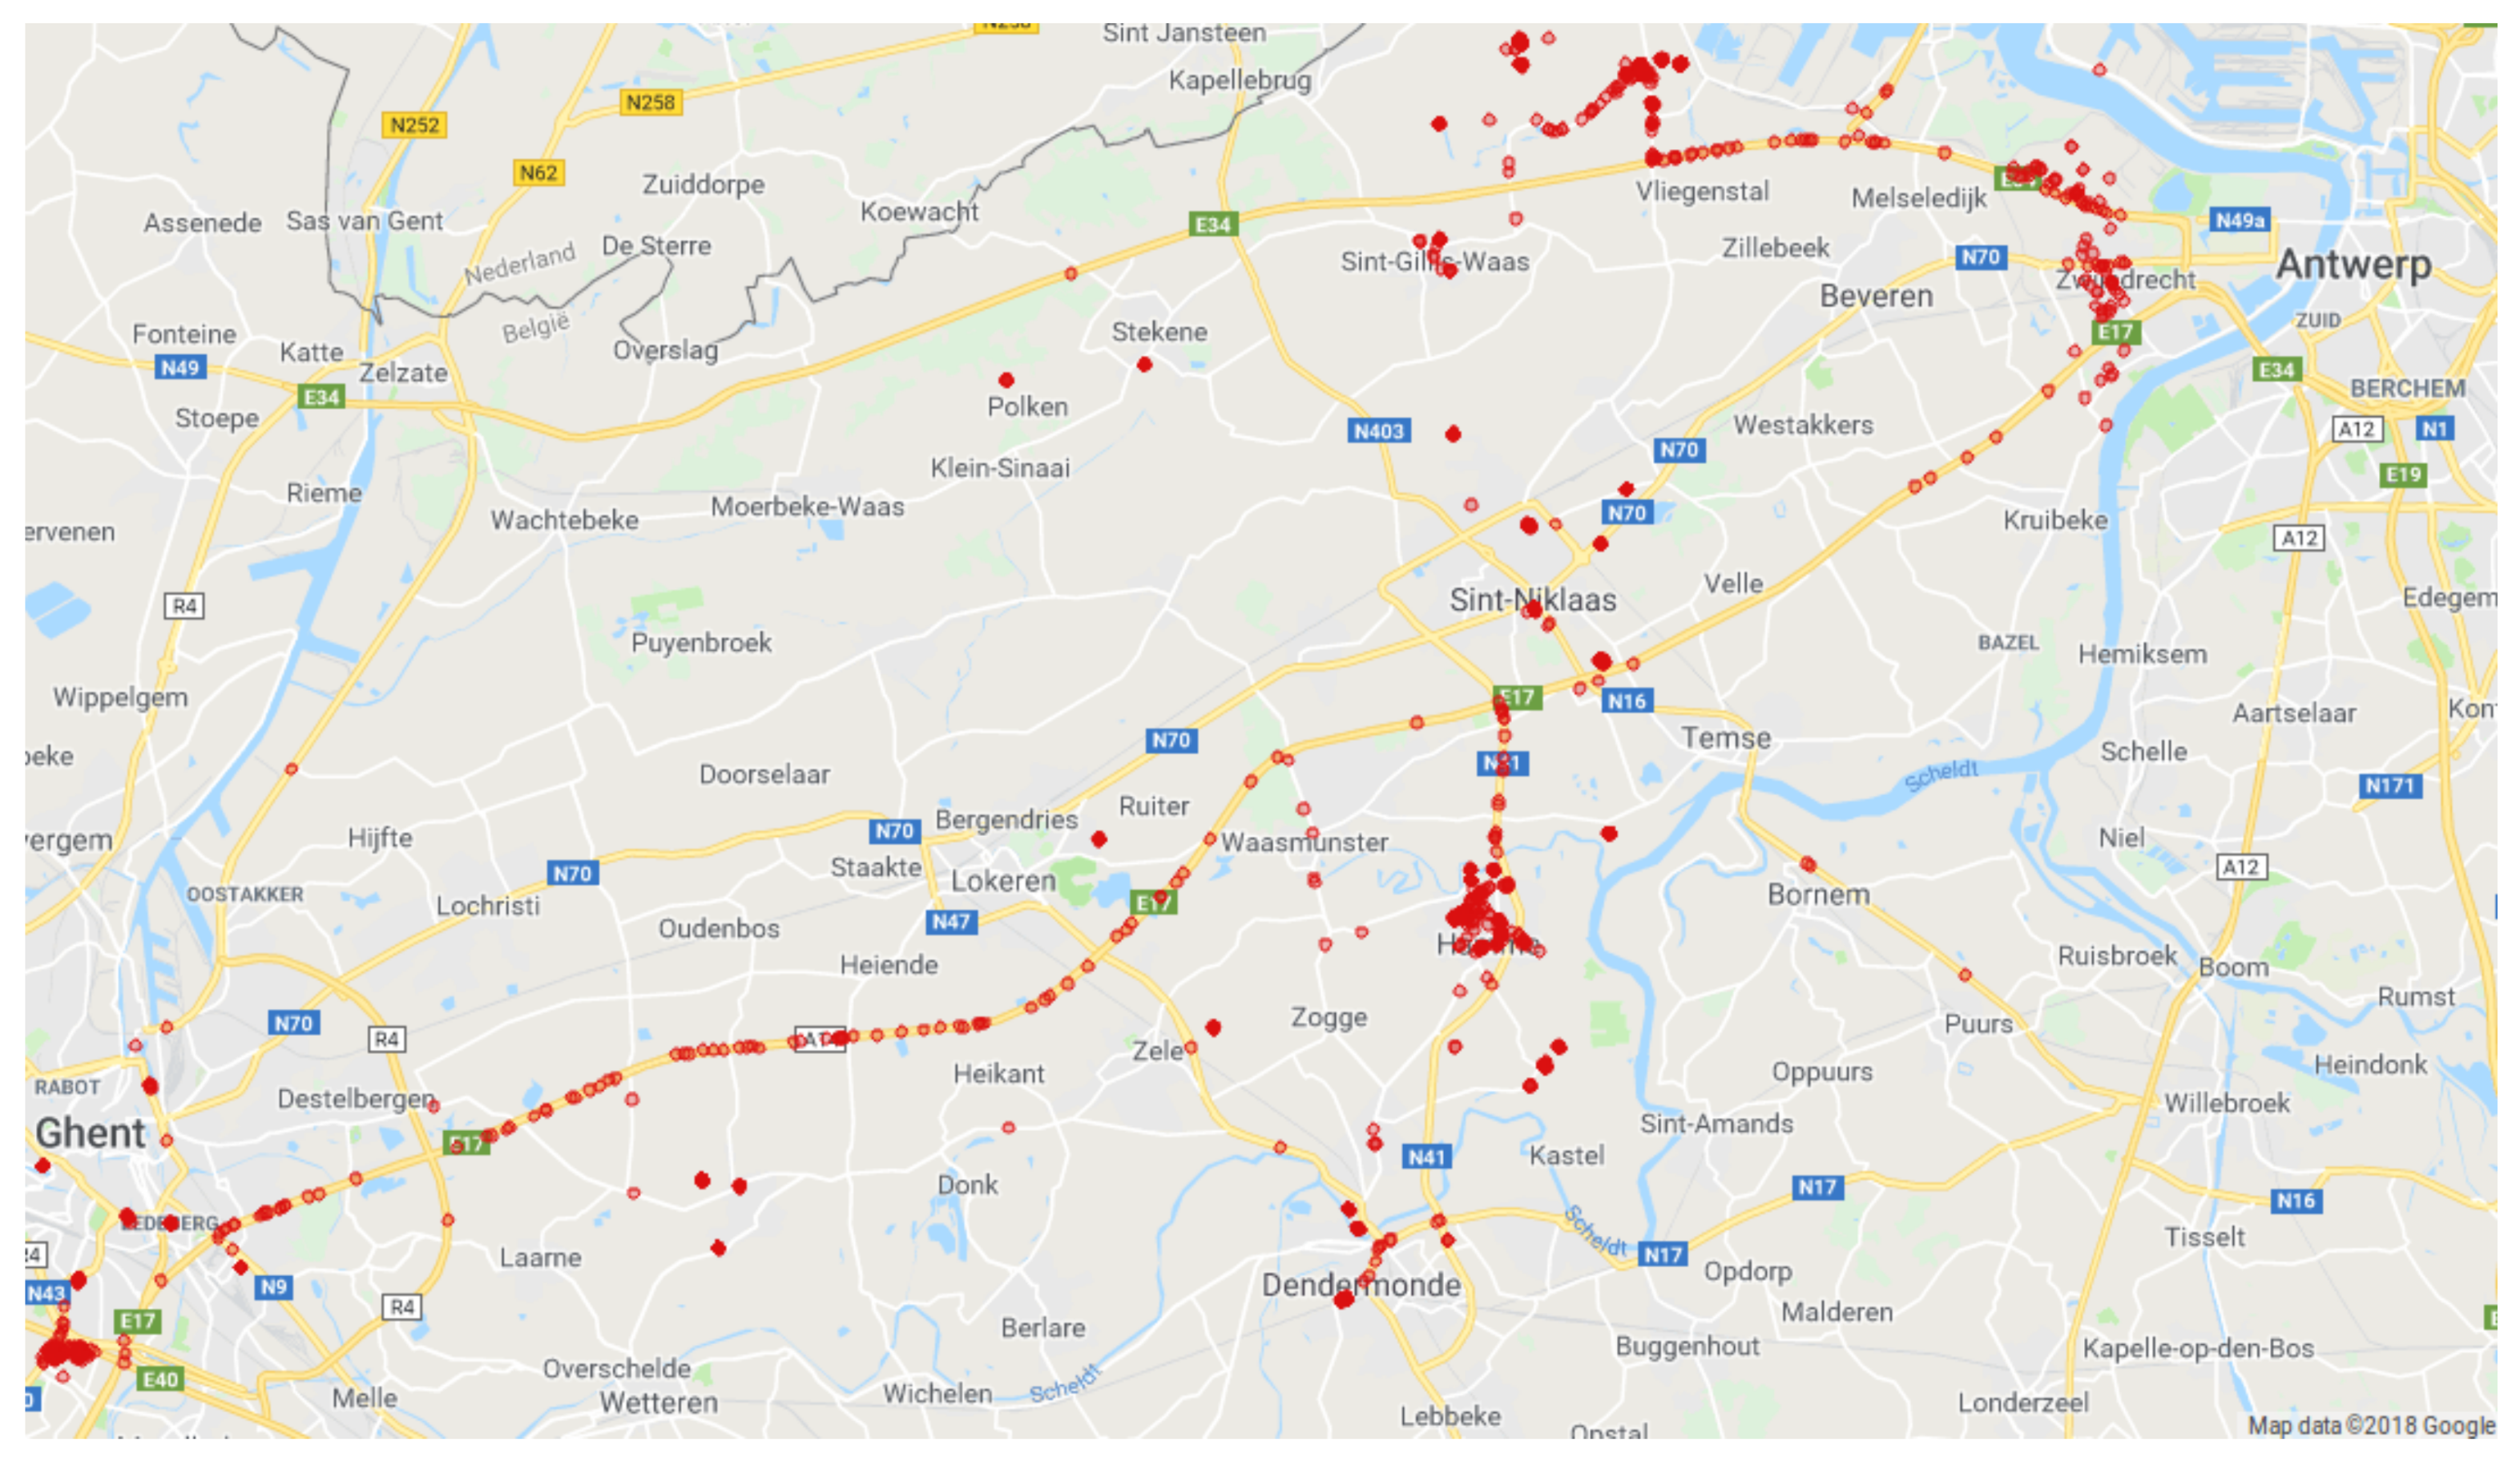
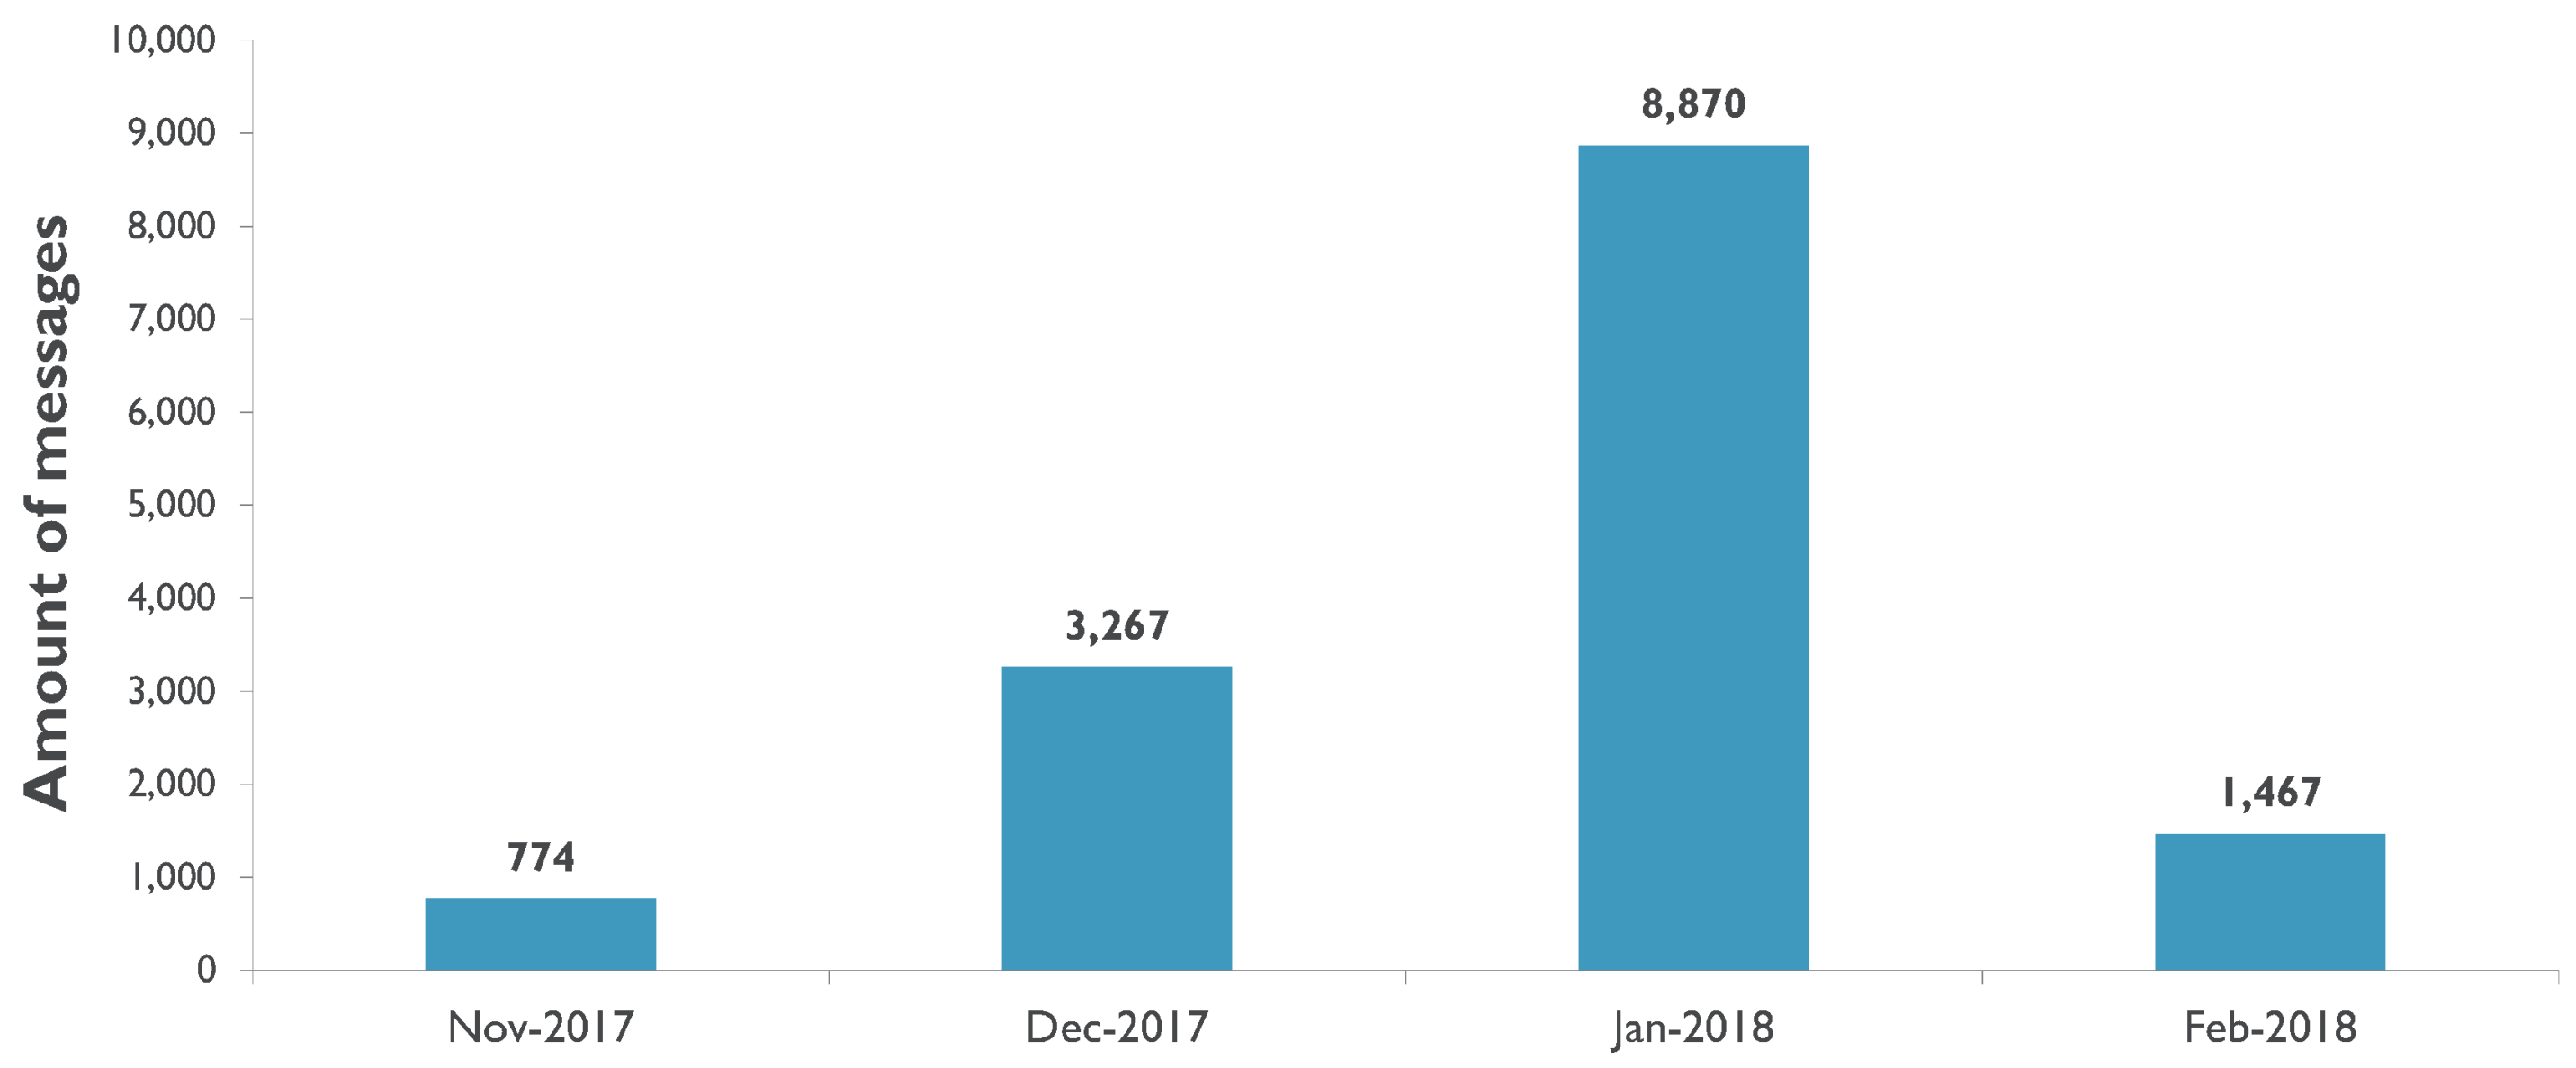
Figure 1, the first dataset was collected in a large rural area between the cities of Antwerp and Ghent. This dataset contains 25,638 Sigfox messages which were received between 16 November 2017 and 5 February 2018, as indicated by the temporal spread graph in
Figure 2. In order to collect these messages, ten
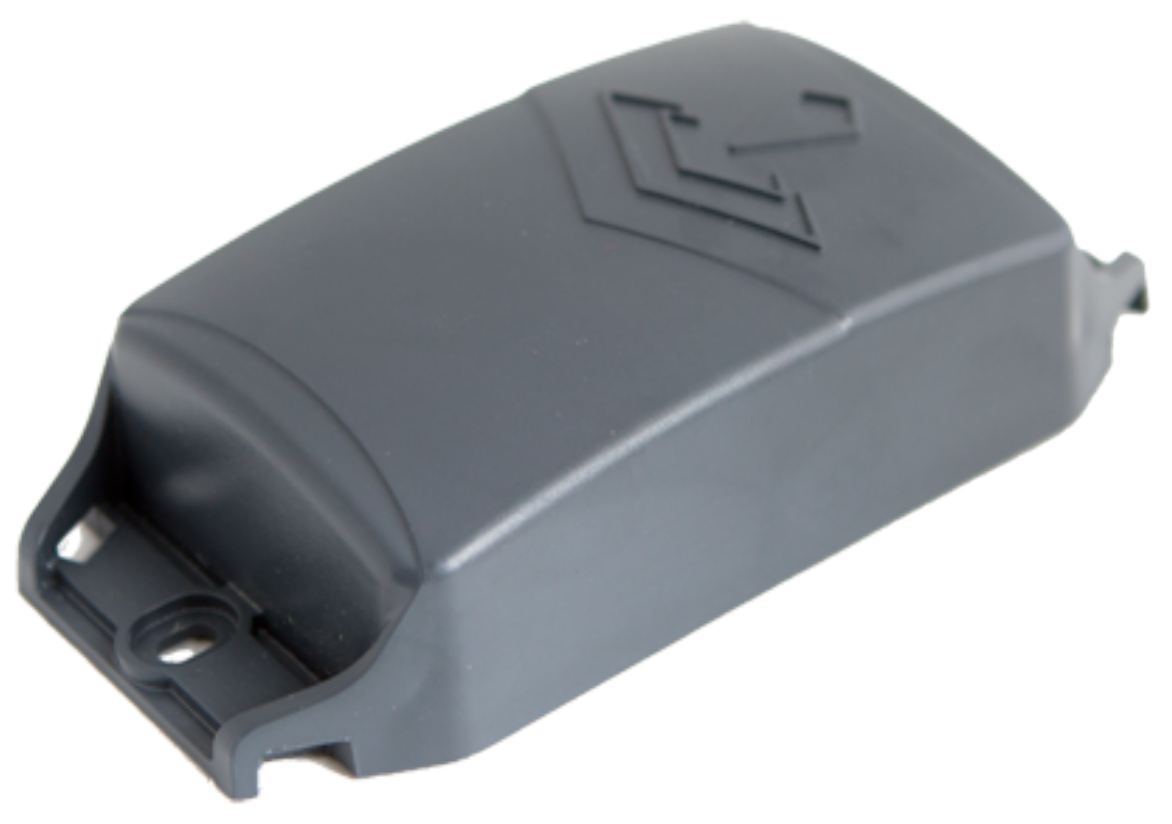
Sensolus Stickntrack devices [
19], like the one in
Figure 3, were carried by people who commute by car between the cities of Antwerp and Ghent on a daily basis. These devices contain a Ublox CAM-M8C GPS receiver, which obtains a GPS fix every ten minutes. A Sigfox message with GPS coordinates is sent directly after obtaining this GPS fix. Due to the fact that the total transmission time of a Sigfox message can take up to six seconds, the received coordinates of the transmitting device could differ from the actual device coordinates at receiving time. Therefore, the correlation between RSSI measurements and the received GPS coordinates could hold an additional GPS location estimation error of tens of meters, depending on the ground speed of the transmitting device. Additional information such as the ground speed of the device, or GPS signal quality measurements such as the Horizontal Dilution Of Precision (HDOP) could not be included in the message because of the limited Sigfox payload size.
After receiving a message from a Stickntrack device, a callback function in the Sigfox backend forwards a JSON string for every base station that received that message. Apart from the message payload, such a JSON string contains a message identifier, a base station identifier, the RSSI for that base station and the receiving time in ISO 8601 format. All these JSON strings are logged in a MongoDB database on a local data server. Afterwards, all entries in this raw database were grouped by their message identifier and receiving time in order to create a new database, where every entry represents a unique Sigfox message. Finally, this database was queried to extract all Sigfox messages in the rural area.
Table 2 illustrates how these messages are stored in the rural Sigfox dataset. Every row represents one of the 25,638 unique messages in the dataset. The first 137 columns denote all base stations that were found in the rural area. If a message was received by a base station, the RSSI for that base station is filled in. For base stations that did not receive the message, an out of range RSSI of −200 dB is inserted. This approach was based on the collection methodology for an indoor WiFi fingerprinting database, which was created by Torres-Sospedra et al [
8]. The last three columns of our rural Sigfox dataset depict the receiving time, latitude and longitude of the message.
3.2. Sigfox Antwerp
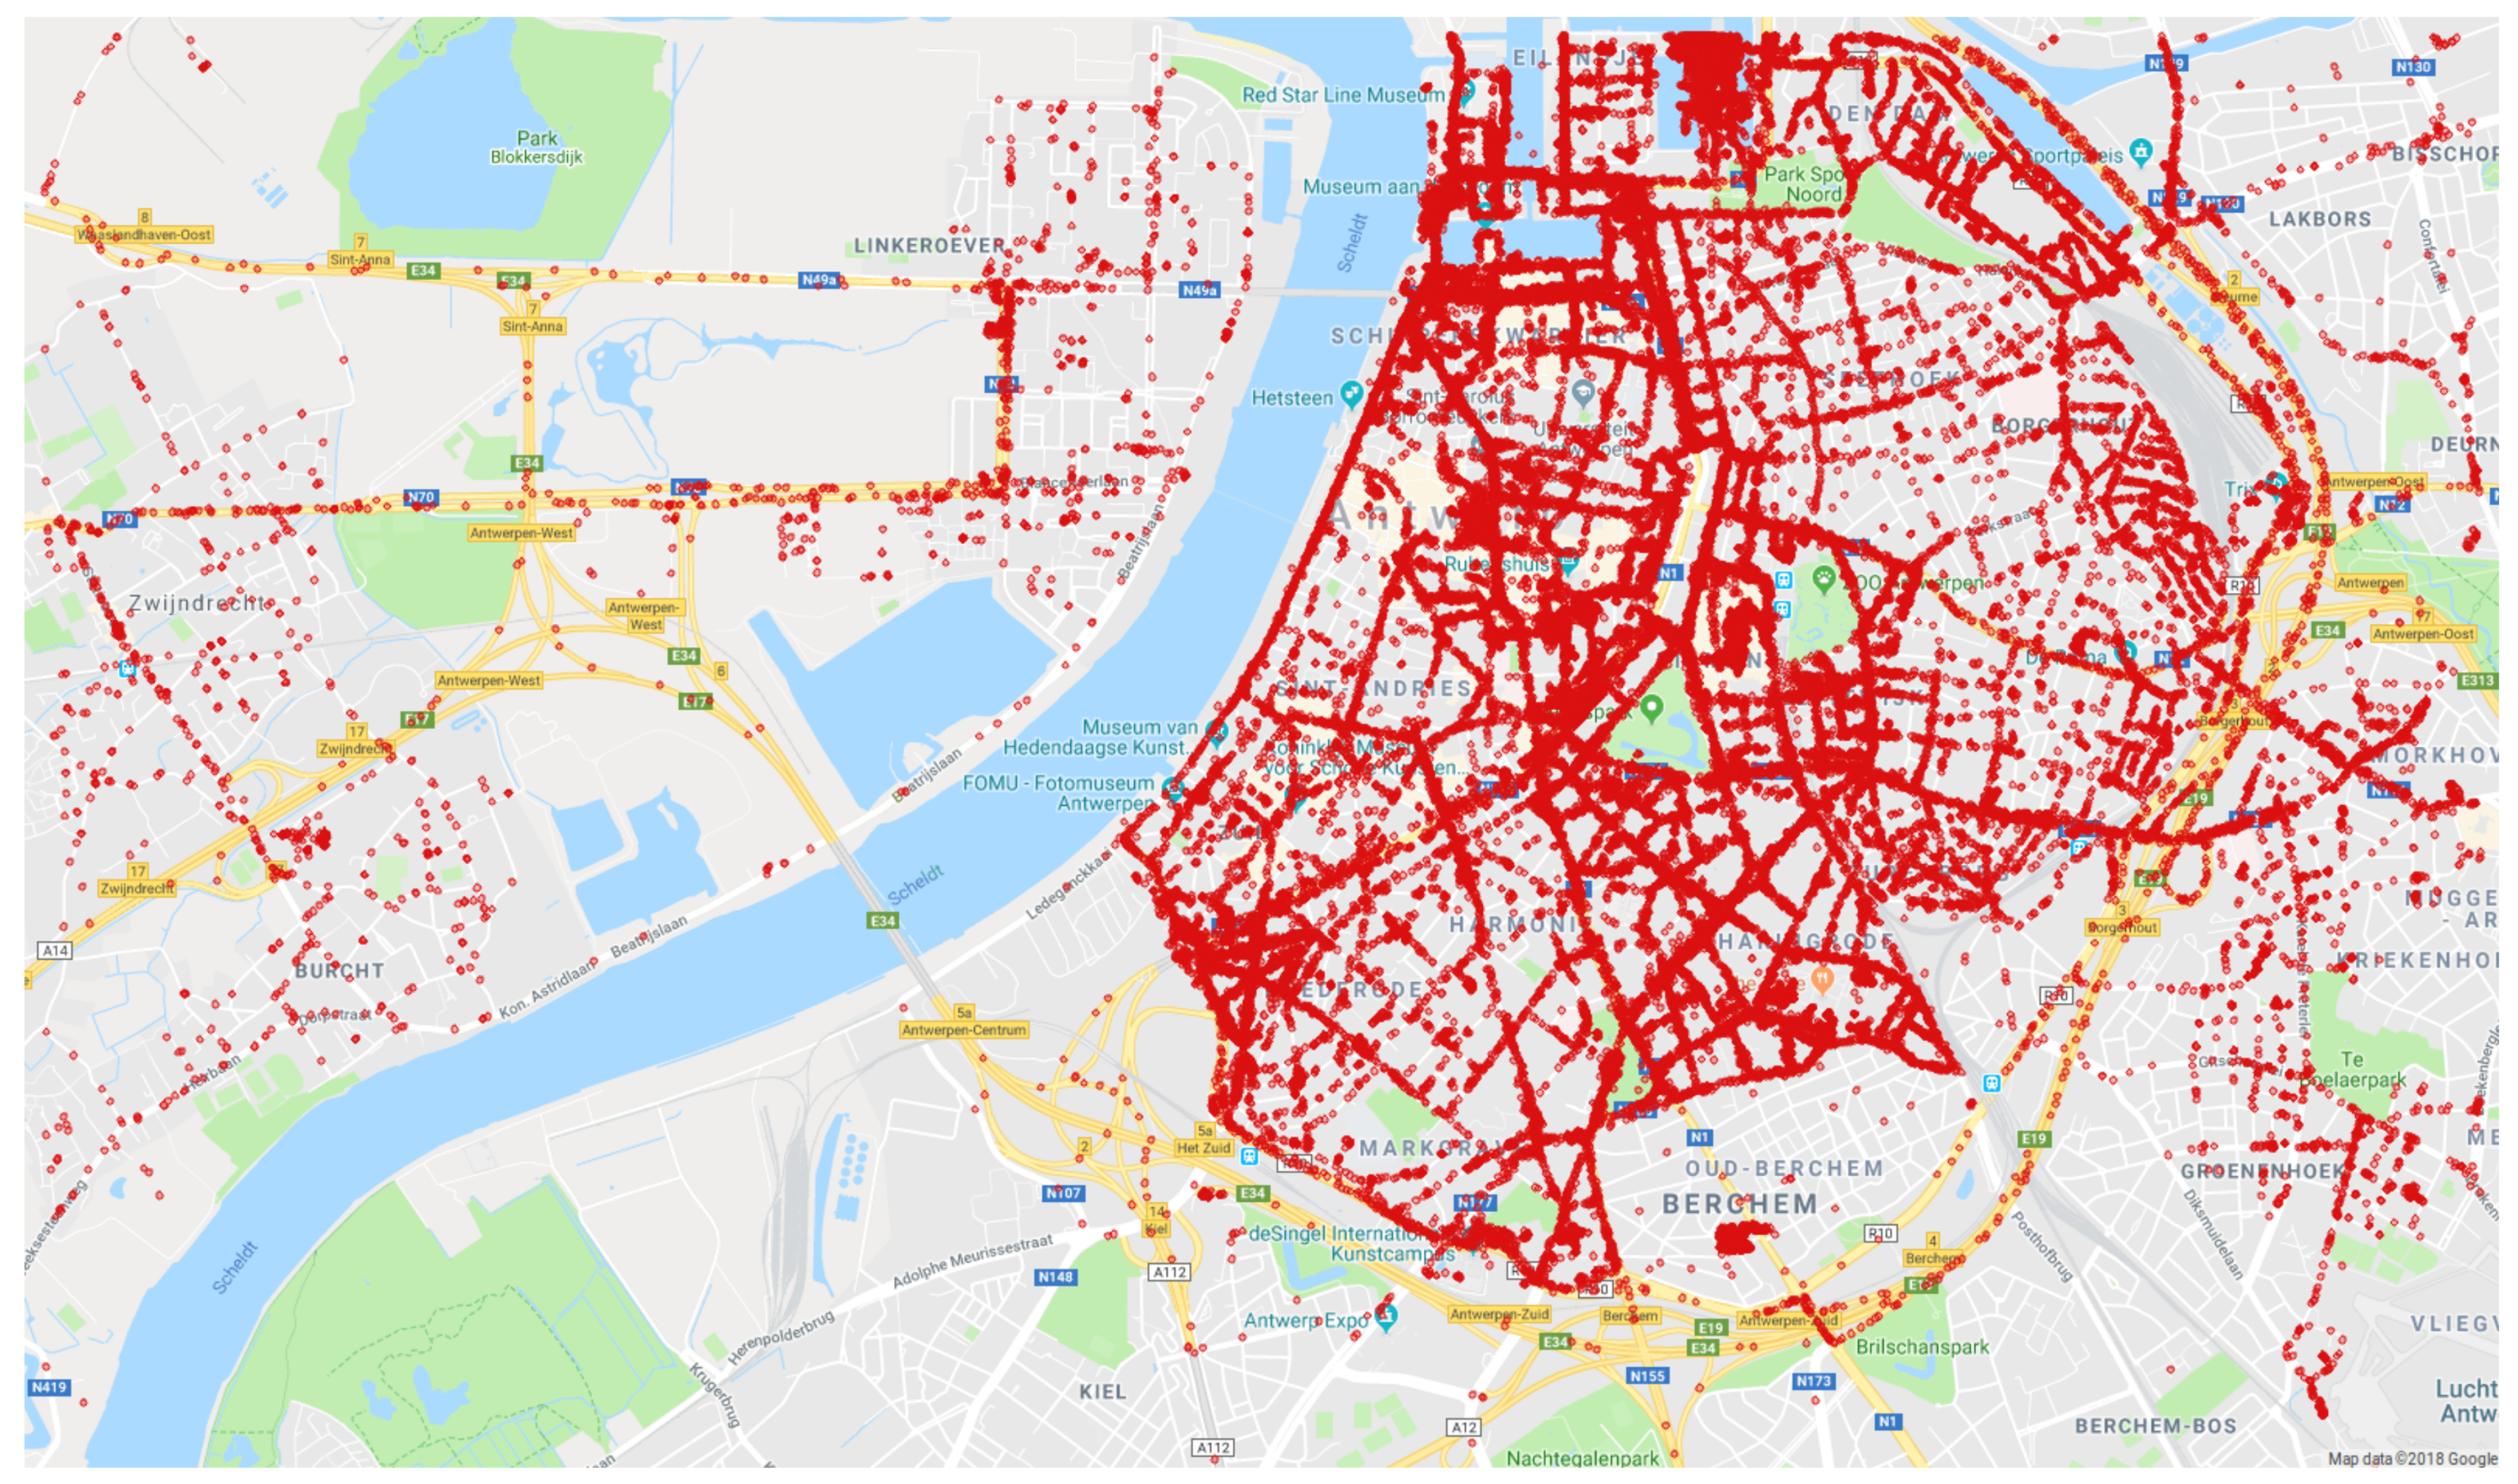
For the second dataset, 14,378 Sigfox messages were collected in the city center of Antwerp. The spatial and temporal spread of this dataset is depicted in
Figure 4 and
Figure 5 respectively. In this area, Latré et al created the City of Things testbed to conduct network and data experiments in a realistic urban setting [
20]. One of these experiments aims to measure the air quality in the city of Antwerp. For this purpose, 20 cars of the Belgian postal services are provided with air quality sensors as well as communication hardware to forward the air quality measurements to a local server.
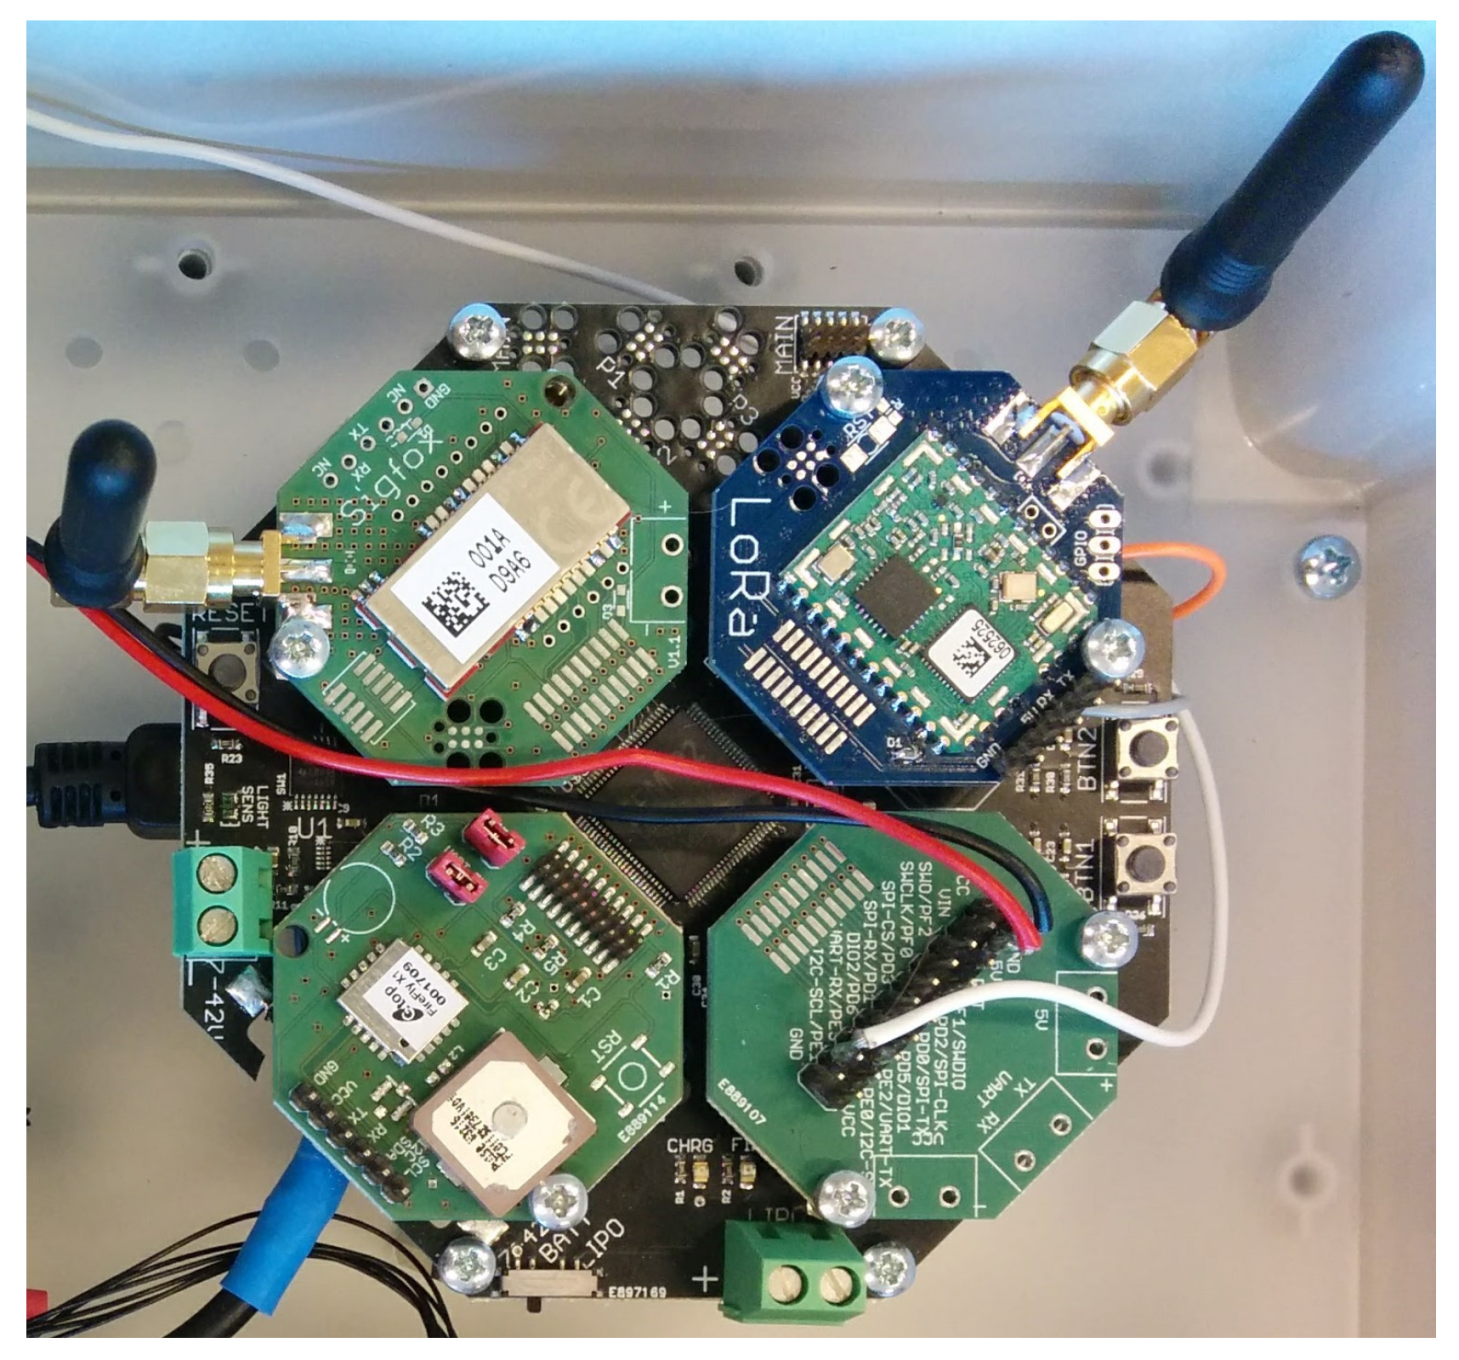
Figure 6 shows the OCTA-Connect hardware modules that are used to broadcast the measurements via Sigfox or LoRaWAN [
21]. One of the OCTA modules also includes a Firefly X1 GPS receiver which acquires new GPS coordinates every 0.1 s. Every twelve minutes, the latest GPS coordinates are sent over Sigfox via the TD1207R radio module. The collection methodology of this dataset has the same constraints as the rural Sigfox dataset. For fast moving transmitters, the GPS coordinates that were sent at transmission time might be different from the actual GPS coordinates at receiving time. Hence, the correlation between GPS coordinates and RSSI of a message could hold an additional GPS error. However, this error will be less severe compared to the rural Sigfox dataset, as traffic in the city center does not move as fast as in rural areas. Also, the transmitters were frequently halted because of the many stops the postal service cars have to make. The ground speed and HDOP of the transmitter were not added to the message due to the limited Sigfox payload size.
From this point forward, the Sigfox messages are processed and stored with the same methodology that is used for the rural Sigfox dataset. The Sigfox backend forwards JSON strings for all duplicates of a message to a local data server. These strings, which contain GPS coordinates, base station ID, base station RSSI, receiving time and a message ID are then grouped to form a new database of unique Sigfox messages. By querying this database, a list of all messages within Antwerp is extracted.
As shown in
Table 3, the urban Sigfox dataset is structured in the same way as the rural Sigfox dataset. All rows represent one of the 14,378 messages in the urban dataset, the last three columns represent the receiving time, latitude and longitude of a message. The columns before indicate which of the 84 base stations in the urban area have received the message. If a base station has not received the message, an RSSI of −200 dB is inserted in the cell. As the urban and rural Sigfox datasets were recorded in adjacent areas, base stations that are located near the border of these areas can be found in both datasets. However, these stations do not necessarily share the same identifier: e.g., ‘BS 1’ in the urban Sigfox dataset could be the same station as ‘BS 36’ in the rural Sigfox dataset. If the user intends to combine both Sigfox datasets, the mapping of the base ID’s of these base stations can be found in the Zenodo repository.
3.3. LoRaWAN Antwerp
Lastly, a large dataset of LoRaWAN messages was obtained in the city center of Antwerp. It holds 123,529 messages which are collected from 17 November 2017 until 5 February 2018, the spatial and temporal spread of the dataset can be found in
Figure 7 and
Figure 8 respectively. The City of Things hardware that is used to create the urban Sigfox dataset (
Figure 6) is also used to collect the urban LoRaWAN dataset: twenty cars of Antwerp’s postal service drove around in the city center while carrying this hardware; the Firefly X1 GPS receiver continuously acquired the current latitude and longitude of the car, as well as the HDOP of the GPS signal. This location information is sent in a LoRaWAN message via the IM880B-L radio module. Compared to Sigfox, LoRaWAN implements a much wider bandwidth and higher data rate. Therefore, the radio modules were able to send a new message every minute. Also, additional information such as the HDOP could be included in the message because of the larger maximum payload. Concisely, more data could be sent more frequently, which is why the urban LoRaWAN dataset is significantly larger than the Sigfox datasets. Including the HDOP in the message allows the user of this dataset to omit messages with poor GPS signal quality. However, the GPS coordinates at receiving time could still differ from the GPS coordinates at transmission time, especially if the transmitter is moving at high speeds.
On the LoRaWAN backend server, a callback function is configured to forward the payload of each message, with additional network information attached, to the local data server.
Table 4 shows how this information was stored in the urban LoRaWAN dataset. Similar to the Sigfox datasets, the first columns indicate the receiving base stations and their respective RSSI. In the urban area that was explored for this dataset, 68 LoRaWAN base stations are detected. In the next columns, the receiving time, spreading factor, HDOP, latitude and longitude are stored.
4. Analysis
This section describes how our LPWAN datasets can be used for basic kNN fingerprinting localization. Of course, is not the only algorithm that can be used, the implementation below merely serves as an example on how to use our datasets. Our future work includes an extensive evaluation on different fingerprinting implementations such as support vector machines, decision trees, neural networks, etc.
Before localization, a dataset should be split up into three subsets: a training set, an evaluation set and a test set. In order to ensure an unbiased spatial spread across the subsets, the main dataset should be divided randomly. The training set, which should be the largest of the three subsets, serves as a reference database for the fingerprinting algorithm. Afterwards, these subsets can be used for the localization algorithm as follows. Firstly, a distance matrix between the training and evaluation sets has to be computed by calculating the Euclidean distance
d between every fingerprint in the evaluation set and every fingerprint in the training set, as illustrated in Equation (
1). In this equation, the RSSI measurements for the evaluation fingerprints and the training fingerprints are represented by
and
respectively.
Every distance
d is stored in a matrix with
m rows and
n columns, with
m matching the amount of samples in the evaluation set and
n the amount of samples in the training set. Secondly, this distance matrix is used to find the
k Nearest Neighbors (
kNN) of an evaluation fingerprint: for every row in the matrix, the column indexes of the
k smallest distances
d are extracted and compared to the real world locations of the corresponding row indexes of the training set. These rows in the training set are the training fingerprints which correspond best to the evaluation sample. The centroid of the locations of these
k training fingerprints can be used as the location estimate for the evaluation sample. By comparing this estimate to the actual GPS coordinates of the evaluation sample, the location estimation error can be quantified. This location estimation process is repeated for every row in the distance matrix with different values for
k, to calculate the mean estimation error for a given
k and subsequently, to find an optimal value for
k. Lastly, the test subset is used to validate this optimal
k with fingerprints that do not occur in the training or evaluation subset. A new Euclidean distance matrix between the training subset and the test subset is created and used to calculate the mean location estimation error for the best
k. In the list below, the main steps of this basic fingerprinting algorithm are summarized, whereas
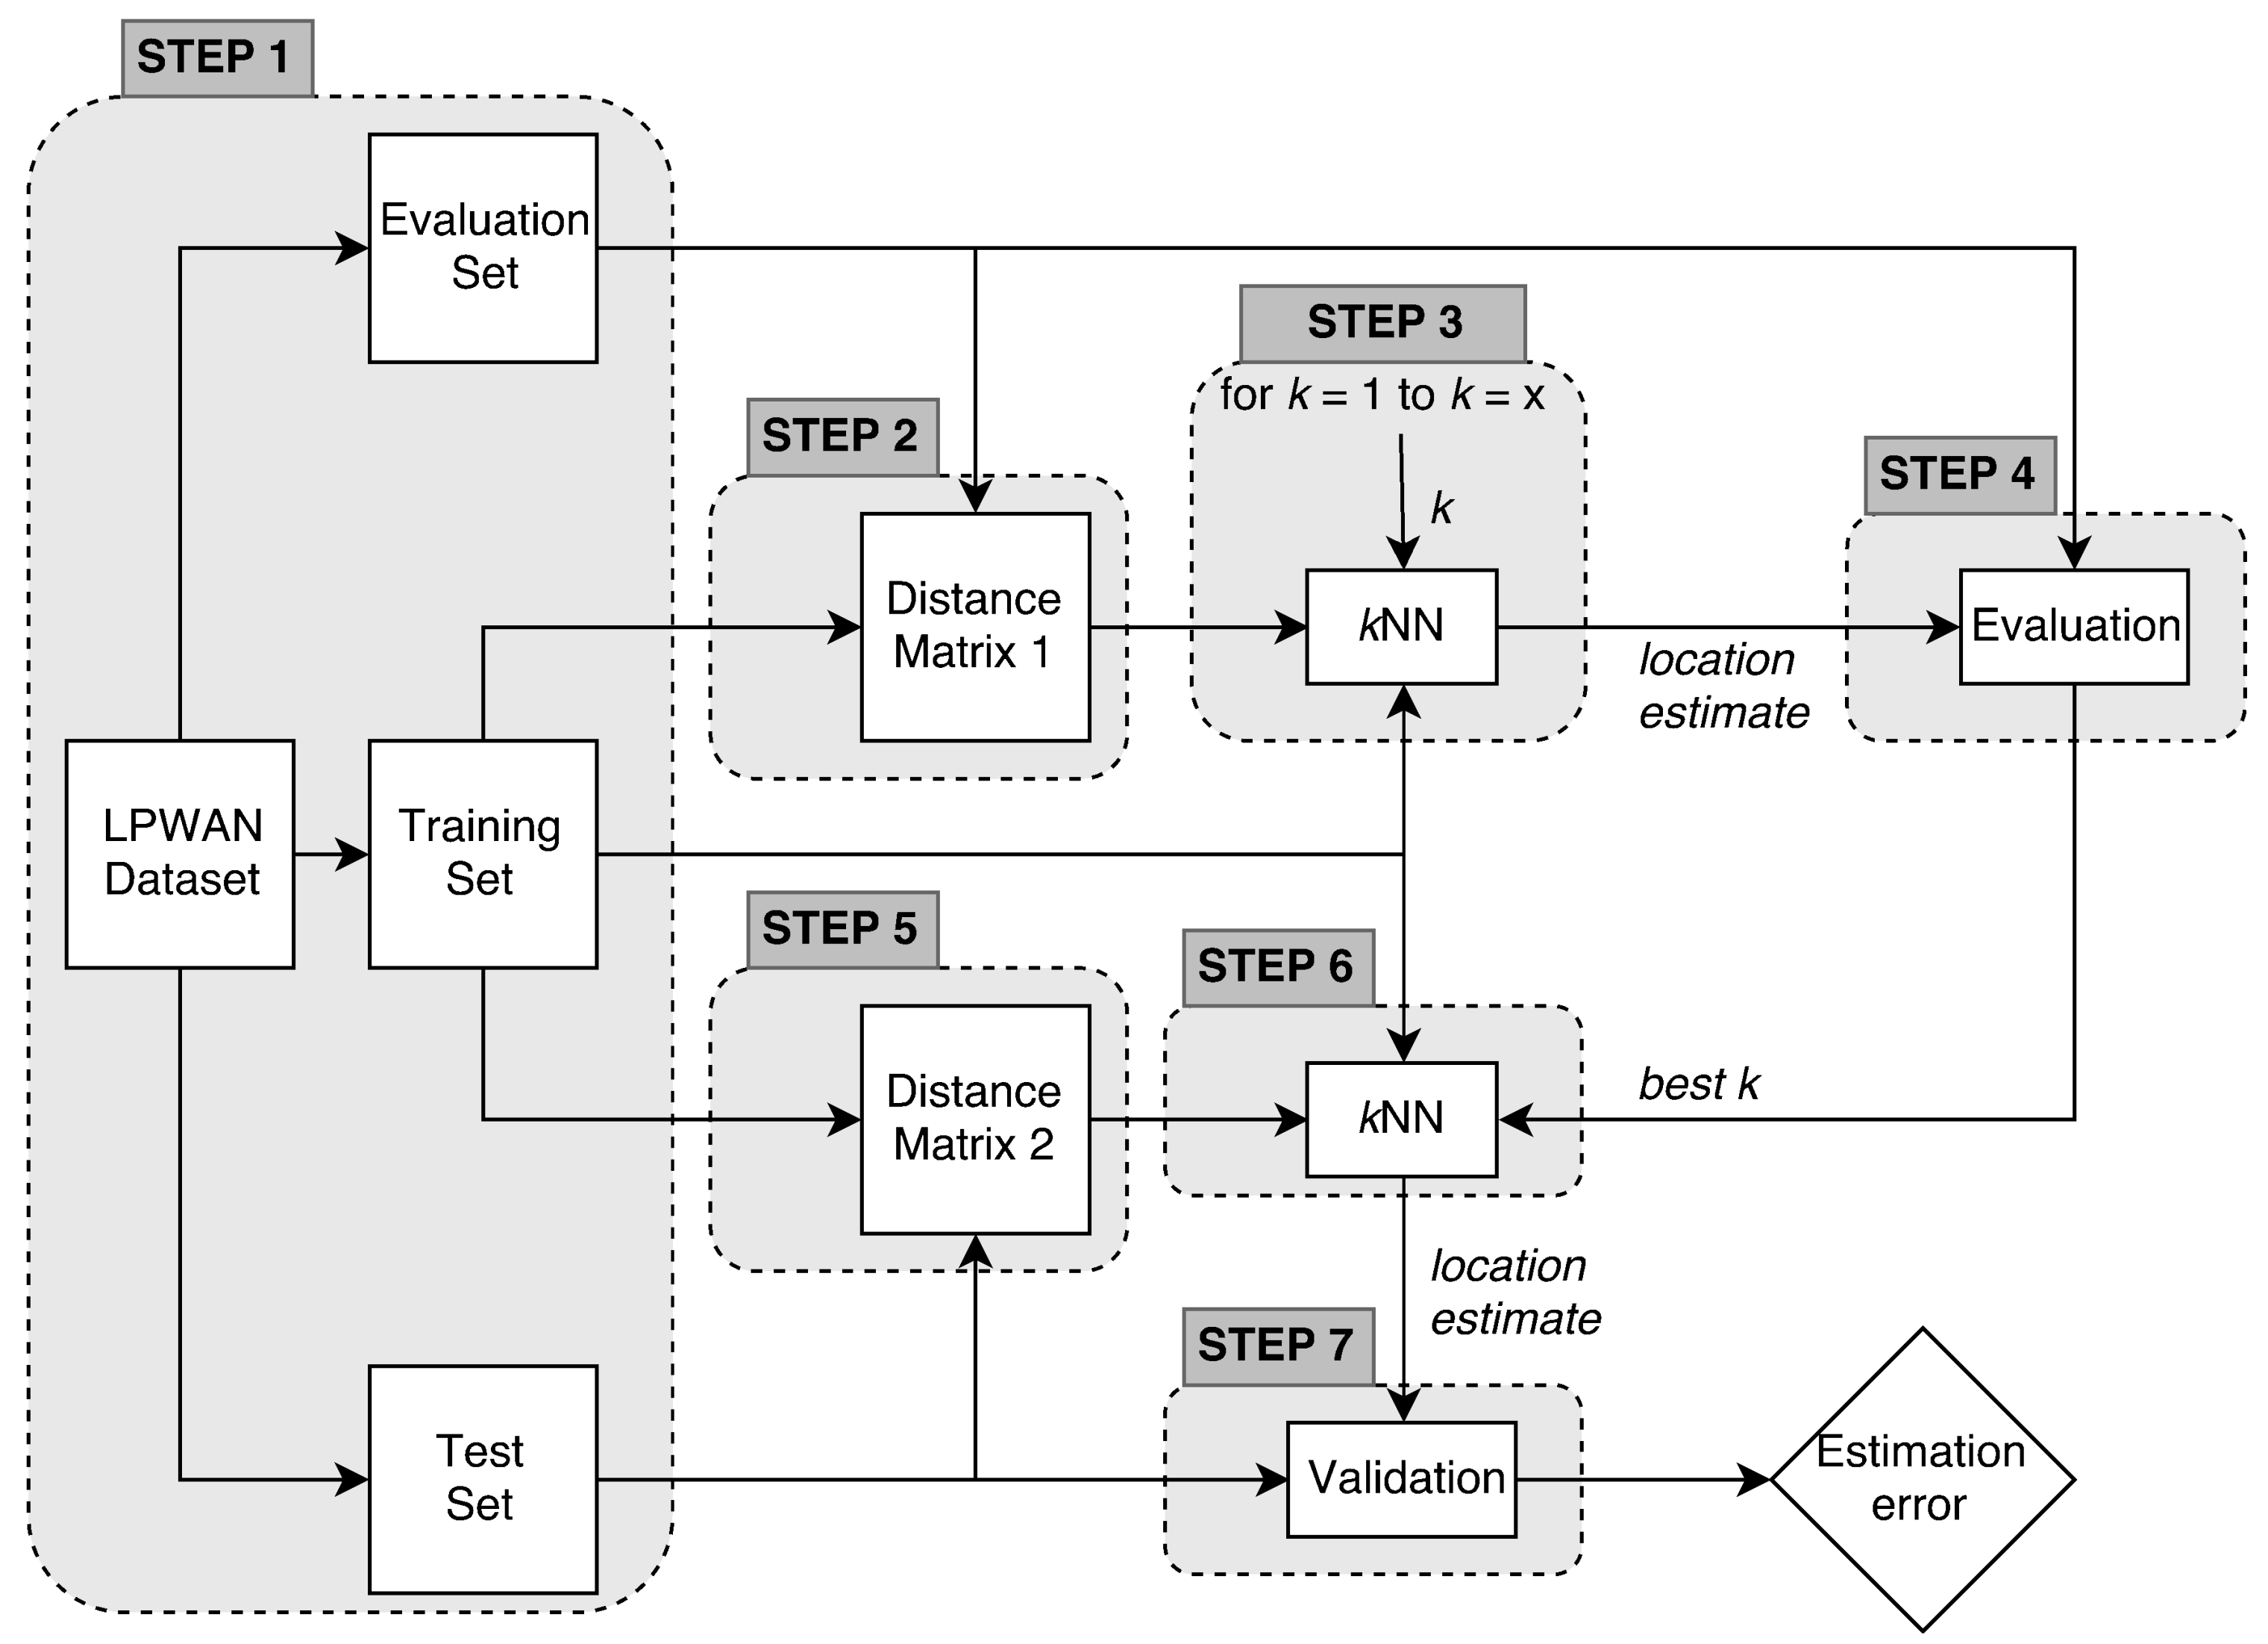
Figure 9 displays a concise visual representation.
- Step 1:
Split the dataset in subsets. E.g., 70% training, 15% evaluation and 15% test samples.
- Step 2:
Calculate a Euclidean distance matrix between the training set and the evaluation set.
- Step 3:
In the distance matrix, find the k nearest neighbors of every evaluation sample. Use the centroid of the k nearest training fingerprints as the location estimate. Repeat this step for all k’s you want to evaluate.
- Step 4:
Calculate the mean estimation error for every k of step 3. We consider the k with the smallest mean estimation error to be the optimal parameter.
- Step 5:
Calculate a Euclidean distance matrix between the training set and the test set.
- Step 6:
In the new distance matrix, find the k nearest neighbors of every training sample. For k, use the optimal parameter that was obtained in step 4. Use the centroid of the k nearest training fingerprints as the location estimate.
- Step 7:
Validate the optimal value for k by calculating the estimation errors.
Of course, the computational complexity of this approach increases together with the size of the datasets that are used. Calculating the entire distance matrix between the training and evaluation sets requires where m is the size of the evaluation set, x is the dimension of a single sample and n is the size of the training set. Obtaining the k nearest neighbors of every evaluation sample requires Therefore, the computational complexity can be written as .
5. Results
To evaluate the usability of our LPWAN datasets, we have executed the fingerprinting algorithm that was described in
Section 4 on all three datasets. Every dataset was randomly split up in a training subset, an evaluation subset and a test subset; the sizes of these subsets are 70%, 15% and 15% of the total size of the complete set. The evaluation subsets were used to find the optimal parameters for each LPWAN dataset. A parameter sweep was conducted, varying
k from 1 to 15. We decided upon an optimal value for
k per dataset by calculating which
k resulted in the lowest mean location estimation error. This optimal
k was then validated with the test subset, as described in steps 6 and 7 of the algorithm in
Figure 9. The results of this validation are shown in the logarithmic box plots of
Figure 10, as well as in
Table 5.
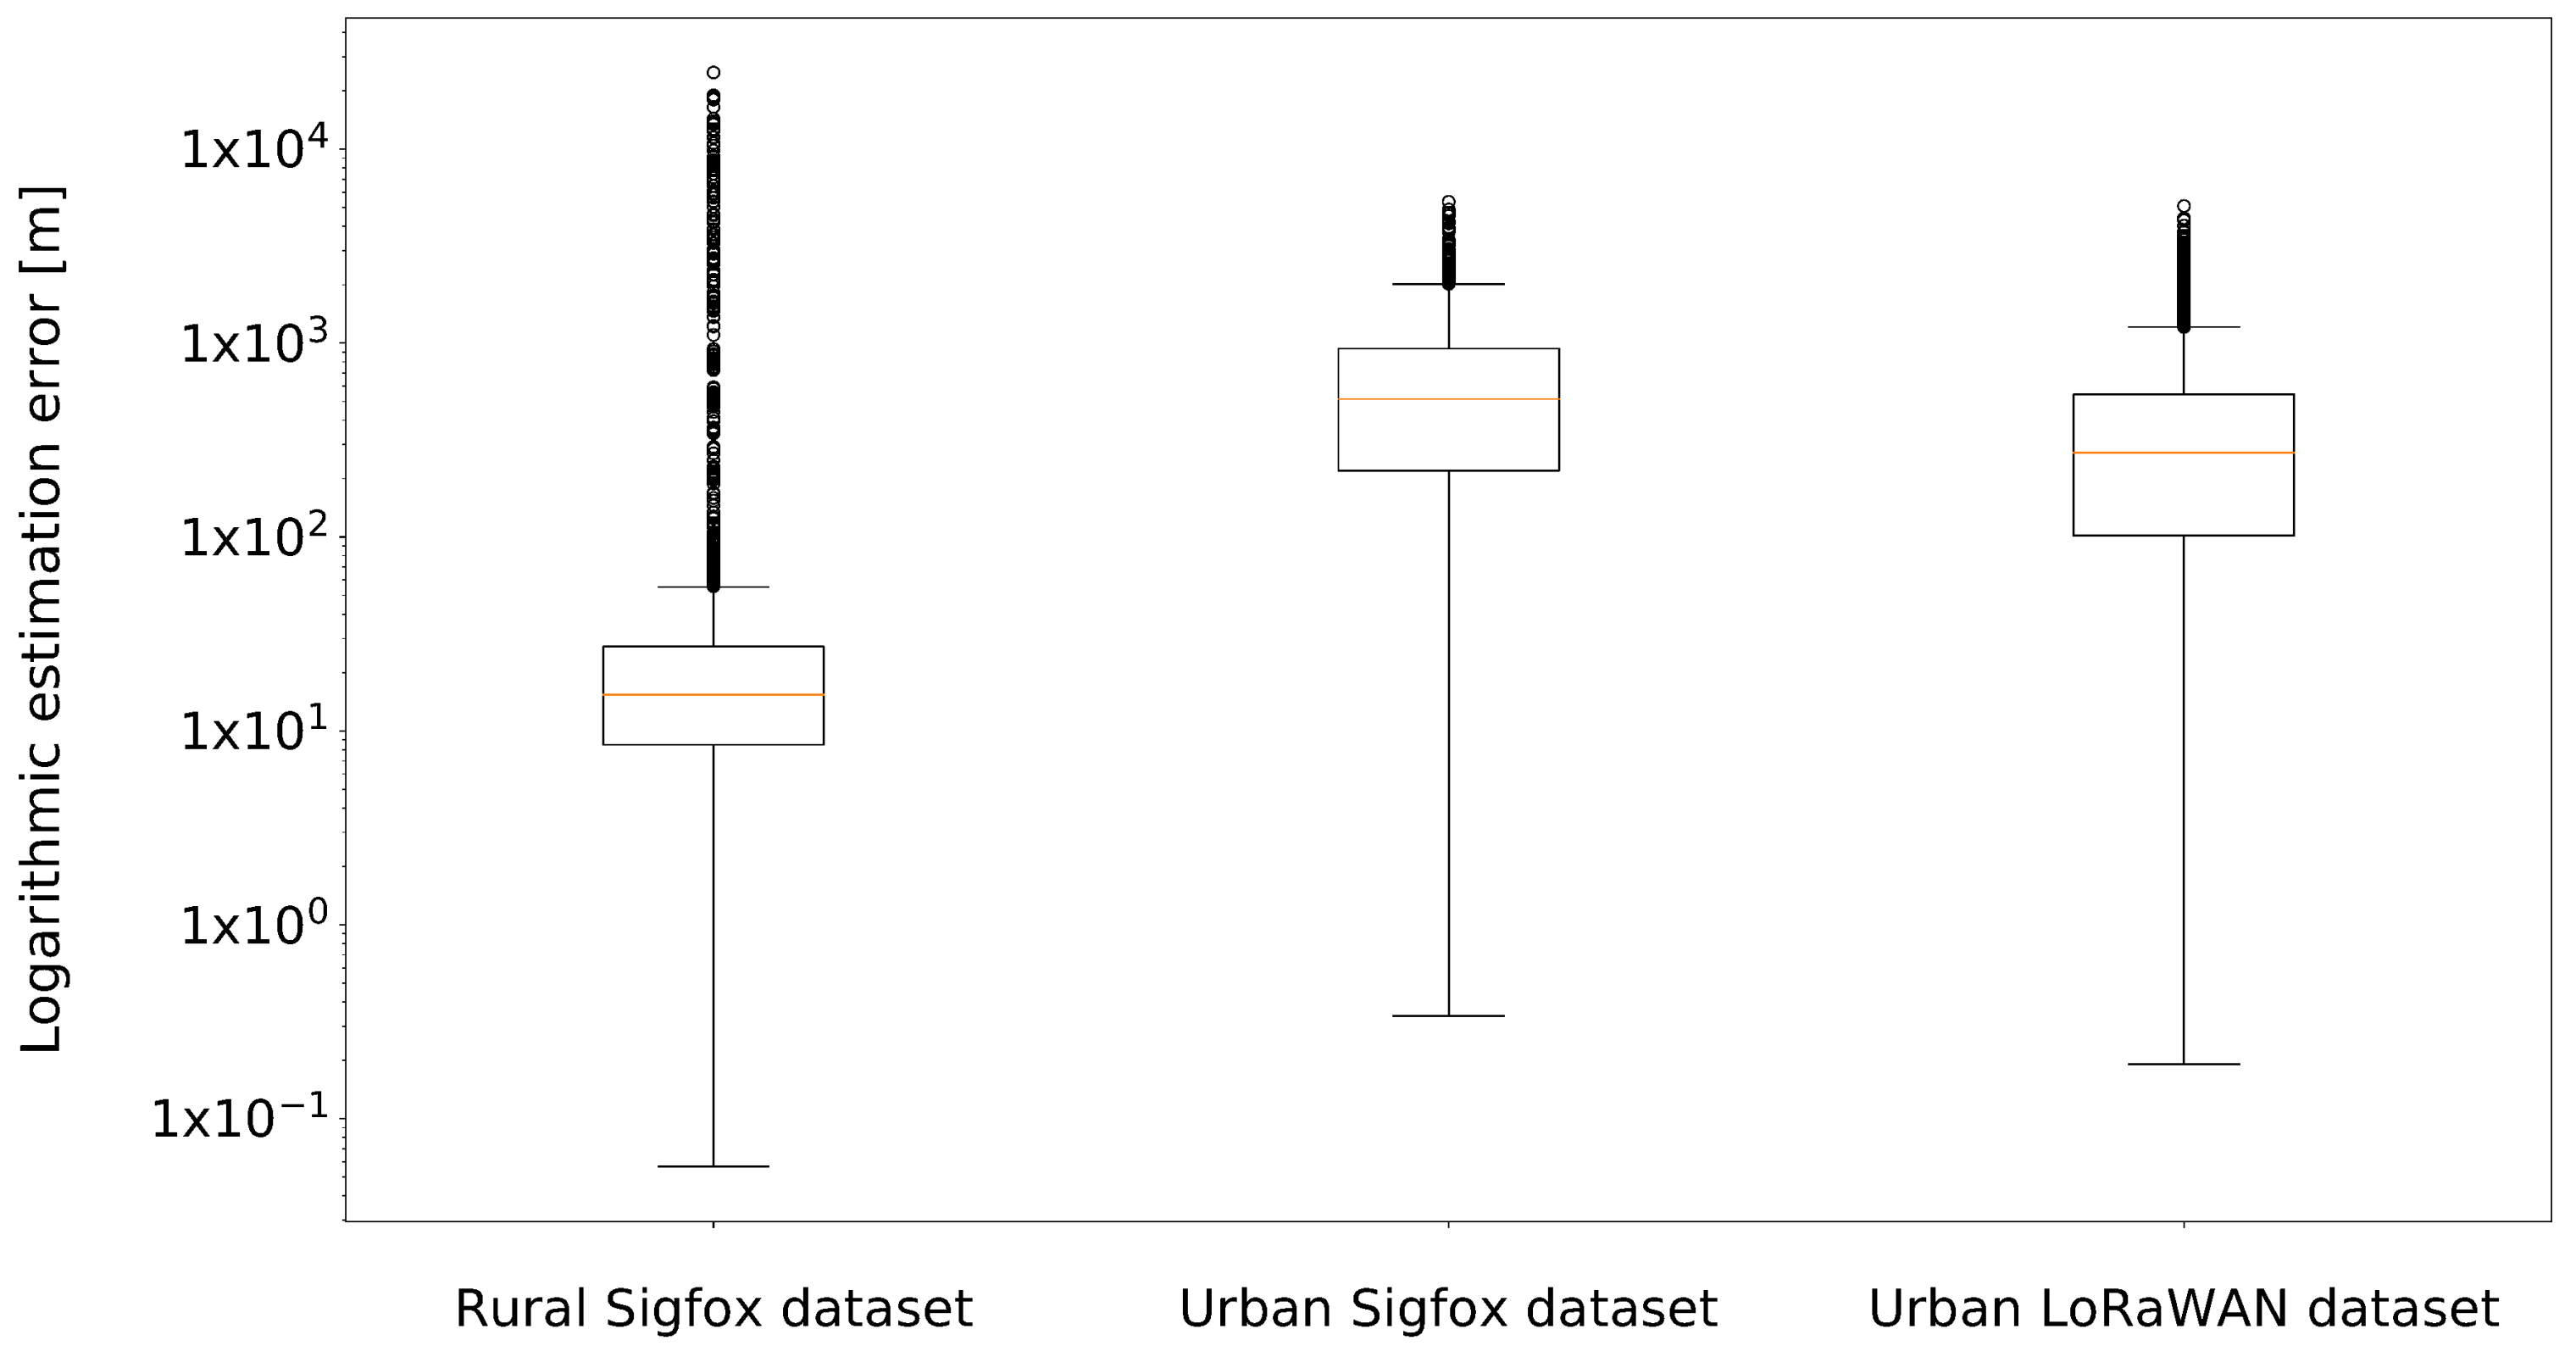
The rural Sigfox dataset has a mean error of 214.58 m and a median error of 15.4 m when looking for the single nearest neighbor, whereas the urban Sigfox dataset has a mean error of 688.97 m and a median error of 514.83 m when k equals 10. Lastly, the urban LoRaWAN dataset has a mean error of 398.4 m and a median error of 273.03 m when using the 11 nearest neighbors to get a location estimate. We will discuss these results in the next section.
6. Discussion
In
Figure 10 of the previous section, the estimation errors for the three LPWAN datasets are shown.
Table 5, lists the optimal value for
k as well as the corresponding mean and median location estimation error. When observing
Figure 10, it becomes clear that the fingerprinting method has the best results on the rural Sigfox dataset. This is mainly due to the spatial spread of this dataset, which can be seen in
Figure 1. Measurements were conducted by people who commute by car in the rural area between Antwerp and Ghent, but a major part of these measurements were taken while the cars were parked, usually even on the same parking spot. Therefore, the rural Sigfox dataset mainly consists of dense message clusters on several small parking lots which are far apart from each other. This explains why we obtain the best results when we estimate a location based on the single nearest neighbor: there is a high probability that the nearest neighbor of a test sample is located in the same message cluster. If a test sample is not located in such a cluster, the location estimation based on a single nearest neighbor can have an error of almost 25 km, as shown in the outliers of the box plot. Concisely, the fingerprinting results for the rural Sigfox dataset are only highly accurate if a test sample is located in one of the few message clusters.
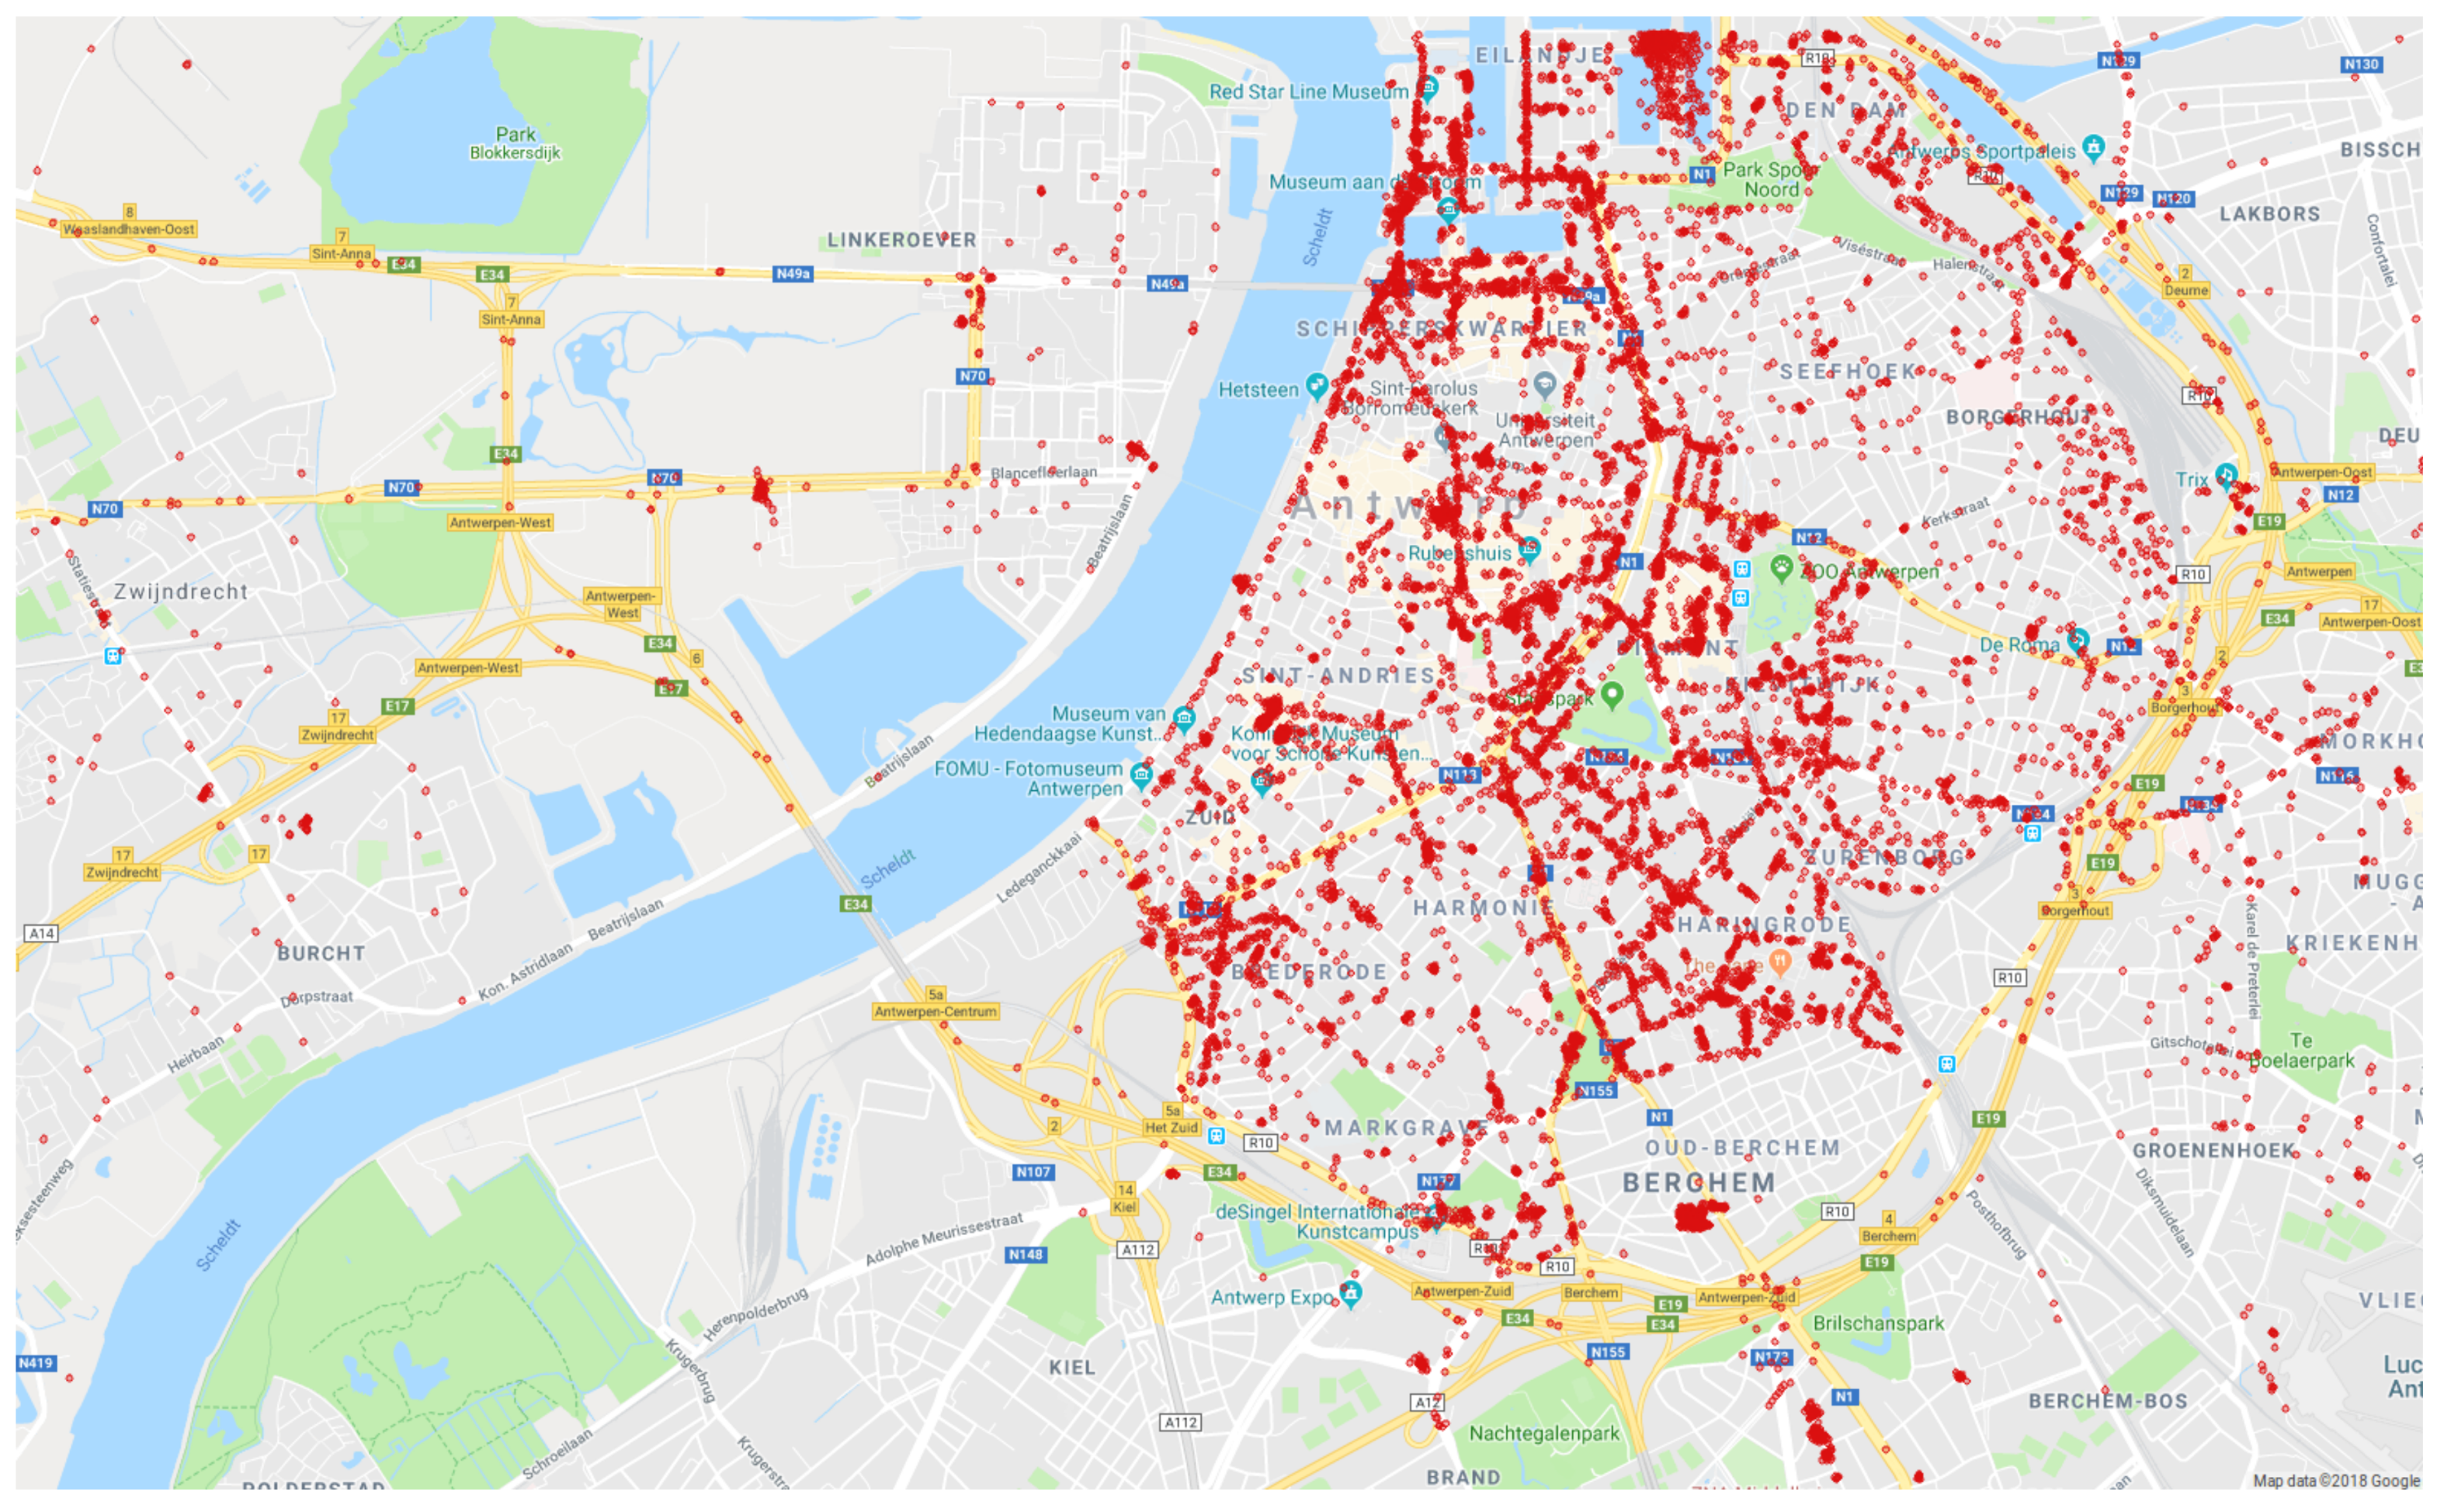
The second box plot depicts the estimation error of the urban Sigfox dataset. As shown in
Figure 4, this dataset has a more equal spatial density compared to the rural Sigfox dataset. Consequently, location estimations will be based on a higher number of nearest neighbors: we evaluated that the optimal
k for this dataset equals 10. Compared to the rural Sigfox dataset, the urban Sigfox dataset has a larger mean estimation error. However, the urban dataset has a more equally divided spatial spread, which causes the estimation error outliers to be significantly smaller compared to the outliers of the rural dataset.
Lastly, the estimation error of the urban LoRaWAN dataset can be seen in the third box plot of
Figure 10. For this set, we found that location estimates based on 11 nearest neighbors resulted in the smallest estimation error. The mean and median estimation error of the LoRaWAN dataset are significantly lower than those of the urban Sigfox dataset, which is mainly a consequence of the large size of the LoRaWAN dataset (123,529 messages). In the LoRaWAN set, it is more likely that the 11 nearest neighbors of a test sample are close to the actual location of the test sample, as the dataset holds more messages in the same urban area. This can also be empirically evaluated by comparing
Figure 4 and
Figure 7, which display the spatial spread of the urban Sigfox dataset and the LoRaWAN dataset respectively. Hence, we expect to decrease the location estimation error of the urban Sigfox dataset by adding more messages to this set.
After comparing the fingerprinting results of each dataset, we can conclude that the spatial spread of a dataset is an important factor to determine the value of k. For datasets with an equal spatial spread, such as the urban Sigfox and LoRaWAN datasets, the best value for k equals 10 or 11. The rural Sigfox dataset consists of dense message clusters that are located far from each other. In this case, k should equal 1 to achieve the smallest location estimation error.
7. Conclusions
This paper has described the collection methodology of three large LPWAN datasets, as well as their suitability for fingerprint-based localization. With these datasets, we intend to provide the global research community with a benchmark tool to evaluate fingerprinting algorithms for LPWAN standards. In the next months, we will keep collecting LPWAN messages in the same areas, by implementing the methodology that was described in
Section 3. Apart from increasing the size of the datasets, this allows us to analyze short-term and long-term fluctuations in RSS measurements, and research how we can cope with them. We also aim to improve the spatial spread of the rural Sigfox dataset by deploying more Sigfox hardware in the rural area. Furthermore, three additional datasets will be built: a rural LoRaWAN dataset, a rural NB-IoT dataset and an urban NB-IoT dataset.
In
Section 5, we have summarized the results of a basic
kNN fingerprinting method which was explained in
Section 4. These results show a relatively high mean error which ranges from 215 to 689 m. However, localization algorithms with an estimation error of this magnitude could still be suitable for some applications, e.g., a logistics company could classify if their assets are on their site or on a working site a few kilometers away. On the other hand, this first basic fingerprinting approach is only meant to serve as an example to demonstrate how our LPWAN datasets can be used. Many different optimizations such as different training set sizes, other pattern recognition algorithms, other distance functions, etc. can still be researched with our datasets. Similar to previous research on indoor WiFi fingerprinting [
22], we will analyze the effect of other distance functions, data representations and thresholding techniques using our LPWAN datasets as input.
Acknowledgments
Part of this work was funded by the MuSCLe-IoT (Multimodal Sub-Gigahertz Communication and Localization for Low-power IoT applications) project, co-funded by imec, a research institute founded by the Flemish Government, with project support from VLAIO (contract number HBC.2016.0660). The MuSCLe-IoT industry partners are Flash, Sensolus, Engie M2M, and Aertssen. Part of this research was funded by the Flemish FWO SBO S004017N IDEAL-IoT (Intelligent DEnse And Longe range IoT networks) project. Part of the equipment used in this work was funded by the Flemish Hercules program.
Author Contributions
M.W., R.B. and M.A. conceived and designed the experiments; M.A. performed the experiments; M.A. and R.B. analyzed the data; K.V.V. contributed hardware to transmit the LPWAN messages; M.A. and R.B. wrote the paper.
Conflicts of Interest
The authors declare no conflict of interest.
References
- Margelis, G.; Piechocki, R.; Kaleshi, D.; Thomas, P. Low Throughput Networks for the IoT: Lessons learned from industrial implementations. In Proceedings of the IEEE World Forum on Internet of Things (WF-IoT), Milan, Italy, 14–16 December 2015; pp. 181–186. [Google Scholar]
- Raza, U.; Kulkarni, P.; Sooriyabandara, M. Low Power Wide Area Networks: An Overview. IEEE Commun. Surveys Tutor. 2017, 19, 855–873. [Google Scholar] [CrossRef]
- Fargas, B.C.; Petersen, M.N. GPS-free geolocation using LoRa in low-power WANs. In Proceedings of the 2017 Global Internet of Things Summit (GIoTS), Geneva, Switzerland, 6–9 June 2017; pp. 1–6. [Google Scholar]
- Bensky, A. Wireless Positioning Technologies and Applications, 2nd ed.; Artech House: Norwood, MA, USA, 2008; p. 305. [Google Scholar]
- Liu, H.; Darabi, H.; Banerjee, P.; Liu, J. Survey of wireless indoor positioning techniques and systems. IEEE Trans. Syst. Man Cybern. Part C Appl. Rev. 2007, 37, 1067–1080. [Google Scholar] [CrossRef]
- Mao, G.; Fidan, B.; Anderson, B.D. Wireless sensor network localization techniques. Comput. Netw. 2007, 51, 2529–2553. [Google Scholar] [CrossRef]
- He, S.; Chan, S.H. Wi-Fi fingerprint-based indoor positioning: Recent advances and comparisons. IEEE Commun. Surv. Tutor. 2016, 18, 466–490. [Google Scholar] [CrossRef]
- Torres-Sospedra, J.; Montoliu, R.; Martinez-Uso, A.; Avariento, J.P.; Arnau, T.J.; Benedito-Bordonau, M.; Huerta, J. UJIIndoorLoc: A new multi-building and multi-floor database for WLAN fingerprint-based indoor localization problems. In Proceedings of the IPIN 2014—2014 International Conference on Indoor Positioning and Indoor Navigation, Busan, South Korea, 27–30 October 2014; pp. 261–270. [Google Scholar]
- Sigfox—The Global Communications Service Provider for the Internet of Things (IoT). Available online: https://www.sigfox.com/en (accessed on 7 March 2018).
- Augustin, A.; Yi, J.; Clausen, T.; Townsley, W. A Study of LoRa: Long Range and Low Power Networks for the Internet of Things. Sensors 2016, 16, 1466. [Google Scholar] [CrossRef] [PubMed]
- Wang, Y.P.; Lin, X.; Adhikary, A.; Grövlen, A.; Sui, Y.; Blankenship, Y.; Bergman, J.; Razaghi, H.S. A Primer on 3GPP Narrowband Internet of Things. IEEE Commun. Mag. 2017, 55, 117–123. [Google Scholar] [CrossRef]
- Vejlgaard, B.; Lauridsen, M.; Nguyen, H.; Kovacs, I.Z.; Mogensen, P.; Sorensen, M. Coverage and Capacity Analysis of Sigfox, LoRa, GPRS, and NB-IoT. In Proceedings of the 2017 IEEE 85th Vehicular Technology Conference (VTC Spring), Sydney, Australia, 4–7 June 2017; pp. 1–5. [Google Scholar]
- Gezici, S.; Tian, Z.; Giannakis, G.; Kobayashi, H.; Molisch, A.; Poor, H.; Sahinoglu, Z. Localization via ultra-wideband radios: A look at positioning aspects for future sensor networks. IEEE Signal Process. Mag. 2005, 22, 70–84. [Google Scholar] [CrossRef]
- Sallouha, H.; Chiumento, A.; Pollin, S. Localization in long-range ultra narrow band IoT networks using RSSI. In Proceedings of the 2017 IEEE International Conference on Communications (ICC), Paris, France, 21–25 May 2017; pp. 1–6. [Google Scholar]
- Janssen, T.; Weyn, M.; Berkvens, R. Localization in Low Power Wide Area Networks Using Wi-Fi Fingerprints. Appl. Sci. 2017, 7, 936. [Google Scholar] [CrossRef]
- LoRa Modulation Basics. Available online: https://www.semtech.com/uploads/documents/an1200.22.pdf (accessed on 7 March 2018).
- LoRaWAN Geolocation Whitepaper. Available online: https://docs.wixstatic.com/ugd/eccc1a_d43b3b29dfff4ec2b00f349ced4225c4.pdf (accessed on 7 March 2018).
- Hu, S.; Berg, A.; Li, X.; Rusek, F. Improving the Performance of OTDOA Based Positioning in NB-IoT Systems. In Proceedings of the GLOBECOM 2017—2017 IEEE Global Communications Conference, San Francisco, CA, USA, 19–22 March 2017; pp. 1–7. [Google Scholar]
- Sensolus Stickntrack. Available online: http://www.sensolus.com/stickntrack-gps/ (accessed on 7 March 2018).
- Latre, S.; Leroux, P.; Coenen, T.; Braem, B.; Ballon, P.; Demeester, P. City of things: An integrated and multi-technology testbed for IoT smart city experiments. In Proceedings of the 2016 IEEE International Smart Cities Conference (ISC2), Trento, Italy, 12–15 September 2016; pp. 1–8. [Google Scholar]
- OCTA-Connect. Available online: http://www.octa-connect.com/ (accessed on 7 March 2018).
- Torres-Sospedra, J.; Montoliu, R.; Trilles, S.; Belmonte, O.; Huerta, J. Comprehensive analysis of distance and similarity measures for Wi-Fi fingerprinting indoor positioning systems. Expert Syst. Appl. 2015, 42, 9263–9278. [Google Scholar] [CrossRef]
Figure 1.
All messages in the rural Sigfox dataset were obtained in a large area between the cities of Antwerp and Ghent. Transmission locations are indicated by red dots on the map.
Figure 1.
All messages in the rural Sigfox dataset were obtained in a large area between the cities of Antwerp and Ghent. Transmission locations are indicated by red dots on the map.
Figure 2.
The rural Sigfox dataset holds 25,638 messages which were collected from 16 November 2017 to 5 February 2018. This figure illustrates the temporal spread of this dataset.
Figure 2.
The rural Sigfox dataset holds 25,638 messages which were collected from 16 November 2017 to 5 February 2018. This figure illustrates the temporal spread of this dataset.
Figure 3.
The Sensolus Stickntrack device sends GPS coordinates over Sigfox every ten minutes [
19].
Figure 3.
The Sensolus Stickntrack device sends GPS coordinates over Sigfox every ten minutes [
19].
Figure 4.
The urban Sigfox dataset was collected in the city center of Antwerp.
Figure 4.
The urban Sigfox dataset was collected in the city center of Antwerp.
Figure 5.
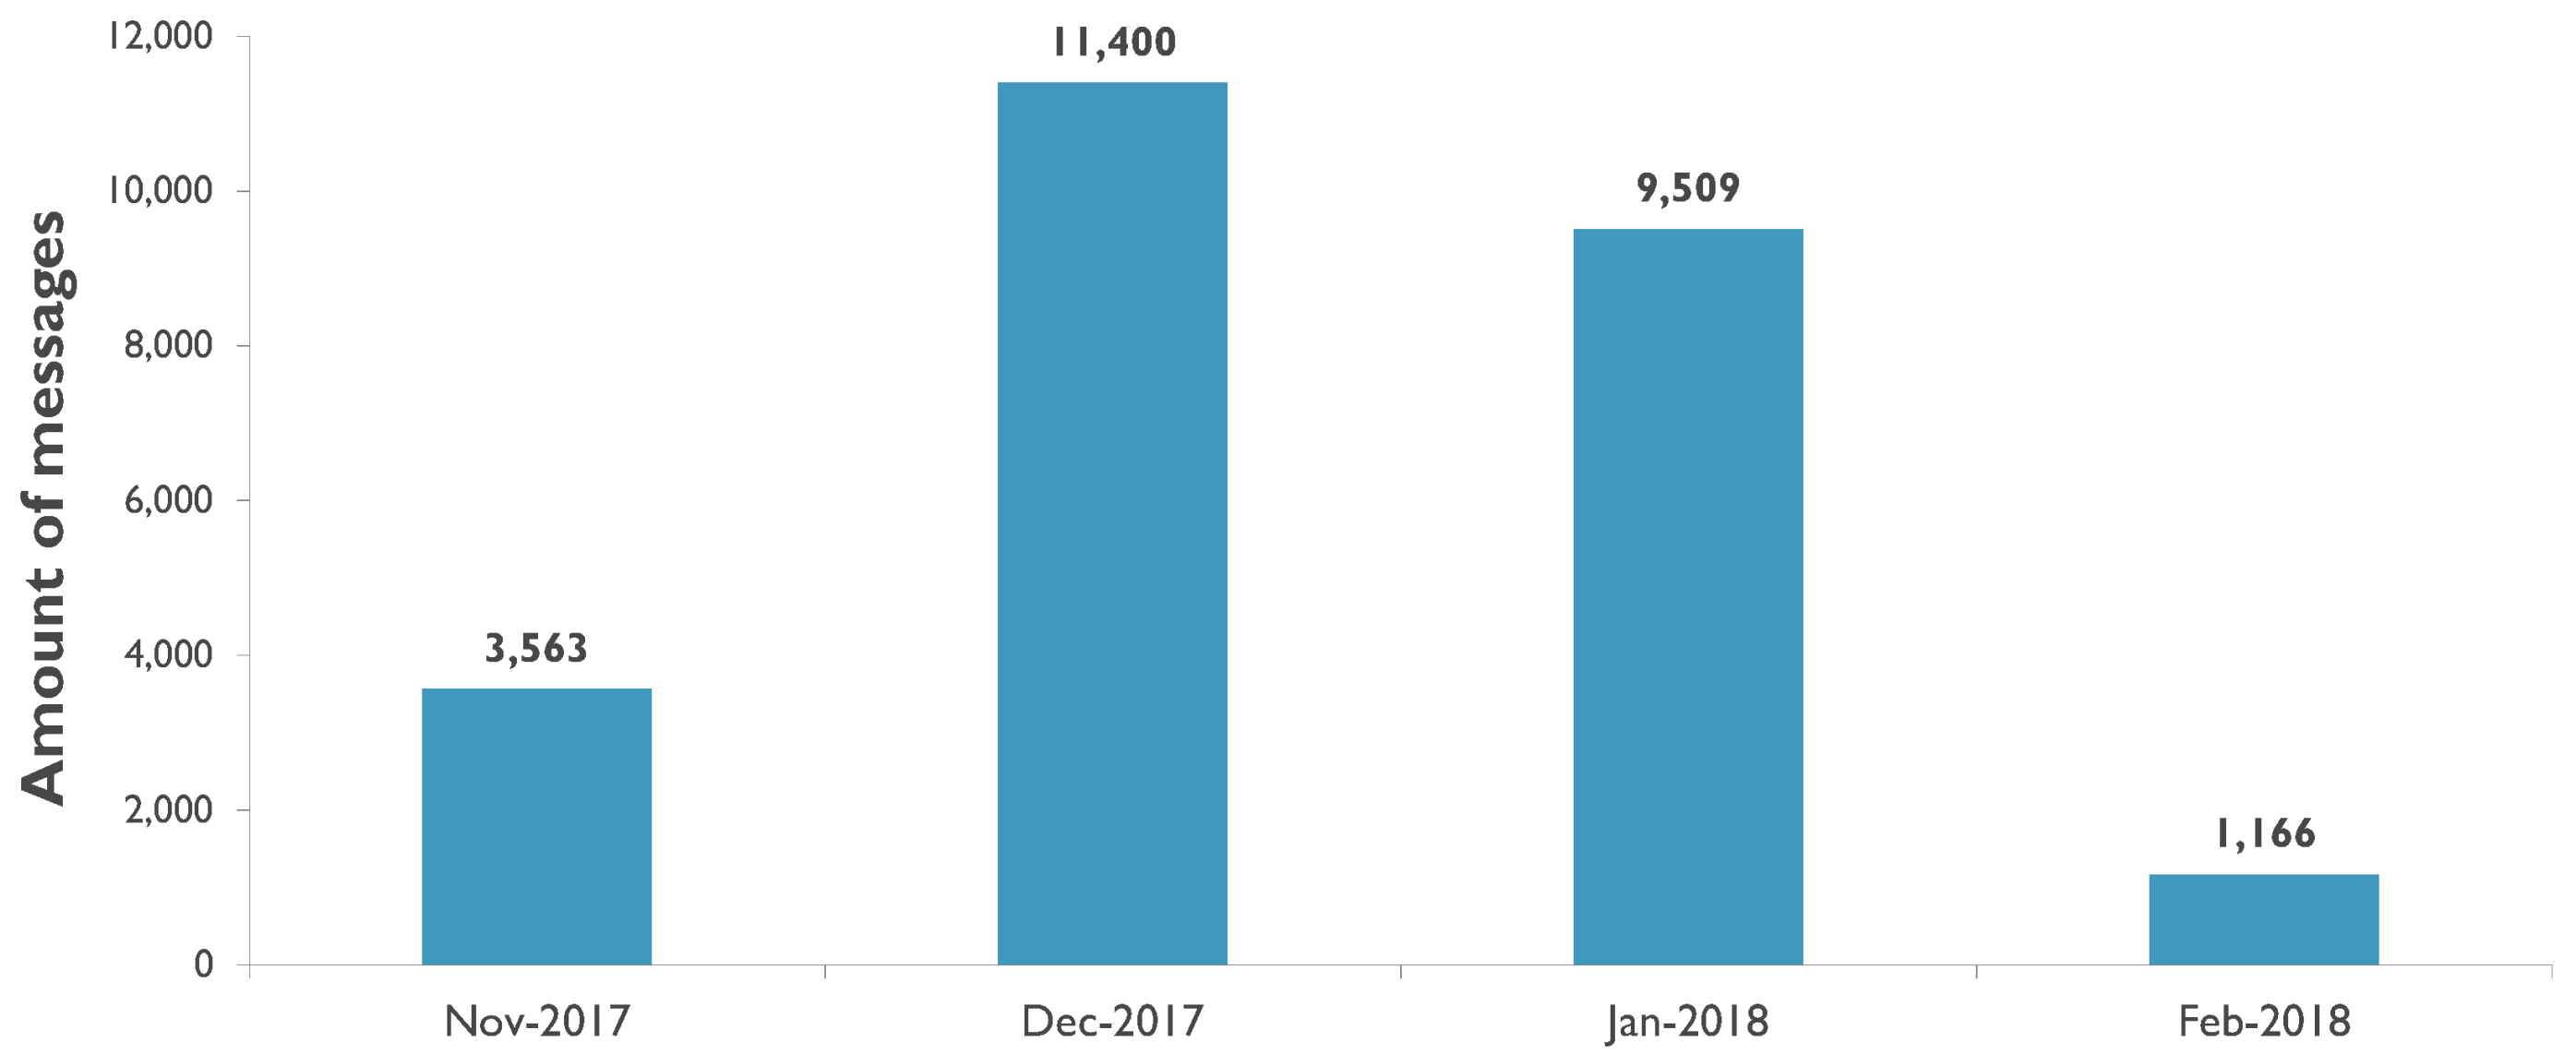
The urban Sigfox dataset contains 14,378 messages which were obtained from 16 November 2017 to 5 February 2018. This figure illustrates the temporal spread of this dataset.
Figure 5.
The urban Sigfox dataset contains 14,378 messages which were obtained from 16 November 2017 to 5 February 2018. This figure illustrates the temporal spread of this dataset.
Figure 6.
OCTA-Connect hardware modules are used to send GPS data to the local data server [
21].
Bottom left: Firefly X1 GPS receiver.
Top left: TD1207R RF module for Sigfox communication.
Top right: IM880B-L RF module for LoRaWAN communication.
Figure 6.
OCTA-Connect hardware modules are used to send GPS data to the local data server [
21].
Bottom left: Firefly X1 GPS receiver.
Top left: TD1207R RF module for Sigfox communication.
Top right: IM880B-L RF module for LoRaWAN communication.
Figure 7.
The urban LoRaWAN dataset was collected in the city center of Antwerp.
Figure 7.
The urban LoRaWAN dataset was collected in the city center of Antwerp.
Figure 8.
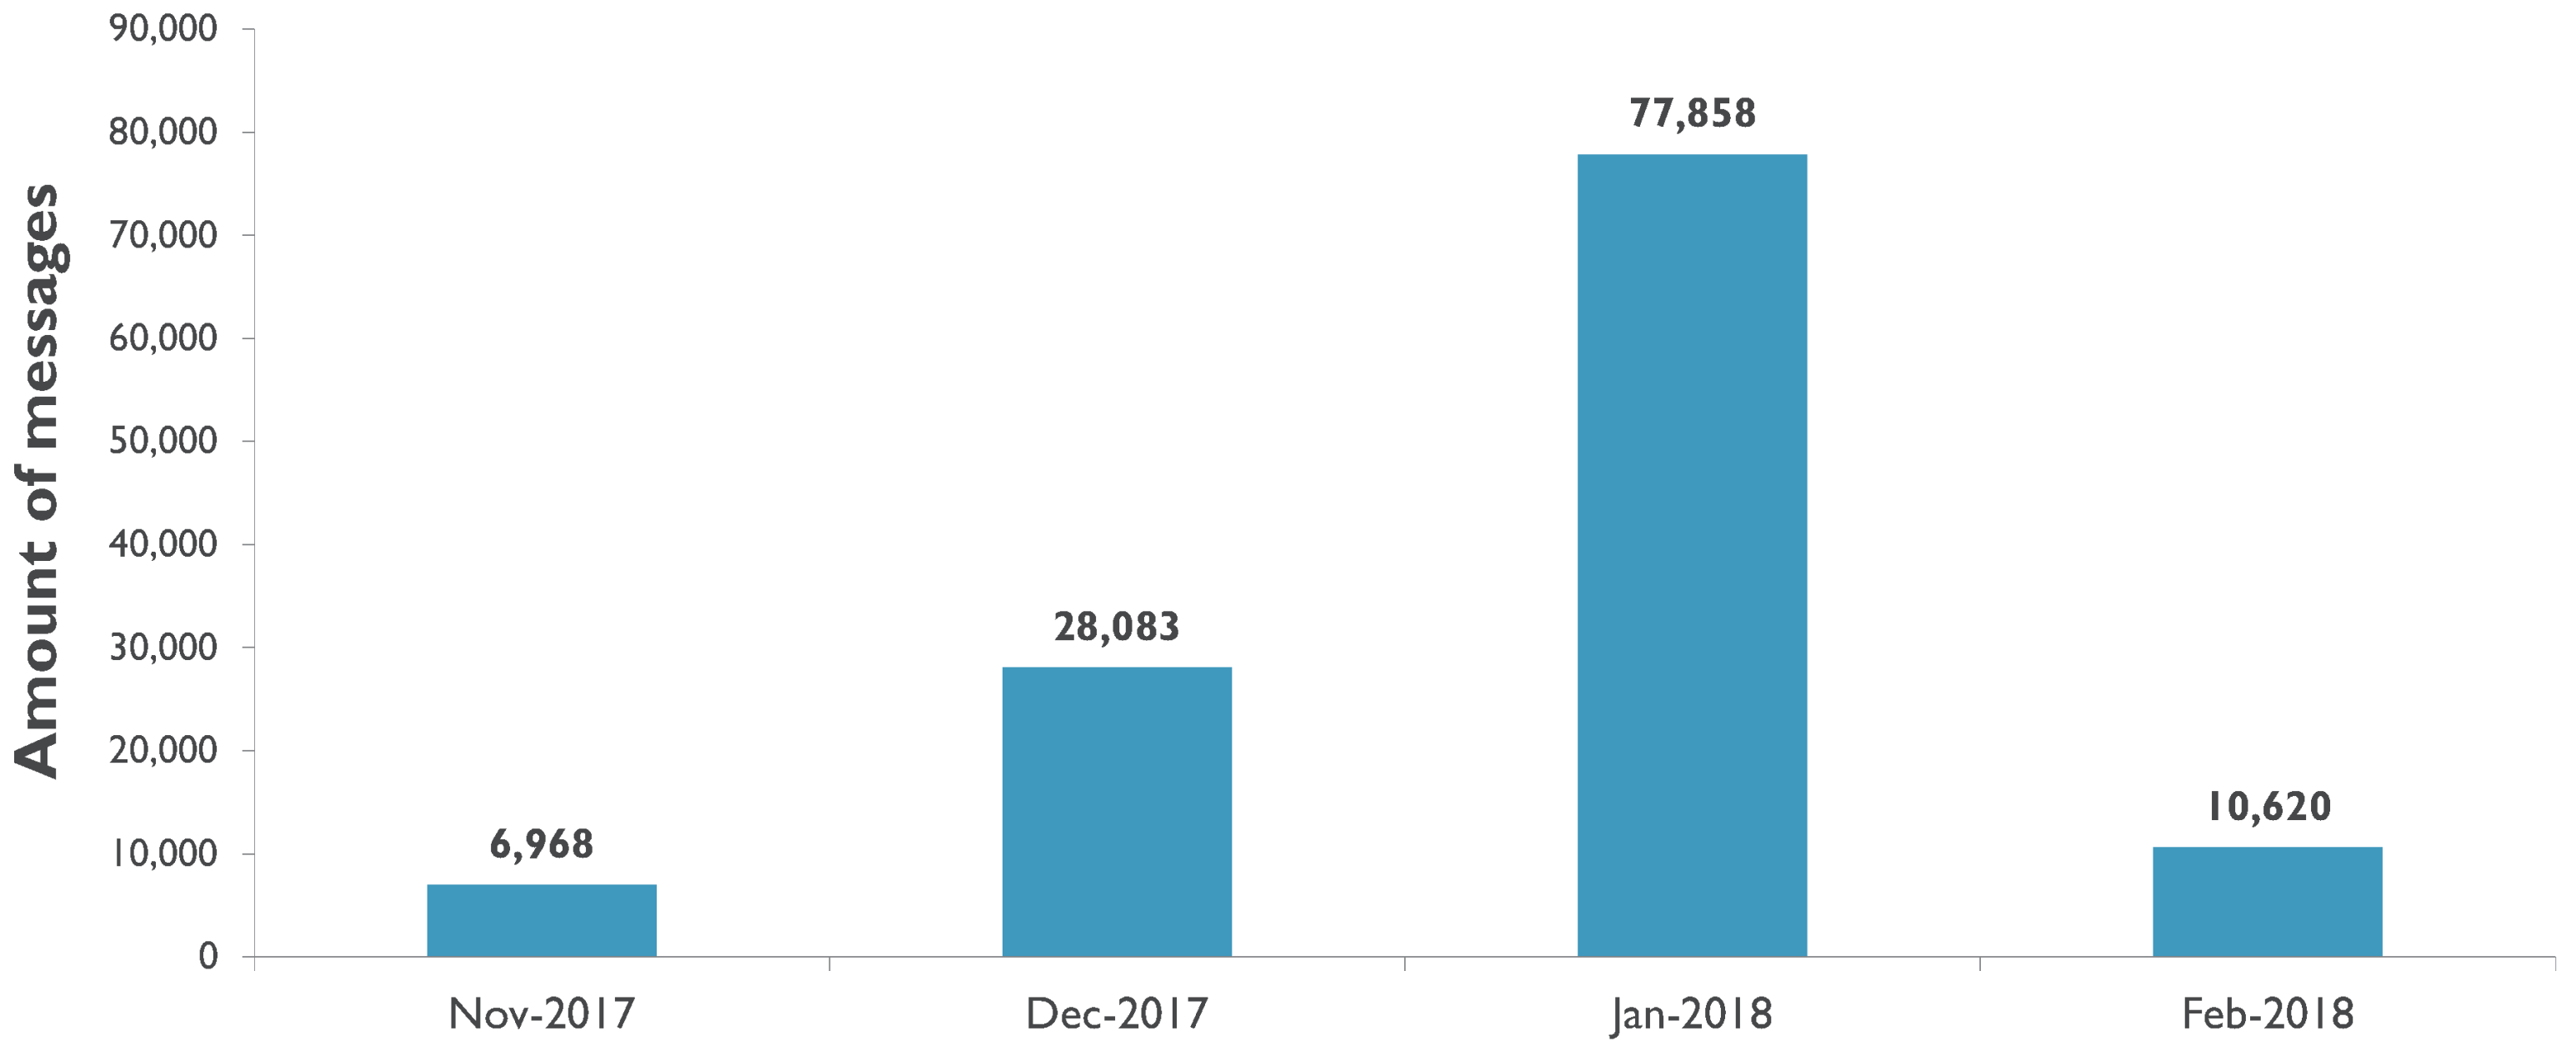
The urban LoRaWAN dataset holds 123,529 messages that were collected from 17 November 2017 to 5 February 2018. This figure illustrates the temporal spread of this dataset.
Figure 8.
The urban LoRaWAN dataset holds 123,529 messages that were collected from 17 November 2017 to 5 February 2018. This figure illustrates the temporal spread of this dataset.
Figure 9.
Visual representation of a basic fingerprinting algorithm.
Figure 9.
Visual representation of a basic fingerprinting algorithm.
Figure 10.
These box plots display the logarithmic estimation error of our first fingerprinting implementation on the LPWAN datasets.
Figure 10.
These box plots display the logarithmic estimation error of our first fingerprinting implementation on the LPWAN datasets.
Table 1.
An overview of three main Low Power Wide Area Network (LPWAN) standards.
Table 1.
An overview of three main Low Power Wide Area Network (LPWAN) standards.
| | Sigfox | LoRaWAN | NB-IoT |
|---|
| Band | EU: 868 MHz
US: 902 MHz | EU: 433 and 868 MHz
US: 915 MHz | Cellular (LTE) |
| Bandwidth | 100 Hz | 125–500 kHz | 180 kHz |
| Modulation | UL: UNB DBPSK
DL: GFSK | LoRa | BPSK/QPSK |
| Data rate | UL: 100 bps
DL: 600 bps | 300 bps–37.5 kbps | UL: 20 kbps
DL: 250 bps |
| Max. payload | UL: 12 bytes
DL: 8 bytes | 250 bytes | 125 bytes |
| MAC | Unslotted ALOHA | LoRaWAN | UL: SC-FDMA
DL: OFDMA |
| Topology | Star | Star | Cellular network |
Table 2.
The structure of the rural Sigfox dataset. Every row represents a Sigfox message and indicates its receiving base stations (BS), the receiving time of the message (RX Time) and the GPS coordinates at transmission time.
Table 2.
The structure of the rural Sigfox dataset. Every row represents a Sigfox message and indicates its receiving base stations (BS), the receiving time of the message (RX Time) and the GPS coordinates at transmission time.
| BS 1 | BS 2 | BS 3 | ... | BS 137 | RX Time | Latitude | Longitude |
|---|
| −138 | −200 | −127 | ... | −200 | 2018-02-04T16:18:42+00:00 | 51.0958362 | 4.1329538 |
| −200 | −200 | −200 | ... | −200 | 2017-12-22T18:17:48+00:00 | 51.0121241 | 3.17136215 |
| ... | ... | ... | ... | ... | ... | ... | ... |
Table 3.
The structure of the urban Sigfox dataset. Every row represents a Sigfox message and indicates its receiving base stations (BS), the receiving time of the message (RX Time) and the GPS coordinates at transmission time.
Table 3.
The structure of the urban Sigfox dataset. Every row represents a Sigfox message and indicates its receiving base stations (BS), the receiving time of the message (RX Time) and the GPS coordinates at transmission time.
| BS 1 | BS 2 | ... | BS 84 | RX Time | Latitude | Longitude |
|---|
| | ... | | 2018-01-24T09:20:09+00:00 | 51.2111778259 | 4.4175133705 |
| | ... | | 2018-01-09T13:11:01+00:00 | 51.2206916809 | 4.3969035149 |
| ... | ... | ... | ... | ... | ... | ... |
Table 4.
The structure of the urban LoRaWAN dataset. Every row represents a LoRaWAN message and indicates its receiving base stations (BS), the receiving time of the message (RX Time), the LoRa spreading factor, and the Horizontal Dilution Of Precision (HDOP), latitude and longitude of the transmitter at transmission time.
| BS 1 | BS 2 | ... | BS 68 | RX Time | SF | HDOP | Latitude | Longitude |
|---|
| −101 | −95 | ... | −200 | 2018-01-09T23:42:19+00:00 | 9 | 0.60 | 51.19404602 | 4.41862487 |
| −200 | −111 | ... | −200 | 2018-01-31T10:01:27+00:00 | 12 | 1.08 | 51.20004272 | 4.4116702 |
| ... | ... | ... | ... | ... | ... | ... | ... | ... |
Table 5.
Fingerprinting results for all LPWAN datasets. The best value for k was determined by executing a parameter sweep during the evaluation phase.
Table 5.
Fingerprinting results for all LPWAN datasets. The best value for k was determined by executing a parameter sweep during the evaluation phase.
| | Best k | Mean Error [m] | Median Error [m] |
|---|
| Sigfox Rural | 1 | 214.58 | 15.4 |
| Sigfox Antwerp | 10 | 688.97 | 514.83 |
| LoRaWAN Antwerp | 11 | 398.40 | 273.03 |
© 2018 by the authors. Licensee MDPI, Basel, Switzerland. This article is an open access article distributed under the terms and conditions of the Creative Commons Attribution (CC BY) license (http://creativecommons.org/licenses/by/4.0/).


