Mapping of Sewer Lines Using GPR: A Case Study in Tunisia


1
Microelectronic and Instrumentation Laboratory, Faculty of Sciences Monastir, University of Monastir, Monastir 5019, Tunisia
2
National School of Engineers of Sousse, University of Sousse, Sousse 4023, Tunisia
3
Center for Research in Microelectronics and Nanotechnology, Technopole of Sousse, Sousse 4054, Tunisia
4
Higher Institute of Applied Sciences and Technology of Sousse, University of Sousse, Sousse 4054, Tunisia
*
Author to whom correspondence should be addressed.
Data 2018, 3(4), 40; https://doi.org/10.3390/data3040040
Submission received: 30 July 2018
/
Revised: 1 October 2018
/
Accepted: 2 October 2018
/
Published: 5 October 2018
Abstract
:Many infrastructure enhancement projects require underground utility mapping before starting any excavation processes, especially in urban areas. In fact, mapping of an area provides a general overview of the infrastructure above and underground. This mapping can be done by Ground Penetrating Radar (GPR), which is commonly used as a Non-Destructive Testing (NDT) technique that allows, among others, the detection and localization of buried utilities without any damage to the surface. This paper presents the results of mapping sewer lines in an urban region of the city of Tunis, Tunisia, using GPR. In this study a ground-coupled GPR system with a frequency of 400MHz was used to detect and locate the sewer lines in the study area. In order to reduce the amount of collected data over the large study area, some subareas were selected where GPR testing was conducted and data were analyzed. Then, sewer lines were interpolated over the whole area using the GPR results and the locations of manholes visible from the surface. It was shown that using this technique mapping of the pipes in the entire area can be achieved. All data presented in this study were collected by the Office of Topography and Cadastre (OTC) in Tunisia.
1. Introduction
Every year, in Tunisia, a lot of underground utilities (cables, pipes, etc.) are damaged by workers digging in their vicinity. These incidents can usually harm workers and/or residents and can also cause material damage and possible environmental pollution. This damage usually happens because the locations of underground utilities are unknown or not well documented, especially in old urban areas or because of differences between design locations and actual in-situ installations.
Detection of the underground utilities can be conducted by different techniques and technologies: (i) Visual inspection (closed-circuit television); (ii) sewer scanner and evaluation technology; (iii) pulsed technology; (iv) magnetic technology; (v) electromagnetic and radio frequency technology; (vi) resistivity technology, and (vii) acoustic technology [1,2,3]. Out of all these technologies, Ground Penetrating Radar (GPR), which is a subsurface radio frequency investigation method, has shown its effectiveness in the exploration of underground infrastructures [4,5,6,7]. Among its advantages we can cite: Fast data acquisition, cost effectiveness for mapping large areas, and more accurate results compared to other non-destructive techniques because of its high-resolution images.
Particularly, Ground Penetrating Radar is an effective solution for nondestructively detecting, from the surface, all types of buried pipes without disturbing the structure [8]. In fact, the GPR emits short electromagnetic pulses to the ground, which are later reflected back from the interfaces between the media of different dielectric constants [9,10,11]. The reflected signals are then displayed to the user for immediate analysis or recorded for later thorough processing.
Different studies have shown that the GPR technique can be used for the detection of subsurface utilities and therefore utility mapping [12,13,14,15,16]. These studies were based on the data collected from GPR only without any other information to increase the accuracy of the mapping. However, due to both economic and environmental considerations, there is an increased need for the development of better methods to accurately map subsurface sewer lines. In this paper, we will show that combining GPR data results with visual inspection information can greatly increase the accuracy of utility mapping and reduce the acquisition and data analysis times. This technique was applied on GPR data collected for a case study in Tunisia.
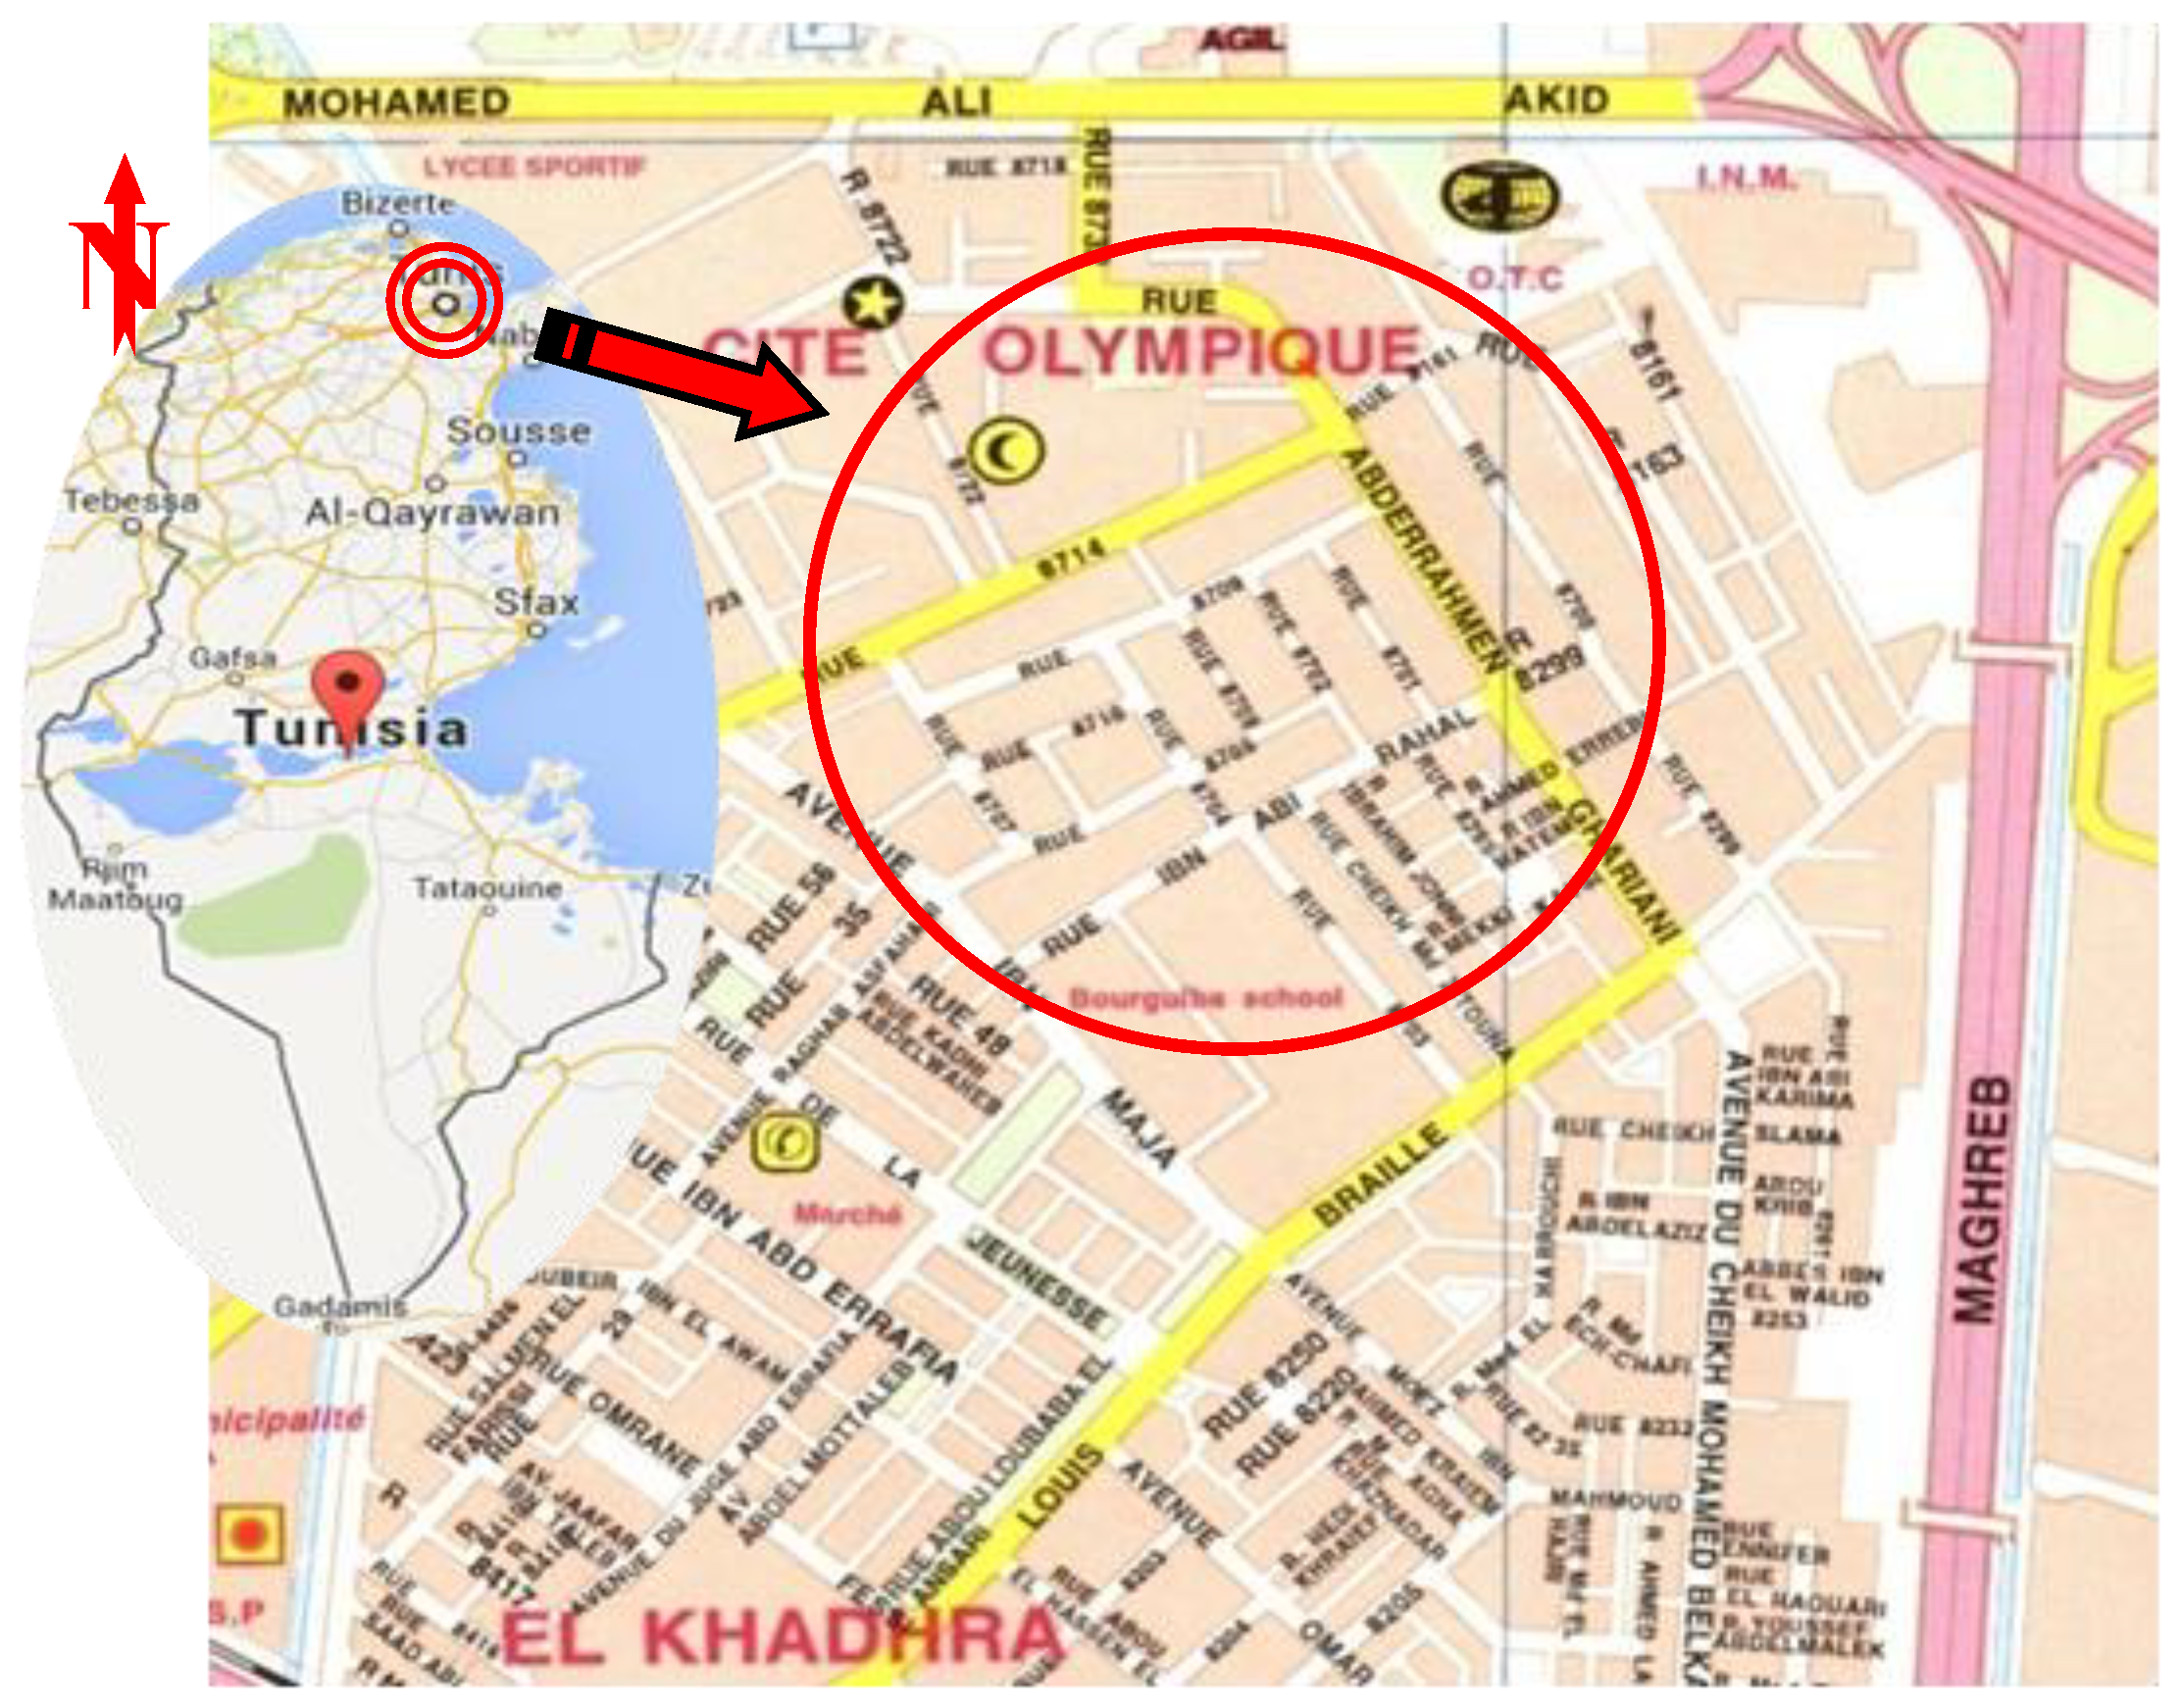
The area studied in this paper, is located at the Olympic City (see Figure 1) in the North of the capital Tunis and near El Menzah Sports Complex. Based on available city documents, the study area has several buried objects such as electricity cables, optical fibers, gas pipes, metal ducts, plastic ducts, underground tanks, etc. In this study, only the mapping of underground sewer lines located in the area was carried out using the Ground Penetrating Radar technique.
The experimental results presented in this paper were obtained by a SIR-3000 system manufactured by Geophysical Survey Systems Inc. (GSSI) and a 400 MHz ground-coupled antenna that allows deep investigation depths varying between two and three meters with a resolution of 10 down to five cm. This system is well suited for the detection and localization of the buried sewer pipes in the studied area.
This paper is organized as follows: in Section 2, we present the studied areas and the major data analysis steps carried out. In Section 3 we detail the GPR data acquisition procedure. In Section 4, we present the GPR data analysis and the mapping results. Finally, in Section 5, several conclusions are formulated based on the results.
2. Background
In order to accurately map the sewer lines buried in the study area, we combined the results of GPR scanning with the spatial locations of the connecting manholes. As a first step of this study, we started by selecting subareas from the global study area where the GPR scanning will be done. For the sake of simplification and to avoid the lack of accessibility to some areas under test, we chose only nine GPR scanning sites (labeled SC-1 to SC-9) located in different crossroads. These sites are marked in Figure 2 by nine pins.
The second step consisted in the preparation of sketch diagrams of each subarea containing mainly the locations of the manholes, which are visible from the surface. In the next step, the directions of the buried sewer lines where determined based on the collected GPR radargrams and then drawn using MapInfo [17]. In the final step, the manholes were bound to the pipes to create a map of the sewer pipes in the area. These major steps are depicted in the following flowchart (Figure 3).
3. Data Acquisition
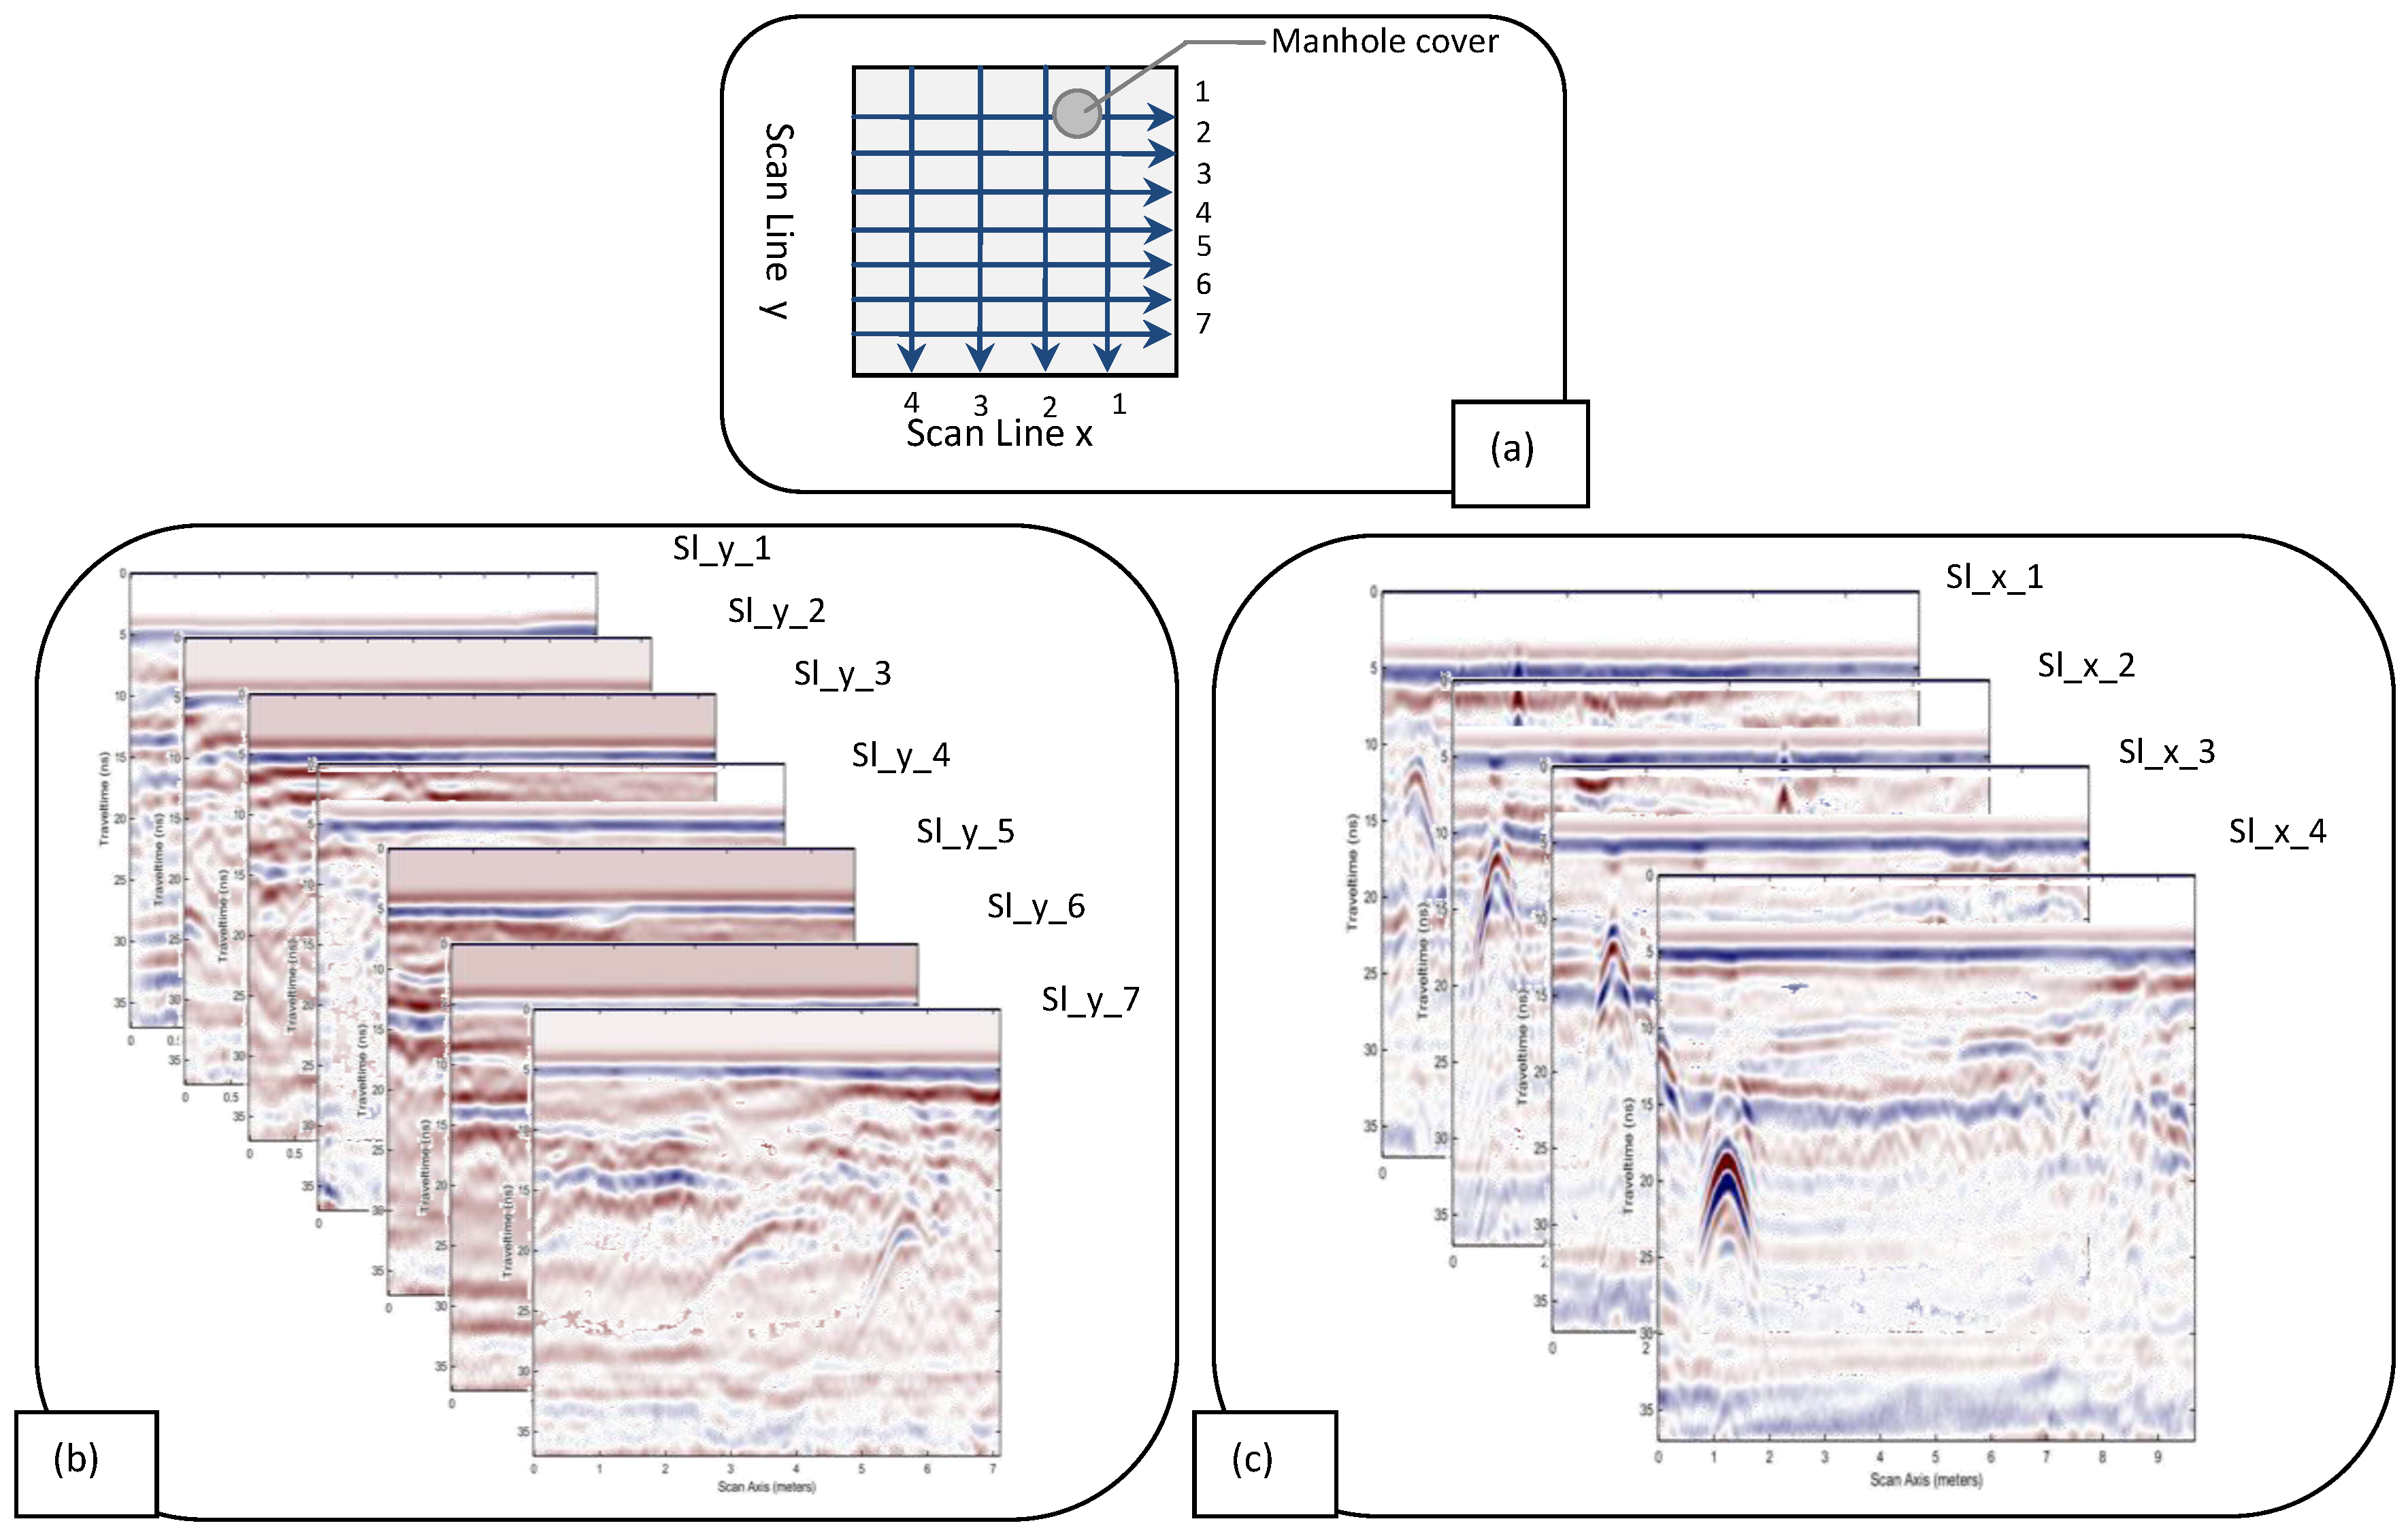
The response recorded by GPR, after placing the antenna above a target, is a 1-D signal called A-Scan representing GPR data collected for a fixed time period over a single position of the studied area. It is obtained by sampling, over a fixed time window, the electromagnetic pulses transmitted by GPR and then reflected by dielectric discontinuities in the studied structure. A collection of these traces (A-Scans) is called a B-Scan [18]. It is obtained by moving the antenna along a line and taking GPR data at different positions.
In order to scan the whole area of each section (SC-1 to SC-9) and detect sewer lines in the different directions, GPR B-Scans were taken along the x-axis (labeled sl_x_i, where i is the scan line number along the x-axis) and parallel to the y-axis. Another set of GPR B-Scans was taken in the same area along the y-axis (labeled sl_y_i, where i was the scan line number along the y-axis) and parallel to the x-axis. A summary of these data sets is reported in Table 1 along with the number of scan lines in each subarea. Figure 4a shows the GPR scan lines collected in section SC-9. Figure 4b,c shows the recorded B-Scans in section SC-9 along the y-axis and x-axis, respectively. The y-axis in these two figures represents the two-way travel-time of the reflected GPR pulses. All data presented in this study were collected by the Office of Topography and Cadastre (OTC) in Tunisia.
4. GPR Data Analysis
Data from each scan line (along the x and y axes) in each subarea (SC-1 to SC-9) were analyzed to locate the reflections of all buried sewer lines contained in the GPR data. The data analysis consists in looking in each B-Scan for the hyperbolic shapes which are the signatures of the cylinders (sewer pipes) transverse to the scan lines [19,20]. The GPR data, being in the standard GSSI file format (.DZT), were opened and displayed using the Matlab® free package matGPR [21].
In fact, for transverse cylinders, GPR signals are reflected from the cylinder even before the antenna reaches it. In that case, since EM waves will propagate through longer paths than those when the antenna is directly on top of the cylinder, the two-way travel-time will be longer. This results in a hyperbolic signature having its top coinciding with the top of the buried cylinder. Figure 5 and Figure 6 show the detected pipes respectively along the x and y axes scan lines in section SC-9. The triangles shown on the B-Scans in the two figures indicate the positions of the detected pipes within each B-scan. Mapping of these detected pipes is depicted in the figure on the right for each case. It should be noted that in the B-Scans Sl_y_1 to Sl_y_4 (Figure 6), since there are no noticeable hyperbolic shapes, no sewer pipes were reported.
Combining the mapping results found along the x and y axes gives the mapping of sewer lines detected in section SC-9, as illustrated in Figure 7 below.
5. Results of the Sewer Line Mapping
The final step in this study was to combine the mapping results found for the nine sections to estimate the sewer lines mapping in the whole study area. For this part, the results of the pipes detection and mapping step were fed into the MapInfo software [17] along with the locations of the manholes, as observed from the surface. This resulted in the mapping of the sewer lines in the entire study area by interpolating the detected pipes between the manholes based on their directions as found from GPR data. The results of this part of the study are shown in Figure 8. It should be noted that some manholes in Figure 8 were not connected to the network because there was no information about the pipes going to them. To include these manholes in the mapping, GPR scans should be conducted around them as was done for the other nine sections.
6. Conclusions
This paper presents the mapping of sewer lines as obtained from the results of GPR surveys carried out in an urban section of the city of Tunis, Tunisia, combined with visual inspection data. The GPR system used in this study was a SIR 3000 system from GSSI using a 400 MHz ground-coupled antenna. The major steps carried out during this study are: (i) Selecting the most suitable sections around the study area to conduct GPR testing; (ii) collecting GPR data along the x and y directions in each section; (iii) manually detecting and estimating the pipes locations based on the GPR signatures of buried cylinders; and (iv) mapping the subsurface sewer lines in the entire study area based on the GPR results and manhole locations. The MapInfo software was used in this study to interpolate the missing pipes. It was shown that this technique can map an entire sewer network even though GPR data was collected from only some sections of the study area.
Future prospective studies can be carried out to obtain more information about the subsurface utilities, such as the depth and radius of pipes, and to detect and map other types of utilities such as natural gas pipes, water pipes, etc. Some steps to improve the processing of the GPR signals, such as automatic detection of pipes reflections, will be considered in a future work.
Supplementary Materials
Supplementary materials can be found at: https://www.mdpi.com/2306-5729/3/4/40/s1
Author Contributions
Conceptualization, S.L., K.B. and C.S.; Formal analysis, R.G.; Investigation, R.G.; Supervision, S.L., K.B. and C.S.; Validation, S.L., K.B. and C.S.; Writing—original draft, R.G.; Writing—review & editing, S.L.
Funding
This research received no external funding.
Acknowledgments
All measurements were performed during a Short-Term training in the Office of Topography and Cadastre (OTC). The authors would like to thank all the team of OTC who provided insight and expertise during this study and for their comments that greatly improved the manuscript.
Conflicts of Interest
The authors declare no conflict of interest.
References
- Cist, D.B.; Schutz, A.E. State of The Art for Pipe & Leak Detection; Geophysical Survey System, Inc.: Salem, New Hampshire, NH, USA, 2001; pp. 2–8. [Google Scholar]
- Rogers, C.D.F.; Chapman, D.N.; Entwisle, D.; Jones, L.; Kessler, H.; Metje, N.; Mica, L.; Morey, M.; Pospisil, P.; Price, S.; et al. Predictive mapping of soil geophysical properties for GPR utility location surveys. In Proceedings of the 5th International Workshop on Advanced Ground Penetrating Radar, Granada, Spain, 27–29 May 2009; pp. 60–67. [Google Scholar]
- Hao, T.; Rogers, C.D.F.; Metje, N.; Chapman, D.N.; Muggleton, J.M.; Foo, K.Y.; Wang, P.; Pennock, S.R.; Atkins, P.R.; Swingler, S.G.; et al. Condition assessment of the buried utility service infrastructure. Tunn. Undergr. Space Technol. 2012, 28, 331–344. [Google Scholar] [CrossRef]
- Cheng, N.-F.; Conrad Tang, H.-W.; Chan, C.-T. Identification and positioning of underground utilities using ground penetrating radar (GPR). Sustain. Environ. Res. 2013, 23, 141–152. [Google Scholar]
- Rashed, M.A.; Al-Garni, M.A. On the application of GPR for locating underground utilities in urban areas. Arab. J. Geosci. 2013, 6, 3505–3511. [Google Scholar] [CrossRef]
- Jaw, S.W.; Hashim, M. Locational accuracy of underground utility mapping using ground penetrating radar. Tunn. Undergr. Space Technol. 2013, 35, 20–29. [Google Scholar] [CrossRef]
- Benedetto, A.; Tosti, F.; Ortuani, B.; Giudici, M.; Mele, M. Mapping the spatial variation of soil moisture at the large scale using GPR for pavement applications. Near Surf. Geophys. 2015, 13, 3. [Google Scholar] [CrossRef]
- Hashim, M.; Jaw, S.W.; Marghany, M. Ground penetrating radar data processing for retrieval of utility material types and radius estimation. In Proceedings of the 2011 IEEE RF and Microwave Conference (RFM), Negeri Sembilan, Malaysia, 12–14 December 2011; pp. 191–196. [Google Scholar]
- Persico, R.; D’amico, S.; Rizzo, E.; Capozzoli, L.; Micallef, A. Ground Penetrating Radar investigations in sites of cultural interest in Malta. Ground Penetrat. Radar 2018, 1, 1. [Google Scholar] [CrossRef]
- Ghozzi, R.; Lahouar, S.; Souani, C.; Besbes, K. Peak detection of GPR data with Lifting WaveletTransform (LWT). In Proceedings of the IEEE International Conference on Advanced Systems and Electrical Technologies (IC_ASET’2017), Hammamet, Tunisia, 14–17 Jannuary 2017; pp. 34–37. [Google Scholar] [CrossRef]
- Park, B.; Kim, J.; Lee, J.; Kang, M.-S.; An, Y.-K. Underground Object Classification for Urban Roads Using Instantaneous Phase Analysis of Ground-Penetrating Radar (GPR) Data. Remote Sens. 2018, 10, 1417. [Google Scholar] [CrossRef]
- Jamil, H.; Nomanbhoy, Z.; Mohd Yusoff, M.Y. Underground Utility Mapping and its Challenges in Malaysia. In TS05 J—Mining and underground Engineering Surveying II; 2012; Volume 5636, Available online: https://scholar.google.com/scholar?hl=fr&as_sdt=0%2C5&q=Underground+Utility+Mapping+and+its+Challenges+in+Malaysia&btnG= (accessed on 1 October 2018).
- Porsani, J.L.; Ruy, Y.B.; Ramos, F.P.; Yamanouth, G.R.B. GPR applied to mapping utilities along the route of the Line 4 (yellow) subway tunnel construction in Sao Paulo City, Brazil. J. Appl. Geophys. 2012, 80, 25–31. [Google Scholar] [CrossRef]
- Zhu, S.P.; Wang, J.; Li, Y.; Su, Y.; Sato, M. A circular measurement for linearly polarized Ground Penetrating Radar to map subsurface crossing cylinders. In Proceedings of the 2013 IEEE International Geoscience and Remote Sensing Symposium (IGARSS), Melbourne, Australia, 21–26 July 2013; pp. 1426–1429. [Google Scholar] [CrossRef]
- Zhu, S.P.; Wang, J.; Su, Y.; Sato, M. A circular survey for 3D Ground Penetrating Radar to map hidden cylinders. In Proceedings of the 2013 7th International Workshop on Advanced Ground Penetrating Radar (Iwagpr), Nante, France, 2–5 July 2013; pp. 305–309. [Google Scholar]
- Metwaly, M. Application of GPR technique for subsurface utility mapping: A case study from urban area of Holy Mecca, Saudi Arabia. Measurement 2015, 60, 139–145. [Google Scholar] [CrossRef]
- MapInfo Professional V11.5 User Guide; MapInfo Corporation: Troy, NY, USA, 2012; p. 575.
- Safont, G.; Salazar, A.; Rodriguez, A.; Vergara, L. On Recovering Missing Ground Penetrating Radar Traces by Statistical Interpolation Methods. Remote Sens. 2014, 6, 7546–7565. [Google Scholar] [CrossRef] [Green Version]
- Chen, H.; Cohn, A.G. Probabilistic Robust Hyperbola Mixture Model for Interpreting Ground Penetrating Radar Data. In Proceedings of the World Congress on Computational Intelligence (WCCI 2010), Barcelona, Spain, 18–23 July 2010. [Google Scholar] [CrossRef]
- Mertens, L.; Persico, R.; Matera, L.; Lambot, S. Automated Detection of Reflection Hyperbolas in Complex GPR Images With No A Priori Knowledge on the Medium. IEEE Trans. Geosci. Remote Sens. 2016, 54, 580–596. [Google Scholar] [CrossRef]
- Tzanis, A. matGPR Release 2: A freeware MATLAB® package for the analysis & interpretation of common and single offset GPR data. FastTimes 2010, 15, 17–43. [Google Scholar]
Figure 1.
Map of the studied area.

Figure 2.
The GPR scanning sites shown on a Google Earth image.

Figure 3.
Flowchart of the major steps carried out in this study.

Figure 4.
Example of GPR data collected in section SC-9: (a) Scan lines along the x and y axes, (b) B-Scans collected along the y-axis parallel to the x-axis, and (c) B-Scans collected along the x-axis parallel to the y-axis.
Figure 4.
Example of GPR data collected in section SC-9: (a) Scan lines along the x and y axes, (b) B-Scans collected along the y-axis parallel to the x-axis, and (c) B-Scans collected along the x-axis parallel to the y-axis.

Figure 5.
Example of sewer line position estimation along the x-axis in section SC-9: (a) B-Scans showing the detected pipes, and (b) Mapping of the pipes detected along the x-axis.
Figure 5.
Example of sewer line position estimation along the x-axis in section SC-9: (a) B-Scans showing the detected pipes, and (b) Mapping of the pipes detected along the x-axis.

Figure 6.
Example of sewer line position estimation along the y-axis in section SC-9: (a) B-Scans showing the detected pipes, and (b) Mapping of the pipes detected along the y-axis.
Figure 6.
Example of sewer line position estimation along the y-axis in section SC-9: (a) B-Scans showing the detected pipes, and (b) Mapping of the pipes detected along the y-axis.

Figure 7.
Combined mapping results for section SC-9 along x and y axes.

Figure 8.
Results of the sewer line mapping in the entire study area.


Table 1.
GPR datasets collected within the study area.
| Label | Scan Section (m × m) | Number of Traces in Each Direction | Number of Scan Lines |
|---|---|---|---|
| SC-1 | 11.82 × 30.46 | 592 × 1524 | 7 × 6 |
| SC-2 | 8.94 × 11.5 | 448 × 576 | 7 × 5 |
| SC-3 | 9.82 × 13.34 | 492 × 668 | 9 × 6 |
| SC-4 | 10.54 × 20.78 | 528 × 1040 | 12 × 6 |
| SC-5 | 8.94 × 7.42 | 448 × 372 | 5 × 7 |
| SC-6 | 15.82 × 6.38 | 792 × 320 | 5 × 9 |
| SC-7 | 13.1 × 13.26 | 656 × 664 | 8 × 8 |
| SC-8 | 10.62 × 7.9 | 532 × 396 | 5 × 6 |
| SC-9 | 7.1 × 11.66 | 356 × 584 | 7 × 4 |
© 2018 by the authors. Licensee MDPI, Basel, Switzerland. This article is an open access article distributed under the terms and conditions of the Creative Commons Attribution (CC BY) license (http://creativecommons.org/licenses/by/4.0/).
Share and Cite
MDPI and ACS Style
Ghozzi, R.; Lahouar, S.; Besbes, K.; Souani, C. Mapping of Sewer Lines Using GPR: A Case Study in Tunisia. Data 2018, 3, 40. https://doi.org/10.3390/data3040040
AMA Style
Ghozzi R, Lahouar S, Besbes K, Souani C. Mapping of Sewer Lines Using GPR: A Case Study in Tunisia. Data. 2018; 3(4):40. https://doi.org/10.3390/data3040040
Chicago/Turabian StyleGhozzi, Rim, Samer Lahouar, Kamel Besbes, and Chokri Souani. 2018. "Mapping of Sewer Lines Using GPR: A Case Study in Tunisia" Data 3, no. 4: 40. https://doi.org/10.3390/data3040040