Innovating Metrics for Smarter, Responsive Cities


AmbientEase, Victoria, BC V8V 4Y9, Canada
Data 2019, 4(1), 25; https://doi.org/10.3390/data4010025
Submission received: 31 January 2019
/
Revised: 31 January 2019
/
Accepted: 2 February 2019
/
Published: 6 February 2019
(This article belongs to the Special Issue Big Data Challenges in Smart Cities)
Abstract
:This paper explores the emerging and evolving landscape for metrics in smart cities in relation to big data challenges. Based on a review of the research literature, the problem of “synthetic quantitative indicators” along with concerns for “measuring urban realities” and “making metrics meaningful” are identified. In response, the purpose of this paper is to advance the need for innovating metrics for smarter, more interactive and responsive cities in addressing and mitigating algorithmic-related challenges on the one hand, and concerns associated with involving people more meaningfully on the other hand. As such, the constructs of awareness, learning, openness, and engagement are employed in this study. Using an exploratory case study approach, the research design for this work includes the use of multiple methods of data collection including survey and interviews. Employing a combination of content analysis for qualitative data and descriptive statistics for quantitative data, the main findings of this work support the need for rethinking and innovating metrics. As such, the main conclusion of this paper highlights the potential for developing new pathways and spaces for involving people more directly, knowingly, and meaningfully in addressing big and small data challenges for the innovating of urban metrics.
1. Introduction
Al-Nasrawi, Adams, and El-Zaart [1] note the trend of using “synthetic quantitative indicators” in measuring and assessing smartness in cities. Caprotti, Cowley, Datta, Brot, Gao, Georgeson, Herrick, Odeandaal, and Joss [2] highlight key opportunities and challenges for policy and practices in relation to metrics and measurements as part of the new urban agenda in responding to the issues pertaining to “a lack of data” together with the “difficulties in measuring urban realities” noting that “at the urban level, measurement becomes entangled with people’s lives and priorities”. Six points for debate on the new urban agenda are identified, two of which pertain to metrics, as “how to ensure appropriate measurement and data for metrics” and whether “the focus on data and metrics leads away from a focus on urban development” [2]. In response, the purpose of this paper is to advance the need for innovating metrics for smarter, more responsive cities in addressing and mitigating algorithmic-related challenges on the one hand [3] and on the other hand, concerns associated with involving people more meaningfully. To this end, the constructs of awareness, learning, openness, and engagement [4] are employed in this study in the search for more meaningful metrics [5]. A combination of emergence theory [6] and complexity theory [7] in the context of urban environments as emergent urbanism [8] supports the use of these four constructs in relation to human interactions. This work is significant in that it: (a) contributes to arguments related to the need for theory on urban metrics in an age of big data; (b) explores big and small data approaches in relation to emergent understandings of urban metrics; and (c) sheds light on the people dimensions of smart cities. As such, the main aim of this work is to explore the emerging and evolving landscape for metrics in smart cities in relation to big data challenges. The primary conclusion of this paper highlights the potential for developing new pathways and spaces for involving people more directly, knowingly, and meaningfully in addressing big data challenges for the innovating of smarter, more responsive city, community, and urban region metrics.
The key research question under exploration in this work is: How and why is the innovating of metrics important for smarter and more responsive cities? This research question is reformulated as a proposition for exploration in Section 4.1 of this article.
Through a review of the research literature, this work will provide perspectives on challenges for big data and smart cities in Section 2 and metrics and smart cities in Section 3. Section 4 provides urban-level explorations for the innovating of metrics followed by a discussion of findings, implications, limitations, and future directions in Section 5, and the conclusion in Section 6.
2. Perspectives on Challenges for Big Data and Smart Cities
Through a review of the research literature, diverse perspectives emerge on challenges for big data as well as small data in relation to smart cities.
2.1. Big Data—Efficiencies, Effectiveness, Privacy, Reliability, and the 5Vs
Challenges for big data in smart cities emerge in terms of efficiencies, effectiveness, privacy, reliability, and the 5Vs of variety, veracity, volume, velocity, and value.
2.1.1. Big Data and Small Data
From a human geography perspective, Batty [9] defines big data in relation to urban data in terms of size; the spatial and temporal, as in that which is “invariably tagged for space and time”; and source or type, as in “largely being streamed from sensors”. As such, Batty [9] argues that big data is contributing to “a sea change in the kinds of data about what happens where and when in cities”. Big data, according to Batty [9], is “enriching our experiences of how cities function, offering many new opportunities for social interaction and more informed decision-making” in terms of “our knowledge of how best to interact in cities”. On an individual level, Estrin [10] points to the importance of “small data” in the form of digital traces generated in the course of everyday activities. While not “discounting the importance of our own self-awareness” Estrin [10] argues that “we as individuals should have access to our digital traces so that we can mine them for our own purposes”. Chauhan, Agarwal, and Kar [11] identify a series of major big data challenges in smart cities through a systematic review of the research literature pertaining to human dynamics, privacy, security, volume, velocity, variety, veracity, and value. Chauhan et al. [11] offer solutions to these challenges for practitioners in terms of a process for effective management. Drawing on the work of Jara, Bocchi, and Genoud [12], Chauhan et al. [11] claim that “continuous interactions between humans and machines provide opportunities to overcome the challenges by introducing new technologies and methodologies”. Additionally, directions are identified for researchers going forward, including the need for empirical methodologies to complement conceptual approaches; the use of context-aware platforms at scale; areas of connection between human cognition and smart city characteristics; and the use of big data in social contexts. Lepri, Antonelli, Pianesi, and Pentland [13] address the challenge of making big data work, focusing on Call Detail Records (CDRs) and social media in terms of individual and collective behaviors in relation to data-driven explorations in understanding city dynamics. Joshi and When [14] point to the “views, sentiments, knowledge and preferences” of people as an added layer of open data and big data influencing policy discussions on the one hand and as a variable for e-participation explorations of people as “social sensors” in the form of “citizen discussion via social media” on the other.
2.1.2. Efficiencies, Effectiveness, Reliability, and the 5Vs
Al Nuaimi, Al Neyadi, Mohamed, and Al-Jaroodi [15] provide a review of big data applications in support of smart cities in terms of the different definitions of each, focusing on “effective analysis and utilization” while “actively engaging with citizens”. Addressing emerging trends and challenges for big data implementation in future smart cities, Han, Guizani, Lloret, Chan, Wan, and Guibene [16] identified the issues of “how to design algorithms to process mass data” as well as “how to utilize big data to improve quality of services (QoS)”. Emphasis is placed on the “efficiency of services” in providing a “better quality of life” for people. Where Chauhan et al. [11] placed an emphasis on the two Vs of variety and value, as part 2 of their work, Han et al. [17] claim that, “smart cities are data-driven” highlighting effective computing along with the other three Vs of veracity, volume, and velocity involving algorithms for machine learning and data analytics and “soft sensing” in support of quality of experience (QoE) and the area of the Internet of Small Things (IoST) data. As part 3 of their work, Han et al. [18] highlight the challenges of privacy leakage risk enabled through location-based services (LBS) including intrusion, theft, and unauthorized sale of sensitive information. In addition to efficiency, Han et al. [18] point to the importance of “improving reliability in delivering context-aware services”. Based on a systematic review of the research literature, Osman [19] proposes a “novel big data analytics framework for smart cities” including “new functionalities” compared to “traditional knowledge discovery approaches” pertaining to “data model management and aggregation”.
2.1.3. Data Types, Data Uses, and Privacy
Thakuriah, Tilahun, and Zellner [20] identify a range of big data types in an urban context beyond that generated by sensors and the Internet of Things (IoT) and social media. For example, Thakuriah et al. [20] point to transactional data (privately held), administrative micro-data (confidential), collections data (arts and humanities), and hybrid data as in synthetic or linked data. Referring to the work of other researchers [21], [22], Thakuriah et al. [20] describe synthetic data as simulated micro-data “constructed to mimic some features of the actual data using micro-simulation methods” said to be an approach used “to ensure confidentiality”. However, Thakuriah et al. [20] point to the “significant challenges” associated with the use of big data, which they categorize as technological, methodological, theoretical and epistemological, with political economy dimensions. Among theoretical and epistemological challenges, Thakuriah et al. [20] refer to that of “understanding metrics” for making sense of “urban”.
Zook [23] claims that, “the role of sensors is to pass through data” as distinct from the roles of questioning the significance of data or contributing in some way to the defining of meaning for data. It is worth noting that Zook [23] speaks of contributions as ranging from those of an “unconscious” nature including “cell phone records, CCTV records” to those constituting a “continuum of conscious” including “check-in, activity monitors, social media”. According to Thakuriah et al. [20], “novel sources of big data have the potential to allow the capture of data on social, behavioural and economic aspects of urban phenomena that have either not been previously measured or have been measured at resolutions that are too aggregated to be meaningful” advancing the notion by Smith [24] for “a continued need for ethnographic approaches and qualitative methods”.
2.1.4. Data Context, Theory, and Approaches
Drawing on the ethnographic work of Geertz [25] and the notion of “thick descriptions” of the social and cultural context, Smith [26] argues that instead of big data there is a need for “thick data” in smart cities claiming that, “data cannot transcend the lively and contradictory social worlds that it measures” pointing to the need for “cultivating people skills” at the street and community levels enabling the utilization of data based on “generative social contexts” where data “becomes thick with social meaning”. Lim, Kim, and Maglio [27] developed a framework for data use for smart cities focusing on the local in terms of operations management, preventive administration, network development, and information diffusion along with associated challenges and considerations. Key challenges pertain to data quality, integration, privacy, understanding the needs of people, enhancing geographic information delivery methods, and designing smart city services [27]. Key considerations include a service-oriented perspective, the experience of people, a data-oriented perspective, the creation of synergies, and the forming of cross-functional teams [27].
Encouraging an ethnographic understanding of data, Dourish and Cruz [28] argue for a narrating of and with data “as part of broader processes of interpretation and meaning-making” because it is claimed that “data do not stand alone” but rather, “they do their work in relation to multiple other entities” whether this be aggregation, systems of processing, or “most importantly in relation to people”. As if in response, Bornakke and Due [29] propose a method for big-thick blending in support of analytical insights such that the data universe is conceptualized on a horizontal range of thin to thick and a vertical range of extensive to small. As such, big-thin data from surveys can be plotted in the upper left and small thick data from interviews and observations in the lower right [29] in the generation of “unique complementary effects”.
Pink, Ruckenstein, Willim, and Dugue [30] explore the notion of broken data as a metaphor for understanding “how data might be in processes of decay, making, repair, re-making and growth” and as such, “are inextricable from the ongoing forms of creativity that stem from everyday contingencies and improvisatory human activity”. For Pink et al. [30], in view of such contingencies, data cannot be regarded “as having objectively reliable predictive qualities”. As such, Pink et al. [30] argue that “the production, analysis, reading, and remaking of data involve complex processes” that in “everyday environments are relational, ongoingly changing, and emergent”. An ethnographic approach is encouraged by Pink et al. [30], combined with other techniques, such as the use of survey and interview methods with small-scale, in-depth studies designed to generate insights. Pink et al. [30] caution that, “what appears as incomplete, inconsistent and broken to some practitioners might be irrelevant for others, or a research opportunity”. Indeed, the claim by Pink et al. [30] is that “only in the light of intended uses” is it “that some data might be considered broken, split, fractured, malfunctioning or noisy” arguing that data “be understood in relation to how it is intended to be processed” adding that “there is no predetermined definition of when data is broken”. Bell et al. [5] identify in the research literature the gap of “user-driven demand for data”.
Wise and Shaffer [31] address the importance of “theory-informed and theory-contributing learning analytics” in the context of big data, pointing to the “critical problems in the analysis of large-scale data that occur when theory is not involved”. Wise and Shaffer [31] argue that theory assists in determining “what variables a researcher should attend to and how to interpret a multitude of micro-results and make them actionable”.
2.2. Smart Cities—Theories and Future Potentials
Data challenges are identified from a range of perspectives for smart cities in relation to theory and future potentials.
2.2.1. Urban Theory
Batty [9] calls for new theories on “how people behave in data rich environments” where “big data provides the context for the study” and analysis of in-the-moment and shorter-term data along with “measures of disruption” for planning, managing, and shorter-term thinking about how cities function. Zygiaris [32] developed a measurement system based on six layers of a smart city that include: city layer focusing on context; the green city layer focusing on environmental sustainability; the interconnection layer for the diffusion of green economies; the instrumentation layer in support of real-time smart meters and infrastructure sensors; the open integration layer with apps to communicate and share data, content, services, and information; the application layer enabling real-time responsive operation; and the innovation layer to foster new business opportunities. DeRen, JianJun, and Yuan [33] describe the architecture and supporting technologies for the smart city in terms of a “perception layer” or sensor layer “for obtaining data”; a network layer for information transmission; a service layer in support of mass data storage, analysis in real-time, and processing; and an application layer “for end users”.
Albino, Berardi, and Dangelico [34] discuss the types of emerging metrics for assessing smart city initiatives, drawing on the work of Zygiaris [32]. From an urban, culture, and society perspective, Aylett [35] claimed that “the allure of ‘smart’ approaches” relates to how “Geoweb-enabled approaches to urban planning and implementation” along with “information technology tools seem so well suited to the challenges” associated with “collecting, sharing, and analyzing new and existing data” pointing also to the need for digital literacy. The Urban Theory Lab (UTL) [36] at the Harvard Graduate School of Design is “concerned with developing concepts, methods and cartographies that illuminate emergent forms of planetary urbanization”.
Works by Karvonen, Cugurullo, and Caprotti [37] and Coletta, Evans, Heaphy, and Kitchin [38] highlight the rich and diverse array of smart city initiatives illustrating the multiplicity of smart urbanism models and typologies. Yigitcanlar, Kamruzzaman, Foth, Sabatini, da Costa, and Ioppolo [39] explore the smart cities notion in relation to broader, more comprehensive understandings of sustainability. Cugurullo [40] advances a theory of Frankenstein urbanism “to understand, critique and improve urban experiments such as smart and eco-city projects” that, from a sustainability perspective, are exposed as “fragmented cities made of disconnected and often incongruous pieces of urban fabric”. The geographical literature [41] provides assistance in figuring out how metrics for smart cities may be used in aid of issues pertaining to fragmentation. Indeed, it is worth noting that Mollá-Sirvent, Mora, Gilart-Iglesias, Pérez-delHoyo, and Andújar-Montoya [42] developed an accessibility index for smart cities where “using data collected by citizens” it will be possible “to visualize in a concise way how accessible a city is” over time.
2.2.2. Future Potential
Since 2015, the Institute For The Future (IFTF) [43] has engaged in imagining “interconnectedness in human + machine futures”. Smart cities, Dotti [44] argues, “should mean better services for citizens, more responsive administrations and less impact on the environment”. Concerned with placing a stronger emphasis on people, Caprotti et al. [2] note that, “at the urban level, measurement becomes entangled with people’s lives and priorities”. Where DeRen et al. [33] identify the sensor layer as an approach to the sourcing of data, Ang, Seng, Zungeru, and Ijemaru [45] provide a framework for data sensors that extends further to include “Internet/communications, sensor/things, and people/creature”. Ang et al. [45] identify human sensors as voluntary on the one hand (e g., people as sensors, wearable body sensors, participatory sensing, and volunteered geographic information (VGI)) and as involuntary on the other hand (e.g., collective sensing, crowdsensing, mobile phone sensing, and online sensing). Of note are the future directions identified by Ang et al. [45] from the three domains of Internet/communications, sensor/things, and people/creature as the Internet of People (IoP), context-aware sensing networks, and sensor-cloud infrastructure.
Laurini [41] refers to “data” as “raw measures” that can be mobilized in support of knowledge engineering to become the foundation of a new type of urban planning based on a geographic knowledge infrastructure providing a new generation of tools. Joss [46] addresses the role of the public in smart cities and future cities in terms of institutional arrangements, conceptual discourses, and on-the-ground practices, arguing for stronger institutional frameworks and citizen involvement through more meaningful engagement in the actualizing and scrutinizing of processes and approaches while pointing to “wider questions about how data may be owned, shared and assured within the public sphere”. Mattern [47] describes the HUMAN Project where the acronym refers to “human understanding through measurement and analytics” giving rise to the observation that “all our bodies and environments are already data—both public and proprietary”. For Mattern [47], this observation gives rise to a series of questions, such as: “how can we respond individually and collectively to the regime of quantitative rationalization?” and “how might we avert its risks, even as we recognize its benefits?” and “wouldn’t it be better to use algorithms to identify areas and issues of concern, and then to investigate with more diverse, localized qualitative methods?” Komninos and Mora [48] provide a review of the research literature for smart cities highlighting the importance of emerging technologies in “improving the functioning of urban environments” when “used to address issues limiting the sustainable development of cities”. Schaffers [49] argues that “truly smart cities” will be characterized not by the “ability to engineer and implement smart technological systems in predefined settings” but by the “ability to establish collaboration mechanisms for mobilizing the collective intelligence of citizens and other stakeholders”.
2.3. Summary
An overview of this review of the research literature for challenges associated with data (big and small) and smart cities is provided in Table 1.
Author counts by primary author/secondary author(s) discussing each of the challenge areas are included, broadening the perception of justification. Challenges emerge for big data and smart cities associated with algorithms; approaches to data gathering and analysis; context; sensing; synthetic data types; and the 5Vs of value, variety, velocity, veracity, and volume. While only touched on briefly in this review of the literature, challenges emerge for small data associated with, but not limited to, approaches and methods, context, sensing, and new forms of value, variety, veracity, and volume for individuals.
3. Metrics and Smart Cities
Through a review of the research literature, diverse perspectives emerge on challenges for metrics and smart cities, focusing on algorithms; urban indicators, performance, measurements, and standards; unmeasurability and meaningfulness; and performative metrics.
3.1. Metrics
In 2014 the World Council on City Data (WCCD) was established as a global leader on standardized metrics, advancing ISO 37120:2018—Sustainable Development of Communities: Indicators for City Services and Quality of Life [50] with 17 themes, and 100 indicators, 46 of which are said to be core measures of a city’s social, economic, and environmental performance. While there is a cost to acquire standard ISO 37120:2018 [51], Cohen [52] noted the challenge for many cities in responding to the volume of indicators. From a human geography perspective, Lévy [53] defines metrics as “ways of measuring and managing distance” where distance is described as “a set of attributes characterizing a social reality in relation to the level of contact or separation”. According to Lévy [53], distance “represents a hurdle to social interactions” and such interactions “are a condition for the production and reproduction of a society”. Concerned with “proclamations of being a smart and sustainable city” based on “synthetic quantitative indicators”, Marsal-Llacuna [54] identifies the need for “global metrics to set the terms of references for urban smartness”. Al-Nasrawi, Adams, and El-Zaart [1] call for “an accurate metric of comparison that considers the city’s context”. Dotti [44] discusses the challenge of approaches to measuring the quality of life in smart cities in relation to data reliability and “making sense of the numbers” as in “making the numbers talk” for indicators of smartphone penetration, Internet access and the like. Dotti [44] questions whether it is possible to measure the well-being of people, noting work already undertaken by the Organisation for Economic Cooperation and Development (OECD) using open data, made available to researchers and city residents, pertaining to “access to services, civic engagement, environment, individual income, employment and education”.
3.2. Algorithms
Among a series of requirements for big data in smart cities, Al Nuaimi et al. [15] highlight that of advanced algorithms “designed for real-time application” to address the need for “high-speed processing” and “optimized to handle high data volumes, large variety of data types, time constraints on decision making processes, and distributed components across various geographical locations” while working “effectively across heterogeneous environments” that are “highly dynamic”. Parmiggiani, Monteiro, and Østerlie [55] explore the notion of synthetic situations in the context of big data and the IoT “where phenomena are algorithmically enacted through digital technologies” using the offshore oil and gas industry for conducting interpretive studies of situations that are synthetic and performative, characterized by physical inaccessibility and virtualization such that “algorithmic phenomena constitute the phenomena under inquiry”. Extending Knorr Cetina’s [56] work on synthetic situations “developed to theorize situations where people find themselves in one another’s presence without needing to be physically co-located”, Parmiggiani et al. [55] describe, from an ethnographic and interpretive perspective, “work conducted by necessity in the midst of a ‘datification’” [57] where “situated action is laid out and constituted through the material aspects of (sometimes faulty) sensors, data streams, measurement devices, and heterogeneous on-screen representations”. Zarsky [58] articulates “the trouble with algorithmic decisions” while in support of policymakers and academics, offering “a comprehensive framework for approaching these thorny issues” focusing on “efficiency and fairness-based concerns” pertaining to two attributes of “the algorithmic processes feature” namely “its opaque and automated nature”. Mittelstadt, Allo, Taddeo, Wachter, and Floridi [59] provide a mapping to organize the debate surrounding the ethics of algorithms while identifying areas for further work. According to Mittelstadt et al. [59] algorithms give rise to six types of ethical concerns, two of which are categorized as normative (unfair outcomes and transformative effects); three are categorized as epistemic (inconclusive evidence, inscrutable evidence, and misguided evidence); and that of traceability. From a technical perspective, Tosi [60] “discusses five innovative mobility patterns” using cell phone big data to “complete other sources of people information” in support of improved urban movement based on “designed mining algorithms” that “fill the gap” providing solutions that are said to be missing from research and industry. Falcon and Hamamoto [61] argue that the mass amounts of data being generated in everyday life “through the Web” and “on city streets” are opening the way for “bodies of data together with algorithms” that “will shape who we think we are” and “who we will become”. In an introduction to a special issue on the theme of algorithms in culture, Ames [3] refers to the algorithmic moment and the algorithmic turn in “deconstructing the algorithmic sublime” through a “social scientific and humanistic perspective”.
3.3. Urban Indicators, Performance, Measurements, and Standards
Placemaking networks have been interested in tracking elements of public spaces for some time [62]. Caird, Hudson, and Kortuem [63] note that, “general city indexes are also a major source of indicators, measures and data to inform smart city evaluation and measurement” yet “surprisingly few city indexes (that have published their methodology) have identified specifically smart city indicators and metrics”. According to Caird et al. [63] “there is currently no standardised smart city measurement indicator framework accepted by cities to measure city performance, and to help evaluate progress against measurement indicators aligned with city strategies”. Issues identified as challenges by Caird et al. [63] include those related to reporting in terms of “how to make good use of data intelligence to communicate the value of smart city work generally, supported by both standards development and interoperability in the reporting criteria and data used in evaluation and reporting”. Definitional issues were also identified by Caird et al. [63] related to “so-called smart cities” since many “are at different stages of becoming smart future cities”. The CityKeys Project [64] provides a “set of indicators for assessing the success of projects” based on a common performance measurement framework.
Bosch, Jongeneel, Rovers, Neumann, Airaksinen, and Huovila [65] provide a report on the indicators for smart city projects with a focus on people (social sustainability), planet (environmental sustainability), prosperity (economic sustainability), governance, and propagation (diffusion potential) and at the smart cities level with a focus on people, prosperity, and governance. Bosch et al. [65] indicate that, “an intensive consultation process with partner cities has contributed to a reasonably complete and comprehensive set of indicators” that is “reasonably balanced with regard to the city’s objectives, certainly on the project level”. Bosch et al. [65] note that, most of the indicators are “derived from existing indicator frameworks” with extensive consultation resulting in the addition of “new indicators suggested to fill gaps”. Bosch et al. [65] refer to indicators as “progress measures”. With the overarching goal “to support the speeding up of wide-scale deployment of smart city solutions and services” in response to “major societal challenges around the continuous growth and densification of cities”, the main aim of CityKeys, according to Bosch et al. [65], is “to facilitate and enable stakeholders in projects or cities to learn from each other, create trust in solutions, and monitor progress, by means of a common integrated performance measurement framework”. Key performance indicators (KPIs) are described by Bosch et al. [65] as “quantifiable metrics that reflect the performance of a business in the context of achieving its wider goals and objectives”.
Indicators are provided for smart city projects and for smart cities based on criteria from the CIVITAS framework [66], including: relevance, completeness, availability, measurability, reliability, familiarity, non-redundancy, and independence. Drawing on work by the UNICEF Monitoring and Evaluation Training Resources, CityKeys outlines a typology of indicators according to “stage in the process” that includes several types of indicators—input, process, output, outcome, and impact. Identifying future research directions, Osman [19] makes a series of recommendations for smart cities data analytics including the development of “efficient persistence, retrieval and ensemble algorithms” and the defining of “performance measures” in the form of KPIs to evaluate analytics frameworks.
Referred to as a “synthetic index” in that “it is a function of the partial indicators available”, the Cities in Motion Index (CIMI) “aims to create awareness and generate innovative tools to achieve smarter governments” and is said to be “designed with the aim of constructing a ‘breakthrough’ indicator in terms of its completeness, characteristics, comparability and the quality and objectivity of its information” [67]. Al-Nasrawi, Adams, and El-Zaart [68] introduce a smart sustainable cities (SSC) assessment model designed to ensure “the integral sustainability of the systems of the city, including the human system”.
Caird and Hallett [69] provide an overview of “standardization and smart urban metrics” claiming that “standardized smart urban indicators and metrics are not widely accepted by cities” and that “the development of standards is at early stages”. According to Caird and Hallett [69] consideration needs to be given to “the selection of evaluation methods, urban measurement indicators, and data sources capable of determining the impact of smart city projects on citizens’ lives, and measuring the tangible/intangible and direct/indirect consequences of smart city developments”.
Table 2 provides a summary of key institutes, indices, indicators, and parameters of analysis of smart cities.
The British Standards Institution (BSI) [70] developed a series of smart city standards and publications to assist cities to “address various issues” associated with becoming a smart city including terminology, framework, data concept model, data sharing, smart infrastructure and so on. The CityKeys [71] project developed key performance indicators to assess smart city projects and progress using 92 project indicators and 73 city indicators. The European Commission supports CIVITAS [72], a framework for smart cities and smart city projects focusing on vitality and sustainability. The Economist Intelligence Unit (EIU) produces the Global Livability Index [73] to assess living conditions around the world based on “30 qualitative and quantitative factors” focusing on stability, healthcare, culture and environment, education, and infrastructure in 140 cities. The IESE Business School Center for Globalization and Strategy at the University of Navarra in Spain [67] provides 9 key areas identified for the Cities in Motion Index (CIMI) that include: economy, human capital, social cohesion, environment, governance, urban planning, international outreach, technology, and mobility and transportation in 165 cities of which 74 are capitals, in 80 countries. The International Standards Organization (ISO) developed standard 37120:2018 for Sustainable Cities and Communities, focusing on Indicators for City Services and Quality of Life (QoL) [51] as well as indicators for smart cities (37122) and resilient cities (37123). ISO 37120:2018 is said to be “applicable to any city, municipality, or local government that undertakes to measure its performance in a comparable and verifiable manner, irrespective of size and location” [74]. Across 450 cities, Mercer Quality of Living Rankings [75] considers metrics for quality of life such as political, social, economic, socio-cultural environments, as well as medical and health services, education, public services, recreation, consumer goods, housing, and the natural environment. Monocle’s Most Livable Cities Index (MLCI) provides a Quality of Life Survey [76] where the metrics evolve each year, focusing on business conditions, climate/sunshine, connectivity (international), environmental issues and access to nature, medical care, public transport, quality of architecture, safety/crime, tolerance, and urban design.
3.4. Unmeasurability and Meaningfulness
Patel [77] claims that, “instead of designing for pedestrians fixated on getting from point A to point B” there is a need to “be designing to make individuals aware of the in-between” giving rise to the question of “how do we attempt to reach the unmeasurable?” More recently, Marsal-Llacuna [78] explores the “use of social standards for centering the focus of the smart cities initiative back to the citizens” which is said to be “in contrast to the industrial drive and technological emphasis”. The work of Marsal-Llacuna [78] is said to contribute to ongoing refinement of ISO 37120 in the creation of “a more beneficial social standard for monitoring and safeguarding citizens’ rights in the smart city” where criteria include: measurable and assessable, replicable and reusable, scalable and simple, and realistic and fair. Caprotti et al. [2] point to the problems of measuring in the absence of data as in, “a lack of data” and “urban realities” that are “entangled with people’s lives and priorities”. Focusing on big geosocial media data from an urban governance perspective, Zook [23] argues that while “the metrics derived from them can provide useful insights and policy direction” it is important to “be ever mindful that metrics don’t simply measure” but also “are simultaneously defining what cities are”. It is worth noting that Hunter [79] advances the notion of “ambient contextuality” that “hinges on the idea that there is information hidden all around us that helps clarify our intent in any given conversation”. Enabled by the IoT, Hunter [79] claims that “a new, nascent communications triangle between people, processes and things that fuels usability” is emerging.
3.5. Performative Metrics
Zook [23] articulates the value and importance of metrics as performative and anticipatory in relation to data. Performative smart city metrics are seen to be “a key input and output of urban governance processes” while anticipatory smart city metrics point to a “key moment” in the “shift to anticipatory governance” so as “to identify metrics through which urban problems can be managed before they emerge” [23]. However, Zook [23] cautions that while “big” data may seem to be “better” producing accessible metrics and visualizations, this may contribute to “realities that mischaracterize and constrain”. For example, Baumer [80] proposes a human-centered algorithm design (HCAD) in response to gaps or disconnects between algorithm metrics focused on performance on the one hand and the need for incorporating “human and social interpretations” on the other. Baumer [80] identifies three approaches to making algorithmic design more people-centered, focusing on the theoretical, speculative, and participatory. According to Baumer [80] “meaning making” points to “limitations of traditional algorithm design and evaluation methods” and as such, “algorithmic support for the processes of meaning making is where human-centered approaches stand to contribute the most”. Coletta and Kitchin [81] give “attention to how the temporality of cities is being reshaped by systems and infrastructure that capture, process and act on real-time data” so as to “map out the ways in which city-scale Internet of Things infrastructures, and their associated networks of sensors, meters, transponders, actuators and algorithms, are used to measure, monitor and regulate the polymorphic temporal rhythms of urban life”. Through an ‘algorhythmic governance’ frame, analysis provides insight into “how smart city technologies computationally perform rhythm analysis and undertake rhythm-making that intervenes in space-time processes; distinct forms of algorhythmic governance, varying on the basis of adaptiveness, immediacy of action, and whether humans are in-, or, off-the-loop; and a number of factors that shape how algorhythmic governance works in practice” [81]. Coletta and Kitchin [81] also employ algorhythmic governance “co-created by algorithms and actors” to explore the pulse of the city, bringing people more directly into the loop.
Gray, Gerlitz, and Bounegru [82] argue for expanding the data literacy concept beyond “numerical, statistical and technical capacities” and “competencies in reading and working with datasets” to that of data infrastructure literacy, to include “the ability to account for, intervene around and participate in the wider socio-technical infrastructures through which data is created, stored and analysed”. Dourish and Cruz [28] note that from an ethnographic perspective, “studying algorithms” is “an essential element” for understanding “how the narrative about data being ‘objective’ is shaped” drawing on the work of Dourish [83] and others. Where Sassen [84] raised the question “does the city have speech?” in “expanding the analytical terrain for examining the concept of each, speech and the city”, Pink et al. [30] refer to the notion of making ‘data talk’ while indicating that their collaboration using citizen mindscapes suggests that in relation “to other data sets, or to interpreters of data” this ‘talking’ “is permeated by moments of breakdown and repair that call for a richer understanding of everyday data practices”. According to Pink et al. [30] “the brokenness concept opens up analytical possibilities that focus on the detail of our engagements with data as it is produced and manipulated”. Pink et al. [30] claim that, “data is always inferred and interpreted in infrastructure and database design and by professionals, who see the data, and its possibilities, differently depending on their training”. The brokenness of data is worth considering in the context of what Cugurullo [40] exposes as the fragmenting and disconnectedness of cities on the one hand and what Dourish and Bell [85] refer to as breakdowns and the inherent unevenness and messiness of infrastructures “in their operation and availability” on the other hand. Building on work by Bell [86], Pink et al. [30] note that, “the work of coding data and writing algorithms promotes judgments about what data should speak to what other data”. Exploring the evolving role of public libraries in smart cities, Leorke, Wyatt, and McQuire [87] point to the need for moving beyond traditional metrics (e.g., number of loans, etc.) to metrics for “non-book-borrowing users” or “visitors attending an author talk or lecture” or “attendees at iPad training” and the like as well as “attempts to capture the social and economic value of these kinds of activities”.
3.6. Metrics for Practical Smart City Use: Examples
Examples of the application of metrics for practical smart city use include that of the EY (Ernst and Young) Smart City Index in the case of Milan [88] where a focus is placed on participatory governance and social innovation. Similarly, the Smart City Prague concept [89] focuses on sustainable approaches to the development of public spaces in relation to comfort, infrastructure, and services for people, based on the involvement of citizens, along with a Smart City Index to assess success. In Germany, the Fraunhofer Institute [90] developed a more holistic perspective to smart city undertakings as integrated, sustainable, liveable, and resilient with an approach that emphasizes collaboration and partnerships. EY [91] advances the notion of collaboration between government, business, and entrepreneurs along nine dimensions for smart and resilient cities with citizens as a critical component “as the heart”.
3.7. Summary
An overview of this review of the research literature for challenges associated with data, metrics, and smart cities is presented on a continuum as depicted in Figure 1.
In this overview of challenges for data, metrics, and smart cities in relation to aware people and aware technologies enabled through information and communication technologies (ICTs), the IoT and other aware technologies, emergent highlighted elements include algorhythmic governance, algorithms, approaches, brokenness, fragmented, unevenness, context, openness, people-centric, sustainability, performance, performativity, relationships, reliability, sensing, synthetic indicators and situations, along with value, variety, velocity, veracity, and volume.
This review and summary of the research literature is depicted graphically in Figure 2, showing the emergence of data in smart cities enabled through information and communication technologies and the Internet of Things (ICTs/IoT) contributing to metrics from algorithms and synthetic indicators giving rise to the need for theory and methodologies for innovating metrics based on meaningfulness, people involvement, and the unmeasurable. As such, this work highlights the importance of theory and practice for data analytics and for the surfacing of variables in the innovating of metrics for smarter, more responsive cities.
4. Urban Level Explorations for Innovating Metrics
This section presents the theoretical perspective, research design and methods, and primary results for this work in relation to the constructs of awareness, learning, openness, and engagement.
4.1. Theoretical Perspective, Research Design, and Methods
This review and summary of the research literature enables formulation of a conceptual framework for innovating metrics for smarter, more responsive cities in this paper. As such, as presented in Table 3, the literature review provides the conceptual basis for the formation of interconnected thinking between the use of data generated in cities and their citizens. Earlier work by McKenna [4] articulates the notion of more aware people combined with more aware technologies in the context of new forms of data as spaces for people and their voices in smarter, more responsive cities while context-aware platforms are highlighted by Chauhan et al. [11] and Jara et al. [12]. The constructs of awareness, learning, openness, and engagement are used in this work to guide the exploration of innovating metrics. Based on work by IESE [67], awareness emerges in relation to the cities in motion index; awareness of digital traces in work by Estrin [10]; context-aware services by Han et al. [18]; context-aware sensing networks by Ang et al. [45]; and awareness of the in-between by Patel [77]. Learning figures strongly in relation to the importance of theory in data-pervasive environments by Wise and Shaffer [31] and also for machine learning by Han et al. [17]. Openness is surfaced by Joshi and When [14] in relation to identifying layers of open data; by Pink et al. [30] in relation to analytical possibilities for data and making ‘data talk’; and by Zygiaris [32] in relation to the open integration layer. Engagement is addressed by Dotti [44] in relation to measuring the well-being of people in a range of ways including civic engagement and also in work by Pink et al. [30] on engagement with data and Joss [46] in terms of the role of the public and meaningful engagement.
Caprotti et al. [2] address policy concerns with metrics; Bell et al. [5] focus on meaningful metrics; while Marsal-Llacuna [54] identifies the need for metrics that are global in support of ‘urban smartness’ and with a social focus [78]. Al-Nasrawi et al. [1] address synthetic quantitative indicators; standards for data are addressed by the WCCD [50]; and Cohen [52] highlights the volume of indicators while standards and indicators are available and evolving by the ISO for sustainable smart cities and communities in relation to city services and quality of life [51]. Bosch et al. [65] describe CITYkeys indicators for smart cities and also for smart city projects. Indices for smart cities are many and varied including an accessibility index [42], general city indexes [63], Cities in Motion Index (CIMI) [67]; the EIU [73] for global livability focusing on living conditions from an economic perspective in 140 cities to date; the Monocle [76] quality of life index; and the smart city index [88]. The potential for metrics to accommodate more aware people and aware technologies as adaptive is articulated by Coletta and Kitchin [81] focusing on “real-time data” as dynamic according to Al Nuaimi et al. [15] in terms of designing algorithms for “real-time application” that span “various geographical locations”; as contextual described by Hunter [79] where “information is hidden all around us” giving rise to the notion of “ambient contextuality” and big data as context by Batty [9]; context-aware services by Han et al. [18]; generative social contexts by Smith [26]; the city layer focusing on context by Zygiaris [32]; and algorithmic culture in context by Dourish [83].
Data as continuous is described by Chauhan et al. [11] in relation to “interactions between humans and machines” drawing on work by Jara et al. [12]; and in relation to the continuous growth of cities by Bosch et al. [65]. Data as improvisatory is articulated by Pink et al. [30] in terms of the creativity associated with “human activity” around interpretations of broken data. Data as meaningful is addressed by Thakuriah et al. [20] and Joss [46] as well as Baumer [80] in terms of evolving traditional algorithm design for greater involvement of people on the one hand and on the other hand by Bell et al. [5] focusing on metrics and co-design for smart cities. The performative nature of data is addressed by Zook [23] in terms of inputs and outputs for “anticipatory governance” and by Parmiggiani, Monteiro, and Østerlie [55] in relation to remote, inaccessible situations as synthetic, while performance aspects are addressed by Caird et al. [63] and Bosch et al. [65].
As depicted in Figure 3, this work brings an analytical contribution to the dimensions related to people and data in smart cities.
The study of the referenced dimensions presents insights for a possible framework that combines aware people and aware technologies using the constructs of awareness, learning, openness, and engagement in relation to metrics based on standards, indices, and indicators that are more adaptive, dynamic, contextual, continuous, improvisatory, meaningful, and performative in urban environments contributing to emerging and evolving understandings of metrics, as in ambient metrics. The use of design thinking [92] would be an example of an emergent, improvisatory approach to addressing urban issues.
The research design for this work uses an exploratory case study approach, said to be particularly appropriate for examining contemporary phenomena [93]. The case in this work constitutes the experiences of a diverse range of people at the urban level in multiple cities, mostly in Canada but extending also to cities in other countries (e.g, Northern Europe, Southern Europe, Israel). Purposive sampling in the form of heterogeneity sampling was used for this study to accommodate a wide spectrum of perspectives [94] whereby an invitation to participate in the study was posted in a way to attract researchers, students, educators, practitioners, and anyone interested in smart cities. During sign up for the study, demographic data were gathered including age range, gender, and city, and people could self-identify in one or more categories (e.g., student, educator, community member, business, city official, visitor, etc.). In the interests of inclusion, and to the extent that people live or visit cities responsibly, they have been considered as candidates for study and research, involving a combination of experts on the one hand and ordinary citizens interested in the subject on the other.
Quantitative data were obtained through an online survey while qualitative data were gathered through a combination of in-depth interviews and open-ended survey questions. The survey instrument and interview protocol were developed in relation to the emergent and exploratory research design and pre-tested prior to use. One individual participated in the pre-testing based on the criteria of expert skills with survey instrument and interview protocol design together with expertise in data analytics, learning cities, and smart cities. Analysis for quantitative data consisted of descriptive statistics while content analysis, pattern matching, and explanation building were used in an ongoing and iterative fashion in the analysis of qualitative data. In parallel with this study qualitative data were also gathered from group and individual discussions, guided by the interview protocol, with a wide range of people in multiple small- to medium- to large-sized Canadian cities. Overall, this work is based on an analysis of data for n = 73 consisting of 41% females and 59% males for people ranging in age from their 20s to 70s. The study was conducted in two iterations between 2015 to 2016 and 2016 to 2018. Based on feedback from participants during iteration one, revisions were made to the survey instrument and interview protocol and, as with iteration one, pre-testing occurred prior to use for iteration two. For iteration one, 75% of those signed up for the study completed the survey, representing 6.25% of those involved in discussions. For iteration two, all those signed up for the study completed the survey, representing 12% of those involved in discussions. While the number of participants in this study is too small, from a statistical perspective, to generalize a universal method of intelligent city analysis, and while one of the limitations of the case study approach is considered to be the small possibility for the generalization of the results, Lee and Baskerville [95] identify the possibility for analytic generalizations of case study findings to theory.
In order to explore the people involvement emotion/affect dimension of smart cities, an early stage adaptation of Anderson’s [96] body insight scale (BIS) is used. Formerly referred to as the body intelligence scale (BIS) [97], three questions from the BIS were slightly adapted for use in this work in an urban context. Where other scales such as that by Teixiera, Dublon, and Savvides [98] place a focus on computer-based human sensing for elements such as presence, count, location, track, and identity, the BIS with the three subscales for energy (E-BAS), comfort (C-BAS), and inner (I-BAS) body awareness may be particularly appropriate for this work because the scale is designed for “assessing subtle human qualities”. Although designed for other domains, Anderson [96] invites broader domain use of the BIS. The following three BIS questions were slightly adapted for incorporation into the survey and interview for this work:
- (1)
- Regarding your inner body awareness in your city, would you agree that you can feel your body tighten up when you are angry?
- (2)
- Regarding your comfort body awareness in your city, would you agree that you feel comfortable in your city most of the time?
- (3)
- Regarding your body awareness in your city, would you agree that your body lets you know when your environment is safe?
An exploration of the BIS was presented in the context of people–aware quantified experiences [4] where researchers expressed an interest in learning more about the reliability of this technique where it was suggested that use of confidence interval calculations would be helpful. As such, calculations for reliability of the BIS are provided here for safety, comfort, and tension in urban environments. Given the small sample size of respondents to this portion of the survey (n < 30), a t value is used in the confidence interval formula, as follows:
For tension associated with anger, it was found that a confidence interval of 95% supports the probability of responses occurring on the scale between 3 and 7. For comfort, it was found that a confidence interval of 90% supports the probability of responses occurring on the scale between 3 and 7. For safety, it was found that a confidence interval of 90% supports the probability of responses occurring on the scale between 2 and 7.
The research question for this work—How and why is the innovating of metrics important for smarter and more responsive cities? —is restated as the main proposition under exploration in this work.
Proposition.
The innovating of metrics is important for smarter and more responsive cities through the development and accommodating of standards, indicators, and measures that are more adaptive, dynamic, and improvisatory in keeping with the highly emergent, evolving, and continuous, interactions and experiences of urban life in increasingly complex and uncertain people-technologies-cities environments and ecosystems.
4.2. Study Results
Study results are presented quantitatively using descriptive statistics and qualitatively through commentary as rich description and insights in relation to the four constructs of awareness, learning, openness, and engagement.
4.2.1. Awareness
Survey responses indicated strongly (e.g., 100%) that, “people generally are not aware of smart cities” and that “education programs in schools and universities are helping to generate smart city awareness” as are media (67%) and city initiatives (67%). Becoming more aware of the nature of public spaces and their actual and potential usage volumes, patterns, and potentials was highlighted in relation to a particular urban square. For example, qualitatively, a fountain in an urban center roundabout was highlighted by an educator because “they could orchestrate it with color and sound” and other elements. The fountain was described as a “touchstone” in that “it brought people out” and “it made an awareness of something in the community” and “it was fun”. The educator also observed that the fountain “made people talk” to each other and “it slowed people down”. Additionally, a community leader pointed to the need for funding to see how a space is used and to explore parking space usage to compare perceived and actual availability.
Awareness was also explored in terms of how people sense the pulse of the city, bringing into play the sensing and affective dimension of urban spaces and measurability challenges in terms of metrics. People emerged as an indicator of the pulse of the city in terms of “the multi layers of senses”; “gatherings” in the form of events, markets, festivals; and “human activity in every corner”. A city councilor spoke of the pulse of the city in terms of vibrancy as in “people interacting with each other and with their environment”. In terms of what smartness looks like in a city, it was described as “nothing visible at all” adding that “on a smart device you can see a lot of wifi availability”. Reference was made to the presence of an “advanced parking system app and other transportation innovations” while adding, “not sure I see much IoT stuff”.
It is worth noting that on a seven-point scale (1=not at all and 7=absolutely), when asked to assess whether city-focused social media and other aware technologies give rise to many possibilities, in the case of “heightening urban sensibilities” responses were equally spread across points 5, 6, and 7 on the scale (33% each). Using Cronbach’s Alpha (in Microsoft Excel) as a measure of internal consistency and scale reliability for this 7-point Likert scale item as well as the three items in Figure 4, a value of 0.90 is achieved across the 4 items. In further probing of urban sensibilities, results are provided for the emotive/affective exploration conducted using an early stage adaptation of Anderson’s [96] BIS. Awareness and assessments for the sensing of anger, comfort, and safety in cities are presented in Figure 4 in response to the three questions identified in Section 4.1. Figure 3 shows percentage response rates by BIS position.
Figure 4 shows that the ability to sense feelings of anger, comfort, or safety emerge as relatively strong, ranging from 2 to 7 on the seven-point scale, depending upon the city and contextual elements in the city. For example, feelings of anger emerge equally across points 4, 5, and 6 on the scale with 33% responses for each. Further probing during interviews indicated that anger responses were associated with issues such as not being able to find a parking space or mobility issues associated with traffic congestion. Using Cronbach’s Alpha for the three items in Figure 4, a value of 0.90 is also achieved.
While comfort emerges as high in some cities with 33% of responses at point 7 on the scale, in other urban areas the level drops substantially to 3 on the scale for 67% of respondents, citing issues related to design and planning factors associated with the placement of benches or how an individual may feel as a visitor to a city. Similarly, some cities may generate a high level of safety as evidenced by 67% of responses at point 7 on the scale while others show a much lower sense of safety with 33% at point 2 on the scale.
4.2.2. Learning
Learning more about the planning, design, and usage of space is highlighted through discussions of the experience of the placement of elements such as a fountain or benches and their interactional effects in urban public areas. In figuring out novel re-uses of historical and iconic infrastructural elements that are being scrapped and replaced with new infrastructure, design thinking was used in one instance as an approach to rapid prototyping and imagining possibilities and solutions involving a cross-sector of engaged individuals from art, architecture, urban planning, city staff and council, placemakers, business, designers, and many others. In speaking about the aggregation of ‘small’ individual data pertaining to say, health conditions, an educator observed that “you know things that you did not know previously” noting “there are huge purposes to the big data versions” of small data and “people’s privacy”. Learning explorations in relation to “geofenced location-based content” was identified by a student in the context of “community interactions” utilizing possibly “social media” and “closed communities as well as open” enabling “access” for “citizen inquiry” and “educational institutions” as in both informal and “formalized education”. Learning is said to figure strongly as continuous in that it becomes “a subsumed part of what you are doing everyday, all the time” as in, “you are all learning all the time, you’re sharing knowledge”. Also highlighted by community-focused educators is the highly “uncertain future” that “needs all of us working on this together”.
4.2.3. Openness
On a seven point scale, 33% of respondents were neutral (at position 4) about the extent to which they associated smart cities with openness, with another 33% near the upper end at six, and 33% at the upper end at seven. Openness is highlighted in relation to the generation of public urban data where city information technology staff indicated that “fundamentally there is a desire to be very, very open” with public data and “make it available to anybody that can make use of it” with “a purpose to utilize that data and maybe it helps improve something”. The example was provided in one sector of the availability of video data for traffic volume that were leveraged as a “predictive piece” in planning daily operations and services. A city councilor described BikeMaps.org as “a great example” whereby “through your phone you are able to track accidents” in order to “find the hub, the place where accidents are happening and with the app, create a map with that information” as “a real life thing” such that “on a phone through an app, that information is being given back to the city so we can now go and create engineering fixes for those intersections and those high crash places”. The councilor described the app as “a place where its all connected and the tool of technology is augmenting the information that we have essentially and allows us to have a safer more vibrant city”. An educator pointed to the complexities associated with the ownership and privacy of data as being “huge” giving rise to the issues of “how” data are being “housed” along with “the infrastructure” by which data are shared. An educator pointed to the value of an urban app designed to “capture data in video, pictures, audio and text” to engage people in “any challenge” faced by a city. The value of openness also emerges through what is described as “unintended usage”. On a five-point scale (no value to low value to neutral to valuable to highly valuable) a minimally viable social media space dedicated to cities was assessed to be valuable (at 4 on the scale) in a variety of ways such as, for “emerging metrics opening new insight spaces”. Referring to the data “that people are making in social media” a student questioned whether “this data can be searched and re-made and re-presented” contributing to “notions of smart delivery”. Smart delivery is described as data provided in meaningful ways responding to “queries” in order “to give people what they are looking for and where they need to plug in and the right community to be speaking with” calling for “rethinking the traditional norms that we have around data” to “shift and alter those a bit when we’re talking about digital data”.
4.2.4. Engagement
When asked what cities need to do to become smarter, 100% of respondents agreed with the option to “make engagement smarter” as in “break down the silos and collaborate more”. Urban engagement is evident on a project-by-project basis through an ongoing variety of initiatives by groups such as the local placemaking network and at the city level through strategic plans. In the case of a placemaking network, one or more blocks of a particular street may be closed on a Saturday or Sunday creating an experimental, improvisational, and performative space for pedestrians as a community intervention to see how aspects of this urban area could be improved. On a city-wide level, the potential for engagement is articulated through the example of an eTownHall meeting featuring the notion of “documented engagement” with data generated live through social media and other tools with the potential to be acted upon. While highly engaged in community on many levels, an individual expressed shock at “how quickly this concept of self-driving cars has come about” and “the issue of drones” expressing a desire “to be part of the conversation”. A student noted that “as we work out how to sort out the data that is constantly being made, built, we will know more what to do with it” while an educator commented on the concept and the idea of smart cities as being “both theoretical and practical”.
5. Discussion
This section provides a discussion of study findings in relation to how the constructs of awareness, learning, openness, and engagement are employed in this work to contribute to the potential for innovating metrics for urban environments. This interpretation of results is then followed by a discussion of the implications and limitations of this work.
5.1. Interpretation of Results
The interpretation of results provided here is presented from the perspective of the innovation framework for emergent and evolving ambient metrics developed in this work for innovating metrics for smarter, more responsive cities described in Figure 3, through an analysis of the urban-level explorations conducted in this work, and the working proposition of this paper, in response to the research question, focusing on: the development and accommodating of standards, indicators, and measures that are more adaptive, dynamic, and improvisatory in keeping with the highly emergent, evolving, continuous, interactions and experiences of urban life in increasingly complex and uncertain people-technologies-cities environments and ecosystems.
- (a)
- Evolution of Theory for Urban Metrics. The invisible dimension of smart cities is articulated in a variety of ways in terms of the availability of wifi and other technological developments with data elements such as a bike app with citizen input that informs city staff influencing responsiveness and eTownHall meetings incorporating live video and social media in support of documented engagement. The role of education programs as one of several mechanisms for generating and improving awareness about smart cities points to the importance of learning opportunities and intersections for learning and awareness. The observation by a community member and educator that the smart cities idea and concept has both theoretical and practical value is perhaps an affirmation of the importance of urban theory generally, and of the evolving of urban theory to accommodate emergent understandings of smart city thinking and practice.
- (b)
- Explorations of Big and Small Data Approaches for Understanding Emergent Urban Metrics. The data implications of experiences of urban elements such as a fountain or benches in public spaces and their interactional effects gives rise to the potential for enriched data generation and use for urban planning and design. Uncertainty associated with the future generally gives rise to a rethinking of learning and education programs for contemporary and everyday urban environments. As such, the need for greater adaptability and responsiveness, in the moment, calls for more dynamic forms of awareness, learning, openness, and engagement. Further, potential for data analytics emerges in relation to the opportunities for figuring out “how to sort out the data that is constantly being made, built” so that “we will know more what to do with it”. This potential highlights the value and opportunity of the variable identified by Joshi and When [14] of “citizen discussion via social media”. This variable may also be an important mechanism for Coletta and Kitchin’s [81] notion of algorithms and actors (algorhythmic) and keeping people in the loop as well as an important mechanism for navigating new potential for innovating urban metrics. Regarding openness, this concept is associated with smart cities to varying degrees, depending upon the city, although some neutrality in response occurred. Recognizing the value of public data, city IT staff expressed a high degree of openness in terms of sharing this data in support of urban improvements and unintended usage. The augmentative value of technology was acknowledged by a city councilor in terms of the generation and sharing of information from a bike share app that can be translated into data to assist city staff in responding to needs for fixes on the one hand and the enhancing of safety on the other.
- (c)
- People Dimension of Smart Cities. “Documented engagement” enabled by social media and other ICTs was said to contribute to the potential for more immediate awareness and action in support of experimental, improvisational, and performative spaces. While documented engagement emerges in the engagement section of the results for this work, this element encompasses potentially all four constructs in that the mechanisms and mindsets fostering such engagement serve to support awareness, learning, and openness. Also of note is the finding in Section 4.2.1 that feelings of anger, comfort, and safety in the city are dependent upon the particular city and urban contextual elements pointing to the variability of manifestations and understandings of smart cities.
- (d)
- BIS for Application in Urban Environments. In the context of explorations of awareness conducted in this work using Anderson’s BIS, it is worth noting that Fakhrhosseini and Jeon [99] describe the role of emotion in relation to people interacting with technologies in terms of a variety of “methods for inducing temporary mood states” and imagination is described as “one of the simplest emotion induction techniques” [99] involving mood related “situations and memories”. This is of note because imagination is invoked in this work through inviting people to think about their experiences of smart cities and the emotion of anger is explored in this work in relation to urban environments that are being increasingly embedded with aware technologies. Furthermore, building on the work of Gross and Levenson [100], Fakhrhosseini and Jeon [99] include “neutral” as one of eight emotional states and this work includes “neutral” as position 4 on the 7-point scale for the adapted BIS exploration in this study which emerged as a data point in response to anger in urban contexts and to perceptions of openness and smart cities. It is perhaps important to note that although explored already by McKenna [4] in the context of augmenting the quantified experience and in terms of sensing, sensors, and the IoT and public sector implementation challenges [101], BIS explorations in this work extend to, and focus upon, the potential for the innovation of urban metrics more generally and considerations of reliability of the scale for urban environments through use of confidence interval and Cronbach’s Alpha calculations.
In summary, the innovation of metrics is evidenced in this work in relation to the four constructs of awareness, learning, openness, and engagement, either individually or in two or more combinations. This work surfaces a number of proposed variables for consideration associated with people involving awareness, learning, openness, and engagement at the street (practical) and theoretical levels that are intended to serve as an important beginning for innovating and extending urban metrics, as depicted in Figure 5. Variables associated with awareness include: experience of urban elements in public spaces; nature of public space usage; pulse of the city; and heightening urban sensibilities. Variables associated with learning include: experience of urban element placements and interactional effects in public spaces; novel re-uses of historical and iconic urban infrastructural elements; aggregation of small data for purposeful individual uses; and continuous learning through everyday interactions. Variables associated with openness include: openness and the generation and use of public urban data; availability of public data in support of urban improvements; value of urban apps for data sharing about/in response to city challenges; and unintended usage contributing to emerging metrics opening new insight spaces.
Variables associated with engagement include: experimental, improvisational, and performative spaces as community interventions; documented engagement for awareness and action; smart cities as theoretical spaces for engagement; and smart cities as practical spaces for engagement.
Through the constructs of awareness, learning, openness, and engagement, insight is also provided into urban sensibilities, sensing the pulse of the city, and how emotive/affective experiences may be approached. In particular, the exploration in this work using the BIS and subscales for outer body awareness, comfort body awareness, and inner body awareness as measures contributing to emerging metrics for smart cities has the potential for influencing and enriching interpretations of big and small data understandings, approaches, methodologies, and theory.
5.2. Implications and Limitations
Key findings in this work pertaining to variables for innovating urban metrics and their implications are discussed in the context of big and small data and smart cities. While the small sample size of this work does not enable the development of statistical significance or generalizability, analytic generalizations of case study findings to theory are possible [95]. As such, empirical to theoretical generalizability [95] has the potential to support other explorations of awareness and assessments for sensing in smart cities as well as the variables for consideration in the innovation and expansion of urban metrics (Figure 5) related to people and their personal data. Limitations of this work associated with small sample size are mitigated by the broad and wide-ranging nature of interest in smart cities and associated challenges. The small sample size is also mitigated by the need to focus on the why and how of data analysis and results, highlighting the qualitative elements for more and richer information to complement and shed light on big data gaps and challenges. Limitations associated with the early-stage exploration of Anderson’s [96] body insight scale (BIS) for adaptation to smart city environments is mitigated by the degree of reliability identified in Section 4.1 through use of confidence interval calculations for the technique in relation to comfort, safety, and tension. As such, potential exists to further test, extend, and validate this scale in a variety of ways in the innovation of urban metrics related to people. Variables presented in relation to the constructs of awareness, learning, openness, and engagement in this work for consideration in the innovating of urban metrics are emergent and evolving, requiring testing and validation going forward.
5.3. Future Research and Practice Directions
Regarding future research and practice directions, this work points to the opportunity for further exploration, testing, and validation of Anderson’s BIS for use in contributing to the development and evolving of smart city metrics and to the innovating of urban metrics more generally. Opportunity also emerges for further exploration of the meaning and importance of neutrality as an emotion/affective response [99] in relation to big data and urban metrics in smart cities. Finally, this work opens a discourse space for theoretical and practical explorations of the ambient metrics concept and the potential for testing and validation of the variables for consideration in innovating urban metrics identified in this work (Figure 5) associated with awareness, learning, openness, and engagement.
6. Conclusions
This work explores the challenges posed by big (and small) data in relation to smart cities and the opportunities and implications for urban metrics. In response to the need for theory [31] and methodologies for innovating metrics for data in smart cities in relation to algorithms and synthetic indicators [1], [20] in support of meaningfulness [5], [80], the involvement of people [80], and the unmeasurable [77], this work advances a framework for innovating metrics for smarter people in smart, responsive cities. Several contributions emerge from this work in that an innovation framework for emergent and evolving ambient metrics is developed and operationalized; an early stage adaptation of Anderson’s body insight scale (BIS) for application in relation to metrics in smart city environments for tension, comfort, and safety is explored along with acceptable confidence interval based estimations of reliability for the scale and the use of Cronbach’s Alpha to measure internal consistency and scale reliability for items; and a series of variables for awareness, learning, openness, and engagement are surfaced for consideration in the innovating and extending of urban metrics.
Managerial implications for this work pertain to and build upon the framework for data use in smart cities by Lim et al. [27] contributing to a greater appreciation for data quality, understanding the needs of people, and designing smarter services. The idea of innovating metrics for smarter, more responsive services advanced in this work has managerial implications in terms of policy [2,23], providing openings for becoming involved, as one of many stakeholders, in setting new directions and practices for urban data. The theoretical implications for this work open new areas and combinations of areas for debate, particularly in relation to the notion by Thakuriah et al. [20] of “understanding metrics” in order to make sense of the “urban” and providing more insight into data processes articulated by Pink et al. [30] through the series of variables that are surfaced in Section 5.1. These variables offer the potential for novel avenues and spaces for the innovation of metrics on the one hand and for involving people more meaningful in big and small data challenges and opportunities on the other hand. On a practical level, the surfacing of variables in support of innovating metrics for smarter cities can be employed and further tested using the innovation framework for emergent and evolving ambient metrics. As such, this work accommodates the nature of data processes, described for example by Pink et al., as “relational, ongoingly changing, and emergent” [30], advancing an innovating of metrics as more aware, adaptive, and dynamic, as in, ambient.
While this work introduces various research and practice opportunities associated with people and their environmental data that may in future be analyzed by the Internet of Things (IoT), limitations are acknowledged in relation to the small sample size achieved in the underlying study, opening the way for further, larger-scale studies. Use of the BIS explored for early-stage application in urban environments in this work employed only a small sub-set of questions from Anderson’s [96] instrument, opening the way for further refining existing questions along with the consideration of additional questions from the scale.
Funding
This research received no external funding.
Conflicts of Interest
The author declares no conflict of interest.
References
- Al-Nasrawi, S.; Adams, C.; El-Zaart, A. A conceptual multidimensional model for assessing smart sustainable cities. J. Inf. Syst. Technol. Manag. 2015, 12, 541–558. [Google Scholar]
- Caprotti, F.; Cowley, R.; Datta, A.; Brot, V.C.; Gao, E.; Georgeson, L.; Herrick, C.; Odeandaal, N.; Joss, S. The new urban agenda: Key opportunities and challenges for policy and practice. Urban Res. Pract. 2017, 10, 367–378. [Google Scholar] [CrossRef]
- Ames, M.G. Deconstructing the algorithmic sublime. Big Data Soc. 2018, 1–4. [Google Scholar] [CrossRef]
- McKenna, H.P. Exploring the quantified experience: Finding spaces for people and their voices in smarter, more responsive cities. In Proceedings of the Future Technologies Conference 2018, AISC 880, Vancouver, BC, Canada, 13–14 November 2018; Arai, K., Bhatia, R., Kapoor, S., Eds.; Springer Nature: Basel, Switzerland, 2019; pp. 269–282. [Google Scholar]
- Bell, S.; Banetti, F.; Edwards, N.R.; Laney, R.; Morse, D.R.; Picollo, L.; Zanetti, O. Smart cities and M3: Rapid research, meaningful metrics and co-design. Syst. Pract. Action Res. 2018, 31, 27–53. [Google Scholar] [CrossRef]
- Alexander, C.; Neis, H.; Anninou, A.; King, I. A New Theory of Urban Design; Oxford University Press: New York, NY, USA, 1987. [Google Scholar]
- Batty, M. Cities and Complexity; MIT Press: Cambridge, MA, USA, 2005. [Google Scholar]
- Hélie, M. Conceptualizing the principles of emergent urbanism. ArchNet-IJAR Int. J. Archit. Res. 2009, 3, 75–91. [Google Scholar]
- Batty, M. Big data, smart cities and city planning. Dialogues Hum. Geogr. 2013, 3, 274–279. [Google Scholar] [CrossRef] [PubMed]
- Estrin, D. Small data, where n = me. Viewpoint Column. Commun. ACM 2014, 57, 32–34. [Google Scholar] [CrossRef]
- Chauhan, S.; Agarwal, N.; Kar, A.K. Addressing big data challenges in smart cities: A systematic literature review. Info 2016, 18, 73–90. [Google Scholar] [CrossRef]
- Jara, A.J.; Bocchi, Y.; Genoud, D. Determining human dynamics through the Internet of Things. In Proceedings of the International Joint Conferences on Web Intelligence (WI) and Intelligent Agent Technologies (IAT), Atlanta, GA, USA, 17–20 November 2013; IEEE: New York, NY, USA, 2013; Volume 3, pp. 109–113. [Google Scholar]
- Lepri, B.; Antonelli, F.; Pianesi, F.; Pentland, A. Making big data work: Smart, sustainable, and safe cities. EPJ Data Sci. 2015, 4, 16. [Google Scholar] [CrossRef]
- Joshi, S.; When, U. From assumptions to artifacts: Unfolding e-participation within multi-level governance. Electron. J. E-Gov. 2017, 15, 116–129. [Google Scholar]
- Al Nuaimi, E.; Al Neyadi, H.; Mohamed, N.; Al-Jaroodi, J. Applications of big data to smart cities. J. Internet Serv. Appl. 2015, 6, 25. [Google Scholar] [CrossRef]
- Han, G.; Guizani, M.; Lloret, J.; Chan, S.; Wan, L.; Guibene, W. Emerging trends, issues, and challenges in big data and its implementation toward future cities. IEEE Commun. Mag. 2017, 55, 16–17. [Google Scholar] [CrossRef]
- Han, G.; Guizani, M.; Lloret, J.; Chan, S.; Wan, L.; Guibene, W. Emerging trends, issues, and challenges in big data and its implementation toward future cities: Part 2. IEEE Commun. Mag. 2018, 56, 76–77. [Google Scholar] [CrossRef]
- Han, G.; Guizani, M.; Lloret, J.; Chan, S.; Wan, L.; Guibene, W. Emerging trends, issues, and challenges in big data and its implementation toward future cities: Part 3. IEEE Commun. Mag. 2018, 56, 126–127. [Google Scholar] [CrossRef]
- Osman, A.M.S. A novel big data analytics framework for smart cities. Future Gener. Comput. Syst. 2018, 91, 620–633. [Google Scholar] [CrossRef]
- Thakuriah, P.; Tilahun, N.Y.; Zellner, M. Big data and urban informatics: Innovations and challenges to urban planning and knowledge discovery. In Seeing Cities through Big Data; Thakuriah, P., Tilahun, N., Zellner, M., Eds.; Springer Geography: Cham, Switzerland, 2017. [Google Scholar]
- Beckman, R.; Baggerly, K.A.; McKay, M.D. Creating synthetic baseline populations. Transp. Res. A Policy Pract. 1996, 30, 415–429. [Google Scholar] [CrossRef]
- Harland, K.; Heppenstall, A.; Smith, D.; Birkin, M. Creating realistic synthetic populations at varying spatial scales: A comparative critique of population synthesis techniques. J. Artif. Soc. Soc. Simul. 2012, 15, 1. Available online: http://jasss.soc.surrey.ac.uk/15/1/1.html (accessed on 4 January 2019).
- Zook, M. Crowd-sourcing the smart city: Using big geosocial media metrics in urban governance. Big Data Soc. 2017, 4, 1–13. [Google Scholar] [CrossRef]
- Smith, A. Smart Cities Need Thick Data, Not Big Data. The Guardian. 2018. Available online: https://www.theguardian.com/science/political-science/2018/apr/18/smart-cities-need-thick-data-not-big-data (accessed on 3 August 2018).
- Geertz, C. The Interpretation of Cultures; Basic Books: New York, NY, USA, 1973. [Google Scholar]
- Smith, R.J. Missed miracles and mystical connections: Qualitative research and digital social sciences and big data. In Big Data?: Qualitative Approaches to Digital Research; Hand, M., Hillyard, S., Eds.; Edward Group: Bingley, UK, 2014; pp. 181–204. [Google Scholar]
- Lim, C.; Kim, K.-J.; Maglio, P.P. Smart cities with big data: Reference models, challenges, and considerations. Cities 2018. [Google Scholar] [CrossRef]
- Dourish, P.; Cruz, E.G. Datafication and data fiction: Narrating data and narrating with data. Big Data Soc. 2018. [Google Scholar] [CrossRef]
- Bornakke, T.; Due, B.L. Big-thick blending: A method for mixing analytical insights from big and thick data sources. Big Data Soc. 2018. [Google Scholar] [CrossRef]
- Pink, S.; Ruckenstein, M.; Willim, R.; Dugue, M. Broken data: Conceptualising data in an emerging world. Big Data Soc. 2018. [Google Scholar] [CrossRef]
- Wise, A.F.; Shaffer, D.W. Why theory matters more than ever in the age of big data. J. Learn. Anal. 2015, 2, 5–13. [Google Scholar] [CrossRef]
- Zygiaris, S. Smart city reference model: Assisting planners to conceptualize the building of smart city innovation ecosystems. J. Knowl. Econ. 2013, 4, 217–231. [Google Scholar] [CrossRef]
- DeRen, L.; JianJun, C.; Yuan, Y. Big data in smart cities. Sci. China Inf. Sci. 2015, 58, 1–12. [Google Scholar] [CrossRef]
- Albino, V.; Berardi, U.; Dangelico, R.M. Smart cities: Definitions, dimensions, performance, and initiatives. J. Urban Technol. 2015. [Google Scholar] [CrossRef]
- Aylett, A. Green Cities and Smart Cities: The Potential and Pitfalls of Digitally-Enabled Urbanism (Crosspost). Geothink. 2015. Available online: http://geothink.ca/crosspost-green-cities-and-smart-cities-the-potential-and-pitfalls-of-digitally-enabled-green-urbanism/ (accessed on 4 January 2019).
- UTL. Urban Theory Lab: About; Urban Theory Lab, Harvard Graduate School of Design: Boston, MA, USA. Available online: http://www.urbantheorylab.net/about/ (accessed on 4 January 2019).
- Karvonen, A.; Cugurullo, F.; Caprotti, F. (Eds.) Inside Smart Cities: Place, Politics and Urban Innovation; Routledge: New York, NY, USA, 2019. [Google Scholar]
- Coletta, C.; Evans, L.; Heaphy, L.; Kitchin, R. (Eds.) Creating Smart Cities; Routledge: New York, NY, USA, 2019. [Google Scholar]
- Yigitcanlar, T.; Kamruzzaman, M.; Foth, M.; Sabatini, J.; da Costa, E.; Ioppolo, G. Can cities become smart without being sustainable? A systematic review of the literature. Sustain. Cities Soc. 2018, 45, 348–365. [Google Scholar] [CrossRef]
- Cugurullo, F. Exposing smart cities and eco-cities: Frankenstein urbanism and the sustainability challenges of the experimental city. Environ. Plan. A Econ. Space 2018, 50, 73–92. [Google Scholar] [CrossRef]
- Laurini, R. Towards smart urban planning through knowledge infrastructure. In Proceedings of the GEOProcessing 2017: The Ninth International Conference on Advanced Geographic Information Systems, Applications, and Services, IARIA, Nice, France, 19–23 March 2017; pp. 75–80. [Google Scholar]
- Mollá-Sirvent, R.A.; Mora, H.; Gilart-Iglesias, V.; Pérez-delHoyo, R.; Andújar-Montoya, M.D. Accessibility index for smart cities. Proceedings 2018, 2, 1219. [Google Scholar] [CrossRef]
- IFTF. Human + Machine Futures; Institute for the Future: Palo Alto, CA, USA, 2015; Available online: http://www.iftf.org/our-work/people-technology/technology-horizons/human-machine-futures/ (accessed on 4 January 2019).
- Dotti, G. How to Measure the Quality of Life in Smart Cities? Technol. Energy Green Tech. Available online: https://phys.org/news/2016-04-quality-life-smart-cities.html (accessed on 26 June 2018).
- Ang, L.-M.; Seng, K.P.; Zungeru, A.M.; Ijemaru, G.K. Big sensor data systems for smart cities. IEEE Internet Things J. 2017, 4, 1259–1271. [Google Scholar] [CrossRef]
- Joss, S. Future cities: Asserting public governance. Palgrave Commun. 2018, 4, 36. [Google Scholar] [CrossRef]
- Mattern, S. Databodies in codespace. Places J. 2018. [Google Scholar] [CrossRef]
- Komninos, N.; Mora, L. Exploring the big picture of smart city research. Scienze Regionali 2018, 17, 15–38. [Google Scholar]
- Schaffers, H. The future of smart cities: Open issues and research challenges. Sci. Reg. 2018, 17, 123–128. [Google Scholar]
- WCCD. Created by Cities for Cities. World Council on City Data. 2018. Available online: http://www.dataforcities.org/wccd/ (accessed on 4 January 2019).
- ISO. ISO 37120: 2018(en). In Sustainable Cites and Communities—Indicators for City Services and Quality of Life; International Standards Organization: Geneva, Switzerland, 2018; Available online: https://www.iso.org/obp/ui/#iso:std:iso:37120:ed-2:v1:en (accessed on 4 January 2019).
- Cohen, B. The Smartest Cities in the World 2015: Methodology. FastCompany. 2014. Available online: https://www.fastcompany.com/3038818/the-smartest-cities-in-the-world-2015-methodology (accessed on 22 August 2018).
- Lévy, J. Inhabiting. In The Sage Handbook of Human Geography, Part I; Lee, R., Castree, N., Kitchin, R., Lawson, V., Paasi, A., Philo, C., Radcliffe, S., Roberts, S.M., Withers, C.W.J., Eds.; Sage: Thousand Oaks, CA, USA, 2014; pp. 45–68. [Google Scholar]
- Marsal-Llacuna, M.L. Measuring the standardized definition of “smart city”: A proposal on global metrics to set the terms of reference for urban “smartness”. In Computational Science and Its Applications—ICCSA 2015; Gervasi, O., Beniamino Murgante, B., Misra, S., Gavrilova, M.L., Coutinho Rocha, A.M.A., Torre, C., Taniar, D., Apduhan, B.O., Eds.; Lecture Notes in Computer Science (vol 9156); Springer: Cham, Switzerland, 2015. [Google Scholar]
- Parmiggiani, E.; Monteiro, E.; Østerlie, T. Synthetic situations in the Internet of Things. In Beyond Interpretivism? New Encounters with Technology and Organization; Introna, L., Kavanagh, D., Kelly, S., Orlikowski, W., Scott, S., Eds.; Springer: Cham, Switzerland, 2016; Volume 489, pp. 215–228. [Google Scholar]
- Knorr Cetina, K. The synthetic situation: Interactionism for a global world. Symb. Interact. 2009, 32, 61–87. [Google Scholar] [CrossRef]
- Lycett, M. “Datification”: Making sense of (big) data in a complex world. Eur. J. Inf. Syst. 2013, 22, 381–386. [Google Scholar] [CrossRef]
- Zarsky, T. The trouble with algorithmic decisions: An analytic road map to examine efficiency and fairness in automated and opaque decision making. Sci. Technol. Hum. Values 2016, 41, 118–132. [Google Scholar] [CrossRef]
- Mittelstadt, B.D.; Allo, P.; Taddeo, M.; Wachter, S.; Floridi, L. The ethics of algorithms: Mapping the debate. Big Data Soc. 2016. [Google Scholar] [CrossRef]
- Tosi, D. Cell phone big data to compute mobility scenarios for future smart cities. Int. J. Data Sci. Anal. 2017, 4, 265–284. [Google Scholar] [CrossRef]
- Falcon, R.; Hamamoto, B. Bodies of Data: Who Are We through the Eyes of Algorithms; Future Now. Institute For The Future (IFTF): Palo Alto, CA, USA, 2017. [Google Scholar]
- Siprikova, A. Tracking Placemaking in Public Spaces. Mapillary Blog. 2018. Available online: https://blog.mapillary.com/update/2018/01/17/tracking-placemaking-in-public-spaces.html (accessed on 4 January 2019).
- Caird, S.; Hudson, L.; Kortuem, G. A Tale of Evaluation and Reporting in UK Smart Cities; The Open University: Milton Keyes, UK, 2016; Available online: oro.open.ac.uk/46008/7/__userdata_documents4_ctb44_Desktop_Tales_Smart_Cities_Final_2016.pdf (accessed on 20 May 2018).
- CITYkeys. Smart City Index; VTT, Technical Research Centre of Finland: Espoo, Finland, 2015; Eurocities; Available online: http://www.citykeys-project.eu/citykeys/cities_and_regions/Smart-city-index (accessed on 4 January 2019).
- Bosch, P.; Jongeneel, S.; Rovers, V.; Neumann, H.-M.; Airaksinen, M.; Huovila, A. CITYkeys Indicators for Smart City Projects and Smart Cities. European Commission and H2020 Programme. 2017. Available online: nws.eurocities.eu/MediaShell/media/CITYkeysD14Indicatorsforsmartcityprojectsandsmartcities.pdf (accessed on 1 May 2018).
- Van Rooijen, T.; Nesterova, N. Applied Framework for Evaluation in CIVITAS Plus II; European Union: CIVITAS—Cleaner and Better Transport in Cities—WIKI: Brussels, Belgium, 2013. [Google Scholar]
- IESE. Cities in Motion Index (ST-442-E); IESE Business School, University of Navarra: Barcelona, Spain, 2017; Available online: https://www.mos.ru/upload/documents/files/9743/IESECitiesinMotionIndexIESECitiesinMotionIndex.pdf (accessed on 22 May 2018).
- Al-Nasrawi, S.; Adams, C.; El-Zaart, A. The anatomy of smartness of smart sustainable cities: An inclusive approach. In Proceedings of the 2017 International Conference on Computer and Applications, Doha, UAE, 6–7 September 2017; IEEE: New York, NY, USA, 2017; pp. 348–353. [Google Scholar]
- Caird, S.P.; Hallett, S.H. Towards evaluation design for smart city development. J. Urban Des. 2018. [Google Scholar] [CrossRef]
- BSI. Smart City Standards and Publications; British Standards Institution: London, UK, 2019; Available online: https://www.bsigroup.com/en-GB/smart-cities/Smart-Cities-Standards-and-Publication/ (accessed on 4 January 2019).
- CITYkeys. CITYkeys Project; VTT, Technical Research Centre of Finland: Espoo, Finland, 2015; Eurocities; Available online: citykeys-project.eu (accessed on 4 January 2019).
- EC. Civitas: Cleaner and Better Transport in Cities; European Commission: Brussels, Belgium, 2013; Available online: https://civitas.eu (accessed on 4 January 2019).
- EIU. The Global Livability Index; The Economist Intelligence Unit: London, UK, 2018; Available online: http://www.eiu.com/topic/liveability (accessed on 4 January 2019).
- ISO. ISO 73120:2018 Sustainable Cities and Communities—Indicators for City Services and Quality Of Life; International Organization for Standardization: Geneva, Switzerland, 2018; Available online: https://www.iso.org/standard/68498.html (accessed on 4 January 2019).
- Mercer. Quality of Living City Ranking; Mercer: New York, NY, USA, 2018; Available online: https://mobilityexchange.mercer.com/Insights/quality-of-living-rankings (accessed on 4 January 2019).
- Monocle. Quality of Life Survey: Top 25 Cities, 2018; Monocle: London, UK, 2018; Available online: https://monocle.com/film/affairs/quality-of-life-survey-top-25-cities-2018/ (accessed on 4 January 2019).
- Patel, A. Wonder as an interruption. Conscious Cities. 2017. In Journal no. 4. Uncategorized. Available online: https://www.ccities.org/wonder-as-an-interruption/ (accessed on 23 April 2018).
- Marsal-Llacuna, M.L. Building universal socio-cultural indicators for standardizing the safeguarding of citizens’ rights in smart cities. Soc. Indic. Res. 2017, 130, 563–579. [Google Scholar] [CrossRef]
- Hunter, J. IoT ‘Conversation’ and Ambient Contextuality. TechCrunch. 2018. Available online: https://techcrunch.com/2018/04/24/tell-me-something-good-iot-conversation-and-ambient-contextuality/ (accessed on 23 May 2018).
- Baumer, E.P.S. Toward human-centered algorithm design. Big Data Soc. 2017, 4, 1–12. [Google Scholar] [CrossRef]
- Coletta, C.; Kitchin, R. Algorhythmic governance: Regulating the ‘heartbeat’ of a city using the Internet of Things. Big Data Soc. 2017. [Google Scholar] [CrossRef]
- Gray, J.; Gerlitz, C.; Bounegru, L. Data infrastructure literacy. Big Data Soc. 2018, 1–13. [Google Scholar] [CrossRef]
- Dourish, P. Algorithms and their others: Algorithmic culture in context. Big Data Soc. 2016. [Google Scholar] [CrossRef]
- Sassen, S. Does the city have speech? Public Cult. 2013, 25, 209–221. [Google Scholar] [CrossRef]
- Dourish, P.; Bell, G. Divining our Digital Future: Mess and Mythology in Ubiquitous Computing; MIT Press: Cambridge, MA, USA, 2011. [Google Scholar]
- Bell, G. The secret life of big data. In Data, Now Bigger and Better! Boellstorf, T., Maurer, B., Eds.; Prickly Paradigm Press: Chicago, IL, USA, 2015; pp. 7–26. [Google Scholar]
- Leorke, D.; Wyatt, D.; McQuire, S. More than just a library: Public libraries in the ‘smart city’. City Cult. Soc. 2018. [Google Scholar] [CrossRef]
- Bonduel, L. Smart City Development: The Milan Model. The Urban Media Lab. 2018. Available online: http://labgov.city/thecommonspost/smart-city-development-the-milan-mode/ (accessed on 28 December 2018).
- Smart Prague. About Smart Prague; Smart Prague: Prague, Czech, 2017. [Google Scholar]
- Fraunhofer-Gesellschaft. What Is behind Morgenstadt? Morgenstadt—City of the Future: Stuttgart, Germany, 2018. [Google Scholar]
- EY. The Power of Three for Smarter, More Resilient Cities: Government and Public Sector Insights; EYGM Limited: UK, 2016; Available online: https://www.ey.com/Publication/vwLUAssets/EY-the-power-of-three-for-smarter-more-resilient-cities/$FILE/EY-the-power-of-three-for-smarter-more-resilient-cities.pdf (accessed on 28 December 2018).
- UCSD. Smart Cities: Urban Innovation & Design Thinking; UC San Diego Design Lab: San Diego, CA, USA, 2018. [Google Scholar]
- Yin, R. Case Study Research and Applications: Design and Methods; Sage: Thousand Oaks, CA, USA, 2018. [Google Scholar]
- Trochim, W.M.K. Research Methods Knowledge Base. Available online: http://www.socialresearchmethods.net/kb (accessed on 15 December 2011).
- Lee, A.; Baskerville, R. Generalizing generalizability in information systems research. Inf. Syst. Res. 2003, 14, 221–243. [Google Scholar] [CrossRef]
- Anderson, R. Body intelligence scale: Defining and measuring the intelligence of the body. Humanist Psychol. 2006, 34, 357–367. [Google Scholar] [CrossRef]
- Anderson, A. Body Insight Scale; Mind garden: Tools for positive transformation: Menlo Park, CA, USA, 2011. [Google Scholar]
- Teixiera, T.; Dublon, G.; Savvides, A. A Survey of Human-Sensing: Methods for Detecting Presence, Count, Location, Track, and Identity; ENALAB Technical Report 09-2010; Yale University: New Haven, CT, USA, 2010. [Google Scholar]
- Fakhrhosseini, S.M.; Jeon, M. Affect/emotion induction methods. In Emotions and Affect in Human Factors and Human-Computer Interaction; Elsevier: Amsterdam, The Netherlands, 2017; pp. 235–253. [Google Scholar] [CrossRef]
- Gross, J.J.; Levenson, R.W. Emotion elicitation using films. Cogn. Emot. 1995, 9, 87–108. [Google Scholar] [CrossRef]
- McKenna, H.P. Awareness and smart cities implementation: Sensing, sensors, and the IoT in the public sector. In Beyond Smart and Connected Governments: Sensors and the Internet of Things in the Public Sector; Gil-Garcia, J.R., Pardo, T.A., Gascó, M., Eds.; Springer: New York, NY, USA, 2019. [Google Scholar]
Figure 1.
Overview of challenges for data, metrics, and smart cities.

Figure 2.
Overview of theory and methodologies for innovating metrics for data and smart cities.

Figure 3.
Innovation framework for emergent and evolving ambient metrics.

Figure 4.
Awareness and assessments for the sensing of anger, comfort, and safety in cities.

Figure 5.
Variables for consideration in innovating and extending urban metrics.


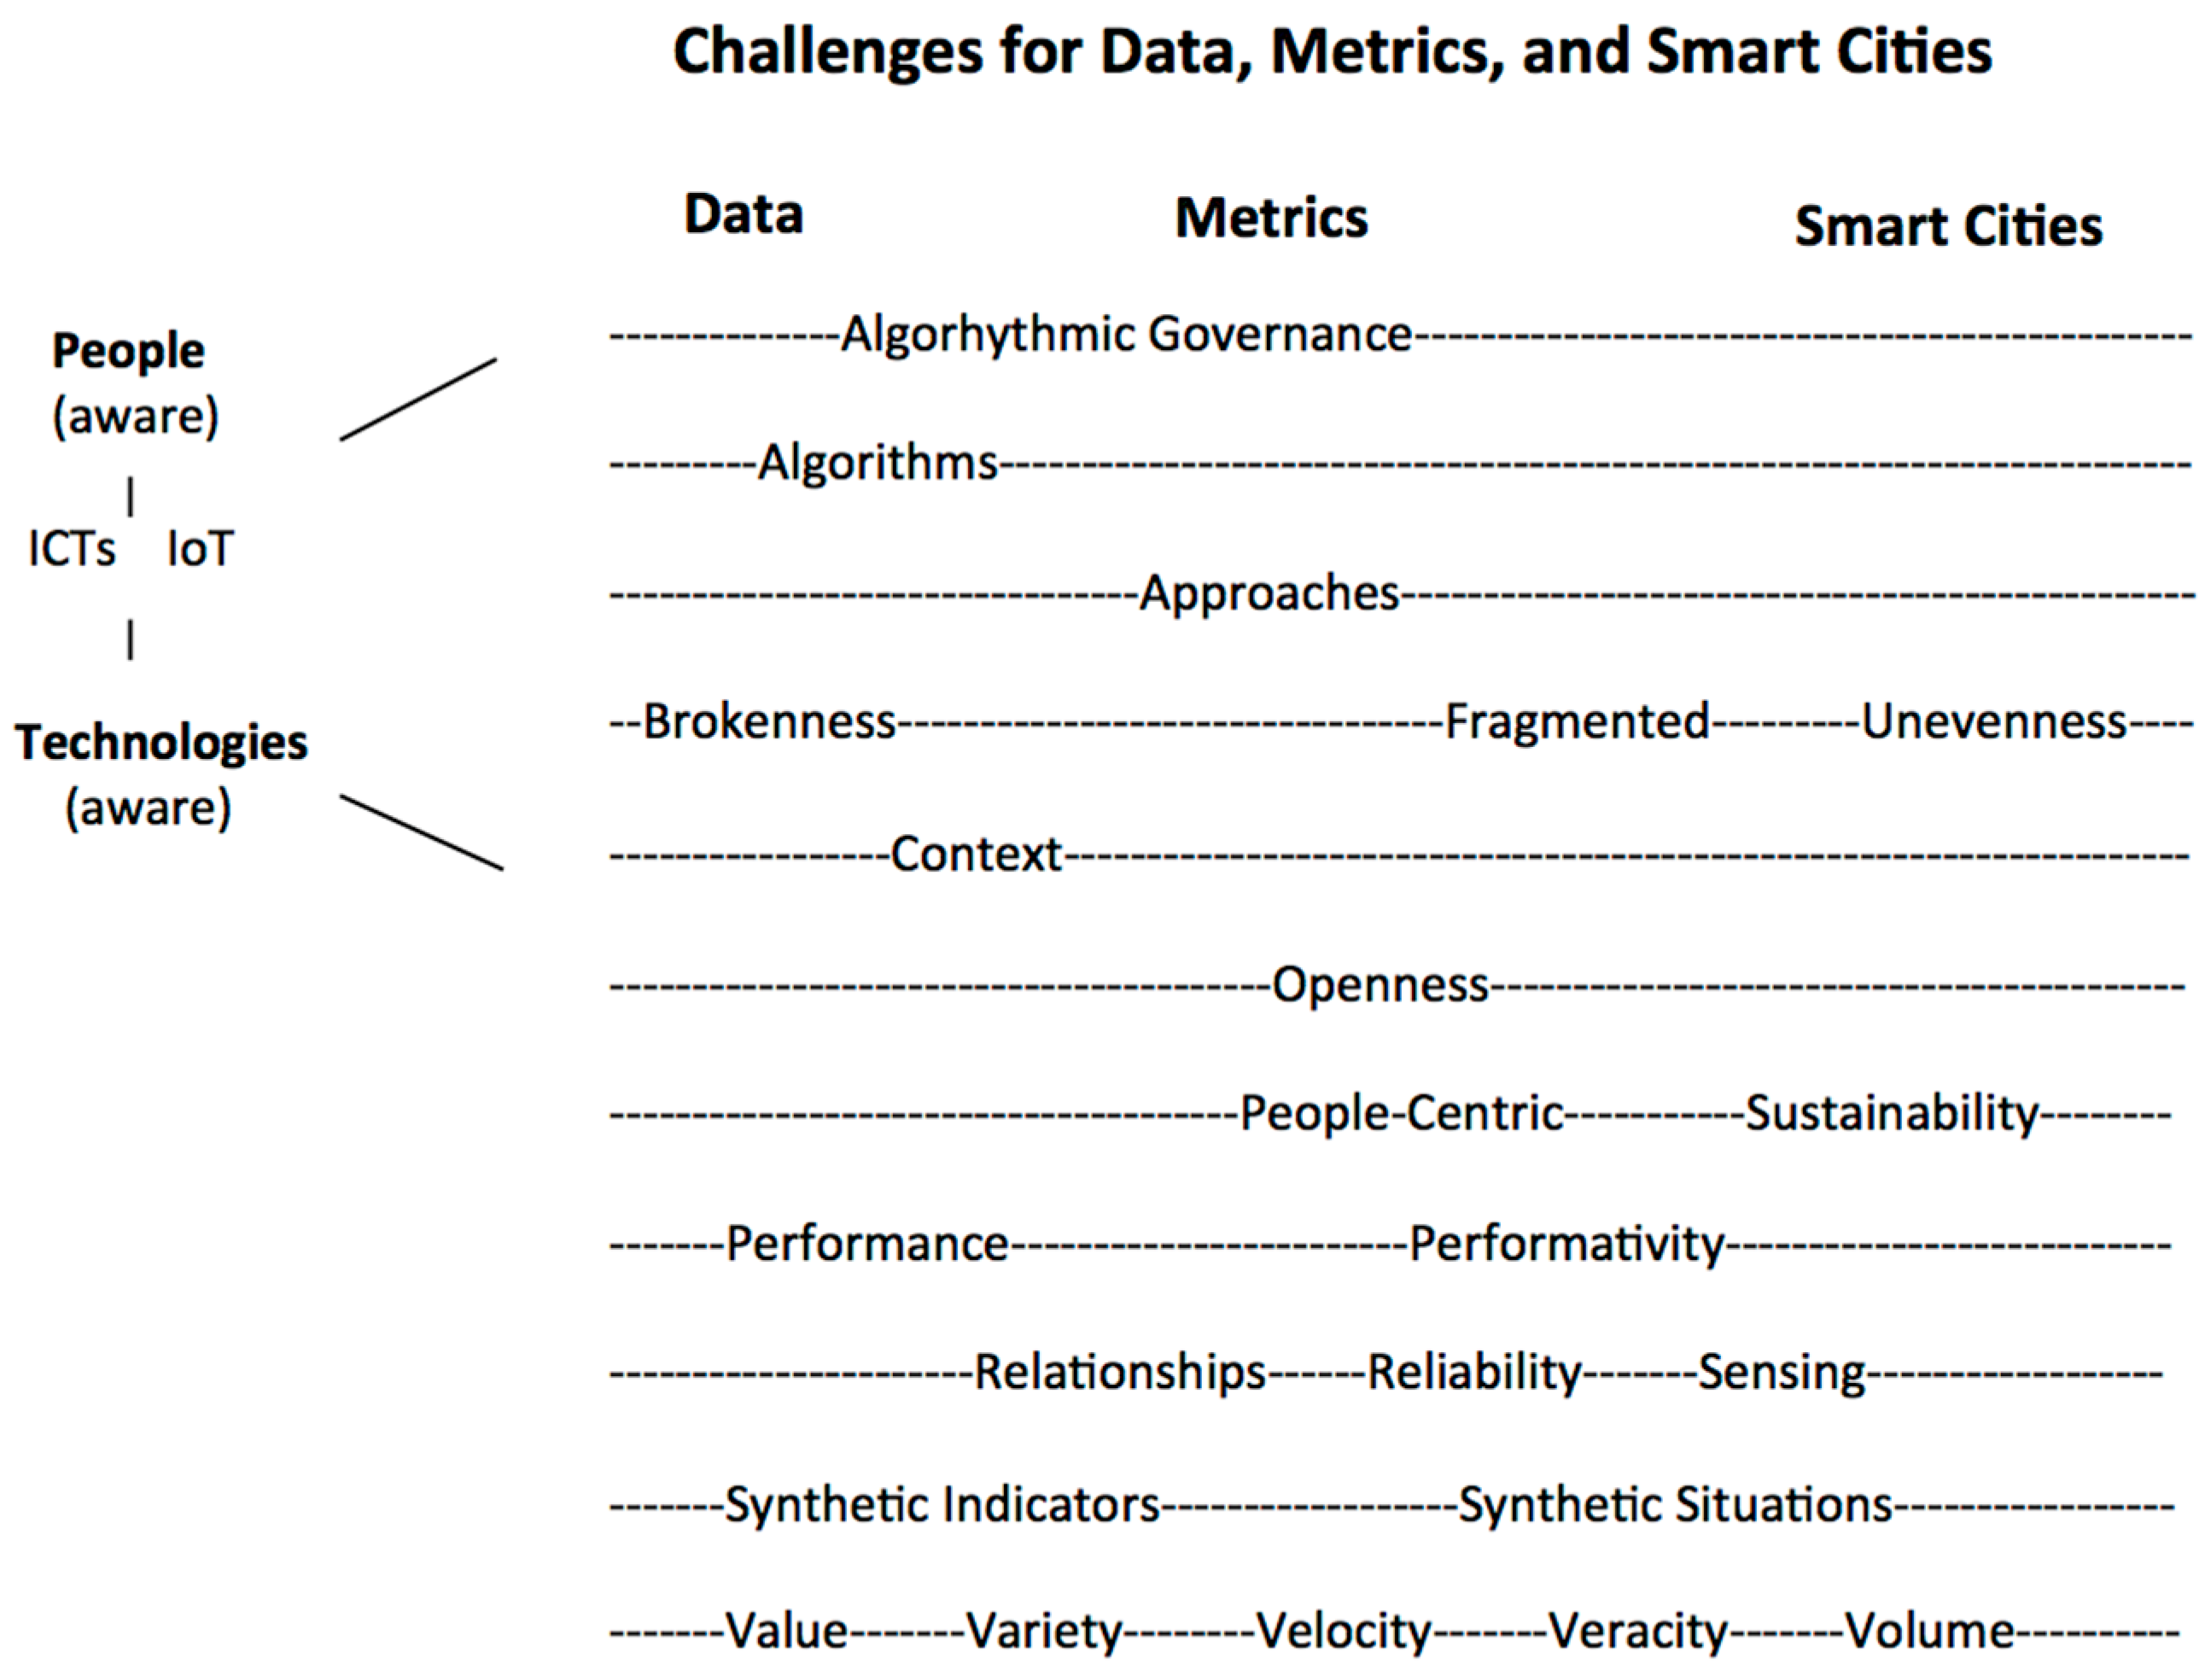
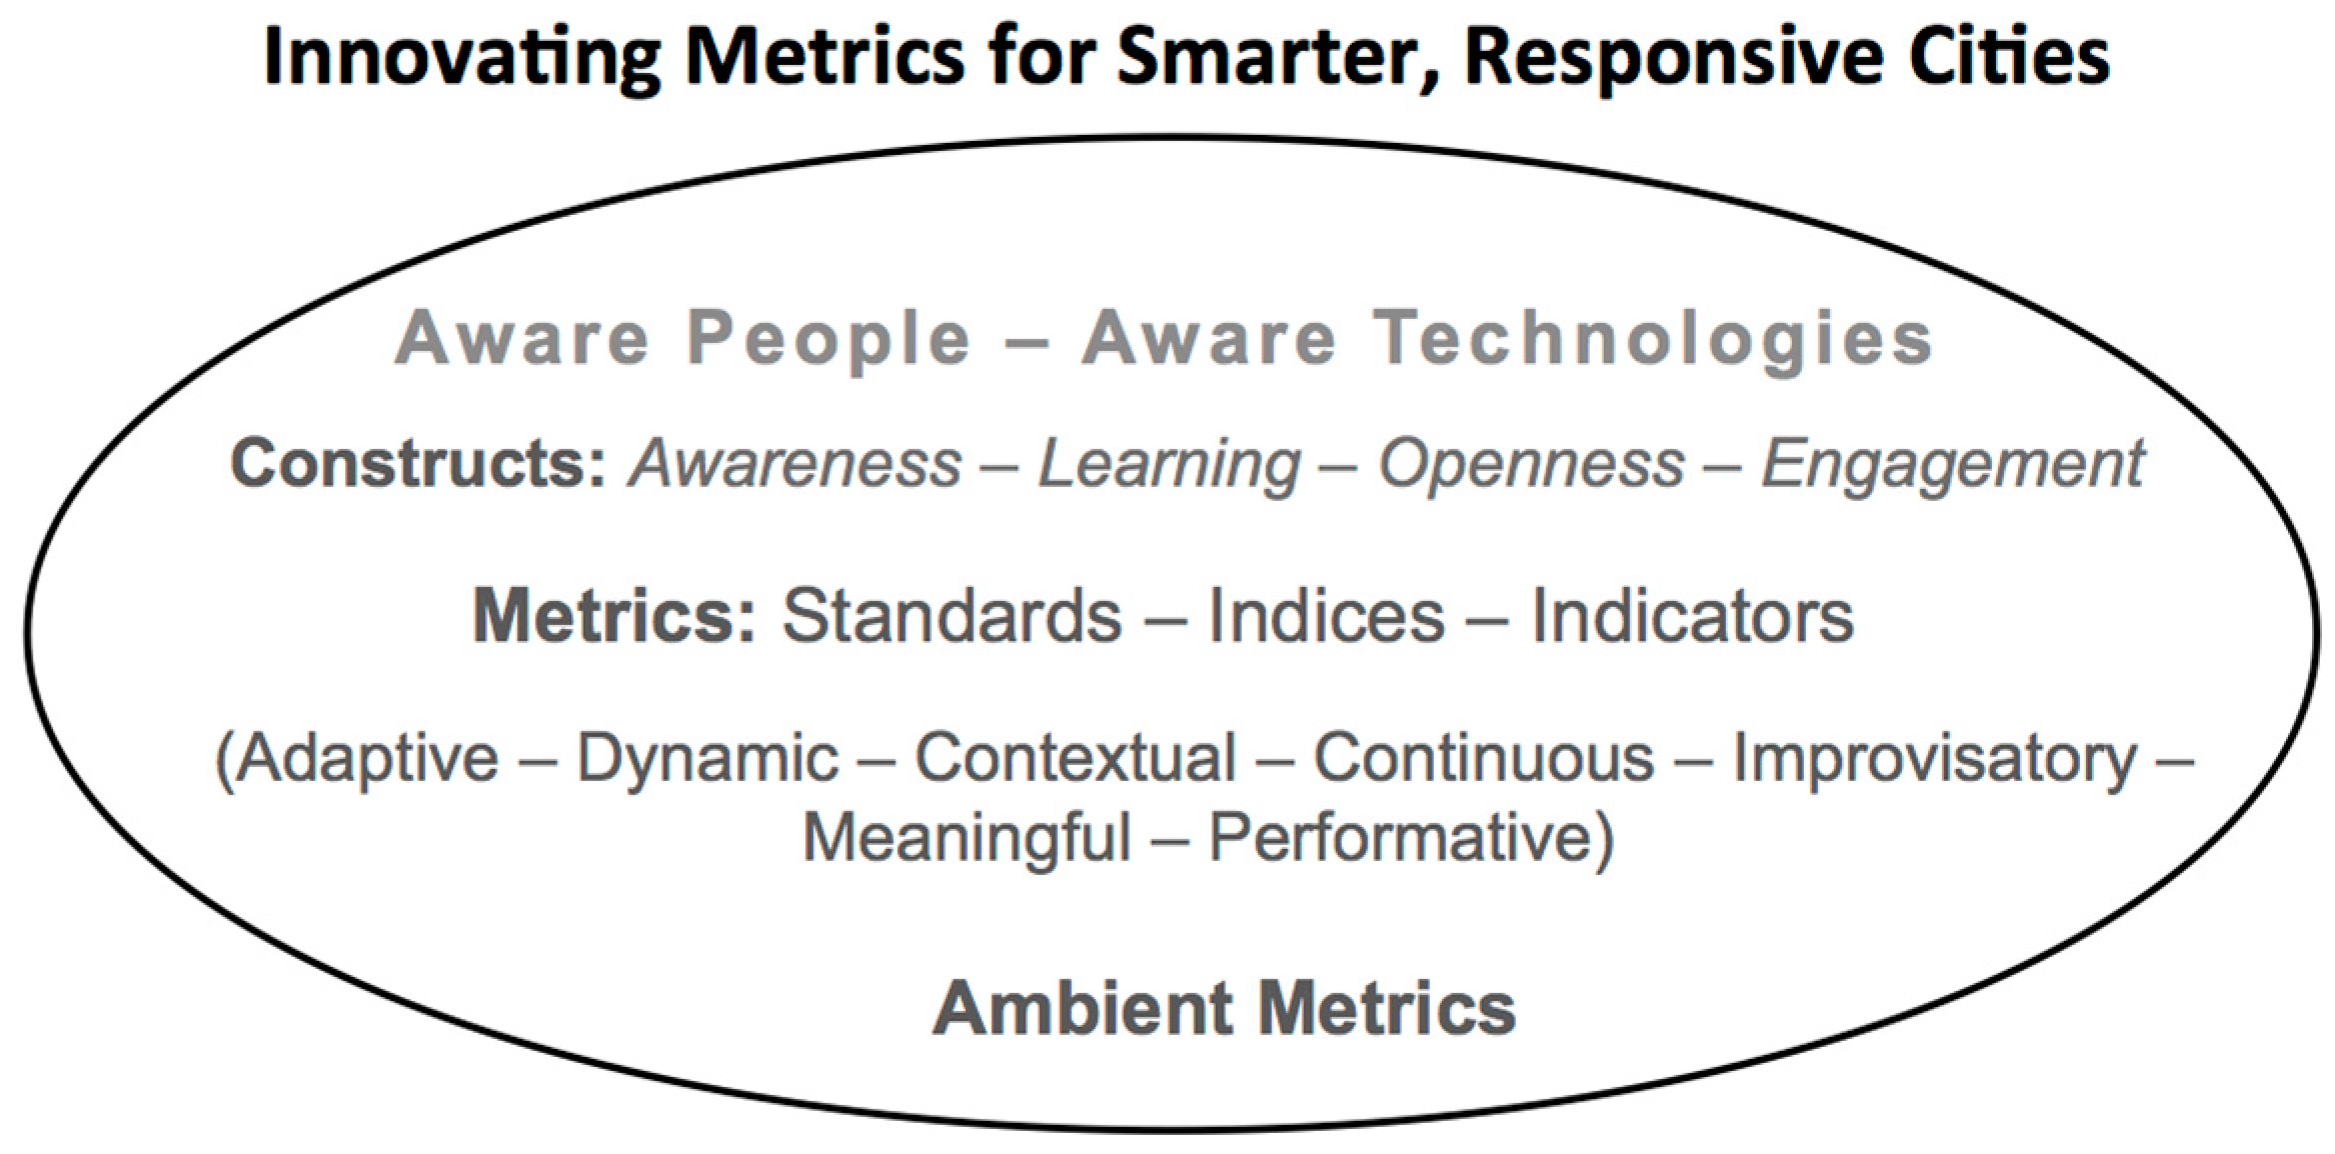
Table 1.
Overview of challenges for big and small data in smart cities.
| Challenges | #Author | Big Data | Small Data | Smart Cities |
|---|---|---|---|---|
| Algorithms | 14/21 | ✓ | ✓ | |
| Approaches and Methods | 19/16 | ✓ | ✓ | ✓ |
| Context | 12/19 | ✓ | ✓ | ✓ |
| Sensing | 5/10 | ✓ | ✓ | ✓ |
| Synthetic | 8/11 | ✓ | ✓ | |
| Value–Variety–Velocity–Veracity-Volume | 7/14 | ✓ | ✓ | ✓ |
Table 2.
Overview of key institutes and parameters of analysis of smart cities.
| Institute | Indices | Indicators | Parameters |
|---|---|---|---|
| BSI | Standards | Smart cities | Issues |
| CityKeys VTT/AIT/EU | Smart City | Project success | Performance |
| CIVITAS/EC | Famework | Cities/Projects | Vitality |
| EIU | GLI | Living conditions | Livability |
| IESE | CIMI | Development | 9 key areas |
| ISO | 37120:2018 | Performance | Services/QoL |
| Mercer | QoLR | Living conditions | Livability |
| Monocle | MLCI | Livability | QoL |
Table 3.
Overview of literature contributing to formulation of a framework for innovating metrics.
| Framework Elements | Author(s) |
|---|---|
| Aware People + Aware Technologies | McKenna [4]; Chauhan, Agarwal and Kar [11]; Jara, Bocchi & Genoud [12] |
| Constructs | |
| Awareness | Estrin [10]; Han, Guizani, Lloret, Chan, Wan and Guibene [18]; Ang, Seng, Zungeru, and Ijemaru [45]; IESE [67]; Patel [77] |
| Learning | Han, Guizani, Lloret, Chan, Wan & Guibene [17]; Wise and Shaffer [31] |
| Openness | Joshi and When [14]; Pink, Ruckenstein, Willim and Dugue [30]; Zygiaris [32] |
| Engagement | Pink, Ruckenstein, Willim and Dugue [30]; Dotti [44]; Joss [46] |
| Metrics | Caprotti, Cowley, Datta, Brot, Gao, Georgeson, Herrick, Odeandaal and Joss [2]; Bell, Banetti, Edwards, Laney, Morse, Picollo, and Zanetti [5]; Marsal-Llacuna [54]; Marsal-Llacuna [78] |
| Standards/Indicators | Al-Nasrawi, Adams and El-Zaart [1]; WCCD [50]; ISO [51]; Cohen [52]; Bosch, Jongeneel, Rovers, Neumann, Airaksinen and Huovila [65] |
| Indices | Mollá-Sirvent et al. [42]; Caird, Hudson and Kortuem [63]; IESE [67]; EIU [73]; Monocle [76]; Bonduel [88] |
| Dynamic | Al Nuaimi, Al Neyadi, Mohamed and Al-Jaroodi [15] |
| Contextual | Batty [9]; Han, Guizani, Lloret, Chan, Wan and Guibene [18]; Smith [26]; Zygiaris [32]; Hunter [79]; Dourish [83] |
| Continuous | Chauhan, Agarwal and Kar [11]; Jara, Bocchi and Genoud [12]; Bosch, Jongeneel, Rovers, Neumann, Airaksinen, and Huovila [65] |
| Improvisatory | Pink, Ruckenstein, Willim and Dugue [30] |
| Meaningful | Bell, Banetti, Edwards, Laney, Morse, Picollo, and Zanetti [5]; Thakuriah, Tilahun, and Zellner [20]; Joss [46]; Baumer [80]; |
| Performative & Performance | Zook [23]; Parmiggiani, Monteiro & Østerlie [55]; Caird, Hudson and Kortuem [63]; Bosch, Jongeneel, Rovers, Neumann, Airaksinen, and Huovila [65] |
© 2019 by the author. Licensee MDPI, Basel, Switzerland. This article is an open access article distributed under the terms and conditions of the Creative Commons Attribution (CC BY) license (http://creativecommons.org/licenses/by/4.0/).
Share and Cite
MDPI and ACS Style
McKenna, H.P. Innovating Metrics for Smarter, Responsive Cities. Data 2019, 4, 25. https://doi.org/10.3390/data4010025
AMA Style
McKenna HP. Innovating Metrics for Smarter, Responsive Cities. Data. 2019; 4(1):25. https://doi.org/10.3390/data4010025
Chicago/Turabian StyleMcKenna, H. Patricia. 2019. "Innovating Metrics for Smarter, Responsive Cities" Data 4, no. 1: 25. https://doi.org/10.3390/data4010025