
Experimental Data of Bottom Pressure and Free Surface Elevation including Wave and Current Interactions


1
School of Engineering, Institute for Energy Systems, FloWave Ocean Energy Research Facility, The University of Edinburgh, Max Born Crescent, Edinburgh EH9 3BF, UK
2
Department of Mechanical, Aerospace and Civil Engineering, University of Manchester, Manchester M60 1QD, UK
3
Renewable Energy Group, College of Engineering, Mathematics and Physical Sciences, University of Exeter, Penryn Campus, Penryn TR10 9FE, UK
*
Author to whom correspondence should be addressed.
Data 2021, 6(10), 103; https://doi.org/10.3390/data6100103
Submission received: 23 August 2021
/
Revised: 20 September 2021
/
Accepted: 23 September 2021
/
Published: 30 September 2021
Abstract
:Force plates are commonly used in tank testing to measure loads acting on the foundation of a structure. These targeted measurements are overlaid by the hydrostatic and dynamic pressure acting on the force plate induced by the waves and currents. This paper presents a dataset of bottom force measurement with a six degree-of-freedom force plate (AMTI OR6-7 1000, surface area 0.464 m × 0.508 m) combined with synchronised measurements of surface elevation and current velocity. The data cover wave frequencies between 0.2 to 0.7 Hz and wave directions between 0 and 180. These variations are provided for current speeds of 0 and 0.2 m/s and a variation of the current in the absence of waves covering 0 to 0.45 m/s. The dataset can be utilised as a validation dataset for models predicting bottom pressure based on free surface elevation. Additionally, the dataset provides the wave- and current-induced load acting on the specific load cell at a fixed water depth of 2 m, which can subsequently be removed to obtain the often-desired measurement of structural loads.
Data Set:https://doi.org/10.7488/ds/3120.
Data Set License: CC BY 4.0
1. Introduction
To design safe and effective offshore structures and devices, it is vital to understand the reaction forces induced by the ocean conditions that they must operate in. Numerical and experimental techniques are often used in combination to estimate these loads and inform design, whereas experiments are typically used for model validation. Experimental force measurements help provide confidence in system design and are a crucial requirement for a wide range of ocean and coastal engineering problems. For instance, force measurements are used to quantify structural loading on breakwaters [1,2,3], as well as loading on complex systems, such as remotely operated vehicles [4,5,6,7], offshore wind turbines [8,9,10,11], sediment transport and bottom fluvial erosion [12,13] and tidal stream turbines (TSTs) [14,15,16,17,18]. To obtain vector force measurements experimentally, force plates are typically used and are integrated into the structure and/or foundation. Pressure sensors are also commonly used, but these only provide measurements along a single axis and hence are of more limited applicability.
For many experimental configurations, including experiments aimed at assessing foundation loads, the loads acting on the force plate itself are not the targeted measurement. In these circumstances, the desired structural forces are overlaid by those acting on the force plate, which are composed of a hydrostatic pressure component and a dynamic pressure component induced by the velocity in the boundary layer [19]. Predictions can be made to remove these components using, e.g., linear wave theory, but known limitations (e.g., [20]) will introduce uncertainty in the process, and consequently, in design. The dataset presented herein therefore aims to provide (i) a comprehensive set of experiments to validate theoretical predictions of bottom pressure in wave, current, and wave-current conditions, and (ii) a dataset for the direct removal of force plate-based loads from measurements for the specific experiments described.
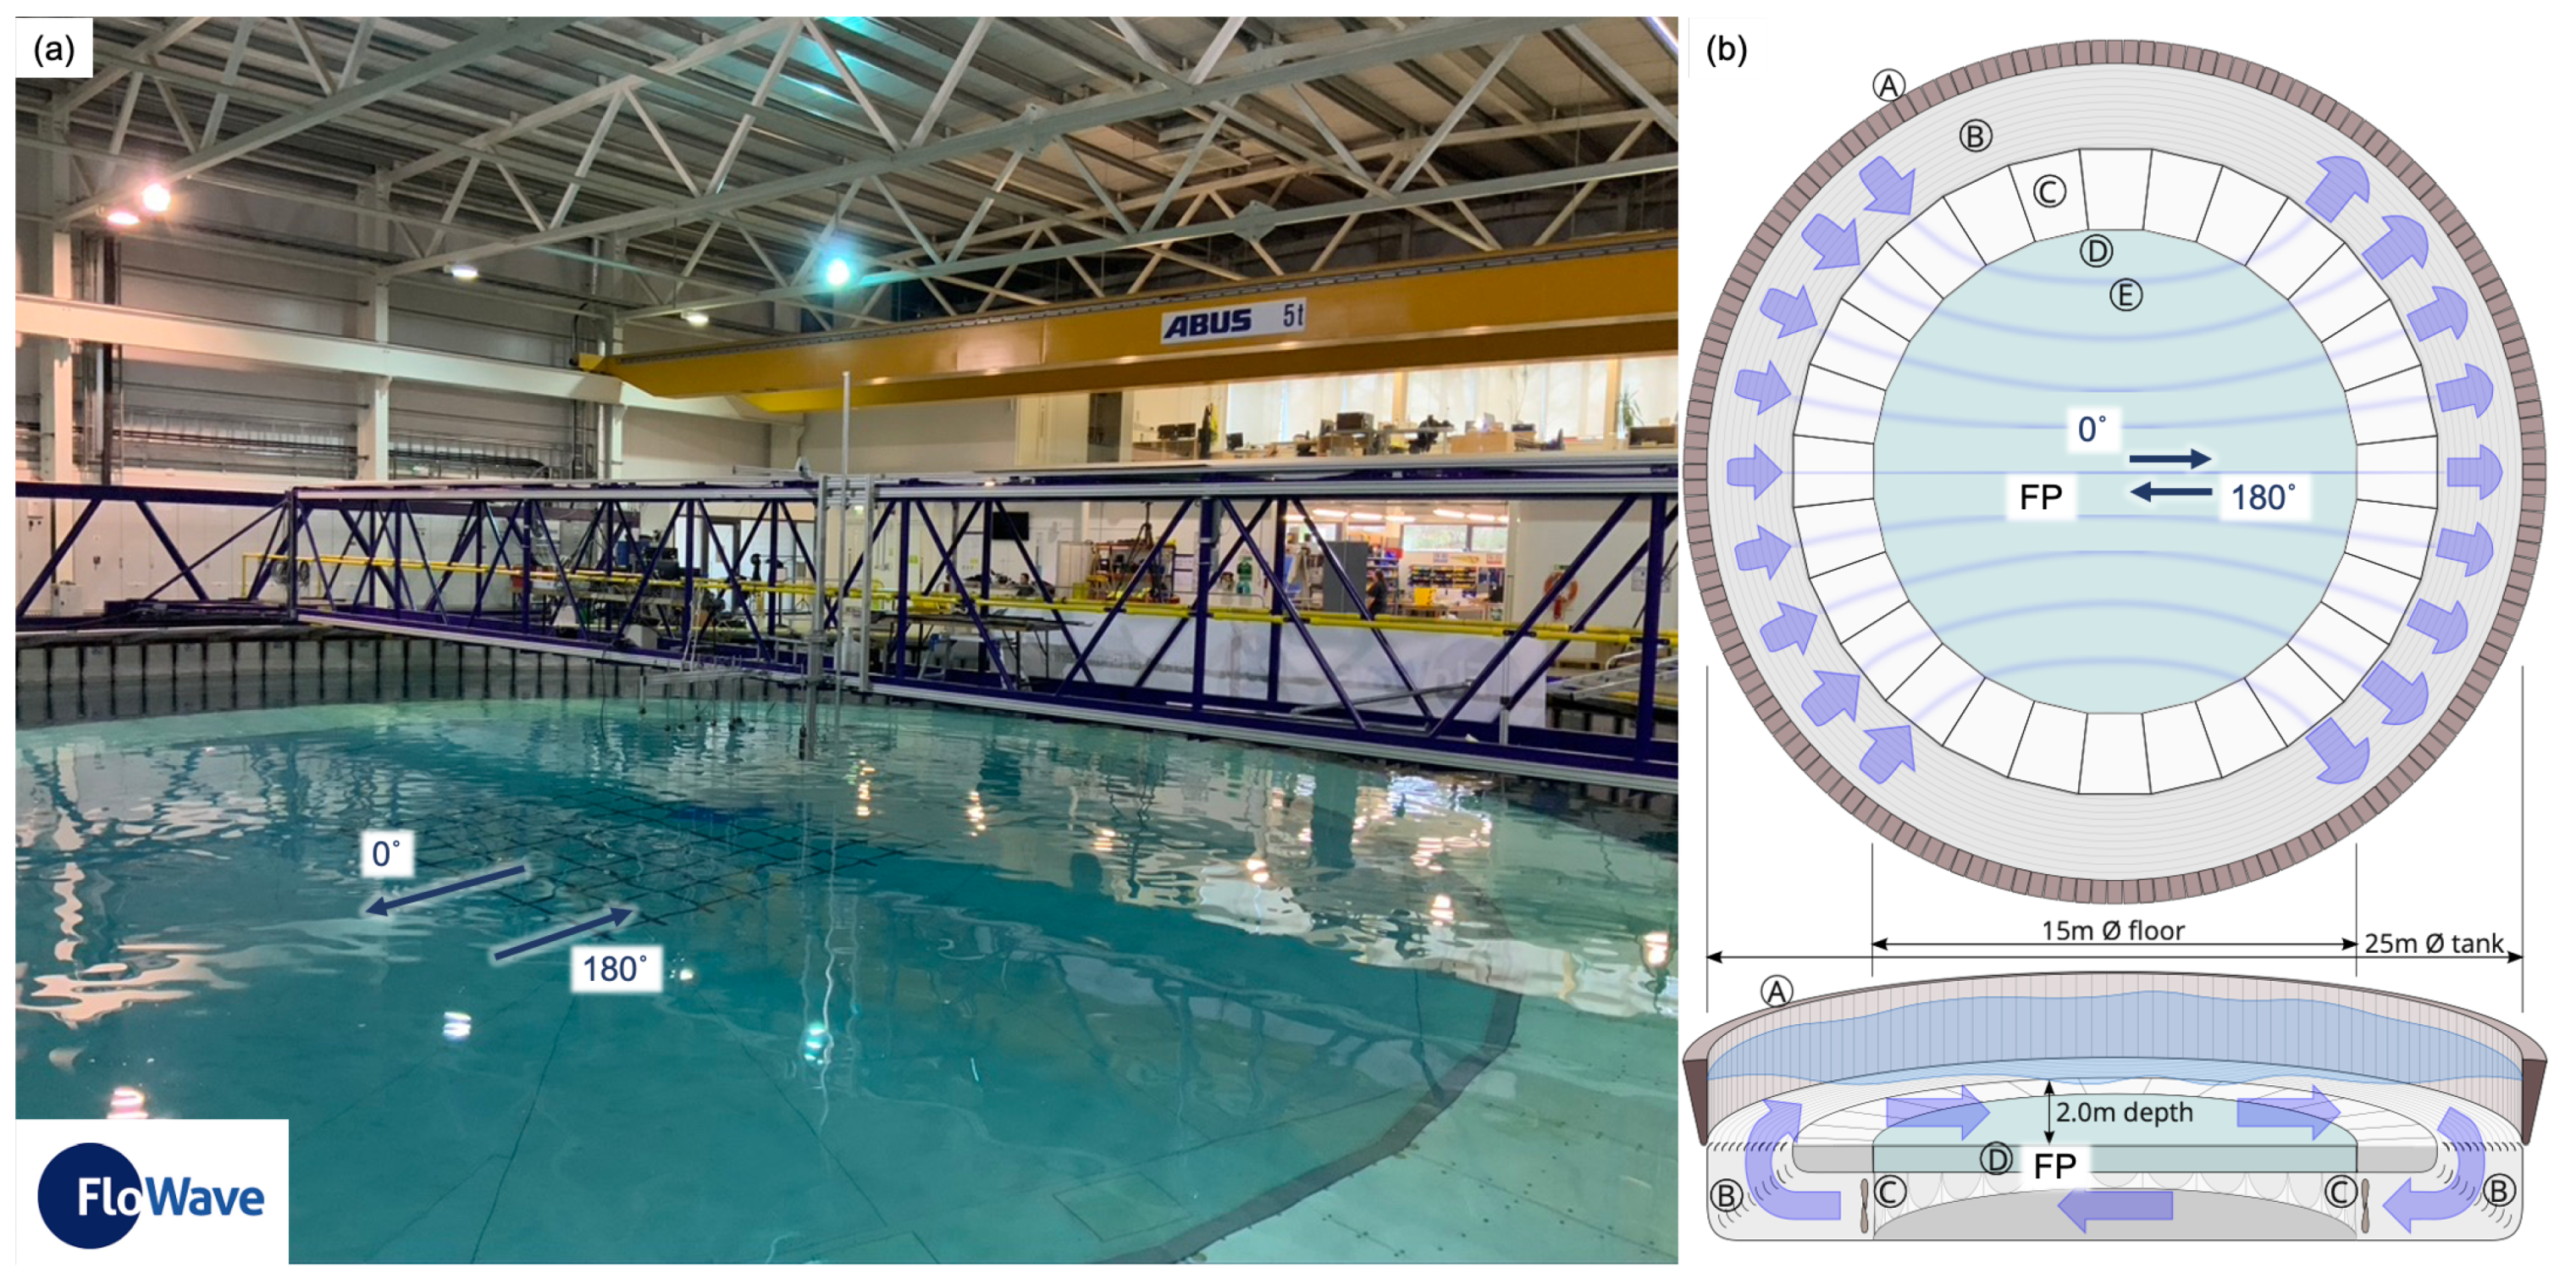
All experiments were carried out in the FloWave Ocean Energy Research Facility [16,21,22,23] at the University of Edinburgh (Figure 1). This unique circular wave and current testing tank has a diameter of 25 m and the upper water reservoir has a constant depth of 2 m. 168 wave makers are located around the circumference and can generate and absorb waves from any direction. The tank also provides a current speed of up to 1.6 m/s from any direction. Therefore, a second similar water volume is provided under the 1 m thick floor construction (Figure 1b using the figures provided by Noble [24]). The water can be accelerated by 28 flow-drive units to control flow velocity and direction for the main testing area around the centre of the tank. As an input value for the current speed, the tank uses direction as well as RPM (revolutions per minute) of the flow drive. Two large eddies are forced on both sides to cover the expanding part of the circular tank to generate a straight flow condition in the middle region of the tank (Figure 1b). The centre part of the floor can be raised and allows the installation of equipment in the dry. The ability to generate both waves and currents at arbitrary angles to each other is unique and provides a mechanism to simulate the complex and realistic ocean conditions that structures must operate in.
The dataset provides simultaneous measurement from an array of wave gauges capturing the free surface above a submerged force plate for a range of wave, current, and combined wave-current conditions. Additional velocity measurements are provided with an acoustic Doppler velocimeter. The investigated force plate was fully submerged with a still water surface depth of 2 m and installed to be level with the floor (see Section 2.1 for more details). The force plate is typically used for the measurement of foundation forces and moments for tidal stream turbines (TSTs), and has been installed for a range of experiments assessing current- [14,16] and wave-current [17,25,26]-induced loads on TSTs. This dataset was collected as part of the “Accounting for Current in Wave Buoy Measurements Project” [27,28,29], where the force plate was primarily used to measure the mooring line loads experienced by a floating buoy in the presence of waves and currents. The presented data represents the ‘empty tank’ (ET) tests without the buoy installed—designed to enable removal of the force plate-based loads from the measurements for these specific tests. This dataset also has specific applicability for tests undertaken in FloWave and/or with this specific force plate, and has wider use as a validation dataset for the prediction of bottom pressure in wave, current and combined wave-current conditions.
The remainder of this paper is laid out as follows. Section 2 provides a description of the deployed instrumentation, along with the wave and current combinations used. An additional analysis in Section 3 presents an example comparison of three different measurement systems and focuses on the quality of the ADV measurement. A description of the available data is presented in Section 4 and the full data set is available via Edinburgh DataShare [30].
2. Experimental Set-Up
2.1. Instrumentation
The presented experimental investigation includes (a) velocity measurement with an acoustic Doppler velocimeter (ADV), (b) an array of wave gauges (WG) to capture the free surface elevation, as well as (c) the force and moment measurement conducted with the force plate (FP) integrated in the tank floor.
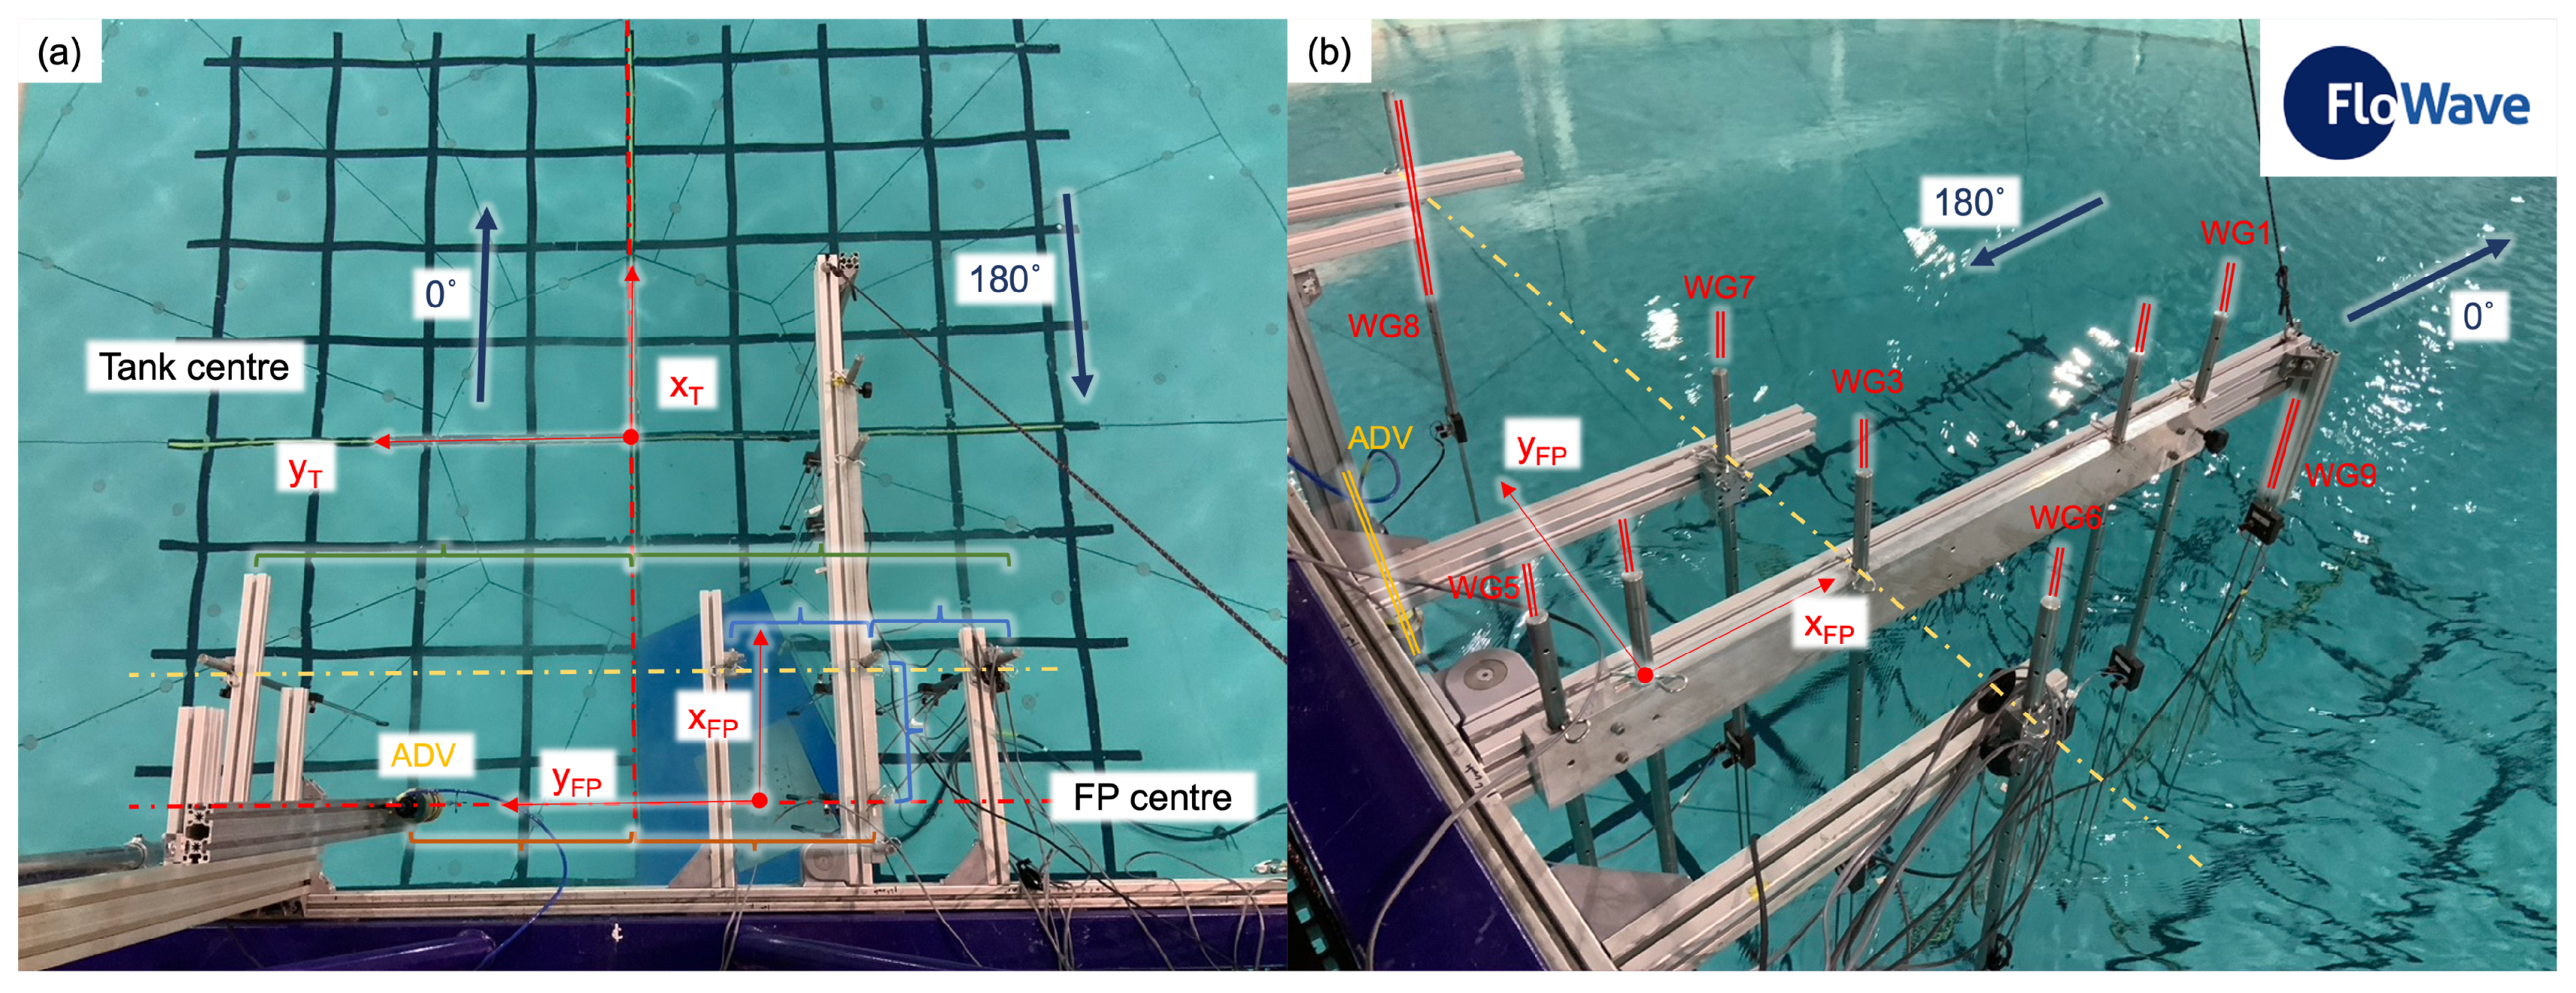
Figure 2 provides an overview of the experimental set-up of the instrumentation. In total, nine different WG were installed. Table 1 presents the location of the nine WG in relation to the centre of the force plate with the subscript as well as the circular tank (index ). The spacing between the WG1-5 are based on a Golomb ruler with the marks of (11,9,4,1,0) and a base length of 1 m. WG4 is located above the centre of the FP, and a further five WG are located along the x direction. As shown in Figure 2a, WG6 and WG7 are installed with an offset on both sides of the WG4 using the local coordinate system with the origin at the FP. WG8 has the same distance from the origin as WG4 but mirrored about the global tank -axis. The WG are calibrated with five points over a range of ±0.1 m. This process ensured that the accuracy of the WG was less than 1 mm [31,32,33].
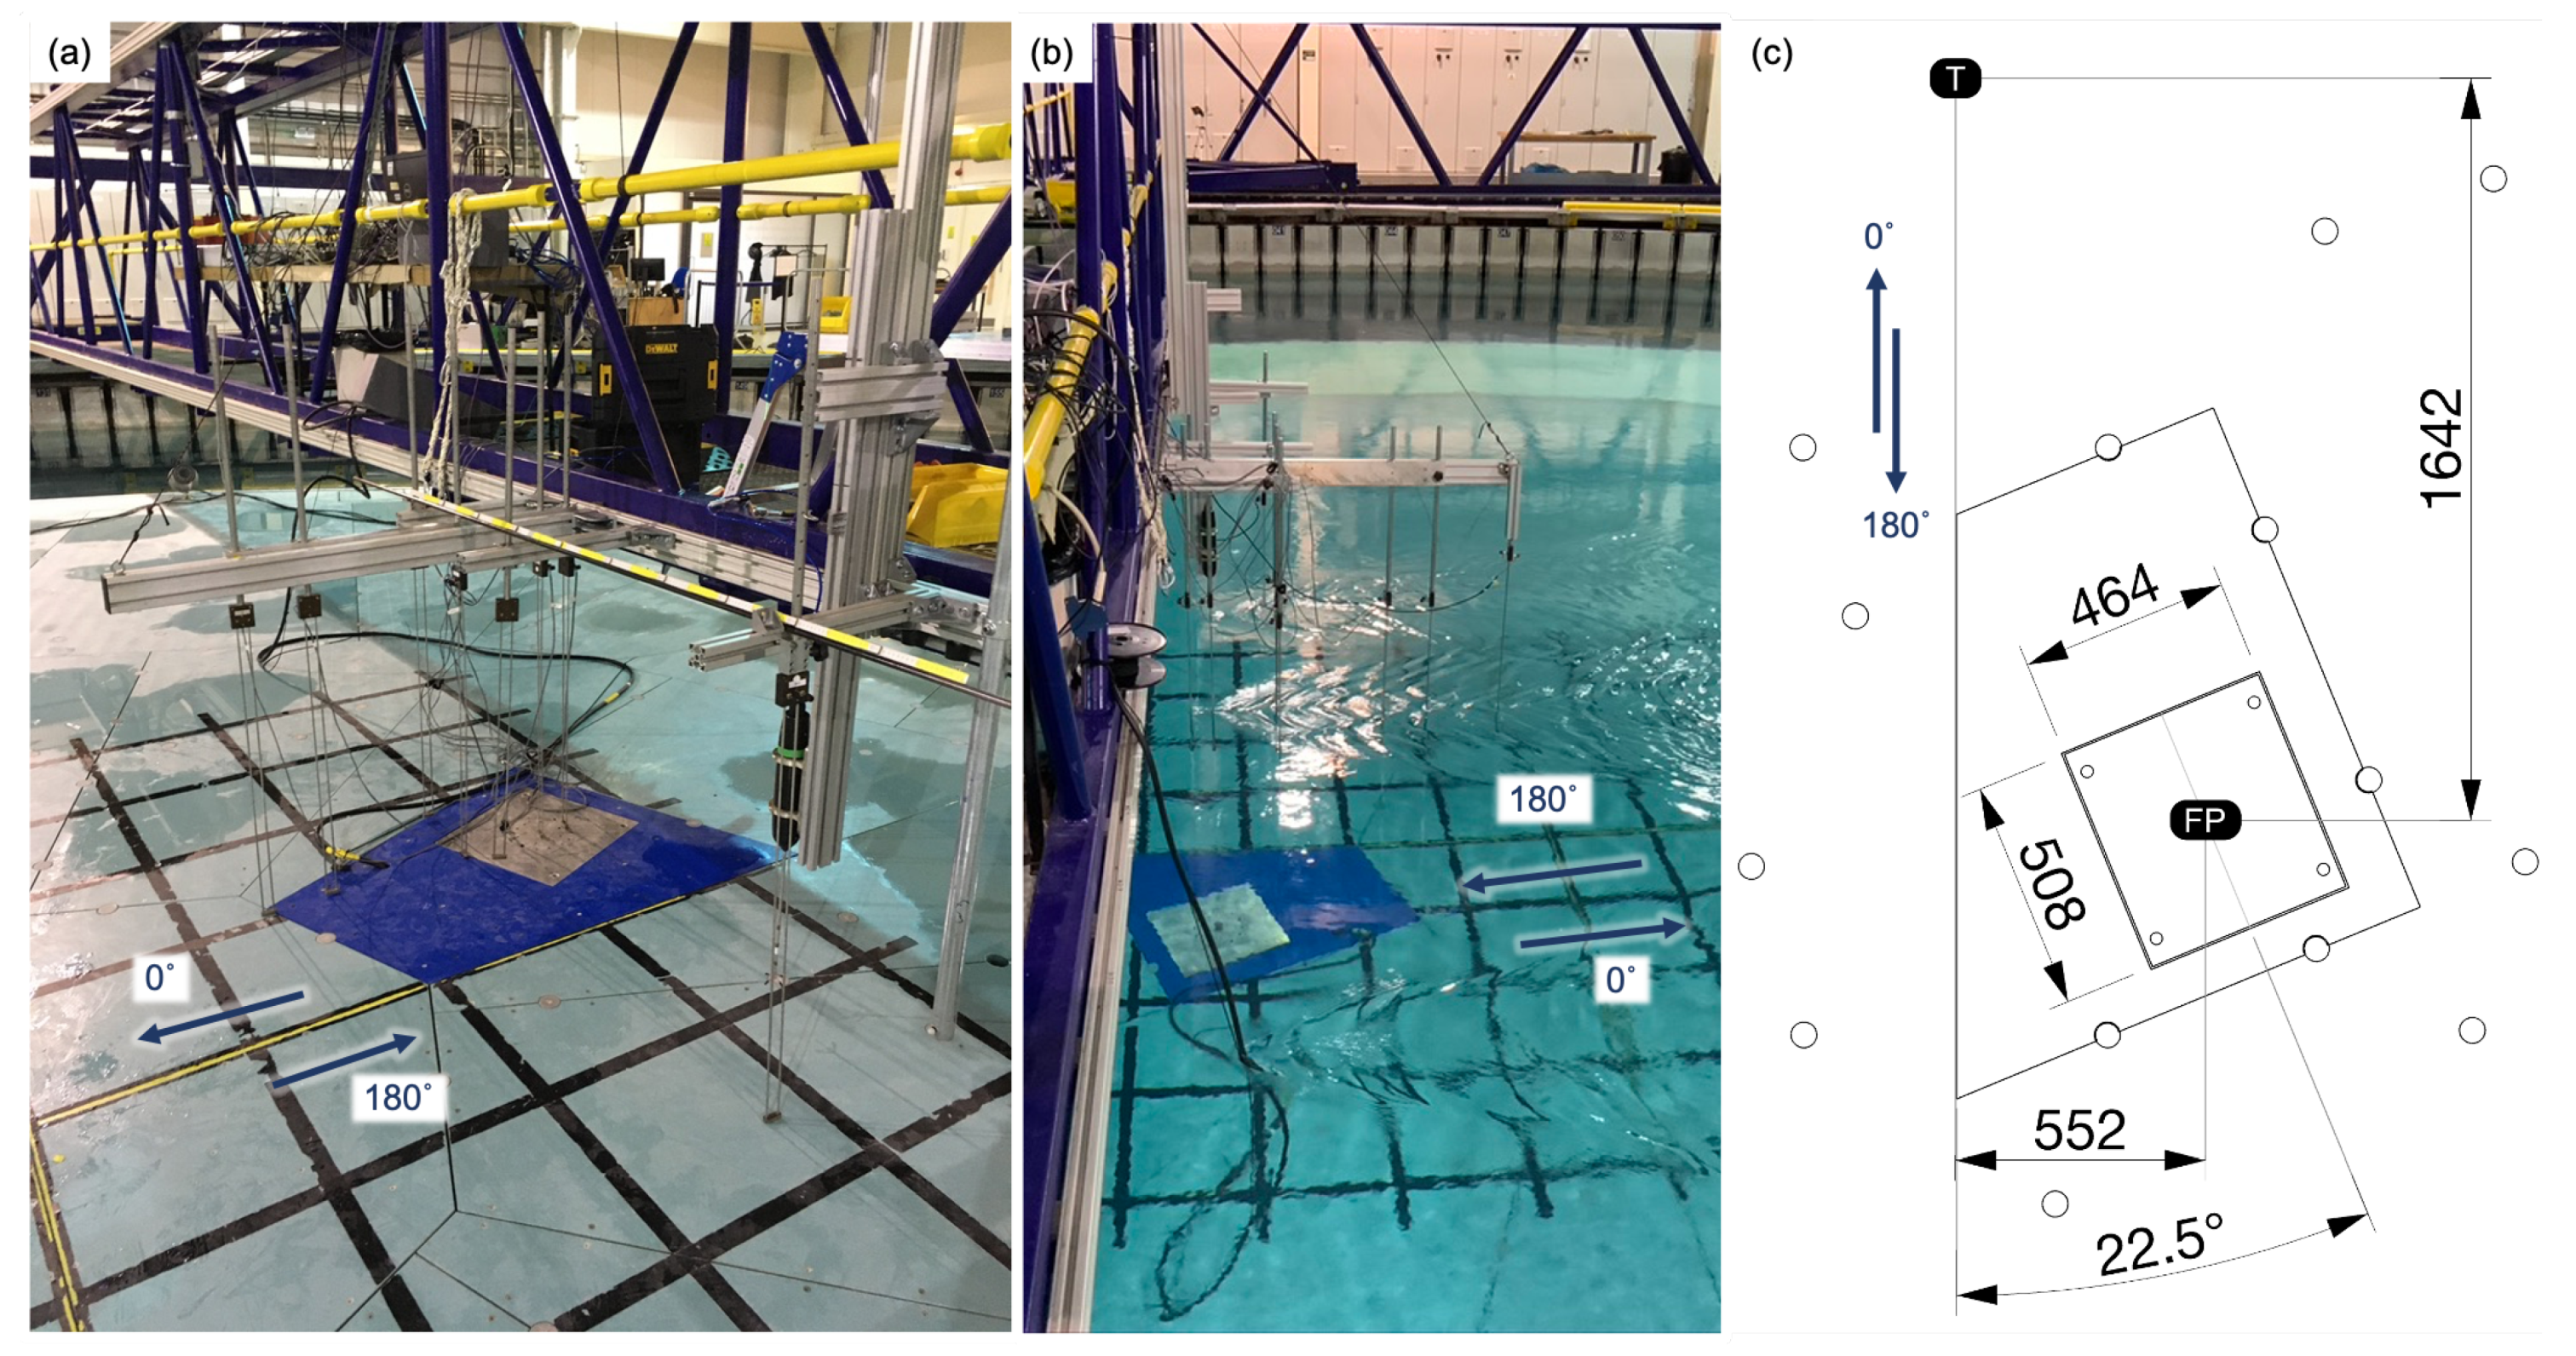
The main instrument for this investigation was a six degree-of-freedom (6-DoF) AMTI OR6-7 (specification 1000) force plate [34]. This instrument has a maximum capacity of 500 N in both horizontal directions, 1000 N for the vertical force measurement and applied moments of 10,000 Nm () and 5000 Nm (). The manufacturer specifies the hysteresis as well as the non-linearity of the force plate to be % of full-scale output and also specifies a cross-talk of less than 2% for all channels [34]. It has a top surface that measures 0.464 m by 0.508 m and a total thickness of close to 0.09 m. The latter is not relevant for this investigation, as the FP was installed with a custom-made top plate (can be adapted to specific projects) to ensure the top-face of the FP was in the same plane as the floor. Figure 3a shows the dry installation made available by the raisable central part of the tank floor. A small gap between the top plate of the FP and the surrounding floor ensures a good measurement of the forces acting on the plate. The FP is rotated by 22.5 to the x-orientation of the tank, which is necessitated by the available divisions of the floor surface. This angle is included in the processing of the FP, and the reported values are based on the global tank coordinate system (Figure 2). A cable connects the FP with the instrumentation on the gantry. It was ensured that this cable was outside of the main investigation area and either sideways or downstream of the waves (Figure 3b). The force plate was fully submerged, and after allowing for temperature adaptation, all values were zeroed. Consequently, the measured values are changes from the hydrostatic pressure. A constant water depth of 2 m was maintained for all the tests.
The primary comparison is intended to be made between the WG and the FP. The current interacts with the waves by changing the wave kinematics, and, hence, knowledge of the current is required. The ADV installed was a Nortek Vectrino Profiler, which was operated in point measurement mode and provided the velocity vector in the main components based on the tank coordinate system. The manufacturer specifies that the accuracy of the instrument is 0.5% of the measured value ±1 mm/s [35]. The instrument uses four beams, resulting in a redundant measurement, which provides two vertical velocity components and in addition to the two horizontal velocity measurements and which are parallel to the tank x and y axes, respectively. Both vertical velocity values should be identical, which enables quality control of the overall velocity measurement. The measurement volume was located 0.2 m under the still water surface to ensure that the targeted value is representative for the location of the FP. Therefore, it is mirrored along the global -axis of the tank. Figure 2 presents a detailed view of the experimental investigation.
All datasets are synchronised based on a digital tank trigger, which is provided by the wave makers. WG measurements were captured directly in the tank software. The ADV started with the rising trigger as well as the National Instrument-based data capturing system, which recorded and digitised the analogue signal of the FP.
Each deployed instrument used a separate measurement frequency. The ADV measurement was limited to 100 Hz; for the WG, the standard frequency was 128 Hz and the FP was captured with the doubled frequency of 256 Hz. Section 4 provides a description of the provided dataset.
2.2. Investigated Cases
The presented investigations covers conditions with waves, currents and combinations of waves and currents. All current flows were limited to 0 based on the tank coordinate system. The capture time for waves was a constant 80 s. The wave makers were active for 64 s (run time) and the wave repeat time was chosen to be 32 s. The repeat time is part of the wave definition, and it ensures that, at the start and the end of this period, the waves are identical. A full number of wave repeats have to be fit into the repeat time, which can result in a difference between the requested and generated wave frequencies (Table 2). Current-only investigations were conducted with a longer capture time of 300 s. Each wave or current condition is named based on a prefix starting with ET (empty tank) and an additional letter, which indicates the order of the tests. The conditions were conducted in the following order:
- Variation of the wave frequency between 0.2 and 0.7 Hz with no current in the wave direction = 0 (ETA), followed by = 180 (ETB). The conditions for each individual run are provided in Table 2;
- After those wave-only investigations, the current speed was investigated, as shown in Table 4. This table shows that the current condition of 0.2 m/s (RPM) was conducted twice (ETD0008 and ETD0009). In between those two measurements, the following described wave and current combinations were measured;
- Variation of in combination with a current speed of 0.2 m/s and a wave direction of 0, representing following waves (ETE) and 180 opposing wave conditions (ETF). The specific conditions can also be found in Table 2;
- Variation of with a constant requested of 0.4 Hz and a current speed of 0.2 m/s (ETG in Table 3).
All wave cases were limited to one single requested wave amplitude of 0.03 m. The quality of the velocity measurements were found to be strongly dependent on the amount of seeding in the water. For the initial waves (ETA and ETB), a local addition of seeding was used, which was not sufficient to provide enough seeding for the initial wave conditions. This was especially evident when the small current velocities were investigated. Consequently, instead of increasing the flow speed incrementally, the procedure was altered and the maximum speed was run first. This is the reason for the change in the speeds presented in Table 4. The focus of the investigation was on the comparison of the WG to the FP, with adequate knowledge of the mean current velocities required to estimate wave-induced velocities. Hence, the run was not repeated even if the quality control criteria of the velocity measurements were not achieved. The quality control of the velocity measurements is discussed in Section 3.2.
3. Preliminary Analysis
This section provides preliminary data analysis in Section 3.1. In Section 3.2, the quality of the velocity measurement is discussed and presented for example cases. For some initial cases, the observed velocity measurements are not ideal, indicating that the seeding material was insufficiently distributed. As the acoustic Doppler velocimeter (ADV) measurements were not the primary aim of the investigation, the runs were not repeated. The provided quality analysis provide a quick overview of how to use the velocity measurements reliably.
3.1. Example Data Comparison
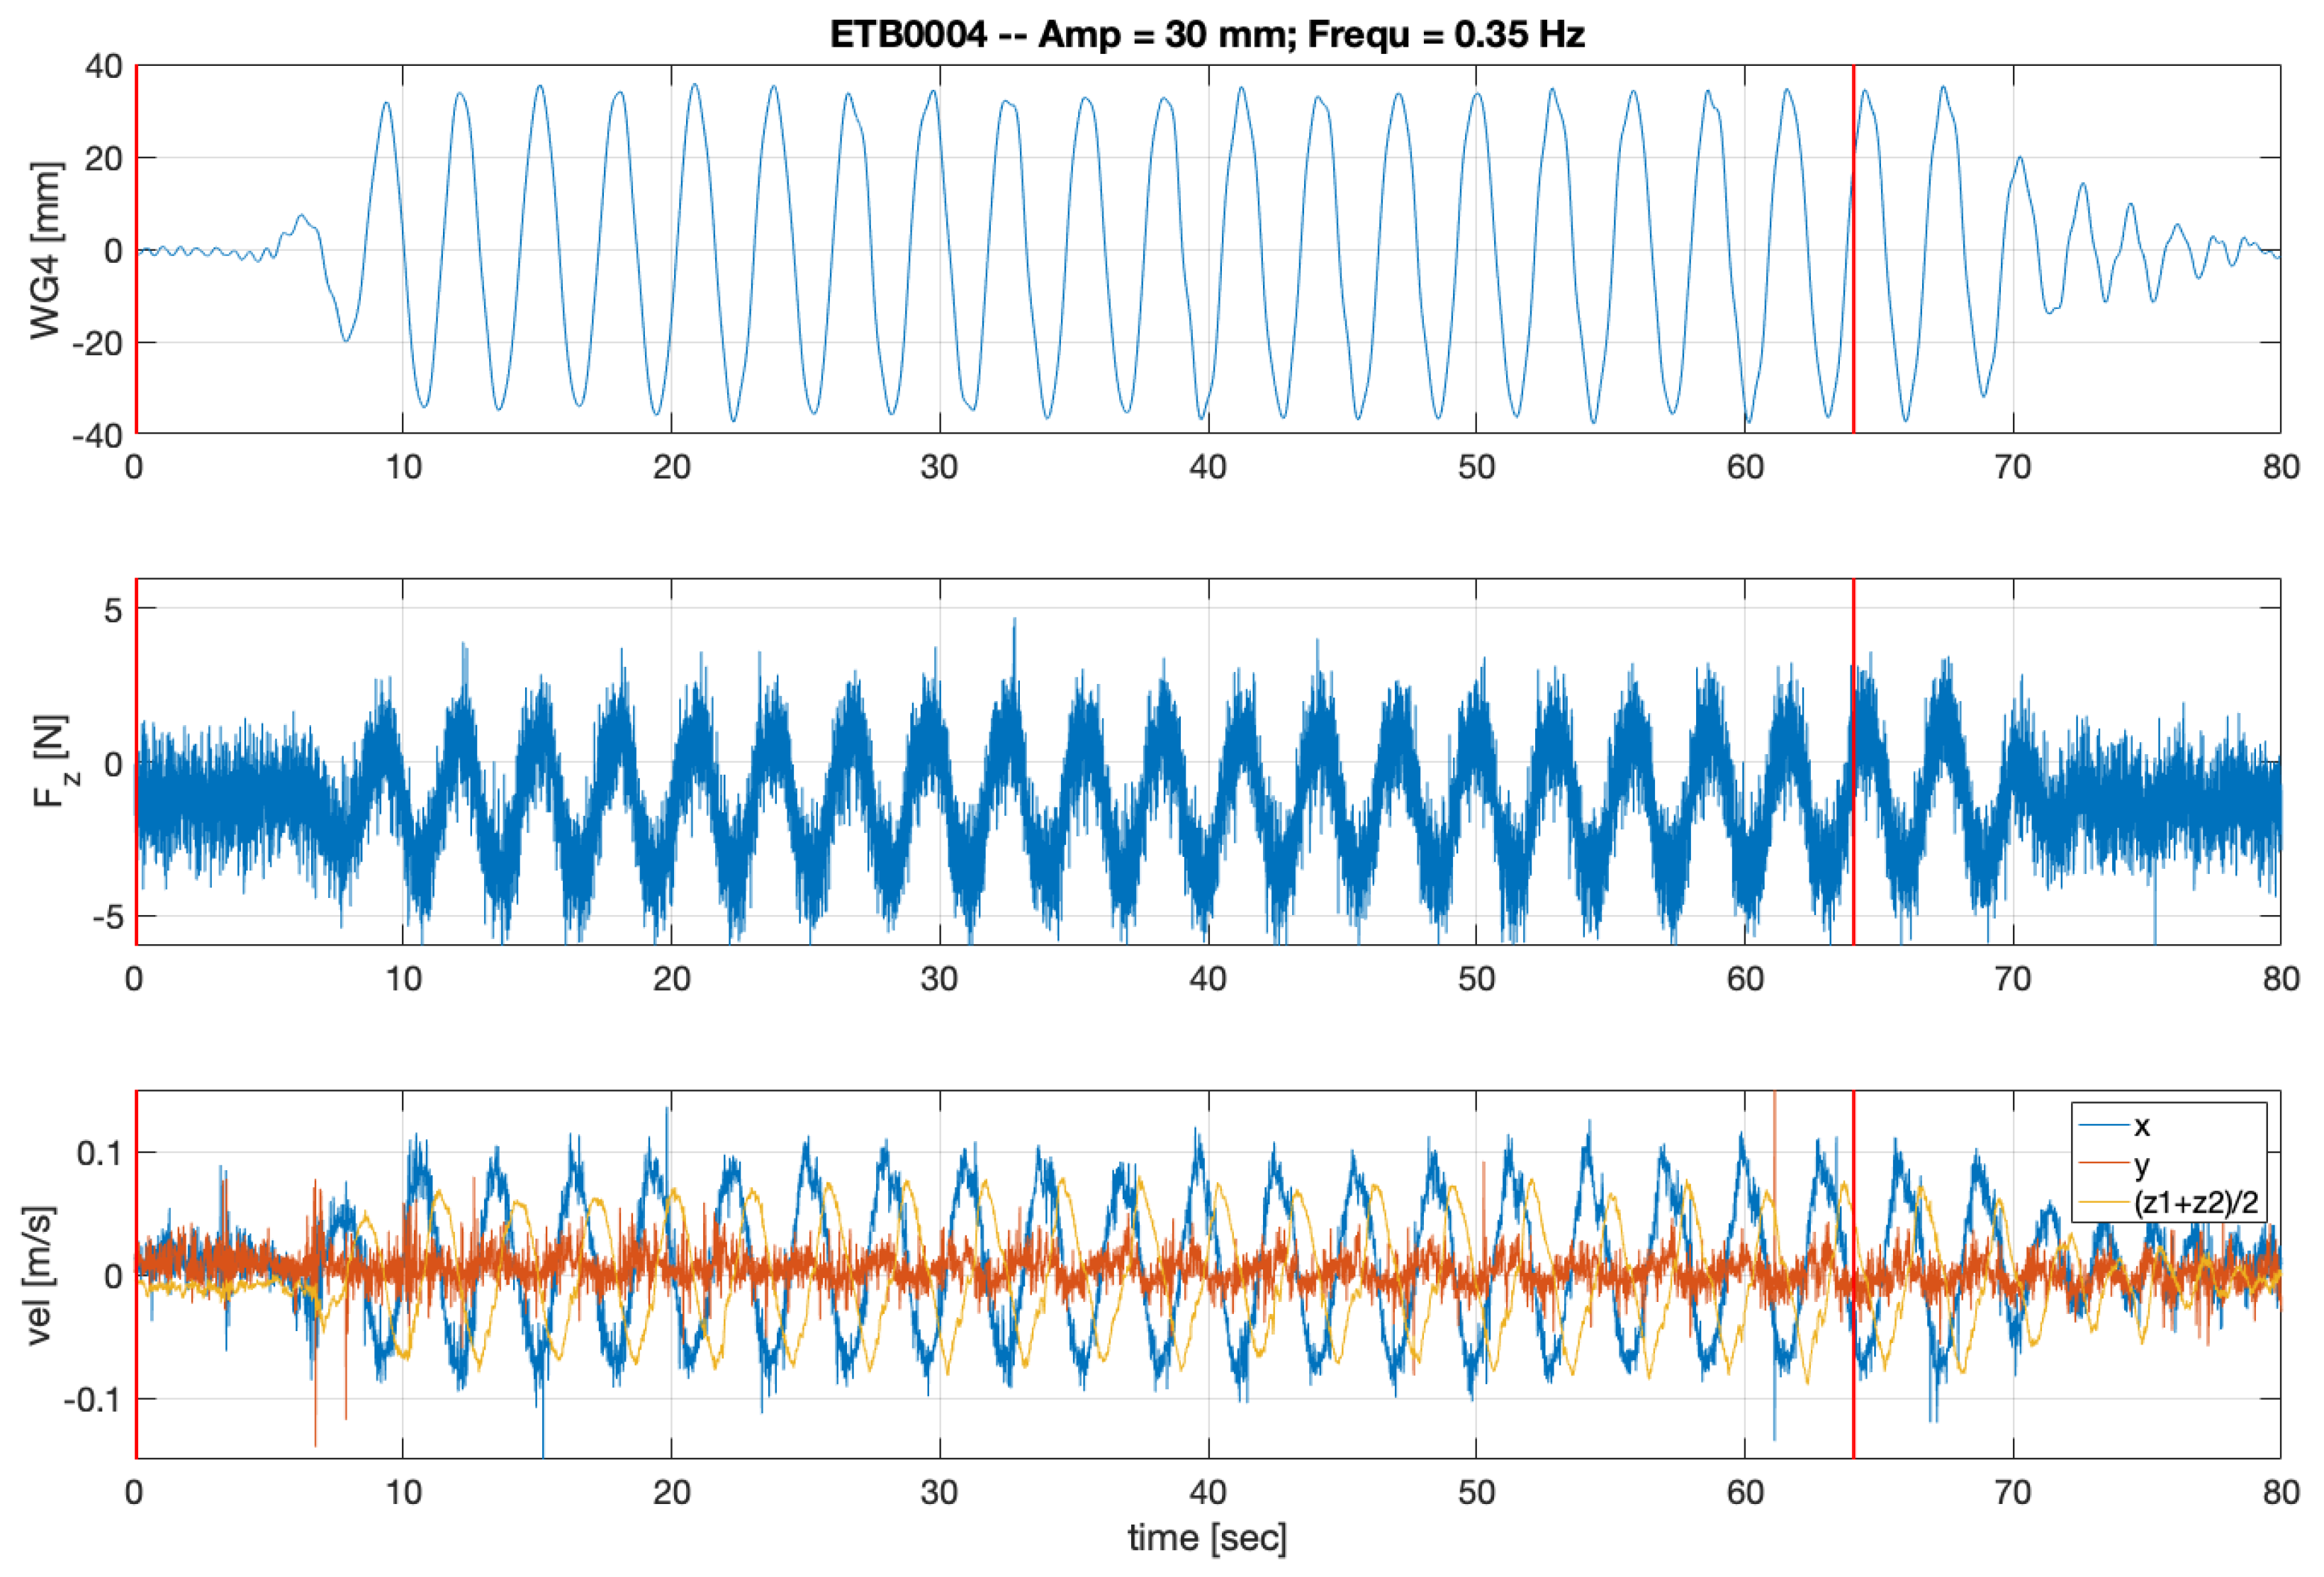
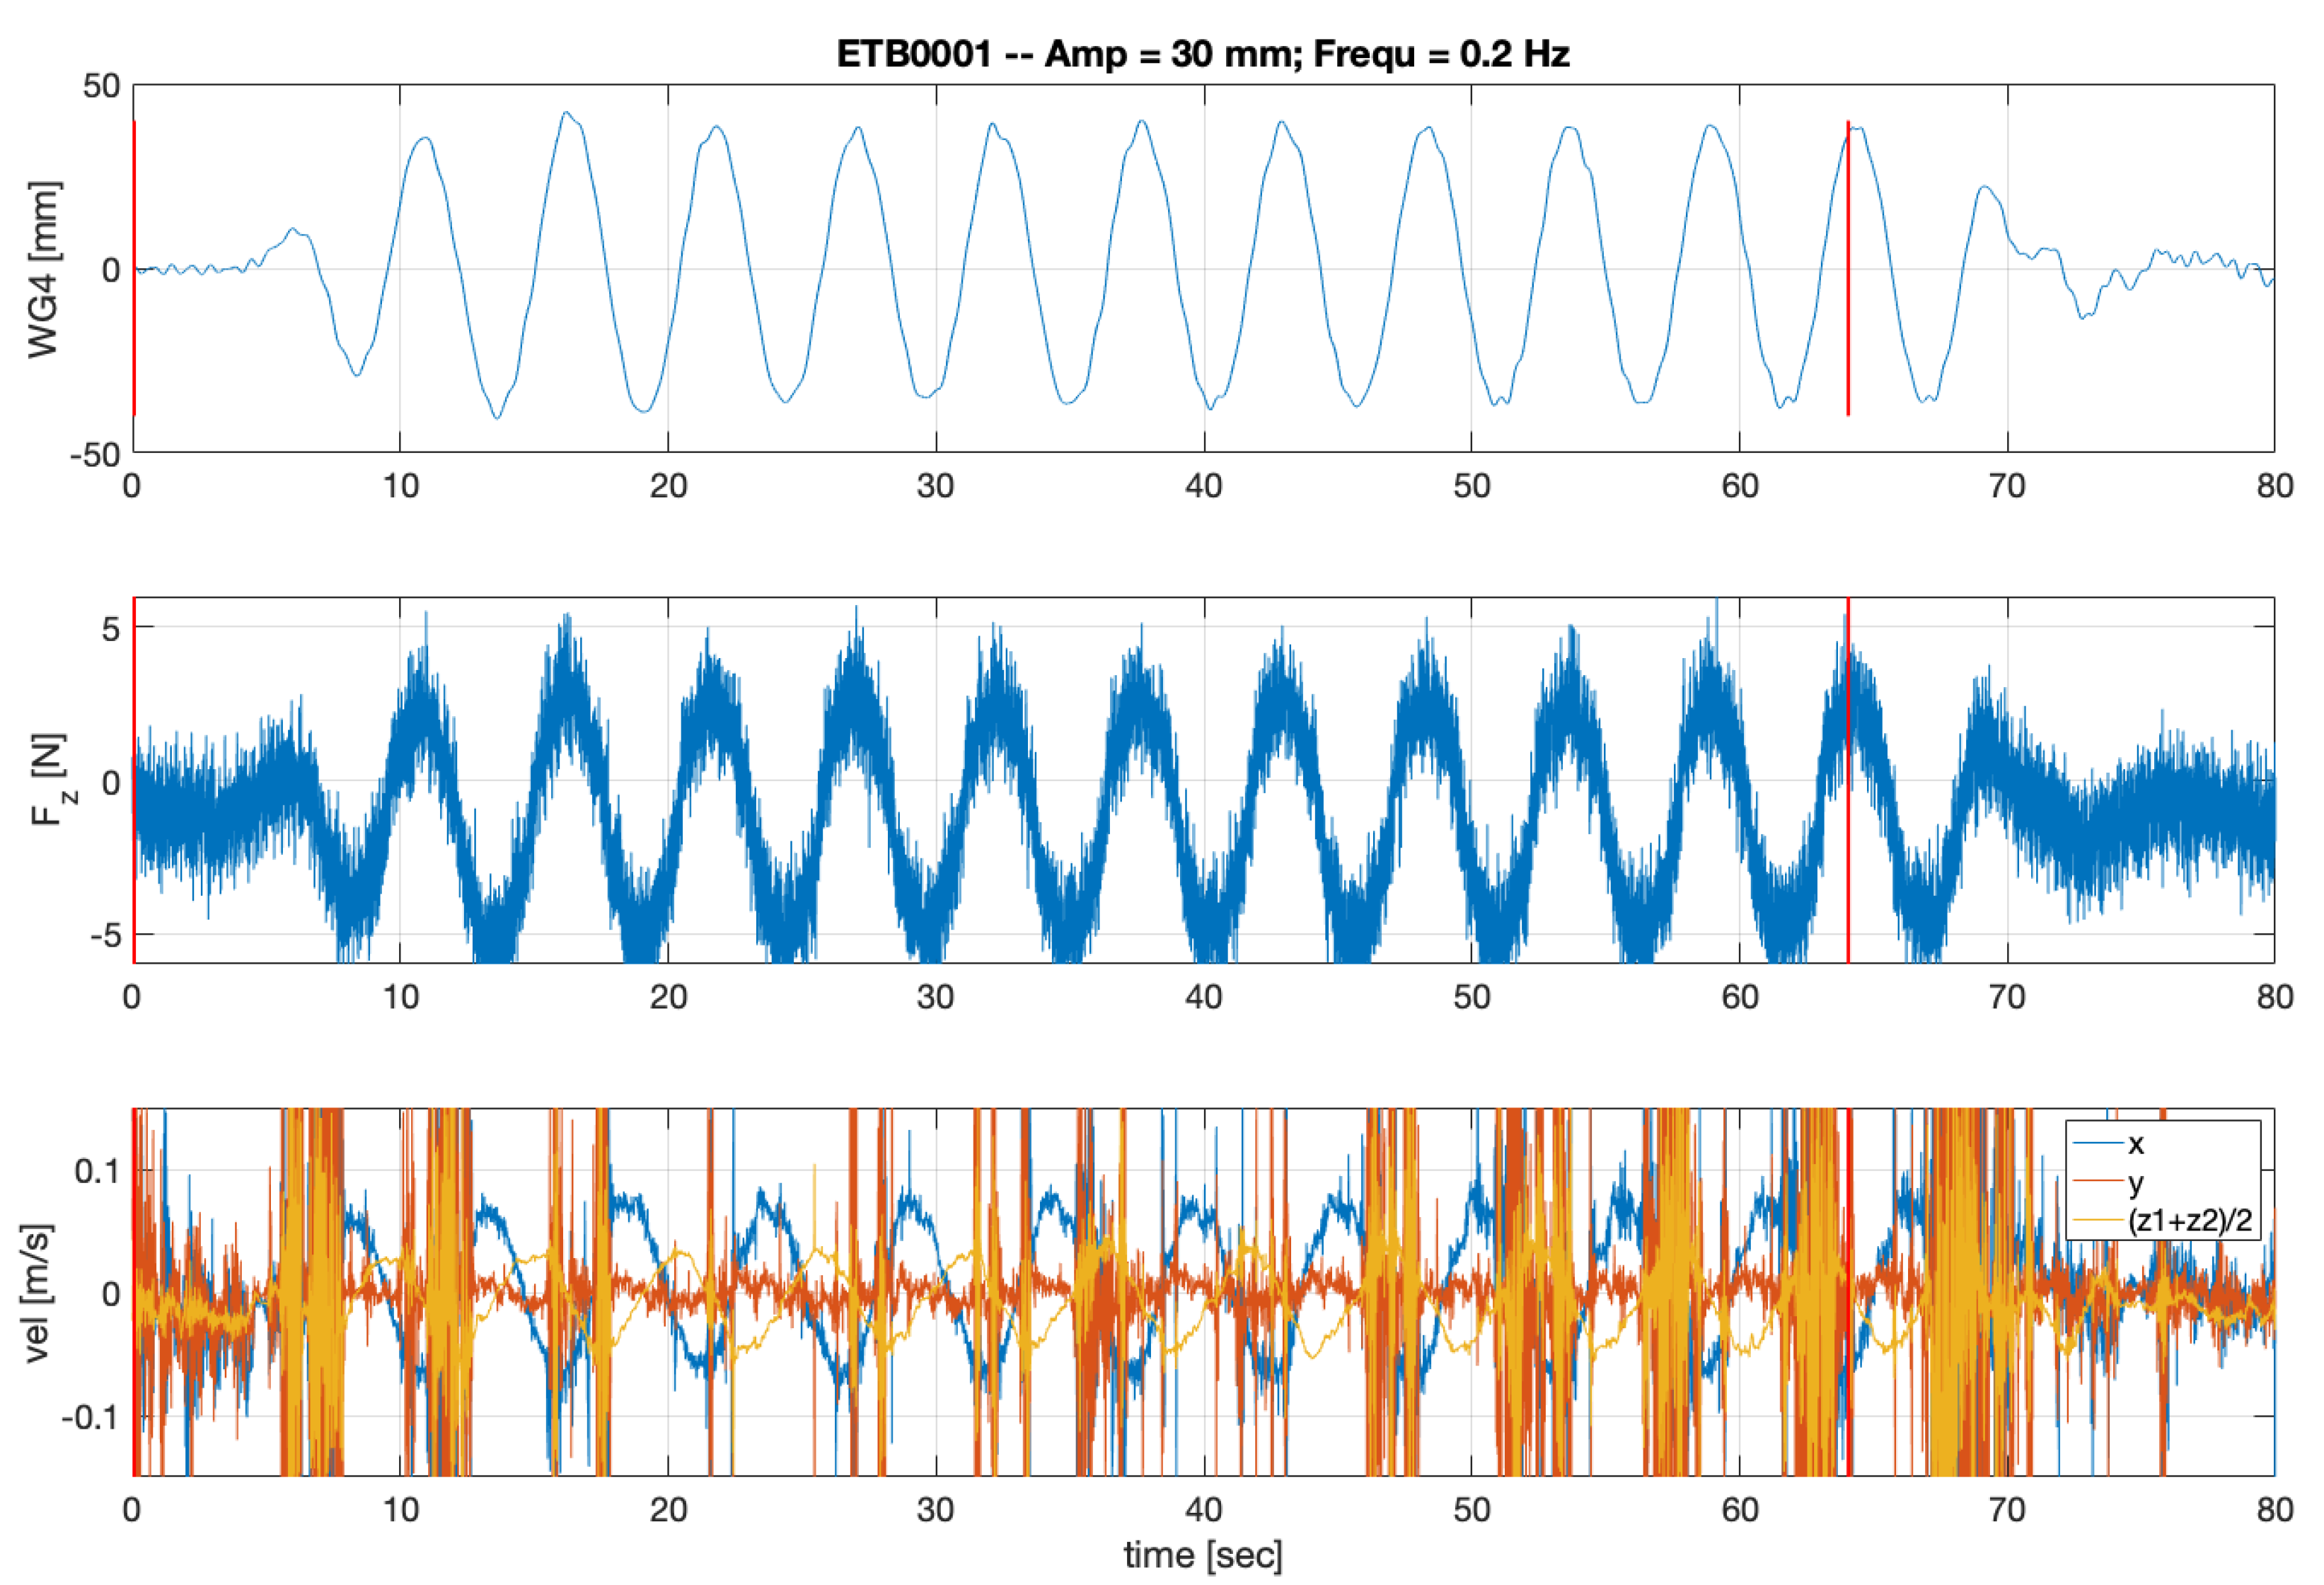
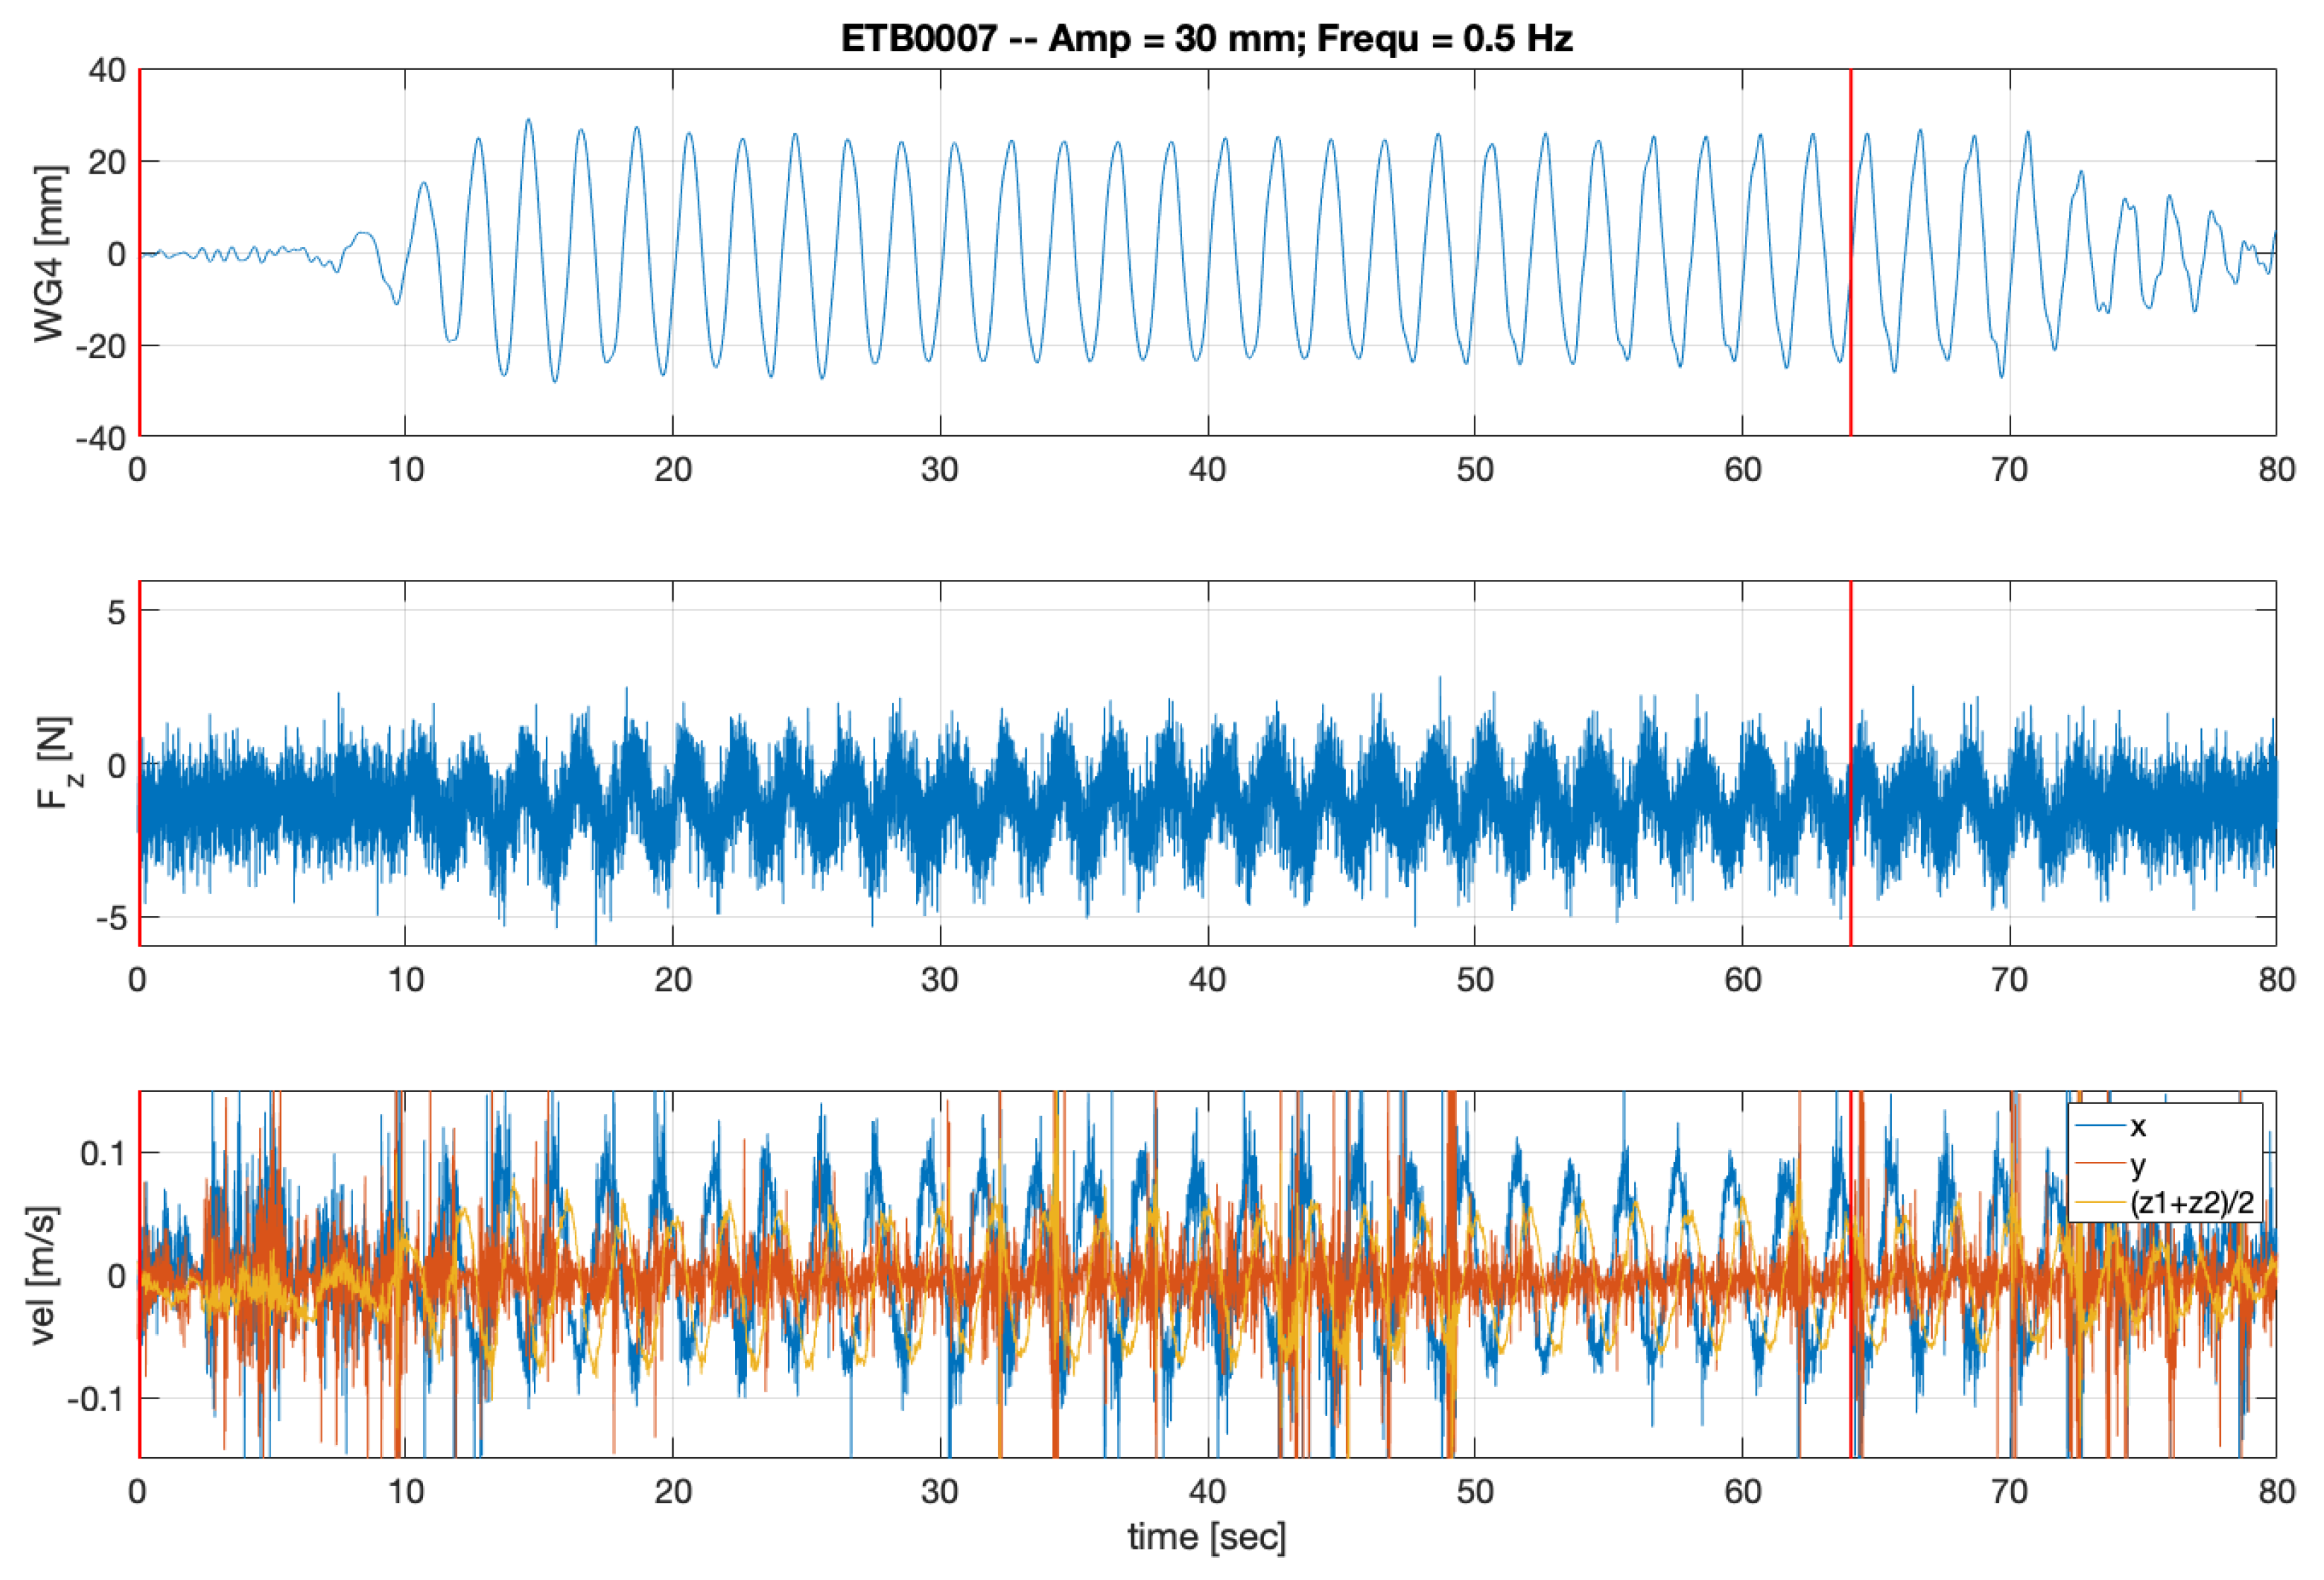
Figure 4 provides an example overview of the time series for the wave case ETB0004 (Table 2). This case represents a regular wave with a requested wave frequency of 0.35 Hz without a current present. This case was chosen as it shows a clear response in the force plate (FP) as well as the ADV measurement. Furthermore, the quality of the ADV measurement was acceptable for this case. Figure 5 presents a case in which the velocity measurements have poor correlation and should be carefully checked (Section 3.2). This is discussed in Section 3.2. The wave gauge (WG) 4 was chosen as it is located directly above the FP (Table 1, Figure 2). The wave introduces a change of the pressure acting on the FP, resulting in a change of the force in the z-direction , which was small relative to the measurement range of the force plate (i.e., 1000 N for the vertical force component), but clearly larger than the noise of the measurement. With increasing wave frequency, this ratio between signal and noise decreases, as exemplified by the results shown in Figure 6. Forces in the horizontal direction and are also available in the provided data set, as well as the measured moments at the FP (Section 4). The third presented time series shows the velocity components measured with the ADV with the x-component aligned into the main wave direction. The vertical velocity component is reported as an average value of and . As mentioned in Section 2.1, the Vectrino uses four beams, resulting in a redundant measurement, and due to a reduced amount of seeding, the quality of the measurement can be significantly impaired. This can be seen in the Figure 5 and Figure 6 showing the similar time series to Figure 4 with a requested wave frequency of 0.2 and 0.5 Hz. Nevertheless, for the extraction of mean velocities, there are sufficient data points with high correlations for all tests. This is discussed further in Section 3.2.
The presented time series is the full capture time covering 80 s in total and starting with the trigger of the wave makers. This time period includes the full run time of 64 s, which is the time the wave makers were active, and an additional 16 s. In Figure 4, the start and the end of the active wave generation are marked with a vertical red line.
The time intervals where reflected waves are present depend on the wave frequency and current velocity relative to the wave propagation direction. To remove the influence of these from subsequent analysis, a time window can be chosen at the beginning of the wave train after the initial ramp up before the reflections reach the measurement location [16]. This approach will facilitate comparison to theoretical force estimates.
3.2. Velocity Measurement
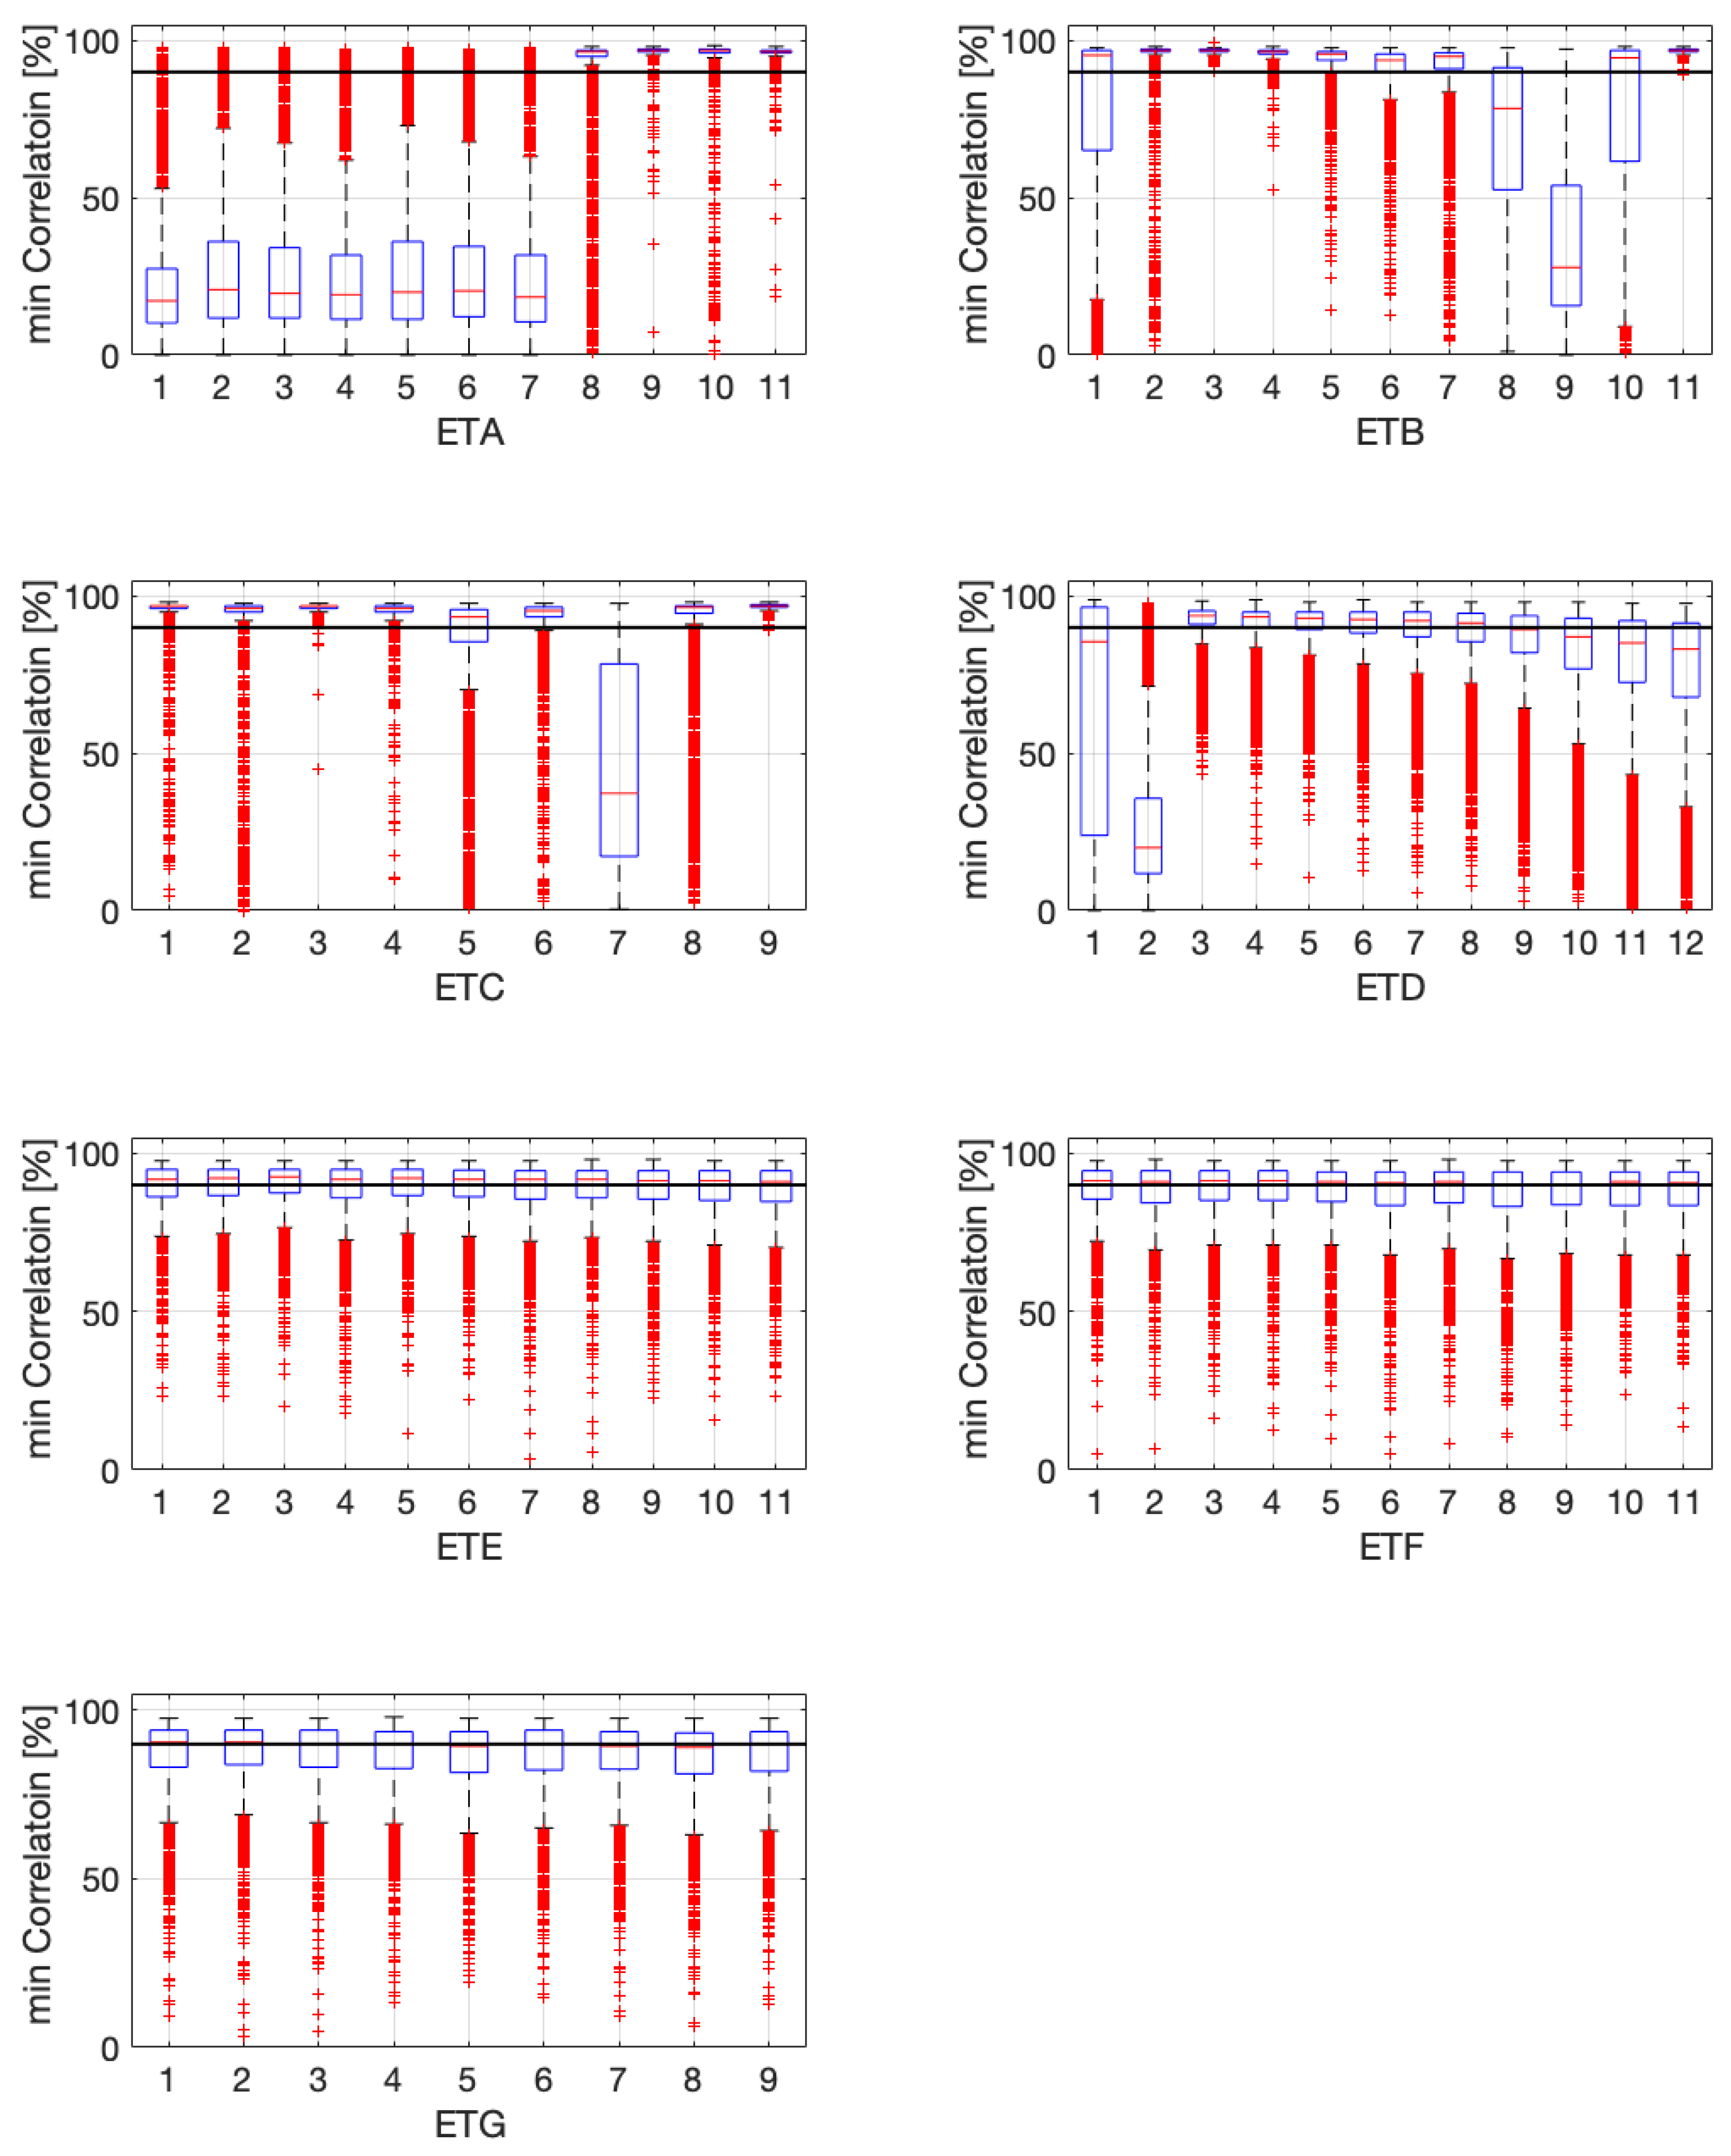
The velocity measurements were included to provide a specific reference velocity at a water depth of 0.2 m under the free surface. In contrast to the other two presented measurements, namely the wave gauges and the force plate, the quality of the velocity measurement is strongly dependent on the density of the suspended seeding material. FloWave contains a total amount of 2.4 million litres water, which is regularly filtered. Consequently, seeding material must be added on a regular basis. As the seeding particles reduce the visibility for the underwater motion capture system, a balance of seeding particles must be found to maintain both the velocity measurements and the motion capture system [4]. For investigation without the motion capture system and therefore without this limitation, the water in the tank can be mixed up first with a higher velocity and rotating flow directions. This mobilises a majority of the seeding material in the full water volume (Figure 1b). For this particular experimental set-up, it was important to ensure that there was no current present for the first sets of wave-only tests. Therefore, to avoid any residual currents, an alternate approach involving a frequent, local addition of a small amount of seeding material was used. This method was not very successful for the first seven runs (wave case ETA). Figure 7 shows the analysis of the quality of the velocity measurements using the correlation as the main quality metric. This value is reported for each of the four beams of the instrument, and for the presented boxplots, only the minimum values of the four beams were used. All figures include a 90% line, which is provided by the manufacturer (Nortek) as a guidance; nevertheless, smaller values can also be used [36]. As each experiment was conducted at constant current velocity with no investigation of turbulence, a mean of measurements above a threshold correlation value should provide reliable measurements of the mean current velocity for a given experiment.
As previously mentioned, the addition of local seeding material has limitations, and the drops in the quality in the wave-only experiments, shown in Figure 7, were caused by the fact that the seeding material moved beyond the measurement area. As these measurements were not seen as critical, the runs were not repeated. The method of the local supply did not work for the current conditions, and the current speed was increased to allow a full mixture of the available seeding material in the tank. This was the reason for the jump in the RPMs from 8 (ETD0002) to the maximum 54 (ETD0003), which is shown in Table 4. For the subsequent measurements (ETE, ETF and ETG), very good correlation values could be achieved. The full values for each individual beam are available in the provided dataset, which is presented in Section 4.
4. Dataset Description
The measured data is available for the full capture time and sorted in three folders, which can be described as the instrument folder: FP includes all the measurement data for the force plate, WG for the wave gauges and Vec for the Vectrino measurements. The files start with ET for empty tank and have an additional letter indicating the type of conditions that are being tested. The ID values and their corresponding conditions are provided in Table 2 for the four different variations of the wave frequencies, the two variations of the wave direction in Table 3 and the current-only cases in Table 4. The name of the individual file and its folder structure is based on the following rules:
Instrument folder/ET [A to G][condition ID] .txt
Table 5 provides an overview of the columns for the files containing the WG data, as well as the used units. Similarly, the FP data is summarised in Table 6 and the velocity measurement with the Vectrino is summarized in Table 7. Each individual instrument used a different measurement frequency, which is described in Section 2.1 and included in the caption of the three previously mentioned tables.
The provided dataset enables the use of data from each individual instrument, namely the force plate, the wave gauges as well as the velocity measurement close to the water surface, but primarily the combined synchronised time series. This allows experimental validation of the bottom pressure induced by the presence of waves and currents. The dataset is available via the Edinburgh DataShare [30].
Author Contributions
Conceptualization R.G., S.D., A.C.P. and T.D.; measurement R.G. and T.D.; methodology R.G., S.D., A.C.P. and T.D., formal analysis, R.G., S.D., A.C.P. and T.D.; writing—original draft preparation, R.G. and T.D.; writing—review and editing, S.D. and A.C.P., funding S.D., A.C.P. and T.D. All authors have read and agreed to the published version of the manuscript.
Funding
This work was supported by the EPSRC Supergen Offshore Renewable Energy Hub [grant no: EP/S000747/1] Flexible Fund support for Accounting for Current in Wave Buoy Measurements.
Institutional Review Board Statement
Not applicable.
Informed Consent Statement
Not applicable.
Data Availability Statement
The data presented in this study are openly available: https://doi.org/10.7488/ds/3120.
Conflicts of Interest
The authors declare no conflict of interest.
Abbreviations
The following abbreviations are used in this manuscript:
| DoF | degree of freedom |
| ET | empty tank |
| F | force |
| FP | force plate |
| M | moment |
| RPM | revolutions per minute |
| TST | tidal stream turbine |
| Vel | velocity |
| WG | wave gauge |
| x,y,z | three main coordinate directions |
References
- Ning, D.; Chen, L.; Lin, H.; Zou, Q.; Teng, B. Interaction mechanisms among waves, currents and a submerged plate. Appl. Ocean Res. 2021, 91, 101911. [Google Scholar] [CrossRef]
- Dong, J.; Xue, L.; Cheng, K.; Shi, J.; Zhang, C. An Experimental Investigation of Wave Forces on a Submerged Horizontal Plate over a Simple Slope. J. Mar. Sci. Eng. 2020, 8, 507. [Google Scholar] [CrossRef]
- Li, X.; Li, Q.; Wang, Q.; Hou, C.; Song, K.; Xie, T.; Zhang, Z.; Wan, X.; Xie, X.; Wang, Y. Numerical and experimental investigation on the hydrodynamic characteristics of an arc-shaped plate-type breakwater under the action of long-period waves. Ocean Eng. 2021, 219, 108198. [Google Scholar] [CrossRef]
- Gabl, R.; Davey, T.; Cao, Y.; Li, Q.; Li, B.; Walker, K.L.; Giorgio-Serchi, F.; Aracri, S.; Kiprakis, A.; Stokes, A.A.; et al. Experimental Force Data of a Restrained ROV under Waves and Current. Data 2020, 5, 57. [Google Scholar] [CrossRef]
- Gabl, R.; Davey, T.; Cao, Y.; Li, Q.; Li, B.; Walker, K.L.; Giorgio-Serchi, F.; Aracri, S.; Kiprakis, A.; Stokes, A.A.; et al. Hydrodynamic loads on a restrained ROV under waves and current. Ocean Eng. 2021, 234, 109279. [Google Scholar] [CrossRef]
- Walker, K.L.; Gabl, R.; Aracri, S.; Cao, Y.; Stokes, A.A.; Kiprakis, A.; Giorgio-Serchi, F. Experimental Validation of Wave Induced Disturbances for Predictive Station Keeping of a Remotely Operated Vehicle. IEEE Robot. Autom. Lett. 2021, 6, 5421–5428. [Google Scholar] [CrossRef]
- Li, Q.; Cao, Y.; Li, B.; Ingram, D.M.; Kiprakis, A. Numerical Modelling and Experimental Testing of the Hydrodynamic Characteristics for an Open-Frame Remotely Operated Vehicle. J. Mar. Sci. Eng. 2020, 8, 688. [Google Scholar] [CrossRef]
- Petrini, F.; Manenti, S.; Gkoumas, K.; Bontempi, F. Structural design and analysis of offshore wind turbines from a system point of view. Wind. Eng. 2010, 34, 85–108. [Google Scholar] [CrossRef] [Green Version]
- Malekjafarian, A.; Jalilv, S.; Doherty, P.; Igoe, D. Foundation damping for monopile supported offshore wind turbines: A review Mar. Struct. 2021, 77, 102937. [Google Scholar]
- Liu, J.; Wan, Z.; Dai, X.; Jeng, D.; Zhao, Y. Experimental Study on Whole Wind Power Structure with Innovative Open-Ended Pile Foundation under Long-Term Horizontal Loading. Sensors 2020, 20, 5348. [Google Scholar] [CrossRef]
- Jiang, Z. Installation of offshore wind turbines: A technical review Renew. Sustain. Energy Rev. 2021, 139, 110576. [Google Scholar] [CrossRef]
- Pasculli, A. Viscosity Variability Impact on 2D Laminar and Turbulent Poiseuille Velocity Profiles; Characteristic-Based Split (CBS) Stabilization. In Proceedings of the 5th International Conference on Mathematics and Computers in Sciences and Industry (MCSI), Confu, Greece, 25–27 August 2018; pp. 128–134. [Google Scholar]
- Schmeeckle, M.W. Nelson, J.M. Direct numerical simulation of bedload transport using a local, dynamic boundary condition. Sedimentology 2003, 50, 279–301. [Google Scholar] [CrossRef]
- Noble, D.R.; Draycott, S.; Nambiar, A.; Sellar, B.G.; Steynor, J.; Kiprakis, A. Experimental Assessment of Flow, Performance, and Loads for Tidal Turbines in a Closely-Spaced Array. Energies 2020, 13, 1977. [Google Scholar] [CrossRef]
- Draycott, S.; Steynor, J.; Nambiar, A.; Sellar, B.; Venugopal, V. Experimental assessment of tidal turbine loading from irregular waves over a tidal cycle. J. Ocean. Eng. Mar. Energy 2019, 5, 173–187. [Google Scholar] [CrossRef] [Green Version]
- Draycott, S.; Payne, G.; Steynor, J.; Nambiar, A.; Sellar, B.; Venugopal, V. An experimental investigation into non-linear wave loading on horizontal axis tidal turbines. J. Fluids Struct. 2019, 84, 199–217. [Google Scholar] [CrossRef]
- Gaurier, B.; Ordonez-Sanchez, S.; Facq, J.-V.; Germain, G.; Johnstone, C.; Martinez, R.; Salvatore, F.; Santic, I.; Davey, T.; Old, C.; et al. MaRINET2 Tidal Energy Round Robin Tests—Performance Comparison of a Horizontal Axis Turbine Subjected to Combined Wave and Current Conditions. J. Mar. Sci. Eng. 2020, 8, 463. [Google Scholar] [CrossRef]
- Noble, D.R.; O’Shea, M.; Judge, F.; Robles, E.; Martinez, R.; Khalid, F.; Thies, P.R.; Johanning, L.; Corlay, Y.; Gabl, R.; et al. Standardising Marine Renewable Energy Testing: Gap Analysis and Recommendations for Development of Standards. J. Mar. Sci. Eng. 2021, 9, 971. [Google Scholar] [CrossRef]
- Xie, M.; Zhang, C.; Li, J.; Li, S.; Yang, Z.; Zhang, H.; Qu, K. Flow structure and bottom friction of the nonlinear turbulent boundary layer under stormy waves. Coast. Eng. 2021, 164, 103811. [Google Scholar] [CrossRef]
- Touboul, J.; Pelinovsky, E. On the use of linear theory to estimate bottom pressure distribution under nonlinear surface waves. Eur. J. Mech.-B/Fluids 2018, 67, 97–103. [Google Scholar] [CrossRef] [Green Version]
- Ingram, D.; Wallace, R.; Robinson, A.; Bryden, I. The Design and Commissioning of the First, Circular, Combined Current and Wave Test Basin. In Proceedings of the Oceans 2014 MTS/IEEE, Taipei, Taiwan, 7–10 April 2014. [Google Scholar]
- Davey, T.; Sarmiento, J.; Ohana, J.; Thiebaut, F.; Haquin, S.; Weber, M.; Gueydon, S.; Judge, F.; Lyden, E.; O’Shea, M.; et al. Round Robin Testing: Exploring Experimental Uncertainties through a Multifacility Comparison of a Hinged Raft Wave Energy Converter. J. Mar. Sci. Eng. 2021, 9, 946. [Google Scholar] [CrossRef]
- Draycott, S.; Sellar, B.; Davey, T.; Noble, D.R.; Venugopal, V.; Ingram, D. Capture and Simulation of the Ocean Environment for Offshore Renewable Energy. Renew. Sust. Energ. Rev. 2019, 104, 15–29. [Google Scholar] [CrossRef]
- Noble, D.R. FloWave Tank Schematics. Figshare 2021. [Google Scholar] [CrossRef]
- Draycott, S.; Steynor, J.; Nambiar, A.; Sellar, B.; Venugopal, V. Rotational sampling of waves by tidal turbine blades. Renew. Energy 2020, 162, 2197–2209. [Google Scholar] [CrossRef]
- Draycott, S.; Nambiar, A.; Sellar, B.; Davey, T.; Venugopal, V. Assessing extreme loads on a tidal turbine using focused wave groups in energetic currents. Renew. Energy 2019, 135, 1013–1024. [Google Scholar] [CrossRef] [Green Version]
- Pillai, A.C.; Davey, T.; Draycott, S. A framework for processing wave buoy measurements in the presence of current. Appl. Ocean Res. 2021, 106, 102420. [Google Scholar] [CrossRef]
- Draycott, S.; Pillai, A.C.; Gabl, R.; Davey, T. Wave buoys in current—Experimental results and observations. In Proceedings of the 14th European Wave and Tidal Energy Conference (EWTEC2021), Plymouth, UK, 5–9 September 2021. [Google Scholar]
- Draycott, S.; Pillai, A.C.; Gabl, R.; Stansby, P.K.; Davey, T. An Experimental Assessment of the Effect of Current on Wave Buoy Measurements. (Under Review).
- Gabl, R.; Draycott, S.; Pillai, A.; Davey, T. Dataset—Bottom Pressure and Free Surface Elevation Including Waves and Current Interaction; University of Edinburgh, Institute for Energy Systems: Edinburgh, UK, 2021. [Google Scholar] [CrossRef]
- Gabl, R.; Steynor, J.; Forehand, D.I.M.; Davey, T.; Bruce, T.; Ingram, D.M. Capturing the Motion of the Free Surface of a Fluid Stored within a Floating Structure. Water 2019, 11, 50. [Google Scholar] [CrossRef] [Green Version]
- Gabl, R.; Davey, T.; Ingram, D.M. Roll Motion of a Water Filled Floating Cylinder — Additional Experimental Verification. Water 2020, 12, 2219. [Google Scholar] [CrossRef]
- MARINET. Work Package 2: Standards and Best Practice—D2.1 Wave Instrumentation Database. Revision: 05. 2012. Available online: http://www.marinet2.eu/wp-content/uploads/2017/04/D2.01-Wave-Instrumentation-Database.pdf (accessed on 29 September 2021).
- AMTI. Description of the Force Platform OR6-7. 2021. Available online: https://www.amti.biz/select%20product%20PDFs/Biomechanics%20force%20platforms/OR6-7%20brochure.pdf (accessed on 29 September 2021).
- NORTEK. Nortek Support Center “Does the Accuracy Differ with Profiling Range?”. 2021. Available online: https://support.nortekgroup.com/hc/en-us/articles/360029820791-Does-the-accuracy-differ-with-profiling-range- (accessed on 29 September 2021).
- NORTEK. Nortek Support Center “How do I Enhance Correlation and SNR?”. 2021. Available online: https://support.nortekgroup.com/hc/en-us/articles/360029819951-How-do-I-enhance-Correlation-and-SNR- (accessed on 29 September 2021).
Figure 1.
Overview picture of the experimental set-up mounted on the gantry (a) and schematic overview of FloWave to indicate the location of the force plate (FP) [24] (b).
Figure 1.
Overview picture of the experimental set-up mounted on the gantry (a) and schematic overview of FloWave to indicate the location of the force plate (FP) [24] (b).

Figure 2.
Details of the coordinate systems and arrangement of instrumentation with a focus on the locations of the wave gauges (WG)—details provided in Table 1. Top view (a) and side view (b) from the gantry.
Figure 2.
Details of the coordinate systems and arrangement of instrumentation with a focus on the locations of the wave gauges (WG)—details provided in Table 1. Top view (a) and side view (b) from the gantry.

Figure 3.
Overview of installed force plate (FP)—installation while the floor is raised (a), current-only conditions (b) and a top plan view including dimensions in relation to the tank centre (T). All lengths are in [mm] (c).
Figure 3.
Overview of installed force plate (FP)—installation while the floor is raised (a), current-only conditions (b) and a top plan view including dimensions in relation to the tank centre (T). All lengths are in [mm] (c).

Figure 4.
Example result for wave frequency of 0.35 Hz—wave case ETB0004. Wave gauges (WG), vertical forces measured at the force plate and velocity measurements are shown (vertical red lines mark active wave makers).
Figure 4.
Example result for wave frequency of 0.35 Hz—wave case ETB0004. Wave gauges (WG), vertical forces measured at the force plate and velocity measurements are shown (vertical red lines mark active wave makers).

Figure 5.
Example result for wave frequency of 0.2 Hz—wave case ETB0001. Wave gauges (WG), vertical forces measured at the force plate and velocity measurements are shown (vertical red lines mark active wave makers).
Figure 5.
Example result for wave frequency of 0.2 Hz—wave case ETB0001. Wave gauges (WG), vertical forces measured at the force plate and velocity measurements are shown (vertical red lines mark active wave makers).

Figure 6.
Example result for wave frequency of 0.2 Hz—wave case ETB0007. Wave gauges (WG), vertical forces measured at the force plate and velocity measurements are shown (vertical red lines mark active wave makers).
Figure 6.
Example result for wave frequency of 0.2 Hz—wave case ETB0007. Wave gauges (WG), vertical forces measured at the force plate and velocity measurements are shown (vertical red lines mark active wave makers).

Figure 7.
Analysis of the minimum correlation for the investigated case to —detailed flow and wave conditions reported in Table 2, Table 3 and Table 4.


Table 1.
Location of the wave gauges (WG) in relation to the local coordinate system with the origin at the centre of the force plate (FP) as well as in the global tank coordinate system indicated with the index T. WG4 was located at centre of the FP. All values are in [m].
Table 1.
Location of the wave gauges (WG) in relation to the local coordinate system with the origin at the centre of the force plate (FP) as well as in the global tank coordinate system indicated with the index T. WG4 was located at centre of the FP. All values are in [m].
| WG1 | WG2 | WG3 | WG4 | WG5 | WG6 | WG7 | WG8 | WG9 | Vectrino | |
|---|---|---|---|---|---|---|---|---|---|---|
| 0.909 | 0.727 | 0.273 | 0.000 | −0.091 | 0.273 | 0.273 | 0.273 | 1.209 | 0 | |
| 0.000 | 0.000 | 0.000 | 0.000 | 0.000 | −0.273 | 0.273 | 1.377 | 0.000 | 1.104 | |
| −0.733 | −0.915 | −1.369 | −1.642 | −1.733 | −1.369 | −1.369 | −1.369 | −0.433 | −1.642 | |
| −0.552 | −0.552 | −0.552 | −0.552 | −0.552 | −0.825 | −0.279 | 0.825 | −0.552 | 0.552 |
Table 2.
Wave conditions with a variable requested wave frequency , actual wave frequency caused by the adaptation to the repeat time and a constant requested wave amplitude equal to 0.03 m. Capture length was 80 s. One pair of each experiment with two wave directions was conducted without a current speed (RPM = 0) and one pair ws conducted with a current speed of 0.2 m/s (RPM = 25).
| RPM | 0 | 0 | 25 | 25 | |
|---|---|---|---|---|---|
| Wave Direction | 0 | 180 | 0 | 180 | |
| [Hz] | [Hz] | ||||
| 0.2 | 0.1875 | ETA0001 | ETB0001 | ETE0001 | ETF0001 |
| 0.25 | 0.25 | ETA0002 | ETB0002 | ETE0002 | ETF0002 |
| 0.3 | 0.3125 | ETA0003 | ETB0003 | ETE0003 | ETF0003 |
| 0.35 | 0.34375 | ETA0004 | ETB0004 | ETE0004 | ETF0004 |
| 0.4 | 0.40625 | ETA0005 | ETB0005 | ETE0005 | ETF0005 |
| 0.45 | 0.4375 | ETA0006 | ETB0006 | ETE0006 | ETF0006 |
| 0.5 | 0.5 | ETA0007 | ETB0007 | ETE0007 | ETF0007 |
| 0.55 | 0.5625 | ETA0008 | ETB0008 | ETE0008 | ETF0008 |
| 0.6 | 0.59375 | ETA0009 | ETB0009 | ETE0009 | ETF0009 |
| 0.65 | 0.65625 | ETA0010 | ETB0010 | ETE0010 | ETF0010 |
| 0.7 | 0.6875 | ETA0011 | ETB0011 | ETE0011 | ETF0011 |
Table 3.
Wave conditions with a variable wave direction and a constant requested wave frequency of 0.4 Hz and a constant requested wave amplitude equal 0.03 m. Capture length was 80 s. One capture of each experiment was performed without a current speed (RPM = 0) and one was performed with a current speed of 0.2 m/s (RPM = 25).
| RPM | 0 | 25 |
|---|---|---|
| Wave Direction [] | ||
| 0 | ETC0001 | ETG0001 |
| −22.5 | ETC0002 | ETG0002 |
| −45 | ETC0003 | ETG0003 |
| −67.5 | ETC0004 | ETG0004 |
| −90 | ETC0005 | ETG0005 |
| −112.5 | ETC0006 | ETG0006 |
| −135 | ETC0007 | ETG0007 |
| −157.5 | ETC0008 | ETG0008 |
| ±180 | ETC0009 | ETG0009 |
Table 4.
Current-only experiments with a variable flow speed fixed with the input RPM of the tank—capture length of 300 s.
Table 4.
Current-only experiments with a variable flow speed fixed with the input RPM of the tank—capture length of 300 s.
| RPM | Velocity [m/s] | Name | RPM | Velocity [m/s] | Name |
|---|---|---|---|---|---|
| 0 | 0 | ETD0001 | 31 | 0.25 | ETD0007 |
| 8 | 0.05 | ETD0002 | 25 | 0.2 | ETD0008 |
| 54 | 0.45 | ETD0003 | 25 | 0.2 | ETD0009 |
| 48 | 0.4 | ETD0004 | 19 | 0.15 | ETD0010 |
| 42 | 0.35 | ETD0005 | 13 | 0.1 | ETD0011 |
| 36 | 0.3 | ETD0006 | 0 | 0 | ETD0012 |
Table 5.
Content of the files including the wave gauge (WG) data—measurement frequency 128 Hz.
| Name | WG1 | WG2 | WG3 | WG4 | WG5 | WG6 | WG7 | WG8 | WG9 |
|---|---|---|---|---|---|---|---|---|---|
| Unit | [mm] | [mm] | [mm] | [mm] | [mm] | [mm] | [mm] | [mm] | [mm] |
| Column | 1 | 2 | 3 | 4 | 5 | 6 | 7 | 8 | 9 |
Table 6.
Content of the files including the force plate (FP) data—measurement frequency 256 Hz.
| Name | Fx | Fy | Fz | Mx | My | Mz |
|---|---|---|---|---|---|---|
| Unit | [N] | [N] | [N] | [Nm] | [Nm] | [Nm] |
| Column | 1 | 2 | 3 | 4 | 5 | 6 |
Table 7.
Content of the files including the velocity measurements—measurement frequency 100 Hz.
| Name | VelX | VelY | VelZ1 | VelZ2 | CorBeam1-4 | AmpBeam1-4 |
|---|---|---|---|---|---|---|
| Unit | [m/s] | [m/s] | [m/s] | [m/s] | [%] | [dB] |
| Column | 1 | 2 | 3 | 4 | 5–8 | 9–12 |
Publisher’s Note: MDPI stays neutral with regard to jurisdictional claims in published maps and institutional affiliations. |
© 2021 by the authors. Licensee MDPI, Basel, Switzerland. This article is an open access article distributed under the terms and conditions of the Creative Commons Attribution (CC BY) license (https://creativecommons.org/licenses/by/4.0/).
Share and Cite
MDPI and ACS Style
Gabl, R.; Draycott, S.; Pillai, A.C.; Davey, T. Experimental Data of Bottom Pressure and Free Surface Elevation including Wave and Current Interactions. Data 2021, 6, 103. https://doi.org/10.3390/data6100103
AMA Style
Gabl R, Draycott S, Pillai AC, Davey T. Experimental Data of Bottom Pressure and Free Surface Elevation including Wave and Current Interactions. Data. 2021; 6(10):103. https://doi.org/10.3390/data6100103
Chicago/Turabian StyleGabl, Roman, Samuel Draycott, Ajit C. Pillai, and Thomas Davey. 2021. "Experimental Data of Bottom Pressure and Free Surface Elevation including Wave and Current Interactions" Data 6, no. 10: 103. https://doi.org/10.3390/data6100103