
Deep Reinforcement Learning for Trading—A Critical Survey

Imperial College London, London SW7 2AZ, UK
Data 2021, 6(11), 119; https://doi.org/10.3390/data6110119
Submission received: 28 October 2021
/
Revised: 10 November 2021
/
Accepted: 12 November 2021
/
Published: 16 November 2021
(This article belongs to the Section Featured Reviews of Data Science Research)
Abstract
:Deep reinforcement learning (DRL) has achieved significant results in many machine learning (ML) benchmarks. In this short survey, we provide an overview of DRL applied to trading on financial markets with the purpose of unravelling common structures used in the trading community using DRL, as well as discovering common issues and limitations of such approaches. We include also a short corpus summarization using Google Scholar. Moreover, we discuss how one can use hierarchy for dividing the problem space, as well as using model-based RL to learn a world model of the trading environment which can be used for prediction. In addition, multiple risk measures are defined and discussed, which not only provide a way of quantifying the performance of various algorithms, but they can also act as (dense) reward-shaping mechanisms for the agent. We discuss in detail the various state representations used for financial markets, which we consider critical for the success and efficiency of such DRL agents. The market in focus for this survey is the cryptocurrency market; the results of this survey are two-fold: firstly, to find the most promising directions for further research and secondly, to show how a lack of consistency in the community can significantly impede research and the development of DRL agents for trading.
1. Introduction
Predicting and analysing financial indices has been of interest in the financial community for a long time, but recently, there has been a wide interest in the machine learning (ML) community to make use of and benefit from the more advanced techniques, such as deep networks or deep reinforcement learning. In addition, the cryptocurrencies market has gained a lot of popularity worldwide, among which Bitcoin makes the top news almost weekly now.
In this survey article, we explore different aspects of using DRL for trading, by first using Google Scholar to obtain a glimpse of what the corpus of papers which use DRL for trading looks like, and then going through the main concepts of interest at the intersection of trading and DRL, such as using different measures of risk for reward shaping and embedding some form of forecasting or prediction into the agent’s decision making. We then explain the contributions of the first DRL paper in more detail [1] and continue by going through the specifics of applying DRL to trading markets. Then, we go deeper into the technologies which look most promising, hierarchical DRL and model-based RL, and finish by stating some of the commonalities and methodological issues we found in the corpus explored. We also state some of the limitations of the current study.
We begin by referring to a few survey articles which are in some way related to this work:
- Ref. [2] looks at model-free methods and is thus limiting. Moreover, it discusses some aspects from a financial-economical point of view: the portfolio management problem, the relation between the Kelly criterion, risk parity, and mean variance. We are interested in the RL perspective, and the need for risk measures is only to feed the agents with helpful reward functions. We also discuss the hierarchical approach which we consider to be quite promising, especially for applying a DRL agent to multiple markets.
- Ref. [3] looks only at the prediction problem using deep learning.
- Ref. [4] has a similar outlook as this work, but the works discussed are quite old, very few using deep learning techniques.
- Ref. [5] looks at more applications in economics, not just trading. Additionally, the deep reinforcement learning part is quite small in the whole article.
We focus more on the cryptocurrency markets, but without loss of generality, since trading is very similar among financial markets, with the only thing differing being the volatility of assets in each market type, with cryptocurrencies being the most volatile. We do advise the curious reader to take a look at the mentioned works, since they provide different perspectives and plenty of resources to further one’s research. Following [6], we take a similar approach to our investigation. We use Google Scholar to search and download all relevant papers (we log in through the respective portal wherever needed using the university subscription), and then we search through them using recoll https://www.lesbonscomptes.com/recoll/, accessed on 8 November 2021 (a free desktop application for advanced searching in documents) to be able to construct the plots in Figure 1 and Figure 2. This is possible for three reasons:
- All papers using DRL for trading will most probably cite the first paper that introduced DQN [1].
- Because of the above reason, we can use the feature in Scholar which searches through the citing articles.
- Google Scholar returns results also present on all other portals such as IEEE, Scopus, WebOfScience, etc.
Figure 1.
Using Google Scholar to explore 152 papers using DRL for trading. (a) Type of action space. (b) Type of market. (c) Frequency of data used. (d) Model-free vs model-based DRL.
Figure 1.
Using Google Scholar to explore 152 papers using DRL for trading. (a) Type of action space. (b) Type of market. (c) Frequency of data used. (d) Model-free vs model-based DRL.

Figure 2.
Various keywords presence.
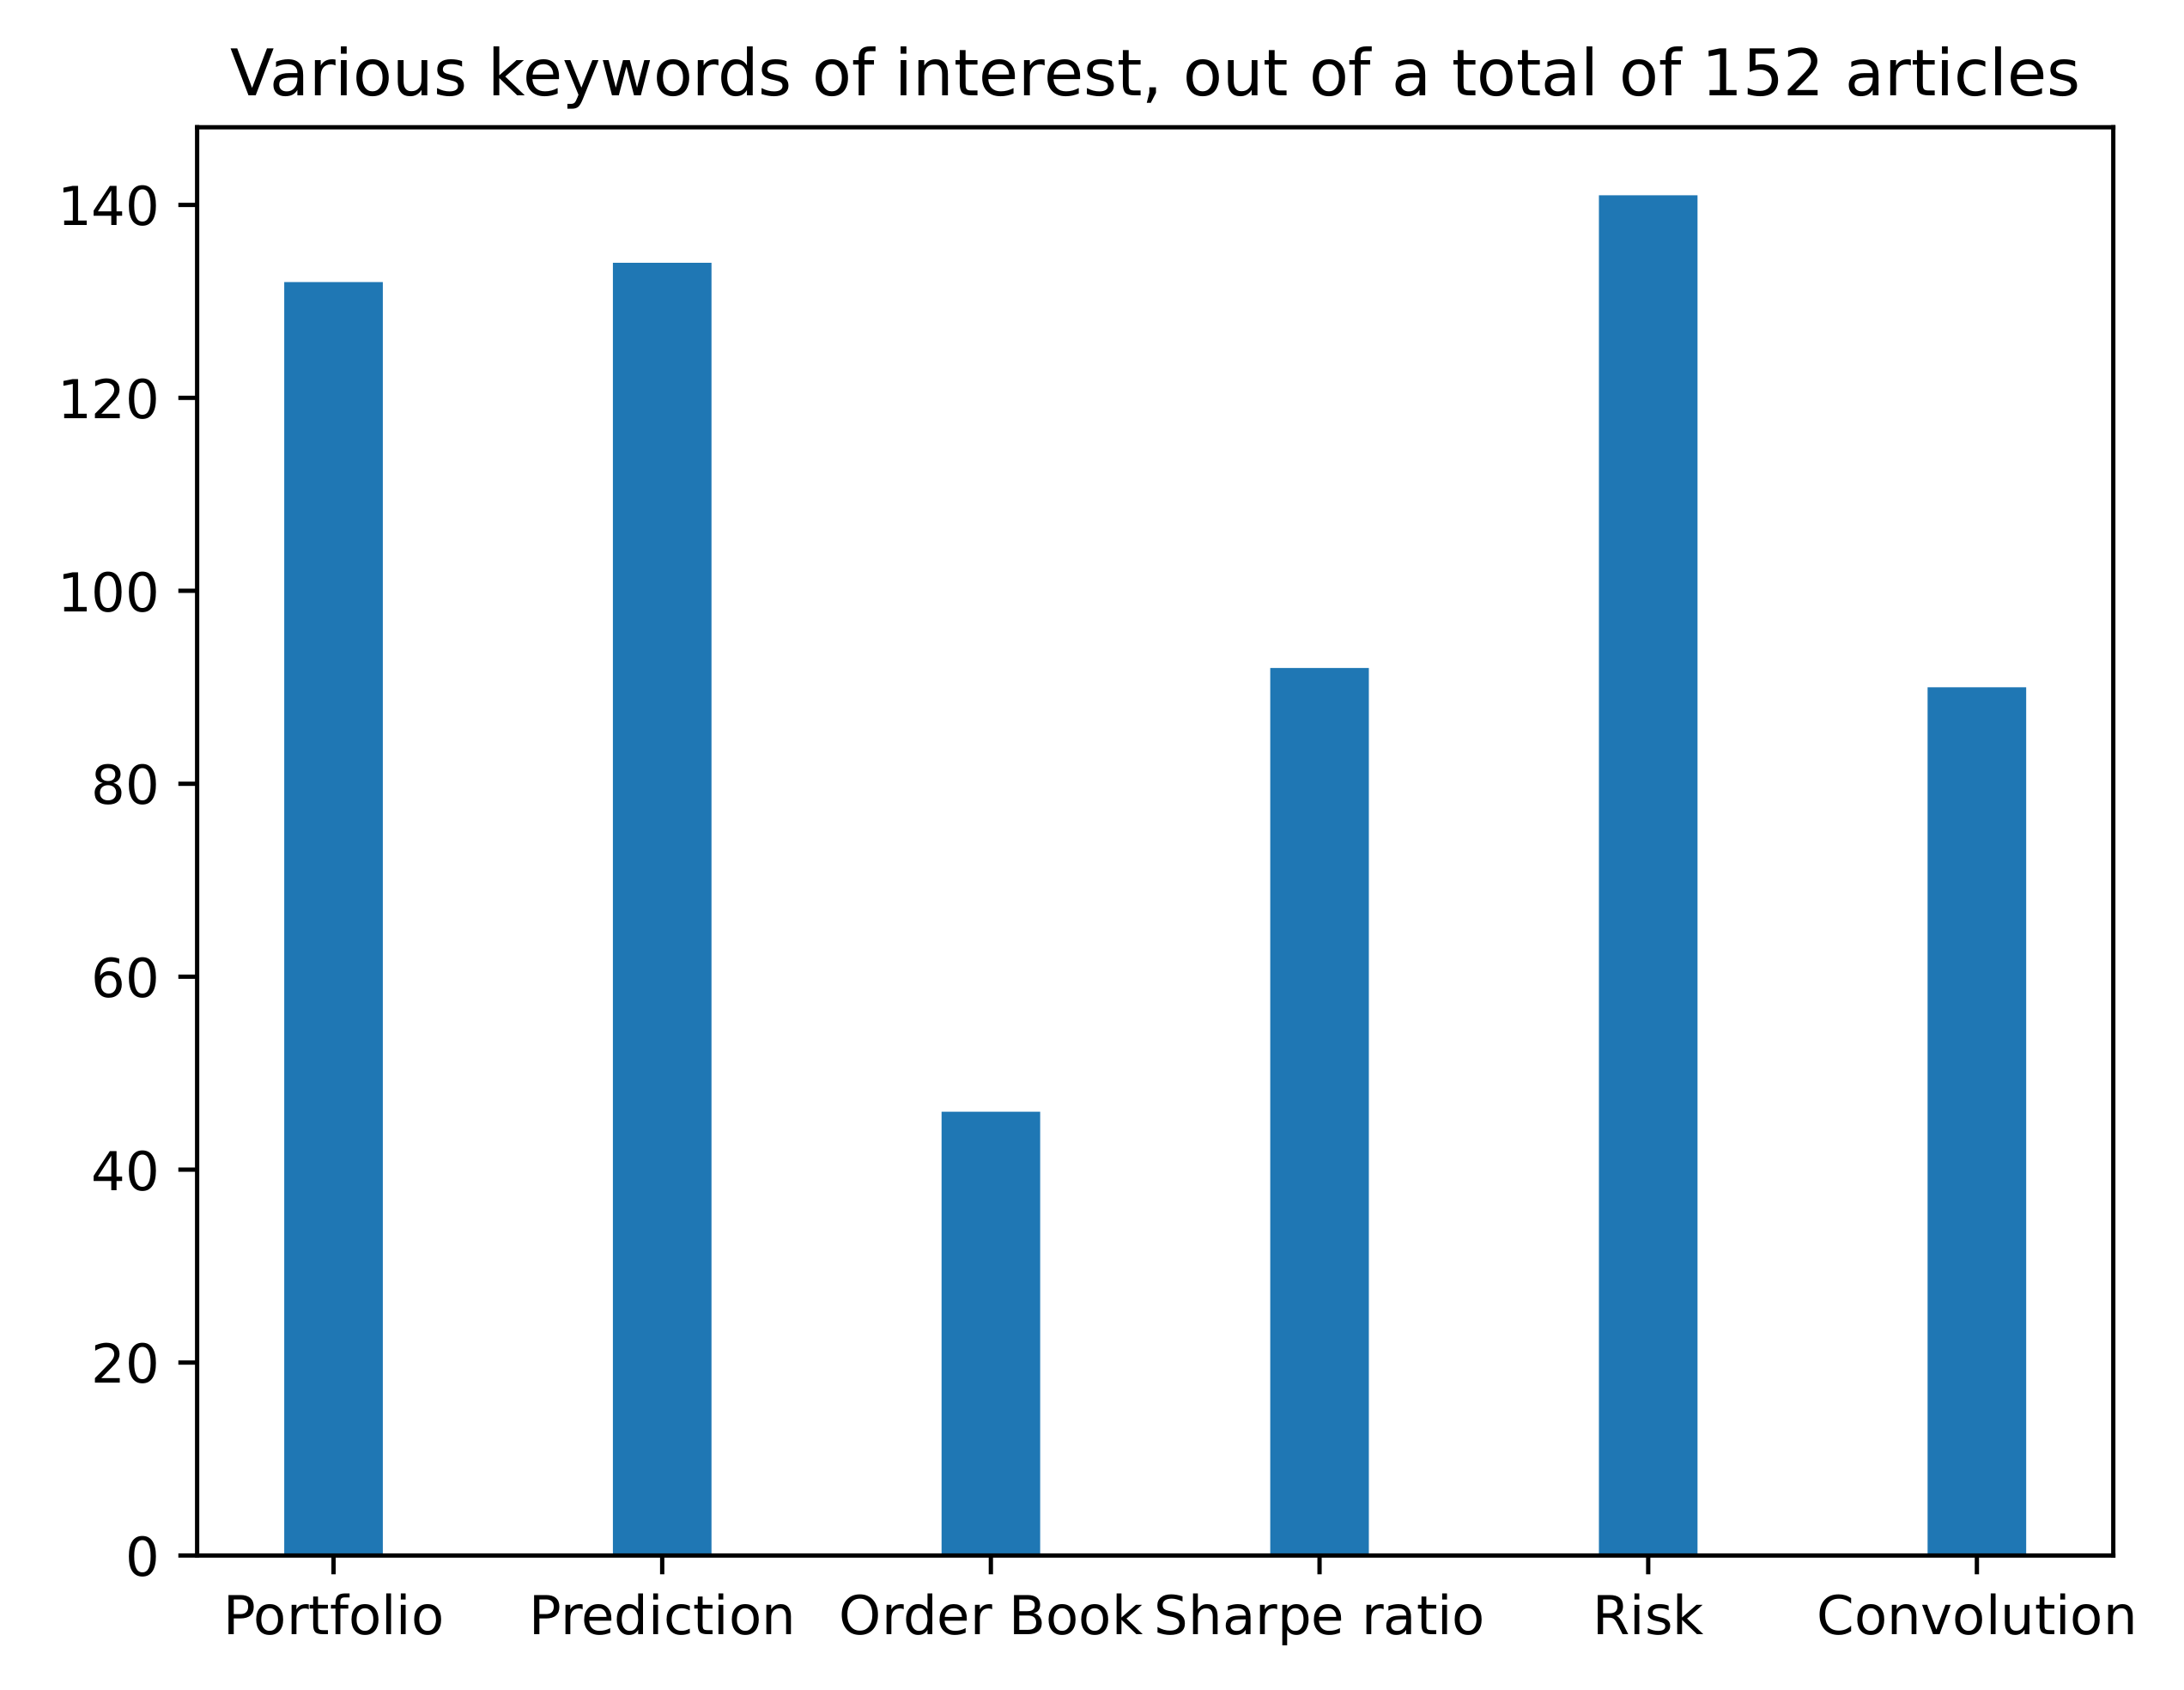
The following data are obtained through this methodology (see Figure 3). The total number of articles citing [1] is 16,652 today (18 October 2021). By adding trading market reward action state as search words, we narrow this down to 401. We have to mention here that we had to put every word between quotation marks; otherwise, Google Scholar seemed a bit stochastic sometimes, in the sense that by changing the position of market in the search query, we obtained a different number of results. By inspecting them, we realise that we can remove some more by eliminating papers which deal with the electricity markets (this is because these markets are quite different than the financial markets discussed), and we can also remove papers which contain the word ’robot’, since these are probably referring to robotics papers. Before this process, we did extract 16 papers which are relevant for our work. After this, we added -electricity -robot, giving us 182 articles, which we then sift through manually and download 98 of them. We independently conducted a separate search, without looking through the citations of the DQN papers. In this way, we obtained 38 articles. In total, we obtained 152 articles. By then searching through them, we investigated the type of action space, state space, market type, and input data and if the papers use some form of prediction or not by using representative keywords (e.g., continuous actions vs. discrete actions). Of course, the following results should be taken with a grain of salt, in the sense that some keywords might appear in the paper, but as references or mentions, rather than actual uses. We think these results provide a rough idea of the underlying structures but definitely not the precise ones. More details are found in Figure 1 and Figure 2.
The cryptocurrency market has been of wide interest for economic agents for some time now. Everything started with the whitepaper on Bitcoin [7]. This is in part due to the fundamentally different principles on which it is functioning (i.e., coins are minted/mined, they are decentralised, etc.) [8], but it is also due to the extremely high volatility the market is experiencing [9]. This means there is room for significant profit for the smart agent but also the possibility of huge losses for the speculative trader. Moreover, the market capitalisation is increasing almost continuously, which means new actors are entering and investing actively in the crypto markets. When looking at the problem of automatically trading on these markets, we can define a few, quite different problems one is facing and which have been tackled separately:
- The prediction problem, where we want to accurately predict some time-steps in the future based on the past and on the general dynamics of the time-series. What we mean by this is that, for example, gold or oil do not have such large fluctuations as the crypto markets. When one is predicting the next point for the price, it is advisable to take this information into account. One way to do this is to consider general a priori models, based on large historical samples, such that we embed this possible, historical dynamics into our prediction model. This would function as a type of general prior information; for example, it is absurd to consider models where gold will rise 100% overnight, as this has never happened and probably never will. However, for the crypto markets, this might not be that impossible, and some of them did in fact rise thousands of percent overnight, with many still rising significantly every day https://coinmarketcap.com/, accessed on 7 October 2021. Deep learning models have been successfully applied to such predictions [3,10,11,12] as well as many other ML techniques [13,14,15]. In the context of RL, prediction is usually done through model-based RL [16], where a simulation of the environment is created based on data seen so far. Then, prediction amounts to running this simulation to see what comes next (at least according to the prediction model). More on model-based RL can be found in Section 10.1. For a comprehensive survey, see [17].
- The strategy itself might be based on the prediction but embed other information as well, such as the certainty of the prediction (which should inform us how much we would like to invest, assuming a rising or bull future market) or other external information sources, such as social media sentiments [18] (e.g., are people positive or negative about an asset?) or news [19], volume, or other sources of related information which might influence the decision. The strategy should be also customisable, in the sense that we might want a risk-averse strategy or risk-seeking one. This cannot be done from a point prediction only, but there are some ways of estimating risk for DRL [20]. For all these reasons, we consider the strategy or decision making a quite different problem than the prediction problem. This is the general trend in the related literature [21,22].
- The portfolio management problem is encountered when dealing with multiple assets. Until now we have been talking only about a single asset, but if some amount of resources is being split among multiple concurrent assets, then we have to decide how to split these resources. At first, the crypto markets were highly correlated (if Bitcoin was going up, then most other cryptocurrencies would go up, so this differentiation did not matter too much), but more recently, it has been shown that the correlation among different pairs is significantly decreasing https://charts.coinmetrics.io/correlations/, accessed on 11 October 2021. Thus, an investing strategy is needed to select among the most promising (for the next time-slice) coins. The time-slice for which one does rebalancing is also a significant parameter of the investing strategy. Rebalancing usually means how to split resources (evenly) among the most promising coins. Most of the work in trading using smart techniques such as DRL is situated here. See, for example, [2,23,24,25,26,27,28]. Not all the related works we are citing deal with cryptocurrency markets, but since all financial markets are quite similar, we consider these relevant for this article.
- The risk associated with some investments is inevitable. However, through smart techniques, a market actor might minimize the risk of investment while still achieving significant profits. Additionally, some actors might want to follow a risk-averse strategy while other might be risk-seeking. The risk of a strategy is generally measured by using the Sharpe ratio or Sortino ratio, which take into account a risk-free investment (e.g., U.S. treasury bond or cash), but even though we acknowledge the significance of these measures, they do have some drawbacks. We will discuss in more detail the two measures, giving a formal description and proposing alternative measures of risk. Moreover, if one uses the prediction in the strategy, by looking at the uncertainty of prediction, one can also infuse a strategy with a measure of risk given by this certainty, i.e., if the prediction of some asset going up is very uncertain, then the risk is high, and, on the other hand, if the prediction is certain, the risk is lower.
We show an overview of the above-mentioned financial concepts, the relations between them, and their RL correspondents in Figure 4.
2. Prediction
Prediction or forecasting of a time-series is the process of estimating what will happen in the next time period based on what we have seen so far. Will the price go up or down, by how much, and for how long? A comprehensive prediction provides a probability distribution (if it is not a point estimate) of these quantities. Many older works deal with the prediction problem in a financial market, assuming the strategy is clear once the prediction is accurate. It is, indeed, so, but quite often the predictions are not correct, and this can significantly impact the performance of the trading strategy. However, it has been shown that some techniques exist which can predict even quasi-periodic time-series, which is quite remarkable, considering the fundamentally chaotic nature of such time-series [29,30]. Depending on the nature of the time-series, the prediction interval is generally one time-step, and for each new time-point prediction, the ground truth is fed back to the network. If the prediction is fed such that multiple time-steps are predicted, the prediction degrades rapidly, due to accumulating errors. However, there are some exceptions (see, for example, [31]). One way to overcome this limitation, is to look at data at a higher granularity (at coarser data). For example, if one looks at minute data (by this, we mean that the prediction machinery is fed with this type of data) to predict 30 min in the future, one needs to predict 30 time-points, whereas if one looks at 30 min data (meaning each point is a summarization of a 30 min time-slice), then there is only need for a one-step prediction. Any strategy built on top of a prediction module is critically dependent on this sampling period. By using multiple different time-scales, one can have a much better picture of the future, especially if the predictions at different levels are combined (for example, using ensembles). Surprisingly, there are not many related works which use such a technique, but there are some [28].
3. Strategy for RL
The strategy for trading can vary widely, depending on its scope, the data sampling rate, the risk quantification choice, and more. We distinguish a few ways to organise the type of strategy:
- Single or multi-asset strategy: This needs to take into account data for each of the assets, either time-based or price-based data. This can be done individually (e.g., have one strategy for each asset) or aggregated.
- The sampling rate and nature of the data: We can have strategies which make decisions at second intervals or even less (high frequency trading or HFT [32]) or make a few decisions throughout a day (intraday) [33], day trading (at the end of each day all open orders are closed) [34], or higher intervals. The type of data fed is usually time-based, but there are also price-based environments for RL [35].
- The reward fed to the RL agent is completely governing its behaviour, so a wise choice of the reward shaping function is critical for good performance. There are quite a number of rewards one can choose from or combine, from risk-based measures to profitability or cumulative return, number of trades per interval, etc. The RL framework accepts any sort of reward: the denser, the better. For example, in [35], the authors test seven different reward functions based on various measures of risk or PnL (profit and loss).
There are also works which discover or learn algorithmic trading rules through various methods such as evolutionary computation [36] or deep reinforcement learning [37].
Benchmark Strategies
When evaluating this type of work using backtests, one needs to have some benchmark strategies to compare with. We have a wide variety to choose from, but we restrict ourselves to just a few for brevity. We list them below in increasing order of complexity:
- Uniform constant rebalanced portfolio (UCRP) [41] rebalances the assets every day, keeping the same distribution among them.
- A deep RL architecture [27] has been very well received by the community and with great results. It has also been used in other related works for comparison since the code is readily available https://github.com/ZhengyaoJiang/PGPortfolio, accessed on 10 October 2021.
4. Portfolio Management
In a financial market, one of the main issues is which assets to invest and which coins to buy. There are many available assets; on Binance (the largest platform for cryptocurrencies by market cap), for example, there are hundreds of coins, and each one can form a pair with a few major stable coins such as USDT (Tether). Thus, the choices are numerous, and the decision is hard. The portfolio management problem deals with allocating cash resources (this can be any stable currency which does not suffer from the fluctuations of the market, a baseline) into a number of assets m. Formally, this means finding a set of weights
where at the beginning, the weights are , which means we only have cash. The goal is to increase the value of the portfolio by selecting the assets which give the highest return. If at the time-step t, the overall value of the portfolio is given by
where is the sell price of the asset i, then . Prices and asset quantities change during trading periods, and when switching back to cash (this is what the above equation does), this new amount should be larger than the previous cash value of the portfolio.
5. Risk
Risk has been quantified (measured) and/or managed (fed as a reward to the DRL agent or part of the reward) through various measures throughout the years. We state below what we consider to be some of the most important ones.
5.1. Sharpe Ratio and Sortino Ratio
One of the most ubiquitous is the Sharpe ratio [44] or the related Sortino ratio. These are performance measures of investments which take into account the risk by considering an extra term, which is a risk-free asset (originally, it was suggested that U.S. treasury bonds be used here). Formally, the Sharpe ratio is defined as
where is the asset return, and is the risk-free return, with E being the expectation over the excess return of the asset return compared to the risk-free return. is the variance of the respective excess, so in the denominator, we have the standard deviation of the excess. To accurately measure the risk of an investment strategy, this should be taken over comprehensive periods, where all types of transactions happen; thus, we need a representative sample for the Sharpe ratio to give an accurate estimate of the risk.
5.1.1. Sortino Ratio
The Sortino ratio is a modified version of the Sharpe ratio where negative outcomes (failures) are penalized quadratically. This can be written as
where R is the average return of the asset of interest, T is the target rate of return (also called MAR—minimum acceptance return), and DR is called the downside risk, is the target semi-deviation (square root of the target semi-variance), and is formally given by
where r is the random variable representing the return (this might be annual), and is the distribution of returns.
5.1.2. Differential Sharpe Ratio
In an online learning setting, as is the case for RL (if using this measure as a reward shaping mechanism), a different measure is needed, which does not require all the returns to obtain the expectation over the returns, which are obviously not available in an online setting. To overcome this limitation, [45] has derived a new measure given by
where and are exponential moving estimates of the first and second moment of , where is the estimate for the return at time t ( is the usual return used in the standard Sharpe ratio, with T being the final step of the evaluated period), so a small t usually refers to the current time-step. and are defined as
5.2. Value at Risk
Another measure for risk is the so called value at risk (VaR) [23,37,46], which specifies with probability at most that a loss greater then VaR will occur and with probability at least that a loss smaller than VaR will occur. It is the smallest number y such that the probability . Formally, the VaR is defined as
where X is the random variable which describes the profit and losses, and is the cumulative distribution function. This can also be seen as the -quantile of Y. However, it implies that we assume a parametric form for the distribution of X, which is quite limiting in practice.
5.3. Conditional Value at Risk
This is also called expected shortfall [23,46] or average value at risk and is related to VaR, but it is more sensitive to the shape of the tail of the loss distribution. It is a more conservative way of measuring risk, since for the wins, the measure ignores the highest profits less likely to happen, and for the losses, it focuses on the worst ones. Formally, CVaR is defined as
and is the indicator function. For more details and for other measures of risk, see https://en.wikipedia.org/wiki/Coherent_risk_measure, accessed on 15 October 2021.
5.4. Turbulence
In [47], the authors use the measure of turbulence to indicate if the market is in some extreme conditions. If this value is above some threshold, then the algorithm is stopped, and all assets are sold. This quantity is time-dependent and is defined as
where is the return of the asset that we are computing the turbulence for at time-step t, and is the mean return of the asset. is the covariance of the returns, with D being the number of assets.
5.5. Maximum Drawdown (MDD)
The maximum drawdown is a measure of downside risk. It represents the maximum loss from a peak to a trough in some period and is given by
where is the through value (the lowest drop an asset reaches before recovering), and is the peak value of an asset in the period of interest. Obviously, this says nothing about the frequency of losses or about the magnitude or frequency of wins, but it is considered very informative, nonetheless (usually correlated with other complementary measures), with a small MDD indicating a robust strategy. The Calmar ratio is another measure which uses MDD as its only quantification of risk. For a comprehensive overview of the Calmar ratio, MDD, and related measures, see [48].
6. Deep Reinforcement Learning
Deep reinforcement learning is a recent field of ML that combines two powerful techniques, the data-hungry deep learning and the older process-oriented reinforcement learning (RL). Reinforcement learning took birth as a heuristic approach, a descendant of dynamic programming. Sutton and Barto in their seminal work [49] established the basis for a whole new field, which would turn out to be highly influential throughout the years, both in neuroscience and ML. In general, reinforcement learning was employed where the data were few and the behaviour was complex. However, recently, because of the advent of deep networks, reinforcement learning has received increased horsepower to tackle more challenging problems. For a comprehensive overview, see [50,51,52]. The general reinforcement learning problem is defined by an agent acting or making decisions in an environment, where the process is modelled as a Markov decision process (MDP).
The MDP is represented by a state space comprising the states the agent can be in, defined by the environment, the action space , which is the set of actions an agent can take, a transition dynamics which gives the probabilities that the agent has of being in a state at time t; taking an action and being in another state at time , i.e., ; and a reward function . An MDP dynamics is assumed to satisfy the Markov property , that is, the next state is dependent only on the previous state and action for any state-action space trajectory. This is generally verbalised as the future being independent of the past given the present. The general goal of the agent is to find a policy which maximizes the discounted future reward, given by , with , a real number called the discount factor, with . The policy is modelled to be stochastic in general and is parameterized by a set of parameters , i.e., , where is the set of probability measures on the action space . The reward is assumed to be given by the environment, but we will see later that auxiliary reward functions (not given by the environment) can significantly improve an agent’s performance. We will state briefly the main paradigms used in finding a good policy, and then we will delve directly into the acclaimed DQN, the first DRL agent introduced in the machine learning community.
We consider the partitioning of the RL algorithms following Silver http://icml.cc/2016/tutorials/deep_rl_tutorial.pdf, accessed on 2 October 2021. The three approaches include value-based RL, where the value in each state (and action) is a kind of prediction of the cumulative future reward. In short, each state has an associated real value number which defines how good it is to be in one state (or to take a specific action being in one state). This is given by the state-value function, usually denoted by , where is the policy which governs the agent and which has one identifier, namely the state, or the state-action value function given by , which has two identifiers, namely the state and action. We will see later that new flavours of the value function exist, where additional identifiers are used: for example, the current goal of the agent (in the case where there are multiple goals). In DRL, the value functions are outputs of deep networks.
The second approach is to represent the actual policy as a deep network, and this is referred to as policy-based RL. In general, the policy networks can be directly optimized with stochastic gradient descent (SGD).
The third approach is model-based RL, where the agents specifically construct a transition model of the environment, which is generally modelled by a deep network. This is sometimes hard, depending on the complexity of the environment, but offers some advantages over the model-free approaches; for example, the model is generative, meaning that the agent can generate samples from its model of the environment and thus can avoid actually interacting with the environment. This can be highly beneficial when this interaction is expensive or risky. Having stated the main approaches, we proceed to the description of the first DRL agent, often referred to as DQN (Deep Q Network) [1]. We show in Figure 5 the much acclaimed architecture of the original DQN. In DQN, powerful deep networks were employed for approximating the optimal action-value function, i.e.,
where are the reward and action at time-step t, each future reward is discounted by a factor of , and is the policy that governs the agent’s behaviour. For the rest of this document, if we do not specify with respect to what variables of the expectation operator are considered, then it is with respect to the state variable. The iterative version is then given by
In general, in reinforcement learning, the optimal Bellman value or action-value function is denoted with an upper . DQN was able to play a few dozens of Atari games with no special tuning of hyperparameters or engineered features. Learning only from pixel data, the agent was capable of learning to play all games with human or almost human performance. This is remarkable for an artificial agent. For the first time, an agent combined the representational power of deep nets with the RL’s complex control with two simple tricks.
The first one is replay memory, which is a type of memory that stores the last million frames (this number can vary as a function of the task, and it is a hyperparameter of the model) from the experience of the agent and avoids the highly correlated consecutive samples arising from direct experience learning.
The second one was brought by replacing the supervised signal, i.e., the target values of the Q-network, or the optimal Q function from the Bellman equation with an approximation consisting of a previously saved version of the network. This is referred to as the target network. Using this approach defines a well-posed problem, avoiding the trouble of estimating the optimal value function. Then, the loss function is given by (we use the notation used in the original DQN paper [1])
where is the uniform distribution giving the sample from replay memory, is the usual discount factor, and is the set of parameters from a previous iteration (this is the second enhancement we mentioned above). This gives the following gradient for the loss:
These two main additions enabled unprecedented performance and adaptability of the deep net and enabled the agent to deal with a relatively diverse set of task: different games but still the same domain, Atari 2600. The work that followed was immense; in Figure 6, we show the number of citations over the years.
We will talk about some of the ideas that extend the current approach, but functionally and theoretically. We will not be discussing practical concerns, even though we are aware of the critical importance of such works and the fact that they effectively enable these algorithms to run in an acceptable time. Deep learning is a relatively small subset of the whole machine learning community, even though it is progressing fast, at an unprecedented rate, due to the relative ease of use and ease of understanding, but also due to the higher computational resources available. Being a visual task, CNNs perform best at playing Atari games, but other types of networks have been used: for example, for text-based reinforcement learning as well [53,54]. More and more tasks will be amenable to DRL as the field embraces the new paradigm and the various existing approaches are adapted to fit these new understandings of what can be achieved. Trading has been of wide interest for a long time in the ML community, and DRL has been viewed as a new set of powerful tools to be used for modelling and analysis on the financial markets.
We now proceed to describe different aspects of training a DRL agent to make profitable trades. The first critical problem is how we present the data for an agent, such that it obtains all the information it needs in a compressed form for reduced dimensionality. This is referred to as the representation learning problem in RL [55], and recently, it has been shown that this can be decoupled from policy learning [56].
7. The Financial Market as an Environment for DRL
We now intend to find the specifics of the trading problem in the context of RL. What do the different modelling choices meant for the DRL agents dealing with trading or multiple asset trading, i.e., portfolio management. The main choices are:
- The data: this is how we sample them, concatenate them, preprocess them, and feed them. This amounts to defining the state space for the DRL agent: what is in a state and how it is represented.
- The actions: what can the agent do at any decision point? Can it choose from a continuous set of values, or does it have a limited choice? This amounts to what type of operations we allow for the agent. If they are continuous, this usually happens for portfolio management, where we have multiple assets to manage and we would like to assign a specific amount of the total wallet value to a specific asset. This then needs to translate into the actual trade-making as a function of the current portfolio holdings. This is generally more complicated, and not all RL algorithms can deal with continuous action spaces out of the box.In the case of a discrete action set for one asset, this amounts to the number of coins to buy/sell which can very from three to hundreds (where three is a simple buy/sell a fixed amount, say one, and hold). For more than three actions, this generally allows more quantities to be bought or sold, with each one representing an increasing number of coins to buy or sell.
- The reward is fully governing the agent’s behaviour; thus, a good choice of reward function is critical for the desired type of strategy and its performance. Since the reward will be maximized, it is natural to think of measures such as current balance or PnL as a possible reward function, and they have been used extensively in the community. However, these are often not sufficient to be able to customise a strategy according to different criteria; thus, measures of risk seem quite an obvious choice, and these also have been used with success in the DRL trading community.
8. Time-Series Encodings or State Representation for RL
There are many ways to encode a time-series, from a simple moving average to high-rank tensors. We will discuss in detail the most widely used encodings for the financial markets. We are interested solely in trading based on price and will not consider other alternatives, such as, for example, limit order books (LOB) https://www.investopedia.com/terms/l/limitorderbook.asp, accessed on 29 September 2021. In short, LOBs are lists of orders which actors on the market are willing to execute. They usually specify a price level and a quantity. Sometimes these are aggregated to give one single value for the price (for example, the first 10 buy orders and first 10 sell orders are weighted by their respective quantities to give a weighted average). We also skip the details of how the news/Twitter feed sentiments are encoded in the state.
8.1. Convolutions
As convolutional neural networks (CNNs) were initially successfully used in vision [57], they gained popularity throughout the wider ML field: for example, in natural language processing (NLP) [58], anomaly detection [59], drug discovery https://www.kqed.org/futureofyou/3461/startup-harnesses-supercomputers-to-seek-cures, accessed on 2 October 2021 and many others. Among these, there is also the application to time-series encoding and forecasting [60]. As we are interested in RL, one way to do it for the state representation of financial time-series is to concatenate the time-series of interest into a tensor, with one axis corresponding to time (usually there are multiple adjacent time-steps fed as a state, the last 5 or last 10 steps) and the other axis corresponding to the different quantities of interest (e.g., open, close, high, low price of a candlestick). We show the graphical representation from [27,40] in Figure 7.
8.2. Raw-Data OHLCV
Due to large variations in the price of different assets, we need to preprocess each one such that they have a standardized form (e.g., between 0 and 1). Using the return, , to normalize prices is often used in the financial market literature. The OHLCV means the open, high, low, close, and volume of one time-point. Many works use this representation, concatenating the last few time-steps as a single state for each point. A variation on this is to obtain features from the raw data, which is often quite noisy, by preprocessing it with a Kalman filter and then extracting features with an autoencoder and/or SVD for time-series [61].
8.3. Technical Trading Indicators
8.4. Correlated Pairs
In one work [66] dealing with the FX market, the authors use three related pairs to predict one. The same can be done for the crypto markets, where we use inputs of correlated pairs of cryptocurrencies (e.g., for predicting BTCUSD, we might use ETHUSD, BTCEUR, ETHBTC, etc.). This assumes that there is a lot of information in the related pairs such that we obtain a more informative dynamics than in the predicted time-series alone.
8.5. Historical Binning or Price-Events Environment
One interesting way to transform the continuous trading environment (i.e., price) is to discretize the price and transform the time-series such that it can take only a fixed number of values. If the price change is between the threshold values, then no effective change is seen by the DRL agent. This, in fact, compresses the time-series and transforms it into being price-event based instead of time-event based [35]. It is a way of simplifying the time-series, making it more relevant for trading and removing some of the noise existing in the original data. Due to the shorter time-series produced in this way, agents using this transformation should train faster. We can also combine the two approaches, where we keep the time component, but we still discretise the price value. We show both approaches in Figure 8. We embark on developing more types of environments (among them being the one in Figure 8b, where we modify the incoming data on the fly by, for example, artificially augmenting rises or drops). This should make agents more sensitive to one or the other and thus change their behaviour into being risk-seeking or risk-averse.
8.6. Adding Various Account Information
Some of the authors add to the state of the RL agent the price or quantity of the last buy, the current balance of the portfolio, or the specific stocks held and their respective quantities. There does not seem to be a general conclusion for what sort of information is useful in the state of the agent, as agents can be widely different, and the optimal choice is specific to each. For more information, see Table 1.
9. Action Space
The action space is generally the simple discrete , but there are some which use more actions to denote a different number of shares or quantity to buy or sell, as in [74]. If dealing with multiple assets, either a continuous multi-dimensional action space is used, or the problem is split into selecting the number of shares/quantity (for example, with a deep learning module [75,76]) and separately selecting the type of order (buy, sell).
10. Reward Shaping
The reward is the most important part when dealing with a DRL trading agent. Most works use the direct profit from a transaction or a longer term profit (even after a full episode, but episodes can vary in length from a few hundred time-steps to thousands). The other group of reward functions is based on various measures of risk (for a comprehensive overview see [35]). Even the number of transactions can be used [77].
We described in detail in Section 5 various measures of financial risk which can be used as a dense reward shaping mechanism. Generally, the rewards are sparse for complex environments, and we know from Section 11 that giving agents auxiliary rewards which are dense can help a great deal in improving performance and the speed of learning. Some measures do have limitations, in the sense that they can only be computed after a reasonable estimate of some expectation is computed, which can suffer from significant sampling bias; thus, the measures computed online are more suitable for DRL.
We have seen how computing turbulence can give a strong insight into the current regime of the market and how using VaR can directly give us a set of probabilities for our potential profits or losses, whereas CVar can be used to bias our strategy to focus more on the losses than on the profits. Choosing an appropriate measure of risk to work as a reward for DRL agents, combining more of them, or perhaps weighing them according to the current market development would provide additional benefits to the ability to customise a trading strategy based on the affinity towards risk. Thus, one solution to adapt to the changing market conditions or regimes could benefit from changing (some parameters of) the reward function based on some measure of these changing conditions.
10.1. Model-Based RL
In general, model-based methods are more data efficient, or have lower sample complexity, but are more computationally intensive. There are many approaches in the general RL literature, both parametric and non-parametric, most notably [78,79,80], but we are interested in describing, in this work, just a few approaches used in deep RL. Both model-free and model-based methods are known to exist in the brain [81], but the cognitive sciences differentiate between the types of tasks which employ each. Model-based decision making is shown to be used when the task is outcome-based, so one is interested in the unfolding in time of the sequence of states and actions (and sometimes rewards), while model-free methods are used when the decision making is mostly concerned with the value of an action (e.g., moral judgements; this action is good because it is moral). For DRL, however, model-based approaches are quite scarce, probably due to the high complexity of models that need to be learned and the variety of models needed for the tasks that DRL is usually applied to. For example, TRPO deals with a number of classical control tasks and Atari games; it would be quite hard to derive a model-building technique easily applicable to both of these domains. Even the Atari games are so different from one another that a general model-building algorithm for all of them (the 50 games used more often in the DRL literature) would not be trivial.
Model-Based RL in Trading
As we mentioned earlier, model-based RL implies the creation of a model or simulation of the environment. This simulation is then run to produce different (if it is run multiple times and it is a stochastic model) possible predictions for the future. One such example is the work in [73], where the authors learn a model of the time-series which is a summary of a limit order book with an MDN after encoding (or extracting features from) the LOB with an AE [82]. They then use this model to learn from it with an RL agent and without requiring interaction with the actual environment. In [23], the authors test two prediction models, the NDyBM and WaveNet adapted to multi-variate data. The predicted data are the close, high, and low percentage change in the asset price value. With a couple of additional modules (data-augmenting module and behavioural cloning module), the overall architecture is applied to a small number of US stocks data successfully.
10.2. Policy-Based RL
There are many approaches which use policy-based RL algorithms combined with other techniques.
For example, in [76], the authors use a supervised learning module (autoencoder) to predict the next time-step of the price, which was then used in signal representation for RL. This learns, through a combined reward function, both the prediction and the policy. They also use temporal attention and an interesting set of features in addition to the OHCLV price and a set of technical indicators, which is called cointegration and is a measure of the stationarity or linear stability of a sum of two different stocks. There is also a preprocessing step of gate-based feature selection among all these, where a gate similar to the ones in GRU and LSTM is present for each stock and is learned end-to-end.
There are many contributions and additions from this paper, training and testing on 2000 and 3000 steps, respectively, for 20 years with an annual rate of return of about in a bull and in a bear market. A larger scale test (55 stocks) shows a annual return. One of the most well-received papers is [27], where the authors apply their portfolio management DRL to 65 cryptocurrencies on Poloniex, on 30 min data, concatenating the last 50 time-steps and all assets into one large tensor with 3 being the number of features (high, low, and the so-called return ), where the is the open price for time t, and is the close price for time . The algorithm used is DDPG [83] with the action-space , with m being the number of coins (11 plus cash). The architecture is called EIIE (Ensembles of Identically Independent Evaluators) because to some degree, each stream is independent, and they only connect at the output, even though they are sharing the weights among them. They also add the previous portfolio value before the softmax output as to minimise transaction costs. The results are remarkable, compared to the baseline strategies tested (up to almost 50× the initial investment). It is interesting to note the large training set (2 years) compared to the test set (50 days). They test 3 different topologies, a CNN, a simple RNN, and an LSTM, with all three performing significantly better than any other strategy tested.
11. Hierarchical Reinforcement Learning
DRL works great on a wide class of problems, where the state space and action space are reasonably small (there are flavours of DRL, such as deterministic policy gradient [83], which can deal with continuous action spaces as well, so in theory, an infinite number of actions). However, there are certain problems where DRL is insufficient or takes too much time to train. A divide-and-conquer extension for DRL is hierarchical reinforcement learning (HRL) where the overall problem is split into somewhat independent subproblems. Either the action space is divided into smaller partitions or the state space or both. The most appealing aspect of HRL is that the agent higher in the hierarchy gives goal information to the level below and thus rewards based on how well the agent is doing with respect to the goal being pursued. This means that auxiliary rewards (rewards which are given to the agent in addition to the environment rewards, usually defined by the programmer; see, for example, [84]) can be learned rather than hard-coded. This is a huge milestone in DRL since the rewards are fully governing an agent’s behaviour. There are many different architectures for HRL, each inheriting some of the traits of the original flat RL, some with engineered dynamics between the agents, while others learn this as well. HRL holds the promise of scaling DRL to large sets of different problems, because agents in lower levels learn how to solve specific narrow tasks, or skills, whereas going up the hierarchy, the agents learn more general behaviour and how to select between the agents in lower levels. Transfer learning also comes more naturally in HRL due to the advantages mentioned above.
HRL in Trading
There is little research of HRL in trading, but some works exist; see, for example, [22,25,26,72]. HRL is used in different ways in the mentioned works, each of which we will discuss in detail.
In one of the works, [26], the authors use HRL to manage a subset of the portfolio with an individual, low-level agent. Of course, the principle can be applied repeatedly, where a few flat agents (we call flat agents the lowest level agents which interact with the actual trading environment) are controlled by a higher level agent (level 1); then, a group of agents at level 1 is controlled by an agent at level 2, and so on. In this way, an arbitrary level hierarchical agent can be formed.
This type of partitioning deals with the state space (since each DRL agent will receive only the prices for the stocks that it is managing) and action space (will output only actions for specific stocks), but there is no shared dynamics between the levels of the hierarchy. However, there is information sharing in the form of the weight vector for each agent coming from the level above. Even though this approach is quite simplistic, it is also quite natural and partitions the overall problem into smaller subproblems which can be solved individually without loss of expressivity.
In a second line of work, [22] considers the problem of prediction and order execution as two separate problems and first uses one network to predict the price and another network which uses this prediction (concatenates it to the original state) to execute the orders. Even though this is not, strictly speaking, HRL, since the problem is not partitioned into smaller subproblems, and one cannot form an arbitrary level hierarchy (as in the previous work) based on these principles (there is no goal giving, etc.), there is information sharing between the agents. We would classify this work in the domain of multi-agent systems, where each agent is assigned one specific task, and they communicate to reach the overall goal. Unrelated, but worth mentioning, is the fact that this work also applies a simple version of causal attention which seems to improve the profitability of the strategy on stocks.
A somewhat related work (by the same principal author) uses HRL in [72] to now partition the trading problem into first estimating the quantity to be bought, held, or sold and then actually choosing one of the three actions. This is somehow unintuitive since the operation to be performed seems more important than the actual quantity, so first choosing a quantity and the choosing what to do with it seems quite far-fetched. Again, there is no partitioning of the state space (the quantity estimated is just concatenated to the original state) and no goal setting or reward giving by the high-level agent. However, there is an interesting contribution: the authors add a surprise term to the reward (coupled with the mellowmax operator) which makes the reward surprise agnostic, the authors state. One last work we found in this narrow HRL for trading subfield of RL is [25] which tackles a practical problem in trading, i.e., once we know what we want to invest in in the long run, how can we go about minimising the transaction cost in the short run? Even though this hierarchy only has two levels, it leverages the ability of HRL to deal with multiple time-scales to make decisions. The high-level agent decides which assets to hold for some larger period (they call it the holding period), and the low-level agent decides how to buy these assets (and/or sell them to reach the desired portfolio configuration) such that transaction costs are minimised through a shorter period (the trading period). The authors use limit order books for states, which are higher dimensional and require more resources (see more details in Section 8).
12. Conclusions
As a conclusion to this work, we mention some of the commonalities between papers and some methodological issues which arise, and if solved, could benefit the community significantly.
12.1. Common Ground
- Many papers use convolutional neural networks to (at least) preprocess the data.
- A significant number of papers concatenate the last few prices as a state for the DRL agent (this can vary from ten steps to hundreds).
- Many papers use the Sharpe ratio as a performance measure.
- Most of the papers deal with the portfolio management problem.
- Very few papers consider all three factors: transaction cost, slippage (when the market is moving so fast that the price is different at the time of the transaction than at the decision time), and spread (the difference between the buy price and sell price). The average slippage on Binance is around https://blog.bybit.com/en-us/insights/a-comparison-of-slippage-in-different-exchanges/, accessed on 5 Octobere 2021, while the spread is around , with the maximum even being (see Figure 9).
12.2. Methodological Issues
- Inconsistency of data used: Almost all papers use different datasets, so it is hard to compare between them. Even if using the same assets (such as Bitcoin), the periods used are different, but in general, the assets are significantly different.
- Different preprocessing techniques: Many papers preprocess the data differently and thus feed different inputs to the algorithms. Even if algorithms are the same, the results might be different due to the nature of the data used. One could argue that this is part of research, and we agree, but the question remains: how can we know if the increased performance of one algorithm is due to the nature of the algorithm or the data fed?
- Very few works use multiple markets (stock market, FX, cryptocurrency markets, gold, oil). It would be interesting to see how some algorithms perform on different types of markets, if hyperparameters for optimal performance differ, and, if so, how they differ. Basically, nobody answers the question, how does this algorithm perceive and perform on different types of markets?
- Very few works have code available online. In general, the code is proprietary and hard to reproduce due to the missing details of the implementation, such as hyperparameters or the deep neural network architecture used.
- Many works mention how hard it is to train a DRL for good trading strategies and the sensitivity to hyperparameters that all DRL agents exhibit. This might also be due to the fact that they do not approach the issues systematically and build a common framework, such as, for example, automatic hyperparameter tuning using some form of meta-learning [85] or autoML [86]. This is an issue for DRL in general, but more pronounced in this application domain, where contributions are often minor in terms of solving more fundamental issues but are more oriented towards increasing performance.
- There is no consistency among the type of environment used. There are various constraints of the environment, with some being more restrictive (not allowing short-selling for example) or simplifying, assuming that the buy operation happens with a fixed number of lots or shares. A few works allow short-selling; among our corpus, 20 mention short-selling, while about 5 actually allow it [61,75,87,88,89].
In Table 1, we showed a list of the most representative modelling choices with respect to the data used, their sampling frequency, the state space, the action space, the reward functions, and the performance measures and values reported in the articles. This is not at all a comprehensive list, but a small set which seemed to the author to catch much of the diversity in the whole corpus. The table is intentionally heterogeneous to reflect the difference in modelling as well as in reporting the different choices. Therefore, one conclusion which comes from this study is that there is need for more homogeneity in the methodology, data used, sampling frequency, preprocessing choice, and reporting methods.
12.3. Limitations
The limitations of the current study depend on the tools we used, Google Scholar and recoll, and critically on the fact that we cannot really judge the use of some keywords as representatives for a paper; we would have to understand the context in which they are used. However, they do provide some sort of popularity measure of the specific concepts defined by the keywords, which is useful for knowing in which direction the community is heading. Another limitation comes from the independent search, which could surely be incomplete. Ideally, one would also conduct a thorough investigation of each set of articles cited in every paper found, which would probably reveal many related articles. However, this seems to be a task better suited to a machine than to a human. We leave this for further work.
Funding
This research was funded by the EPSRC Centre for Doctoral Training in High Performance Embedded and Distributed Systems at Imperial College London (HiPEDS, Grant Reference EP/L016796/1).
Institutional Review Board Statement
Not applicable.
Informed Consent Statement
Not applicable.
Data Availability Statement
Not applicable.
Acknowledgments
The author thanks professor Abbas Edalat for helpful feedback.
Conflicts of Interest
The author declares no conflict of interest.
References
- Mnih, V.; Kavukcuoglu, K.; Silver, D.; Rusu, A.A.; Veness, J.; Bellemare, M.G.; Graves, A.; Riedmiller, M.; Fidjeland, A.K.; Ostrovski, G.; et al. Human-level control through deep reinforcement learning. Nature 2015, 518, 529–533. [Google Scholar] [CrossRef] [PubMed]
- Sato, Y. Model-free reinforcement learning for financial portfolios: A brief survey. arXiv 2019, arXiv:1904.04973. [Google Scholar]
- Hu, Z.; Zhao, Y.; Khushi, M. A survey of forex and stock price prediction using deep learning. Appl. Syst. Innov. 2021, 4, 9. [Google Scholar] [CrossRef]
- Fischer, T.G. Reinforcement Learning in Financial Markets-a Survey; Technical Report; Friedrich-Alexander University Erlangen-Nuremberg, Institute for Economics: Erlangen, Germany, 2018. [Google Scholar]
- Mosavi, A.; Faghan, Y.; Ghamisi, P.; Duan, P.; Ardabili, S.F.; Salwana, E.; Band, S.S. Comprehensive review of deep reinforcement learning methods and applications in economics. Mathematics 2020, 8, 1640. [Google Scholar] [CrossRef]
- Meng, T.L.; Khushi, M. Reinforcement learning in financial markets. Data 2019, 4, 110. [Google Scholar] [CrossRef] [Green Version]
- Nakamoto, S.; Bitcoin, A. A peer-to-peer electronic cash system. Decentralized Bus. Rev. 2008, 4, 21260. [Google Scholar]
- Islam, M.R.; Nor, R.M.; Al-Shaikhli, I.F.; Mohammad, K.S. Cryptocurrency vs. Fiat Currency: Architecture, Algorithm, Cashflow & Ledger Technology on Emerging Economy: The Influential Facts of Cryptocurrency and Fiat Currency. In Proceedings of the 2018 International Conference on Information and Communication Technology for the Muslim World (ICT4M), Kuala Lumpur, Malaysia, 23–25 July 2018; pp. 69–73. [Google Scholar]
- Tan, S.K.; Chan, J.S.K.; Ng, K.H. On the speculative nature of cryptocurrencies: A study on Garman and Klass volatility measure. Financ. Res. Lett. 2020, 32, 101075. [Google Scholar] [CrossRef]
- Wang, J.; Sun, T.; Liu, B.; Cao, Y.; Wang, D. Financial markets prediction with deep learning. In Proceedings of the 2018 17th IEEE International Conference on Machine Learning and Applications (ICMLA), Orlando, FL, USA, 17–20 December 2018; pp. 97–104. [Google Scholar]
- Song, Y.G.; Zhou, Y.L.; Han, R.J. Neural networks for stock price prediction. arXiv 2018, arXiv:1805.11317. [Google Scholar]
- Selvin, S.; Vinayakumar, R.; Gopalakrishnan, E.; Menon, V.K.; Soman, K. Stock price prediction using LSTM, RNN and CNN-sliding window model. In Proceedings of the 2017 International Conference on Advances in Computing, Communications and Informatics (Icacci), Manipal, India, 13–16 September 2017; pp. 1643–1647. [Google Scholar]
- Henrique, B.M.; Sobreiro, V.A.; Kimura, H. Stock price prediction using support vector regression on daily and up to the minute prices. J. Financ. Data Sci. 2018, 4, 183–201. [Google Scholar] [CrossRef]
- Vijh, M.; Chandola, D.; Tikkiwal, V.A.; Kumar, A. Stock closing price prediction using machine learning techniques. Procedia Comput. Sci. 2020, 167, 599–606. [Google Scholar] [CrossRef]
- Rathan, K.; Sai, S.V.; Manikanta, T.S. Crypto-currency price prediction using decision tree and regression techniques. In Proceedings of the 2019 3rd International Conference on Trends in Electronics and Informatics (ICOEI), Tirunelveli, India, 23–25 April 2019; pp. 190–194. [Google Scholar]
- Ke, N.R.; Singh, A.; Touati, A.; Goyal, A.; Bengio, Y.; Parikh, D.; Batra, D. Modeling the long term future in model-based reinforcement learning. In Proceedings of the International Conference on Learning Representations, Vancouver, BC, Canada, 30 April–3 May 2018. [Google Scholar]
- Moerland, T.M.; Broekens, J.; Jonker, C.M. Model-based reinforcement learning: A survey. arXiv 2020, arXiv:2006.16712. [Google Scholar]
- Pant, D.R.; Neupane, P.; Poudel, A.; Pokhrel, A.K.; Lama, B.K. Recurrent neural network based bitcoin price prediction by twitter sentiment analysis. In Proceedings of the 2018 IEEE 3rd International Conference on Computing, Communication and Security (ICCCS), Kathmandu, Nepal, 25–27 October 2018; pp. 128–132. [Google Scholar]
- Vo, A.D.; Nguyen, Q.P.; Ock, C.Y. Sentiment Analysis of News for Effective Cryptocurrency Price Prediction. Int. J. Knowl. Eng. 2019, 5, 47–52. [Google Scholar] [CrossRef]
- Clements, W.R.; Van Delft, B.; Robaglia, B.M.; Slaoui, R.B.; Toth, S. Estimating risk and uncertainty in deep reinforcement learning. arXiv 2019, arXiv:1905.09638. [Google Scholar]
- Sebastião, H.; Godinho, P. Forecasting and trading cryptocurrencies with machine learning under changing market conditions. Financ. Innov. 2021, 7, 1–30. [Google Scholar] [CrossRef]
- Suri, K.; Saurav, S. Attentive Hierarchical Reinforcement Learning for Stock Order Executions. Available online: https://github.com/karush17/Hierarchical-Attention-Reinforcement-Learning (accessed on 5 October 2021).
- Yu, P.; Lee, J.S.; Kulyatin, I.; Shi, Z.; Dasgupta, S. Model-based deep reinforcement learning for dynamic portfolio optimization. arXiv 2019, arXiv:1901.08740. [Google Scholar]
- Lucarelli, G.; Borrotti, M. A deep Q-learning portfolio management framework for the cryptocurrency market. Neural Comput. Appl. 2020, 32, 17229–17244. [Google Scholar] [CrossRef]
- Wang, R.; Wei, H.; An, B.; Feng, Z.; Yao, J. Commission Fee is not Enough: A Hierarchical Reinforced Framework for Portfolio Management. arXiv 2020, arXiv:2012.12620. [Google Scholar]
- Gao, Y.; Gao, Z.; Hu, Y.; Song, S.; Jiang, Z.; Su, J. A Framework of Hierarchical Deep Q-Network for Portfolio Management. In Proceedings of the ICAART (2), Online Streaming, 4–6 February 2021; pp. 132–140. [Google Scholar]
- Jiang, Z.; Xu, D.; Liang, J. A deep reinforcement learning framework for the financial portfolio management problem. arXiv 2017, arXiv:1706.10059. [Google Scholar]
- Shi, S.; Li, J.; Li, G.; Pan, P. A Multi-Scale Temporal Feature Aggregation Convolutional Neural Network for Portfolio Management. In Proceedings of the 28th ACM International Conference on Information and Knowledge Management, Beijing, China, 3–7 November 2019; pp. 1613–1622. [Google Scholar]
- Itoh, Y.; Adachi, M. Chaotic time series prediction by combining echo-state networks and radial basis function networks. In Proceedings of the 2010 IEEE International Workshop on Machine Learning for Signal Processing, Kittila, Finland, 29 August–1 September 2010; pp. 238–243. [Google Scholar]
- Dubois, P.; Gomez, T.; Planckaert, L.; Perret, L. Data-driven predictions of the Lorenz system. Phys. D 2020, 408, 132495. [Google Scholar] [CrossRef] [Green Version]
- Mehtab, S.; Sen, J. Stock price prediction using convolutional neural networks on a multivariate timeseries. arXiv 2020, arXiv:2001.09769. [Google Scholar]
- Briola, A.; Turiel, J.; Marcaccioli, R.; Aste, T. Deep Reinforcement Learning for Active High Frequency Trading. arXiv 2021, arXiv:2101.07107. [Google Scholar]
- Boukas, I.; Ernst, D.; Théate, T.; Bolland, A.; Huynen, A.; Buchwald, M.; Wynants, C.; Cornélusse, B. A deep reinforcement learning framework for continuous intraday market bidding. arXiv 2020, arXiv:2004.05940. [Google Scholar] [CrossRef]
- Conegundes, L.; Pereira, A.C.M. Beating the Stock Market with a Deep Reinforcement Learning Day Trading System. In Proceedings of the 2020 International Joint Conference on Neural Networks (IJCNN), Glasgow, UK, 19–24 July 2020; pp. 1–8. [Google Scholar]
- Sadighian, J. Extending Deep Reinforcement Learning Frameworks in Cryptocurrency Market Making. arXiv 2020, arXiv:2004.06985. [Google Scholar]
- Hu, Y.; Liu, K.; Zhang, X.; Su, L.; Ngai, E.; Liu, M. Application of evolutionary computation for rule discovery in stock algorithmic trading: A literature review. Appl. Soft Comput. 2015, 36, 534–551. [Google Scholar] [CrossRef]
- Taghian, M.; Asadi, A.; Safabakhsh, R. Learning Financial Asset-Specific Trading Rules via Deep Reinforcement Learning. arXiv 2020, arXiv:2010.14194. [Google Scholar]
- Bisht, K.; Kumar, A. Deep Reinforcement Learning based Multi-Objective Systems for Financial Trading. In Proceedings of the 2020 5th IEEE International Conference on Recent Advances and Innovations in Engineering (ICRAIE), Online, 1–3 December 2020; pp. 1–6. [Google Scholar]
- Théate, T.; Ernst, D. An application of deep reinforcement learning to algorithmic trading. Expert Syst. Appl. 2021, 173, 114632. [Google Scholar] [CrossRef]
- Bu, S.J.; Cho, S.B. Learning optimal Q-function using deep Boltzmann machine for reliable trading of cryptocurrency. In Proceedings of the International Conference on Intelligent Data Engineering and Automated Learning, Madrid, Spain, 21–23 November 2018; pp. 468–480. [Google Scholar]
- Cover, T.M. Universal portfolios. In The Kelly Capital Growth Investment Criterion: Theory and Practice; World Scientific: London, UK, 2011; pp. 181–209. [Google Scholar]
- Li, B.; Hoi, S.C. On-line portfolio selection with moving average reversion. arXiv 2012, arXiv:1206.4626. [Google Scholar] [CrossRef]
- Moon, S.H.; Kim, Y.H.; Moon, B.R. Empirical investigation of state-of-the-art mean reversion strategies for equity markets. arXiv 2019, arXiv:1909.04327. [Google Scholar]
- Sharpe, W.F. Mutual fund performance. J. Bus. 1966, 39, 119–138. [Google Scholar] [CrossRef]
- Moody, J.; Wu, L. Optimization of trading systems and portfolios. In Proceedings of the IEEE/IAFE 1997 Computational Intelligence for Financial Engineering (CIFEr), New York, NY, USA, 24–25 March 1997; pp. 300–307. [Google Scholar] [CrossRef]
- Gran, P.K.; Holm, A.J.K.; Søgård, S.G. A Deep Reinforcement Learning Approach to Stock Trading. Master’s Thesis, NTNU, Trondheim, Norway, 2019. [Google Scholar]
- Yang, H.; Liu, X.Y.; Zhong, S.; Walid, A. Deep reinforcement learning for automated stock trading: An ensemble strategy. SSRN 2020. [Google Scholar] [CrossRef]
- Magdon-Ismail, M.; Atiya, A.F. An analysis of the maximum drawdown risk measure. Citeseer 2015. [Google Scholar]
- Sutton, R.S.; Barto, A.G. Reinforcement Learning: An Introduction; MIT Press: Cambridge, UK, 1998; Volume 1. [Google Scholar]
- Li, Y. Deep reinforcement learning: An overview. arXiv 2017, arXiv:1701.07274. [Google Scholar]
- Mousavi, S.S.; Schukat, M.; Howley, E. Deep reinforcement learning: An overview. In Proceedings of the SAI Intelligent Systems Conference, London, UK, 21–22 September 2016; pp. 426–440. [Google Scholar]
- Arulkumaran, K.; Deisenroth, M.P.; Brundage, M.; Bharath, A.A. Deep reinforcement learning: A brief survey. IEEE Signal Process. Mag. 2017, 34, 26–38. [Google Scholar] [CrossRef] [Green Version]
- Narasimhan, K.; Kulkarni, T.; Barzilay, R. Language understanding for text-based games using deep reinforcement learning. arXiv 2015, arXiv:1506.08941. [Google Scholar]
- Foerster, J.N.; Assael, Y.M.; de Freitas, N.; Whiteson, S. Learning to communicate to solve riddles with deep distributed recurrent q-networks. arXiv 2016, arXiv:1602.02672. [Google Scholar]
- Heravi, J.R. Learning Representations in Reinforcement Learning; University of California: Merced, CA, USA, 2019. [Google Scholar]
- Stooke, A.; Lee, K.; Abbeel, P.; Laskin, M. Decoupling representation learning from reinforcement learning. In Proceedings of the International Conference on Machine Learning, Virtual, 18–24 July 2021; pp. 9870–9879. [Google Scholar]
- Krizhevsky, A.; Sutskever, I.; Hinton, G.E. Imagenet classification with deep convolutional neural networks. Adv. Neural Inf. Process. Syst. 2012, 25, 1097–1105. [Google Scholar] [CrossRef]
- Grefenstette, E.; Blunsom, P.; De Freitas, N.; Hermann, K.M. A deep architecture for semantic parsing. arXiv 2014, arXiv:1404.7296. [Google Scholar]
- Ren, H.; Xu, B.; Wang, Y.; Yi, C.; Huang, C.; Kou, X.; Xing, T.; Yang, M.; Tong, J.; Zhang, Q. Time-series anomaly detection service at Microsoft. In Proceedings of the 25th ACM SIGKDD International Conference on Knowledge Discovery & Data Mining, Anchorage, AK, USA, 4–8 August 2019; pp. 3009–3017. [Google Scholar]
- Chen, Y.; Kang, Y.; Chen, Y.; Wang, Z. Probabilistic forecasting with temporal convolutional neural network. Neurocomputing 2020, 399, 491–501. [Google Scholar] [CrossRef] [Green Version]
- Yashaswi, K. Deep Reinforcement Learning for Portfolio Optimization using Latent Feature State Space (LFSS) Module. arXiv 2021, arXiv:2102.06233. [Google Scholar]
- Technical Indicators. Available online: https://www.tradingtechnologies.com/xtrader-help/x-study/technical-indicator-definitions/list-of-technical-indicators/ (accessed on 21 June 2021).
- Wu, X.; Chen, H.; Wang, J.; Troiano, L.; Loia, V.; Fujita, H. Adaptive stock trading strategies with deep reinforcement learning methods. Inf. Sci. 2020, 538, 142–158. [Google Scholar] [CrossRef]
- Chakraborty, S. Capturing financial markets to apply deep reinforcement learning. arXiv 2019, arXiv:1907.04373. [Google Scholar]
- Jia, W.; Chen, W.; Xiong, L.; Hongyong, S. Quantitative trading on stock market based on deep reinforcement learning. In Proceedings of the 2019 International Joint Conference on Neural Networks (IJCNN), Budapest, Hungary, 14–19 July 2019; pp. 1–8. [Google Scholar]
- Rundo, F. Deep LSTM with reinforcement learning layer for financial trend prediction in FX high frequency trading systems. Appl. Sci. 2019, 9, 4460. [Google Scholar] [CrossRef] [Green Version]
- Huotari, T.; Savolainen, J.; Collan, M. Deep reinforcement learning agent for S&P 500 stock selection. Axioms 2020, 9, 130. [Google Scholar]
- Tsantekidis, A.; Passalis, N.; Tefas, A. Diversity-driven knowledge distillation for financial trading using Deep Reinforcement Learning. Neural Netw. 2021, 140, 193–202. [Google Scholar] [CrossRef]
- Lucarelli, G.; Borrotti, M. A deep reinforcement learning approach for automated cryptocurrency trading. In Proceedings of the IFIP International Conference on Artificial Intelligence Applications and Innovations, Crete, Greece, 24–26 May 2019; pp. 247–258. [Google Scholar]
- Wu, M.E.; Syu, J.H.; Lin, J.C.W.; Ho, J.M. Portfolio management system in equity market neutral using reinforcement learning. Appl. Intell. 2021, 51, 8119–8131. [Google Scholar] [CrossRef]
- Weng, L.; Sun, X.; Xia, M.; Liu, J.; Xu, Y. Portfolio trading system of digital currencies: A deep reinforcement learning with multidimensional attention gating mechanism. Neurocomputing 2020, 402, 171–182. [Google Scholar] [CrossRef]
- Suri, K.; Shi, X.Q.; Plataniotis, K.; Lawryshyn, Y. TradeR: Practical Deep Hierarchical Reinforcement Learning for Trade Execution. arXiv 2021, arXiv:2104.00620. [Google Scholar]
- Wei, H.; Wang, Y.; Mangu, L.; Decker, K. Model-based reinforcement learning for predictions and control for limit order books. arXiv 2019, arXiv:1910.03743. [Google Scholar]
- Leem, J.; Kim, H.Y. Action-specialized expert ensemble trading system with extended discrete action space using deep reinforcement learning. PLoS ONE 2020, 15, e0236178. [Google Scholar] [CrossRef]
- Jeong, G.; Kim, H.Y. Improving financial trading decisions using deep Q-learning: Predicting the number of shares, action strategies, and transfer learning. Expert Syst. Appl. 2019, 117, 125–138. [Google Scholar] [CrossRef]
- Lei, K.; Zhang, B.; Li, Y.; Yang, M.; Shen, Y. Time-driven feature-aware jointly deep reinforcement learning for financial signal representation and algorithmic trading. Expert Syst. Appl. 2020, 140, 112872. [Google Scholar] [CrossRef]
- Hirchoua, B.; Ouhbi, B.; Frikh, B. Deep reinforcement learning based trading agents: Risk curiosity driven learning for financial rules-based policy. Expert Syst. Appl. 2021, 170, 114553. [Google Scholar] [CrossRef]
- Deisenroth, M.; Rasmussen, C.E. PILCO: A model-based and data-efficient approach to policy search. In Proceedings of the 28th International Conference on machine learning (ICML-11), Citeseer, Bellevue, WA, USA, 28 June–2 July 2011; pp. 465–472. [Google Scholar]
- Abdolmaleki, A.; Lioutikov, R.; Peters, J.R.; Lau, N.; Pualo Reis, L.; Neumann, G. Model-based relative entropy stochastic search. Adv. Neural Inf. Process. Syst. 2015, 28, 3537–3545. [Google Scholar]
- Levine, S.; Koltun, V. Guided policy search. In Proceedings of the International Conference on Machine Learning, Atlanta, GA, USA, 16–21 June 2013; pp. 1–9. [Google Scholar]
- Littman, M.L. Reinforcement learning improves behaviour from evaluative feedback. Nature 2015, 521, 445–451. [Google Scholar] [CrossRef]
- Hinton, G.E.; Zemel, R.S. Autoencoders, minimum description length, and Helmholtz free energy. Adv. Neural Inf. Process. Syst. 1994, 6, 3–10. [Google Scholar]
- Lillicrap, T.P.; Hunt, J.J.; Pritzel, A.; Heess, N.; Erez, T.; Tassa, Y.; Silver, D.; Wierstra, D. Continuous control with deep reinforcement learning. arXiv 2015, arXiv:1509.02971. [Google Scholar]
- Jaderberg, M.; Mnih, V.; Czarnecki, W.M.; Schaul, T.; Leibo, J.Z.; Silver, D.; Kavukcuoglu, K. Reinforcement learning with unsupervised auxiliary tasks. arXiv 2016, arXiv:1611.05397. [Google Scholar]
- Xu, Z.; van Hasselt, H.; Silver, D. Meta-gradient reinforcement learning. arXiv 2018, arXiv:1805.09801. [Google Scholar]
- He, X.; Zhao, K.; Chu, X. AutoML: A Survey of the State-of-the-Art. Knowl.-Based Syst. 2021, 212, 106622. [Google Scholar] [CrossRef]
- Zhang, Z. Hierarchical Modelling for Financial Data. Ph.D. Thesis, University of Oxford, Oxford, UK, 2020. [Google Scholar]
- Filos, A. Reinforcement Learning for Portfolio Management. Master’s Thesis, Imperial College London, London, UK, 2019. [Google Scholar]
- De Quinones, P.C.F.; Perez-Muelas, V.L.; Mari, J.M. Reinforcement Learning in Stock Market. Master’s Thesis, University of Valencia, Valencia, Spain.
Figure 3.
Flow graph of the methodology for the survey.
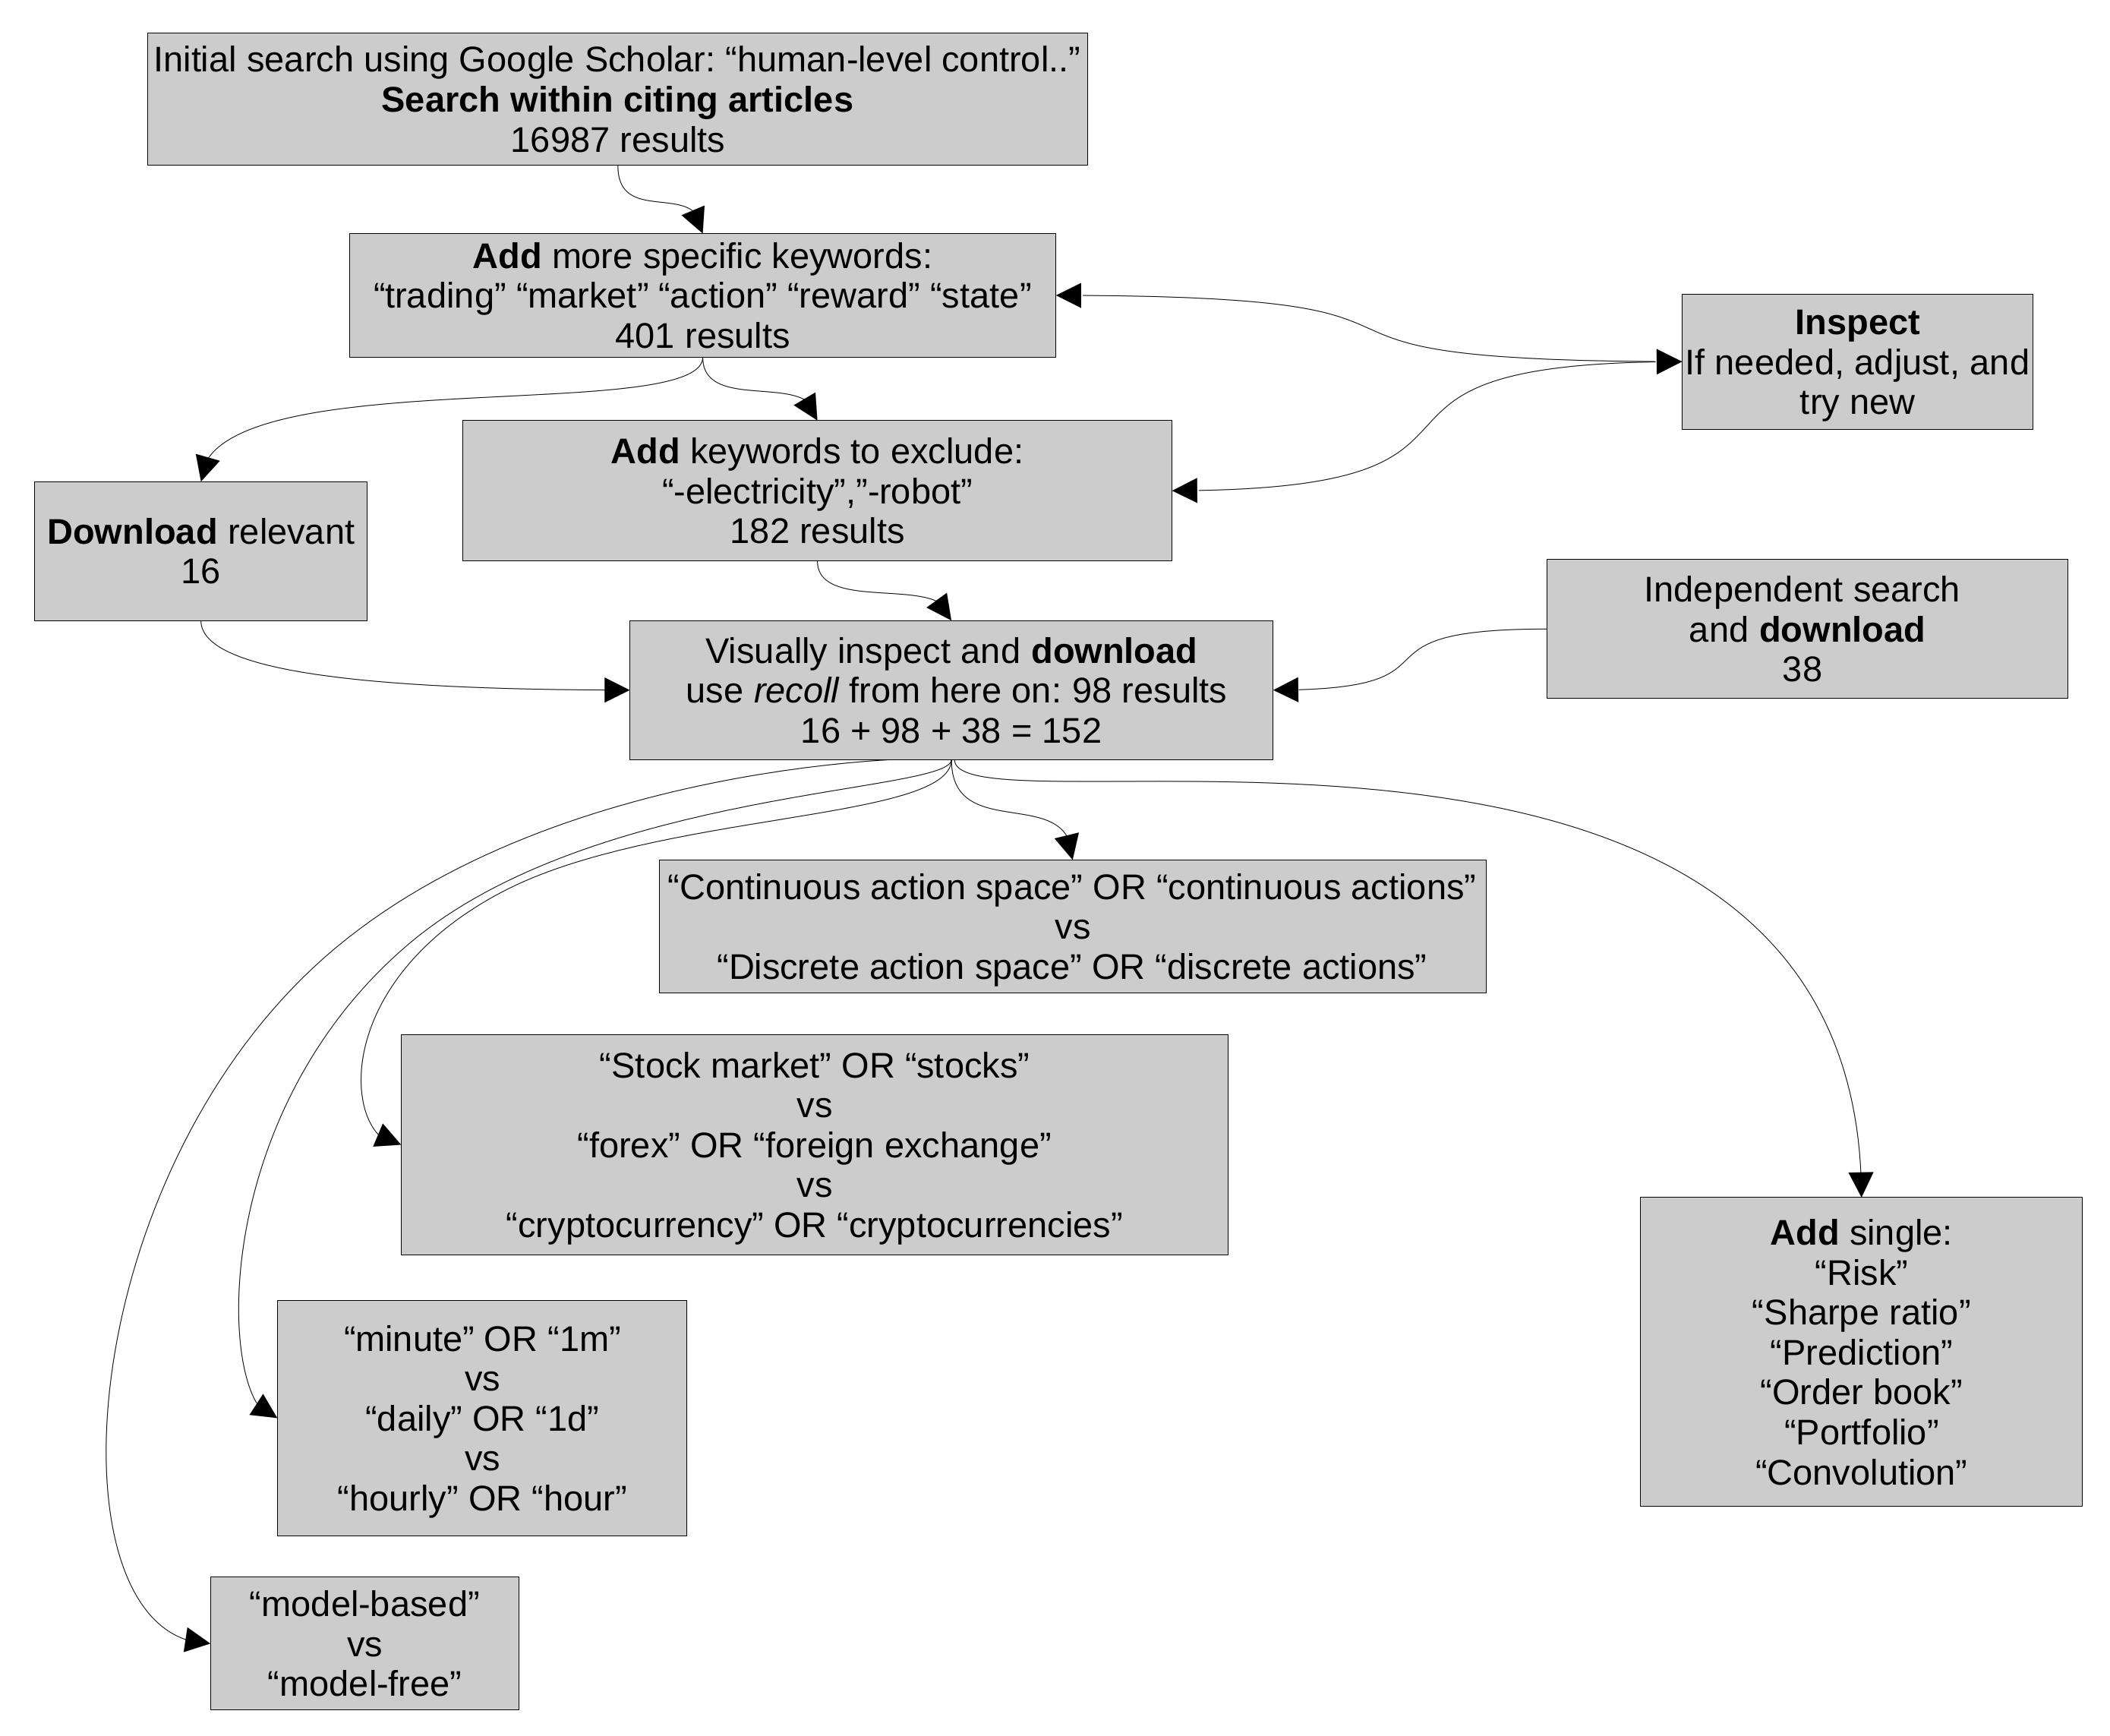
Figure 4.
Overview of the main financial concepts discussed and their RL correspondents.

Figure 5.
The original architecture of the deep Q network that learnt to play Atari games from pixel data.
Figure 5.
The original architecture of the deep Q network that learnt to play Atari games from pixel data.
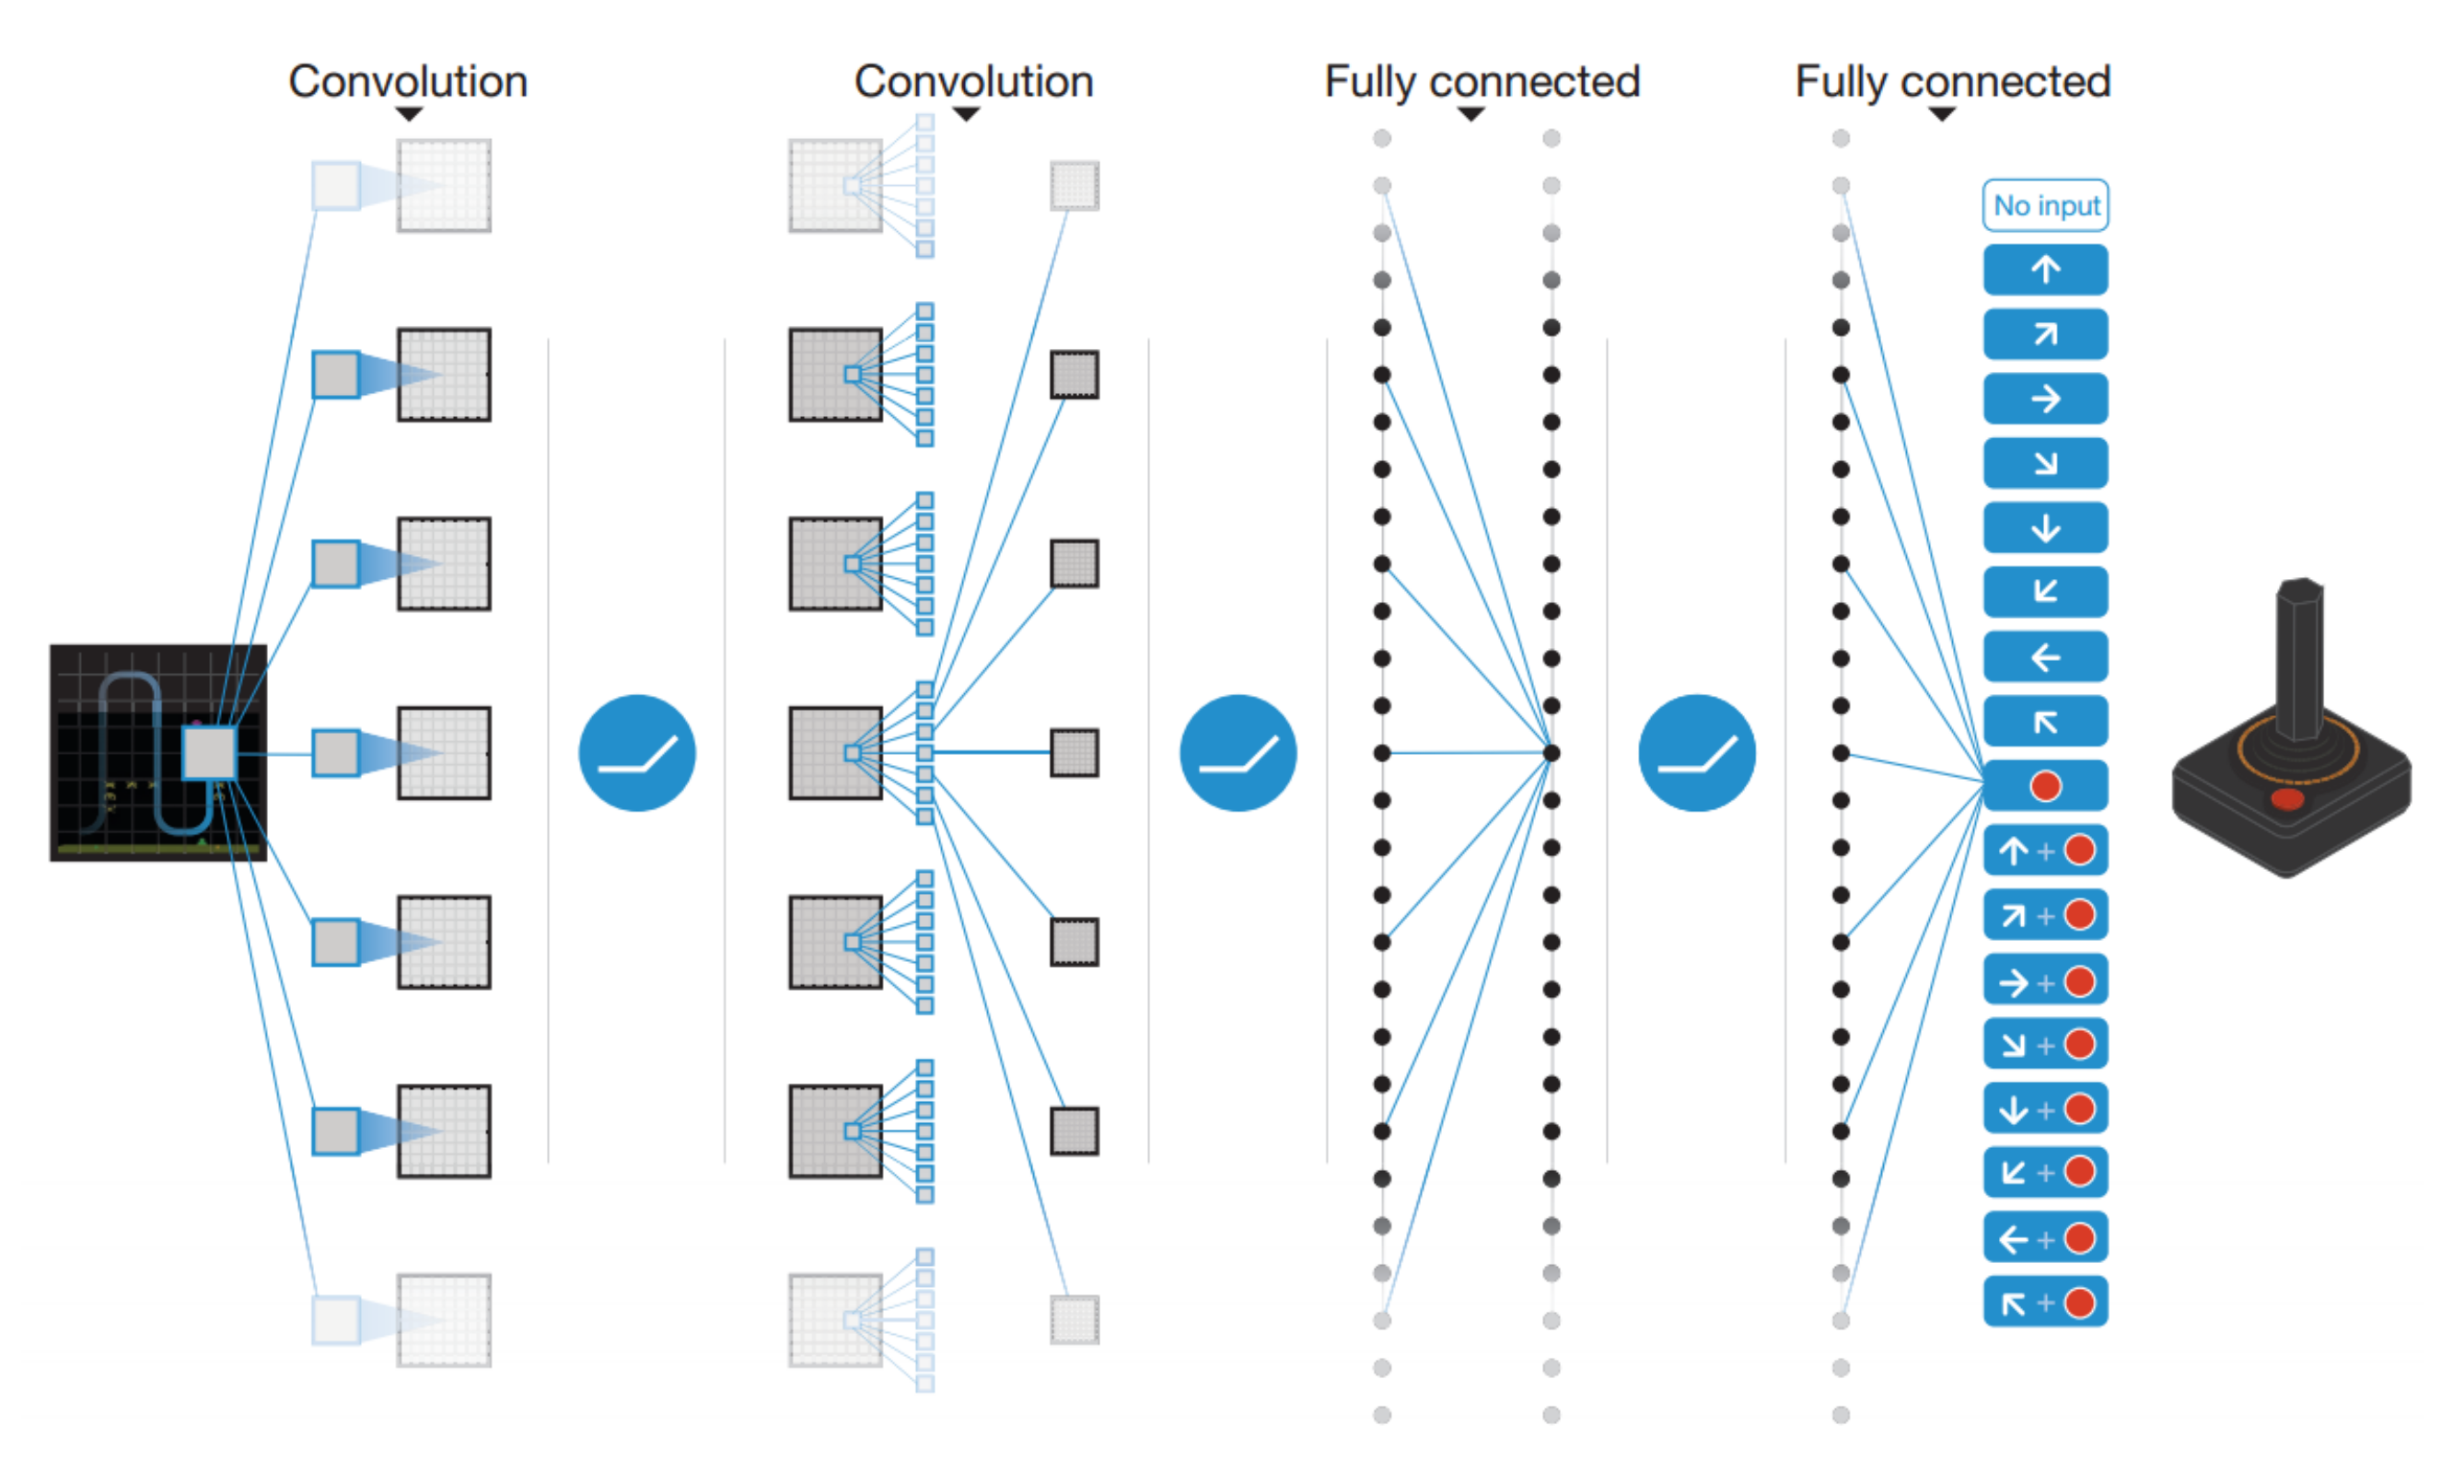
Figure 6.
The number of articles citing the original DQN paper. Taken from Google Scholar.

Figure 7.
Different RL state representations for time-series built for being processed by CNNs. (a) Stacked data used for convolutional preprocessing. From [40], reprinted by permission from Springer. (b) Another way of stacking prices for convolutions. From [27].

Figure 8.
Different ways of preprocessing the price. (a) Preprocessing the price to compress it for a DRL agent. (b) Preprocessing the price to compress it, but keeping the time component.
Figure 8.
Different ways of preprocessing the price. (a) Preprocessing the price to compress it for a DRL agent. (b) Preprocessing the price to compress it, but keeping the time component.
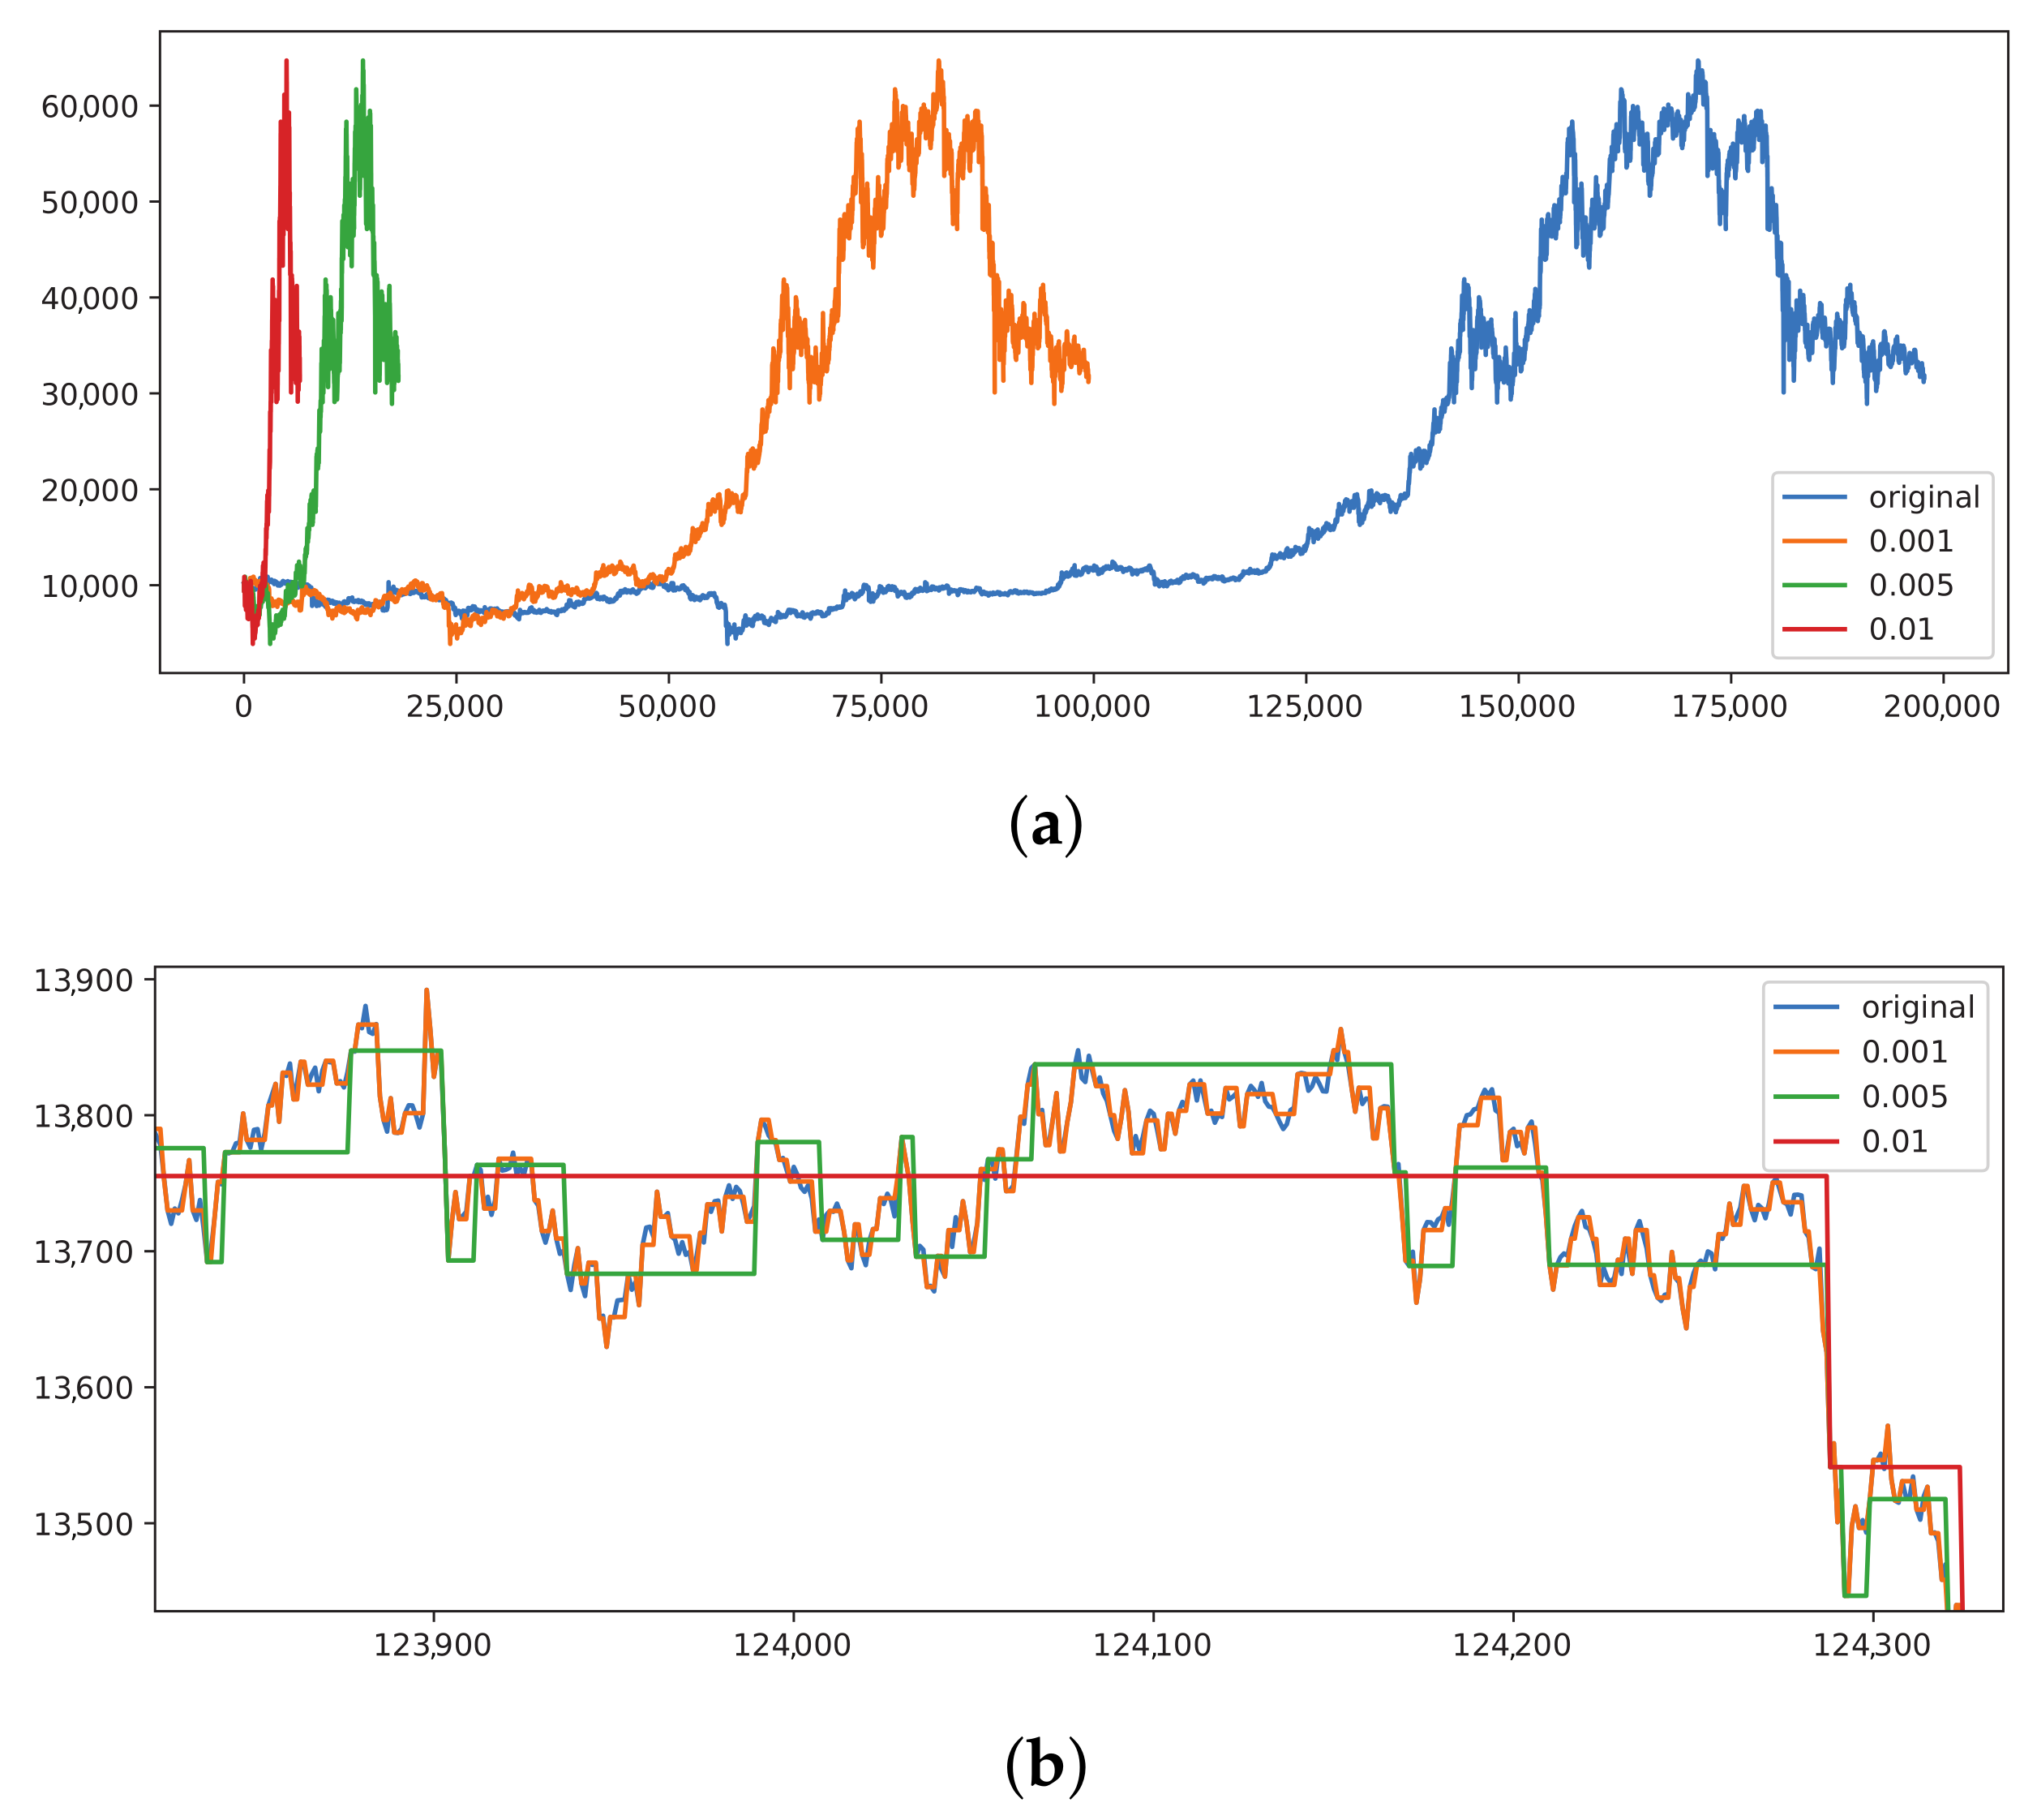
Figure 9.
The Bitcoin spread on Binance.


Table 1.
Table summarising the main modelling choices from a small subset of the papers which use DRL for trading.
Table 1.
Table summarising the main modelling choices from a small subset of the papers which use DRL for trading.
| Article | Data | State Space | Action Space | Reward | Performance |
|---|---|---|---|---|---|
| Deep Reinforcement Learning Agent for S&P 500 stock selection [67] | 28 S&P500 5283 days for 415 stocks | total return, closing price, volumes, quarterly earnings, the out-paid dividends, the declaration dates for dividends, the publication dates for the quarterly reports (d, n, f), where d is the length of the observation in days, n is the number of stocks in the environment, f is the number of features for a single stock | Continuous 20 dims | Differential Sharpe | 1255 days Total return: 328% Sharpe=0.91 |
| Diversity-driven knowledge distillation for financial trading using Deep Reinforcement Learning [68] | 28 FX, 1h | normalized OHLCV, current open position as one-hot | Discrete (exit, buy, sell) | PnL | 2 years PnL ≈ 0.35 |
| A Deep Reinforcement Learning Approach for Automated Cryptocurrency Trading [69] | Bitcoin, 3200 h | time stamp, OHLCV, USD volume weighted Bitcoin price | Discrete (buy, hold, sell) | Profit Sharpe | 800h return ≈ 3% |
| An application of deep reinforcement learning to algorithmic trading [39] | 30 stocks daily, 5 years | current trading position, OHLCV | Discrete (buy, sell) | Normalized price change | Sharpe = 0.4 AAPL annual return=0.32 |
| Adaptive Stock Trading Strategies with Deep Reinforcement Learning Methods [63] | 15 stocks daily, 8 years | OHLCV + Technical indicators (MA, EMA, MACD, BIAS, VR, and OBV) | Discrete (long, neutral, short) | Sortino ratio | 3 years −6%−200% |
| Portfolio management system in equity market neutral using RL [70] | 50 stocks daily, 2 years | normalized OHLC | Continuous 50 dims | Sharpe ratio | 2 years profit ≈ 50% |
| Deep Reinforcement Learning for Automated Stock Trading: [47] | 30 stocks daily, 7 years | balance, shares, price technical indicators (MACD, RSI, CCI, ADX) | Discrete | Portfolio value change Turbulence | Sharpe=1.3 Annual return=13% |
| Portfolio trading system of digital currencies: A deep reinforcement learning with multidimensional attention gating mechanism [71] | 20 assets 30 min, 4 years | normalized HLC, shares | Continuous 20 dims | Log cumulative return | 2 months Return = 22x |
| A framework of hierarchical deep q-network for portfolio management [26] | 4 Chinese stocks 2 days, 2 years | OHLC, shares | Discretised × 4 | Price change | 1 year 44% |
| Attentive hierarchical reinforcement learning for stock order executions [22] | 6 stocks 2 min, 2 months | OHLCV | Discrete (buy, sell) | Balance | 1 month unclear% |
| Trader: Practical deep hierarchical reinforcement learning for trade execution [72] | 35 stocks 1 min, 1 year | OHLCV | Discrete (buy, hold, sell) and Continuous | Auxiliary: Surprise minimisation | unclear |
| Commission fee is not enough: A hierarchical reinforced framework for portfolio management [25] | 46 stocks daily, 14 years | LOB, OHLCV | Discrete (buy, sell) and Continuous | Price change, Cumulative trading costs | Wealth ≈ 200% |
| Model-based reinforcement learning for predictions and control for limit order books [73] | one stock 17s, 61 days | LOB, trade prints | Discrete 21 actions | Predicted price change | 19 days cumulative PnL = 20 |
| Model-based deep reinforcement learning for dynamic portfolio optimization [23] | 7 stocks hourly, 14 years augmented | OHLC predicted next HLC market perf. index | Continuous | Predicted price change | 2 years annual return = 8% |
Publisher’s Note: MDPI stays neutral with regard to jurisdictional claims in published maps and institutional affiliations. |
© 2021 by the author. Licensee MDPI, Basel, Switzerland. This article is an open access article distributed under the terms and conditions of the Creative Commons Attribution (CC BY) license (https://creativecommons.org/licenses/by/4.0/).
Share and Cite
MDPI and ACS Style
Millea, A. Deep Reinforcement Learning for Trading—A Critical Survey. Data 2021, 6, 119. https://doi.org/10.3390/data6110119
AMA Style
Millea A. Deep Reinforcement Learning for Trading—A Critical Survey. Data. 2021; 6(11):119. https://doi.org/10.3390/data6110119
Chicago/Turabian StyleMillea, Adrian. 2021. "Deep Reinforcement Learning for Trading—A Critical Survey" Data 6, no. 11: 119. https://doi.org/10.3390/data6110119