
Indoor Environment Dataset to Estimate Room Occupancy


School of Engineering and Science, Tecnologico de Monterrey, Monterrey 64849, Mexico
*
Author to whom correspondence should be addressed.
Data 2021, 6(12), 133; https://doi.org/10.3390/data6120133
Submission received: 14 September 2021
/
Revised: 29 October 2021
/
Accepted: 5 November 2021
/
Published: 13 December 2021
(This article belongs to the Special Issue Measurements of User and Sensor Data from the Internet of Things (IoT) Devices)
Abstract
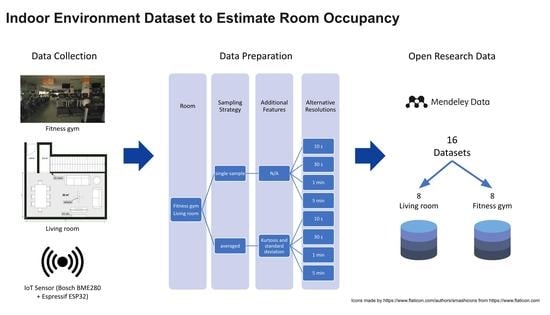
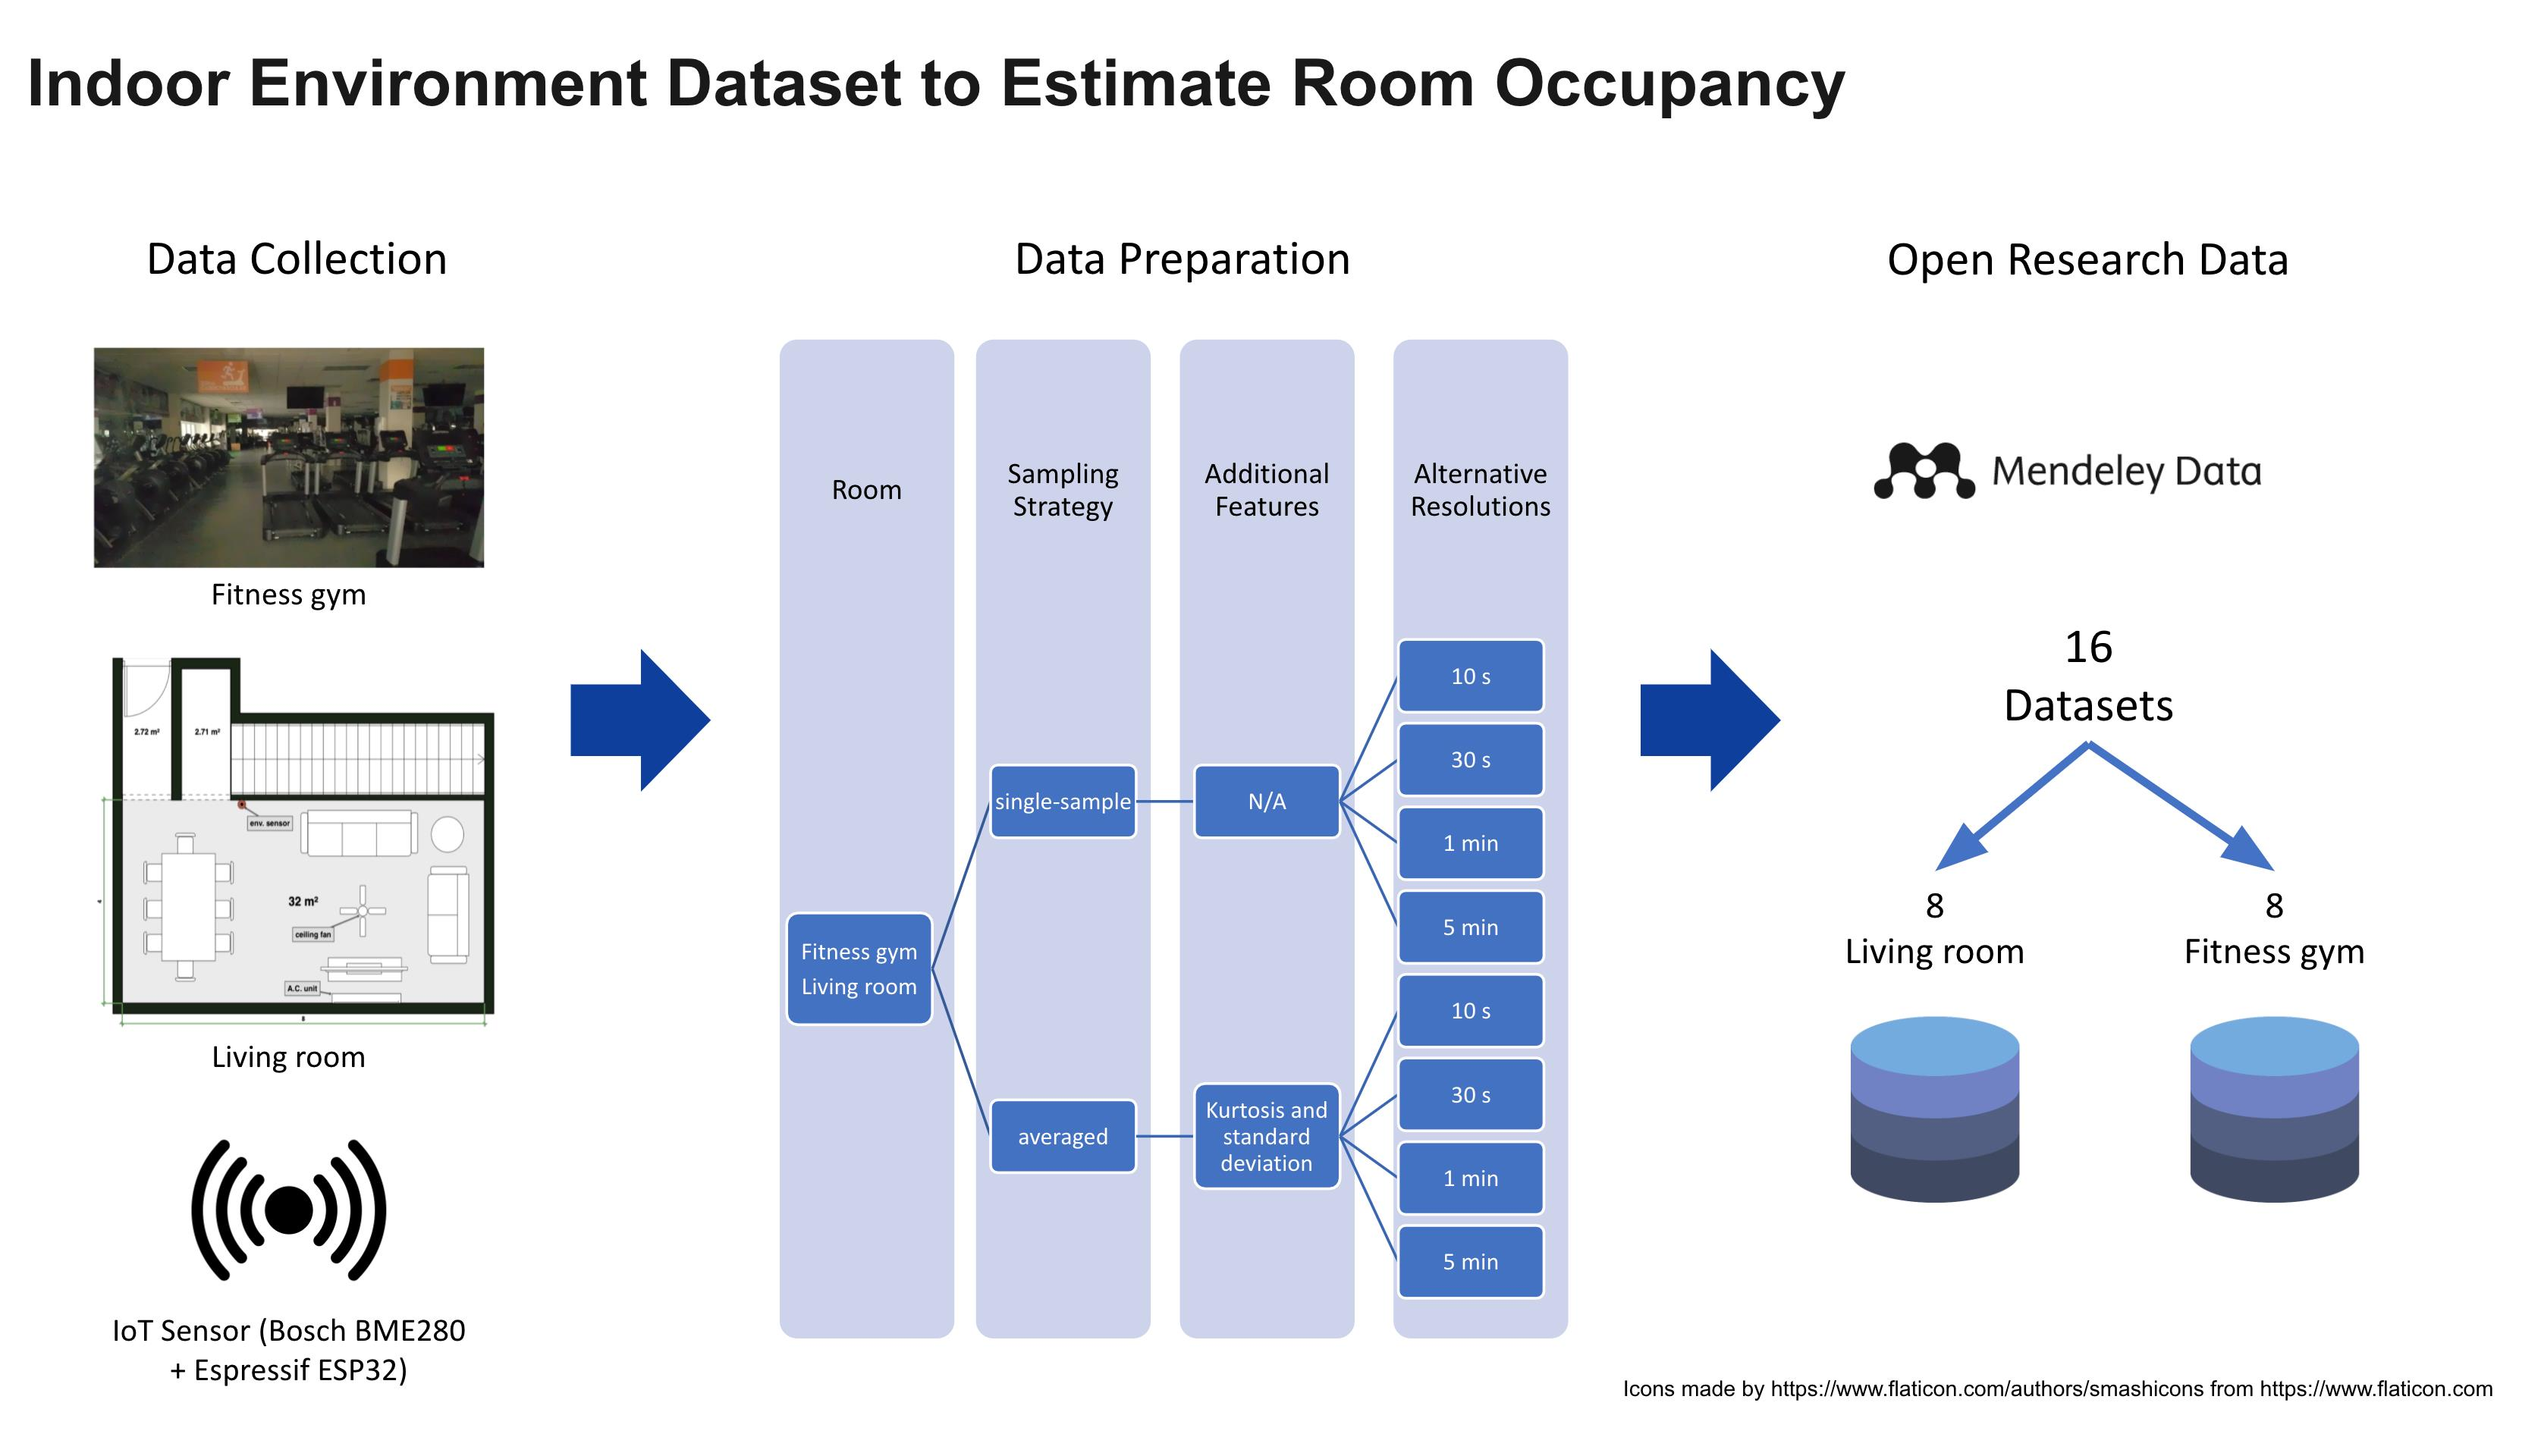
:The estimation of occupancy is a crucial contribution to achieve improvements in energy efficiency. The drawback of data or incomplete data related to occupancy in enclosed spaces makes it challenging to develop new models focused on estimating occupancy with high accuracy. Furthermore, considerable variation in the monitored spaces also makes it difficult to compare the results of different approaches. This dataset comprises the indoor environmental information (pressure, altitude, humidity, and temperature) and the corresponding occupancy level for two different rooms: (1) a fitness gym and (2) a living room. The fitness gym data were collected for six days between 18 September and 2 October 2019, obtaining 10,125 objects with a 1 s resolution according to the following occupancy levels: low (2442 objects), medium (5325 objects), and high (2358 objects). The living room data were collected for 11 days between 14 May and 4 June 2020, obtaining 295,823 objects with a 1 s resolution, according to the following occupancy levels: empty (50,978 objects), low (202,613 objects), medium (35,410 objects), and high (6822 objects). Additionally, the number of fans turned on is provided for the living room data. The data are publicly available in the Mendeley Data repository. This dataset can be used to train and compare different machine learning, deep learning, and physical models for estimating occupancy at enclosed spaces.
Data Set: 10.17632/kjgrct2yn3.3.
Data Set License: CC BY 4.0.
1. Introduction
The acceleration of the harmful effects of climate change and the potential impact of occupancy information in energy efficiency have caused the increasing interest of researchers in the field of occupancy detection and estimation in the last decade [1,2,3,4]. Within this field, indirect approaches (based on indoor environmental information) have prevailed over direct approaches (based mainly on cameras) as viable alternatives for occupancy detection since the latter present high implementation cost and intrusion problems of privacy [4,5,6,7,8]. Therefore, much of the specialized literature that can be found nowadays presents solutions based on indirect approaches.
However, it is worth noting that despite this growing attention, few datasets suitable for research and development of indirect occupancy approaches can be found that are publicly accessible and well documented. Some of these datasets are hosted in non-specialized repositories for data storage (e.g., GitHub), with little or no description of the collected data [9]. Others include minimum occupancy information (detection only) [10,11] or no information regarding the ground truth occupancy [12]. This incompleteness of information is aggravated when the methodology with which the data were collected is considered. The methodology is a critical factor since essential decisions are made consciously or unconsciously when designing the collection: the selection of collection sites, the use and ventilation characteristics of the collection site, the outdoor climatic conditions, the rules used to establish occupancy levels (if applicable), the location of the sensor in the monitored space, among others.
Ignoring these characteristics makes it difficult for researchers to compare the results of their models with those of the literature. Another trend found in occupation-related work is the use of datasets of own elaboration [4,5,6,8,13,14]. However, the same drawbacks mentioned above, in addition to the differences in the type and number of devices used, physical characteristics of the spaces (e.g., size and sources of external ventilation), and poor accessibility to the data, prevent a direct comparison among works [15].
Because of these, reference datasets are identified as a priority need to improve research development in the field of occupational information. These datasets allow an objective comparison between models/approaches that address occupancy estimation by removing possible sources of variation and noise that affect the results. Likewise, these datasets should include different indoor environmental variables and the highest possible occupancy resolution to allow researchers to develop various models depending on the specific problem to be attacked (detection, estimation, and identification of the activity carried out).
On the one hand, Shen et al. propose four levels for the resolution of occupation [16]: (1) binary (empty or not), (2) counting (how many people), (3) identity (who they are), and (4) activity (what are they doing). On the other hand, Jiang et al. [14] and Yuan et al. [4] used a similar approach. They defined a class that represents the empty level and distributed the amount of occupancy observed in proportional ranges. In the proposed dataset, a combination of levels 1 and 2 is proposed for the occupancy dimension with four discrete levels, as Jiang et al. [14] and Yuan et al. [4] proposed: empty (E), low (L), medium (M), and high (H). The empty level corresponds to the absolute absence of people, while low, medium, and high levels are fixed ranges with respect to the room’s capacity. That is, the low level is between 1% and 33% of the room’s capacity; the medium level is between 34% and 66%; and the high level is above 67%.
Therefore, this data descriptor contributes to the goal of having a reference dataset by presenting a dataset on indoor environmental variables and information related to the occupation of two different rooms. These data were collected for the occupancy estimation research presented in Vela et al. [17]; they are now described in greater detail and are freely available to researchers and the general public through the Mendeley Data open data repository. Furthermore, due to the contrasting characteristics of the enclosed spaces used in the collection (e.g., design use of the spaces, type of ventilation, and size), this dataset is a valuable contribution to the field of occupancy information. Such a contribution will allow further development of high-accuracy models and hence, reduce energy waste.
The rest of this document is organized as follows. Section 2 provides the description of the datasets generated. Then, Section 3 addresses the methodology carried out to collect and preprocess the proposed datasets, mentioning the materials and methods used. Subsequently, Section 4 presents an exploratory analysis of the datasets. Finally, Section 5 gives the conclusions.
2. Data Description
This dataset was generated as part of efforts for a previous research publication [17]. The data collected belong to two different enclosed spaces. The first one corresponds to a fitness gym for employees from Tecnologico de Monterrey in Mexico. The collection was carried out between 18 September and 2 October 2019, obtaining 10,125 objects using a 1 s resolution, which is equivalent to 169 min of recorded data. Observed occupancy level corresponds either to low (2442 objects), medium (5325 objects), or high (2358 objects). Table 1 describes the attributes and their measure unit for the fitness gym data.
The second enclosed space corresponds to a living room in a private residence located in Monterrey, Nuevo Leon, Mexico. The collection was carried out between 14 May and 4 June 2020, obtaining 295,823 objects using a 1 s resolution. This is equivalent to 4931 min of recorded data. Unlike the previous room, the occupancy level was registered using four levels instead of three. Those levels correspond to empty (50,978 objects), low (202,613 objects), medium (35,410 objects), and high (6822 objects). The rest of the attributes are the same as those recorded for the fitness gym. In addition, two extra attributes were collected: the number of fans turned on (ven), and the exact number of people observed (occ_int). Table 2 summarizes the attributes added and updated (occ) for the living room data.
Furthermore, for each room, eight datasets were generated by varying the time resolution and the sampling method. The resolutions used are 10 s, 30 s, 1 min, and 5 min. The sampling methods comprise taking a single sample for each time frame, and averaging all the samples within the time frame. The attributes for each dataset are those of the dataset from which they were generated. For the case of the averaged datasets, the data within the resolution’s time frame were used to calculate the standard deviation and kurtosis for indoor environmental attributes. Table 3 describes the additional attributes for the averaged datasets, and Table 4 summarizes the number of instances generated for each resolution and occupancy level. Only one table is presented for the combinations of resolution and enclosed spaces, as the number of instances generated is the same regardless of the sampling strategy used (single-sample or averaged).
3. Materials and Methods
3.1. Collection Device
A device was assembled specifically to collect indoor environmental data. The device is composed of a BME280 humidity sensor [18] from Bosh and a ESP32 microcontroller from Espresiff [19].
Firstly, the BME280 sensor [18] is a low-cost, low-energy consumption sensor designed for several applications, such as internet of things, enclosed navigation, fitness monitoring, home automation, and meteorological monitoring. This sensor allows measuring the relative humidity (%), temperature (C), atmospheric pressure (hPa), and altitude (m). The sensor ranges and accuracy are as follows: pressure 300 to 1100 hPa (±1 hPa accuracy), temperature −40 to 85 C (±1 C accuracy), relative humidity 0% to 100% (±3% accuracy), and altitude from 0 ft to 30,000 ft (±1 m accuracy).
Secondly, the ESP32 controller [19] is a low-cost, low-energy consumption controller with wireless connectivity, i.e., Wi-Fi and Bluetooth. It supports the security standards WPA and WPA2, which makes it able to connect to modern wireless networks, and has a dual-core 32-bit 160 MHz processor and 520 KiB of static random access memory (SRAM). The ESP32 controller was in charge of collecting the data captured by the BME280 sensor and sending them (1) to a laptop through a USB port, or (2) to a DynamoDB server in Amazon Web Services.
3.2. Data Collection
Two collections were performed. The first one was in a fitness gym and the second one in a living room of a private residence. These rooms were selected because of their contrasting indoor environment characteristics and design use: (1) the fitness gym is a bigger space with air conditioning (A.C.) units turned on 24 h, which is designed for the specific purpose of performing high intensity (aerobic and anaerobic) activities; (2) the living room is considerably smaller in size, has multiple fans and an A.C. unit, which are sparsely turned on, and is designed to relax or perform low-intensity activities. Table 5 provides a description of the main characteristics of the two rooms used for data collection. These differences are key to building a variety of models that are resistant to different indoor environmental conditions.
3.2.1. Fitness Gym
The monitored space corresponds to the employees fitness gym of the Tecnologico de Monterrey in Mexico. The facility has A.C. units turned on 24 h. Figure 1 shows a picture of the cardio zone of this fitness gym.
The collection was carried out for six days between 18 September and 2 October 2019. The data were measured every second in 21 min periods of average duration at three different times of the day: morning, afternoon, and night. The exact date, period, and duration of the measurements are shown in Table 6. These schedules correspond to the periods of highest human traffic reported by the gym’s manager. Furthermore, in this scenario, data were collected only during working hours, as suggested in other research [20,21].
Due to the space layout and privacy issues, it was not possible to use support equipment (cameras and other sensors) to register the exact number of people in the place. Thus, the level of occupation (low, medium, high) in the fitness gym was registered manually by the person responsible for the collection.
3.2.2. Living Room
The data were collected from the living room of a residential building. The space dimensions are approximately 8 × 4 m. In addition, the space has an A.C. unit, a ceiling fan, and sometimes, a floor fan, installed by the occupants when needed. The space lacks windows or another source of natural ventilation besides the door. To place the sensor device, a location was considered where the sensor would not have direct contact with the air-flow coming from the A.C. unit when it was turned on. A sketch of the living room is shown in Figure 2.
The collection was carried out for 11 days between 14 May and 4 June 2020. The measurements were taken every second in five-hour periods of average duration. The exact date, period, and duration of the measurements are shown in Table 7. This long period of duration allowed the inclusion of nocturnal data. In this scenario, the ground truth was obtained by using a camera to take photos every 10 min, and one person manually labeled the dataset with the exact number of people in the living room. The webcam used for this purpose was placed on a table in a corner of the living room in order to have a full view of the area (upper right corner in Figure 2). A minimum of zero occupants and a maximum of seven were observed.
3.3. Data Cleaning
The datasets were exported from a cloud storage as CSV files. In the case of the living room, the indoor environmental data and the ground truth were stored in separate files. Due to technical issues with the camera, i.e., storage limitations, small periods of missing values were found for the ground truth. These periods accounted for less than 1% of the data, and hence, they were removed. Likewise, the rest of the attributes of both enclosed spaces (fitness gym and living room) were checked for missing values, finding only six affected records. These missing values were completed, using the average value of the previous and next instances.
3.4. Establishing the Occupancy Levels
Two strategies were found in the specialized literature to estimate occupancy: (1) estimating the exact number of occupants and (2) estimating based on ranges. Estimating occupancy using an approach based on levels reduces the final cost of the solution while maintaining a high accuracy [14]. Hence, occupancy levels were established for the collected data.
From the reviewed works, only Zhoe et al. [8] used an exact number approach. However, the maximum occupancy observed was four people, which is considered small, compared to the real-life applications where occupancy detection can be used (such as offices, fitness gyms, shopping malls, residential buildings, and public buildings). The rest of the works used a proportional ranges approach. However, some variations were found in the method to implement the ranges. For example, Viani et al. [5] used four proportional classes to estimate occupancy, i.e., the lowest level ranges from 0% to 25% of the maximum occupancy (which is unspecified). Hence, there is not a class that represents when the space is empty. Adeogun et al. [13] used only three classes as follows: one class that represents when the space is empty, one class that represents when there is precisely one person, and one class that represents when there are two to four people. Therefore, the last class grouped the rest of the occupants because observing three or four people was uncommon and considered outlier observations. Finally, Jiang et al. [14] and Yuan et al. [4] used a similar approach. They defined a class that represents the empty level and distributed the amount of occupancy observed in proportional ranges. Table 8 presents the summary of the reviewed works.
For the case of the living room, the levels were established taking proportional intervals between the maximum and the minimum number of people observed, as described in [4]. Hence, since the maximum number of people recorded was seven, the occupancy levels were established as follows: empty (0), low (1–2), medium (3–5), and high (6–7).
For the case of the fitness gym, as mentioned in Section 3.2.1, the occupancy levels were registered directly by the person responsible for the collection. These levels are low (L), medium (M), and high (H). Since the collection was carried out during the busiest hours, the data do not contain periods corresponding to empty occupancy.
3.5. Generating Datasets with Different Resolutions
For each original collection data, additional datasets were generated using the following resolutions: 10 s, 30 s, 1 min, and 5 min. Furthermore, two datasets were generated for each resolution, using the following approaches: (1) taking a single sample per resolution’s time frame, and (2) averaging all the samples within the resolution’s time frame. For the single-sample datasets, the first sample was taken from each time frame. For the averaged datasets, the mode of the occupancy level was taken, as it cannot be averaged. In summary, a total of 16 datasets (2 rooms × 4 resolutions × 2 strategies) were generated.
In the averaged datasets, for each indoor environmental attribute (pressure, altitude, humidity, and temperature), two additional features were generated: kurtosis (kurt) and standard deviation (std). These attributes provide additional information related to the data in a given time frame, which can be useful for detecting occupancy. For example, Zemouri et al. [6] developed an approach based mainly on the standard deviation of indoor environmental data to detect occupancy.
It is important to realize that some steps of the methodology used to generate the different resolution datasets differ from those used in the previous publication [17]. Therefore, the resulting datasets, although similar, are not exactly the same.
4. Data Distribution
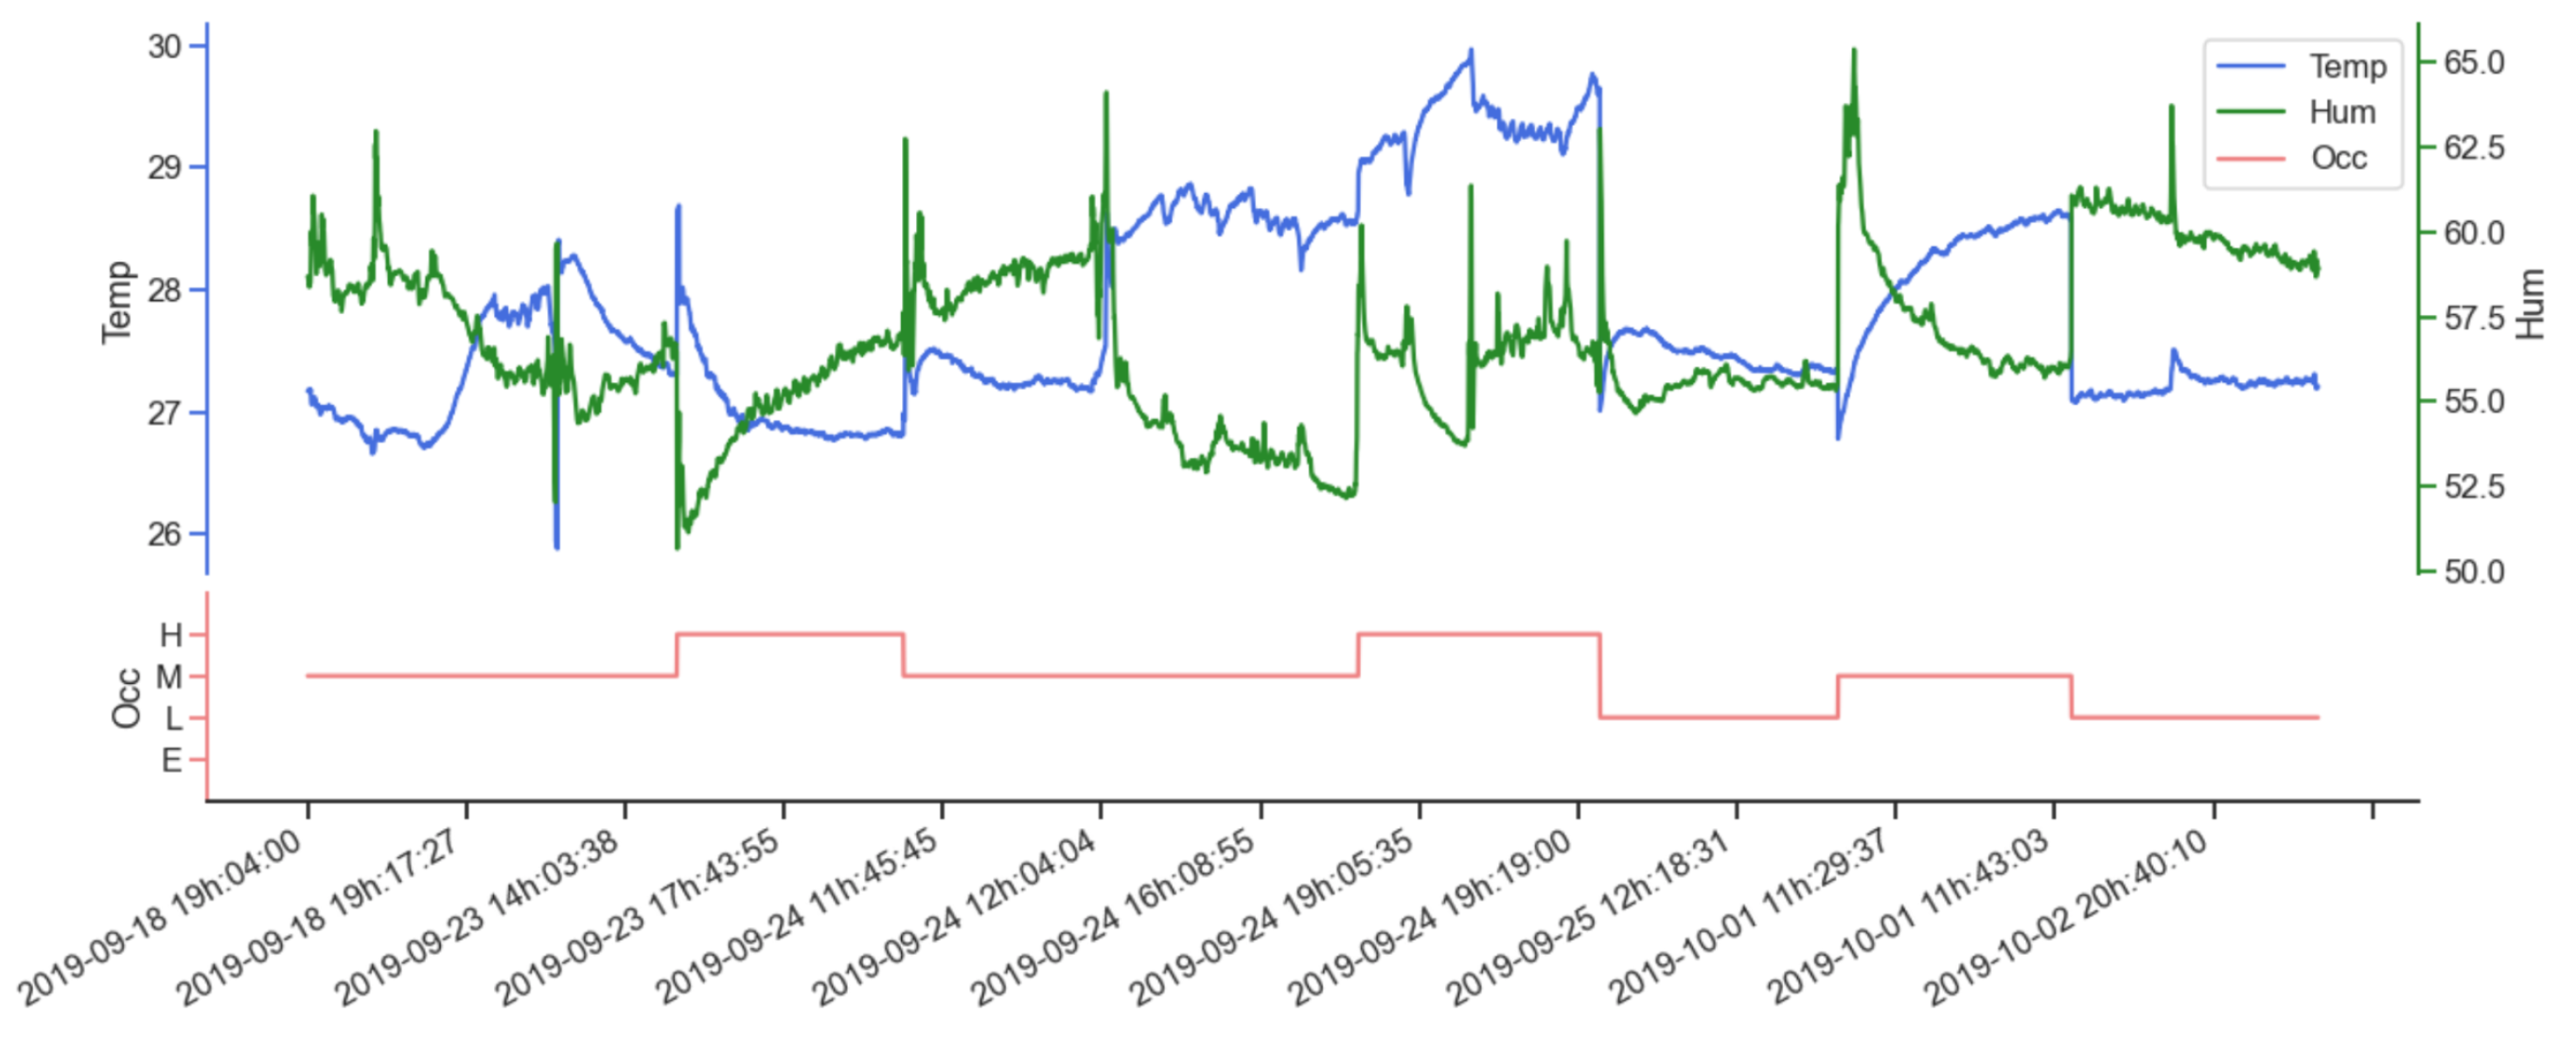
For data exploration, the original data at 1 s time resolution were used. Figure 3 presents the measurements in 2D scatter-plots for each pair of indoor variables corresponding to the fitness gym data, colored by occupancy level. Regarding the number of records, it can be seen that medium occupancy data have the highest number of objects, while the other two levels have a similar number of objects. It is important to note that the relation in terms of the number of measurements is almost 2:1 for the dominant level, compared to the rest. Hence, this dataset was also strongly imbalanced. Figure 4 shows a timeline of the values for temperature and humidity with occupancy levels. Time series are shown without time gaps.
As in the fitness gym, the original data at 1 s time resolution was used for the living room data exploration. Figure 5 shows the measurements in 2D scatter-plots for each pair of indoor variables in the living room data, colored by occupancy level. Regarding the number of records, it can be seen that the low occupancy data have the highest number of objects, while the high occupancy level is the lowest. It is also worth noting that the dominant level has four times more data than the second-largest level. On the one hand, it can be seen that ”pressure vs. humidity” presents the highest correlation since a rise in pressure increases humidity. On the other hand, ”temperature vs. humidity” does not present a clear pattern. Figure 6 shows a timeline of the values for temperature and humidity with occupancy levels. Time series are shown without time gaps.
5. Conclusions
The dataset provides information regarding two enclosed spaces with different characteristics in terms of airing, design use, size of the space, and the maximum number of occupants. The contrasting characteristics of the rooms make it possible to obtain models that are more resilient to the different conditions of enclosed spaces. In addition to detection information, the occupancy levels for enclosed spaces are provided.
The dataset also enables researchers to perform statistical analysis or develop machine learning, deep learning, and physical models to detect and estimate occupancy in enclosed spaces, using an indirect approach. For example, the available data allow training and testing of machine learning models, as presented in the research published by Vela et al. [17]. Another benefit is that they allow the standardized comparison of different occupancy detection and estimation techniques, obtaining results that can be directly compared with other research studies.
It is also important to stress that the number of objects contained in the dataset (310,000) significantly surpasses the size of other frequently used datasets, such as the occupancy detection dataset from the University of California, Irvine’s Machine Learning Repository [11] (20,000). The additional amount of data enables the training of data-intensive models, such as deep neural networks and other deep learning techniques.
Finally, the data presented in this data descriptor can be used to develop occupancy information systems that help building energy management systems (BEMS) to make energy-efficient decisions. Furthermore, other building systems, such as security, emergency response, and central domestic hot water, can benefit from the availability of occupancy information.
Author Contributions
A.V.: formal Analysis, writing—original draft preparation, data curation, software. J.A.-U.: conceptualization, methodology, writing—reviewing and editing, validation. H.G.C.: conceptualization, methodology, supervision, validation, writing—reviewing and editing, resources. All authors have read and agreed to the published version of the manuscript.
Funding
All the authors thank Tecnologico de Monterrey for the support in carrying out this research project and in financing this publication.
Institutional Review Board Statement
Not applicable.
Informed Consent Statement
Not applicable.
Data Availability Statement
The data presented in this study are openly available in Mendeley Data at https://doi.org/10.17632/kjgrct2yn3.3 (accessed on 25 October 2021).
Acknowledgments
The authors would like to thank the following students who worked on data collection and analysis: Adrian Contreras, Sergio Anaya, Andres Elizondo, Luis Rojo, Andres Martinez, Miguel Rocha, Roberto Perez, and Sergio Sepulveda. We really appreciate the participation, collaboration, and review of the people involved in this research work.
Conflicts of Interest
The authors declare no conflict of interest.
References
- Marić, I.; Pucar, M.; Kovačević, B. Reducing the impact of climate change by applying information technologies and measures for improving energy efficiency in urban planning. Energy Build. 2016, 115, 102–111. [Google Scholar] [CrossRef] [Green Version]
- Huchuk, B.; Sanner, S.; O’Brien, W. Comparison of machine learning models for occupancy prediction in residential buildings using connected thermostat data. Build. Environ. 2019, 160, 106177. [Google Scholar] [CrossRef]
- Hong, T.; Yan, D.; D’Oca, S.; Chen, C. Ten questions concerning occupant behavior in buildings: The big picture. Build. Environ. 2017, 114, 518–530. [Google Scholar] [CrossRef] [Green Version]
- Yuan, Y.; Li, X.; Liu, Z.; Guan, X. Occupancy Estimation in Buildings Based on Infrared Array Sensors Detection. IEEE Sens. J. 2020, 20, 1043–1053. [Google Scholar] [CrossRef]
- Viani, F.; Polo, A.; Robol, F.; Oliveri, G.; Rocca, P.; Massa, A. Crowd detection and occupancy estimation through indirect environmental measurements. In Proceedings of the 8th European Conference on Antennas and Propagation (EuCAP 2014), Hague, The Netherlands, 6–11 April 2014; pp. 2127–2130. [Google Scholar] [CrossRef]
- Zemouri, S.; Magoni, D.; Zemouri, A.; Gkoufas, Y.; Katrinis, K.; Murphy, J. An Edge Computing Approach to Explore Indoor Environmental Sensor Data for Occupancy Measurement in Office Spaces. In Proceedings of the 2018 IEEE International Smart Cities Conference (ISC2), Kansas City, MO, USA, 16–19 September 2018; pp. 1–8. [Google Scholar] [CrossRef] [Green Version]
- Kumar, S.; Singh, J.; Singh, O. Ensemble-based extreme learning machine model for occupancy detection with ambient attributes. Int. J. Syst. Assur. Eng. Manag. 2020. [Google Scholar] [CrossRef]
- Zhou, Y.; Chen, J.; Yu, Z.J.; Li, J.; Huang, G.; Haghighat, F.; Zhang, G. A novel model based on multi-grained cascade forests with wavelet denoising for indoor occupancy estimation. Build. Environ. 2020, 167, 106461. [Google Scholar] [CrossRef]
- Mashmn—Occupancy Dataset. Available online: https://github.com/mashmn/OccupancyDetection (accessed on 25 May 2020).
- Willocx, M. Occupancy Detection in a Student Room. 2019. Available online: https://dataverse.harvard.edu/dataset.xhtml?persistentId=doi:10.7910/DVN/BIIFAJ (accessed on 9 November 2021).
- Candanedo, L.M.; Feldheim, V. Accurate occupancy detection of an office room from light, temperature, humidity and CO2 measurements using statistical learning models. Energy Build. 2016, 112, 28–39. [Google Scholar] [CrossRef]
- Makonin, S. ODDs: Occupancy Detection Dataset. 2015. Available online: https://dataverse.harvard.edu/dataset.xhtml?persistentId=doi:10.7910/DVN/2K9FFE (accessed on 9 November 2021).
- Adeogun, R.; Rodriguez, I.; Razzaghpour, M.; Berardinelli, G.; Christensen, P.H.; Mogensen, P.E. Indoor occupancy detection and estimation using machine learning and measurements from an IoT LoRa-based monitoring system. In Proceedings of the Global IoT Summit (GIoTS 2019), Aarhus, Denmark, 17–21 June 2019; pp. 1–5. [Google Scholar] [CrossRef] [Green Version]
- Jiang, C.; Chen, Z.; Su, R.; Masood, M.K.; Soh, Y.C. Bayesian filtering for building occupancy estimation from carbon dioxide concentration. Energy Build. 2020, 206, 109566. [Google Scholar] [CrossRef]
- Ecobee—Donate Your Data. Available online: https://www.ecobee.com/donate-your-data/ (accessed on 25 May 2020).
- Shen, W.; Newsham, G.; Gunay, B. Leveraging existing occupancy-related data for optimal control of commercial office buildings: A review. Adv. Eng. Inform. 2017, 33, 230–242. [Google Scholar] [CrossRef] [Green Version]
- Vela, A.; Alvarado-Uribe, J.; Davila, M.; Hernandez-Gress, N.; Ceballos, H.G. Estimating Occupancy Levels in Enclosed Spaces Using Environmental Variables: A Fitness Gym and Living Room as Evaluation Scenarios. Sensors 2020, 20, 6579. [Google Scholar] [CrossRef] [PubMed]
- GmbH, B.S. BME280 Bosh Datasheet. Available online: https://www.bosch-sensortec.com/products/environmental-sensors/humidity-sensors-bme280/ (accessed on 25 May 2020).
- Systems, E. ESP32 Expressiff Datasheet. Available online: https://www.espressif.com/en/products/socs/esp32/overview (accessed on 25 May 2020).
- Dong, B.; Andrews, B.; Lam, K.P.; Höynck, M.; Zhang, R.; Chiou, Y.S.; Benitez, D. An information technology enabled sustainability test-bed (ITEST) for occupancy detection through an environmental sensing network. Energy Build. 2010, 42, 1038–1046. [Google Scholar] [CrossRef]
- Hobson, B.W.; Lowcay, D.; Gunay, H.B.; Ashouri, A.; Newsham, G.R. Opportunistic occupancy-count estimation using sensor fusion: A case study. Build. Environ. 2019, 159, 106154. [Google Scholar] [CrossRef]
Figure 1.
Picture of the fitness gym’s cardio zone.

Figure 2.
Sketch of the living room. The locations of the environmental sensor, ceiling fan, and AC unit are shown. The monitored area is approximately 32 m [17].
Figure 2.
Sketch of the living room. The locations of the environmental sensor, ceiling fan, and AC unit are shown. The monitored area is approximately 32 m [17].

Figure 3.
Fitness gym data distribution by pairs: (a) temperature vs. humidity, (b) temperature vs. pressure, and (c) pressure vs. humidity.
Figure 3.
Fitness gym data distribution by pairs: (a) temperature vs. humidity, (b) temperature vs. pressure, and (c) pressure vs. humidity.

Figure 4.
Humidity (green), temperature (blue), and occupancy (red) timeline of the fitness gym data (time gaps are not shown).
Figure 4.
Humidity (green), temperature (blue), and occupancy (red) timeline of the fitness gym data (time gaps are not shown).

Figure 5.
Living room data distribution by pairs: (a) temperature vs. humidity, (b) temperature vs. pressure, and (c) pressure vs. humidity.
Figure 5.
Living room data distribution by pairs: (a) temperature vs. humidity, (b) temperature vs. pressure, and (c) pressure vs. humidity.

Figure 6.
Humidity (green), temperature (blue), and occupancy (red) timeline of the living room data (time gaps are not shown).
Figure 6.
Humidity (green), temperature (blue), and occupancy (red) timeline of the living room data (time gaps are not shown).


Table 1.
Fitness gym attributes description.
| Attribute | Unit | Description |
|---|---|---|
| date | date-time | Recording date and time |
| pre | hecto-pascal | Barometric presssure |
| alt | meters | Relative altitude from sea level |
| hum | percentage | Relative humidity |
| tem | celcius | Temperature |
| occ | L, M, H | Occupancy Level |
Table 2.
Living room added and updated attributes’ description.
| Attribute | Unit | Description |
|---|---|---|
| ven | integer | Number of fans turned on |
| occ_int | integer | Exact number of occupants |
| occ | E, L, M, H | Occupancy Level |
Table 3.
Additional attributes generated for averaged datasets.
| Attribute | Unit | Description |
|---|---|---|
| pre_mean | hecto-pascal (float) | Average pressure within the time-frame |
| pre_std | hecto-pascal (float) | Pressure’s standard deviation |
| pre_kur | (float) | Pressure’s kurtosis |
| alt_mean | meters (float) | Average altitude within the time-frame |
| alt_std | meters (float) | Altitude’s standard deviation |
| alt_kur | (float) | Altitude’s kurtosis |
| hum_mean | percentage (float) | Average humidity within the time-frame |
| hum_std | percentage (float) | Humidity’s standard deviation |
| hum_kur | (float) | Humidity’s kurtosis |
| tem_mean | celcius (float) | Average temperature within the time-frame |
| tem_std | celcius (float) | Temperature’s standard deviation |
| tem_kur | (float) | Temperature’s kurtosis |
| ven_mean | fans (int) | Average number of fans turned on |
| occ_int_mean | people (int) | Average number of occupants |
| occ_mode | E, L, M, H | Mode of the occupancy level |
Table 4.
The number of objects per dataset using different time resolutions.
| Resolution | Total Amount | Amount Per Occupancy Level | |||
|---|---|---|---|---|---|
| Empty | Low | Medium | High | ||
| Living room | |||||
| 10 s | 29,751 | 5127 | 20,375 | 3561 | 688 |
| 30 s | 9924 | 1710 | 6796 | 1188 | 230 |
| 1 min | 4969 | 856 | 3403 | 595 | 115 |
| 5 min | 1005 | 173 | 687 | 122 | 23 |
| Fitness gym | |||||
| 10 s | 1027 | N/A | 247 | 541 | 239 |
| 30 s | 350 | N/A | 84 | 185 | 81 |
| 1 min | 180 | N/A | 43 | 96 | 41 |
| 5 min | 44 | N/A | 10 | 24 | 10 |
Table 5.
Fitness gym and living room main characteristics.
| Characteristic | Fitness Gym | Living Room |
|---|---|---|
| Size/Dimension | 30 × 20 m | 8 × 4 m |
| Maximum Capacity | 80 people | 7 people |
| Collection period | September–October 2019 | May–June 2020 |
| Airing | A.C. units | A.C. unit & Ceiling fan |
| Occupancy Levels | Low, Medium, High | Empty, Low, Medium, High |
| Variables | date, pre, alt, hum, tem, occ | date, pre, alt, hum, |
| tem, ven, occ_int, occ | ||
| Data objects | 10,125 | 295,823 |
Table 6.
Summary of measurement dates, periods, and duration in the fitness gym.
| Date | Period | Duration |
|---|---|---|
| 2019-09-18 | 19:04:00–19:24:58 | 00:20:58 |
| 2019-09-23 | 13:47:00–14:07:59 | 00:20:59 |
| 2019-09-23 | 17:33:00–17:53:59 | 00:20:59 |
| 2019-09-24 | 11:42:00–12:04:58 | 00:22:58 |
| 2019-09-24 | 15:56:00–16:17:09 | 00:21:09 |
| 2019-09-24 | 19:00:00–19:20:48 | 00:20:48 |
| 2019-09-25 | 12:06:00–12:27:03 | 00:21:03 |
| 2019-10-01 | 11:24:00–11:44:27 | 00:20:27 |
| 2019-10-02 | 20:28:00–20:48:58 | 00:20:58 |
Table 7.
Summary of measurement dates, periods, and duration in the living room.
| Date | Period | Duration |
|---|---|---|
| 2020-05-14 | 21:08:39–23:59:59 | 02:51:20 |
| 2020-05-15 | 00:00:00–01:00:12 | 01:00:12 |
| 2020-05-24 | 11:45:28–13:09:12 | 01:23:44 |
| 2020-05-25 | 15:49:52–23:59:59 | 08:10:07 |
| 2020-05-26 | 00:00:00–06:56:31 | 06:56:31 |
| 2020-05-26 | 10:53:38–11:30:17 | 00:36:39 |
| 2020-05-26 | 23:38:33–23:59:59 | 00:21:26 |
| 2020-05-27 | 00:00:00–10:00:47 | 10:00:47 |
| 2020-05-28 | 01:08:30–13:06:45 | 11:58:15 |
| 2020-05-28 | 23:19:00–23:59:59 | 00:40:59 |
| 2020-05-29 | 00:00:00–08:33:11 | 08:33:11 |
| 2020-05-31 | 19:00:00–20:09:14 | 01:09:14 |
| 2020-06-01 | 01:44:48–13:02:04 | 11:17:16 |
| 2020-06-04 | 01:49:32–16:01:39 | 14:12:07 |
| 2020-06-04 | 18:05:07–23:08:59 | 05:03:52 |
Table 8.
Summary of the literature reviewed to establish the occupancy levels.
| Author | Technique | Ranges | Scenario |
|---|---|---|---|
| Viani et al. [5] | Proportional ranges | 4 classes (25%) | Multi-floor monitoring in a museum |
| Adeogun et al. [13] | Proportional ranges | C1 (N = 0) C2 (N = 1) C3 () | Two offices in a university building |
| Zhou et al. [8] | Exact number | From 0 to 4 | Office space of a laboratory |
| Jiang et al. [14] | Proportional ranges | C1 (N = 0) C2 () C3 () C4 () | Office space of a laboratory |
| Yuan et al. [4] | Proportional ranges | C1 (N = 0) C2 () C3 () C4 () | Office space of a laboratory |
Publisher’s Note: MDPI stays neutral with regard to jurisdictional claims in published maps and institutional affiliations. |
© 2021 by the authors. Licensee MDPI, Basel, Switzerland. This article is an open access article distributed under the terms and conditions of the Creative Commons Attribution (CC BY) license (https://creativecommons.org/licenses/by/4.0/).
Share and Cite
MDPI and ACS Style
Vela, A.; Alvarado-Uribe, J.; Ceballos, H.G. Indoor Environment Dataset to Estimate Room Occupancy. Data 2021, 6, 133. https://doi.org/10.3390/data6120133
AMA Style
Vela A, Alvarado-Uribe J, Ceballos HG. Indoor Environment Dataset to Estimate Room Occupancy. Data. 2021; 6(12):133. https://doi.org/10.3390/data6120133
Chicago/Turabian StyleVela, Andreé, Joanna Alvarado-Uribe, and Hector G. Ceballos. 2021. "Indoor Environment Dataset to Estimate Room Occupancy" Data 6, no. 12: 133. https://doi.org/10.3390/data6120133