TBCOV: Two Billion Multilingual COVID-19 Tweets with Sentiment, Entity, Geo, and Gender Labels


Qatar Computing Research Institute, Hamad Bin Khalifa University, Doha 34110, Qatar
*
Author to whom correspondence should be addressed.
Data 2022, 7(1), 8; https://doi.org/10.3390/data7010008
Submission received: 22 November 2021
/
Revised: 6 January 2022
/
Accepted: 7 January 2022
/
Published: 10 January 2022
(This article belongs to the Section Information Systems and Data Management)
Abstract
:As the world struggles with several compounded challenges caused by the COVID-19 pandemic in the health, economic, and social domains, timely access to disaggregated national and sub-national data are important to understand the emergent situation but it is difficult to obtain. The widespread usage of social networking sites, especially during mass convergence events, such as health emergencies, provides instant access to citizen-generated data offering rich information about public opinions, sentiments, and situational updates useful for authorities to gain insights. We offer a large-scale social sensing dataset comprising two billion multilingual tweets posted from 218 countries by 87 million users in 67 languages. We used state-of-the-art machine learning models to enrich the data with sentiment labels and named-entities. Additionally, a gender identification approach is proposed to segregate user gender. Furthermore, a geolocalization approach is devised to geotag tweets at country, state, county, and city granularities, enabling a myriad of data analysis tasks to understand real-world issues at national and sub-national levels. We believe this multilingual data with broader geographical and longer temporal coverage will be a cornerstone for researchers to study impacts of the ongoing global health catastrophe and to manage adverse consequences related to people’s health, livelihood, and social well-being.
Dataset: https://crisisnlp.qcri.org/tbcov
Dataset License: ODC-BY
Keywords:
social sensing; COVID-19; sentiment analysis; trends analysis; geo-mapping; natural cities1. Introduction
Social media use during emergencies, such as natural or human-induced disasters, has become prevalent among the masses [1]. Twitter—a microblogging site—is increasingly used by affected people and humanitarian organizations to share and seek information, express opinions, and provide emotional support during disasters [2,3]. Prior studies show that Twitter also provides timely access to health-related data about chronic diseases, outbreaks, and epidemics [4,5,6]. Hence, the number of Twitter datasets pertaining to the COVID-19 pandemic has been increasing constantly. The efficacy of these datasets for various types of analyses can be measured across three fundamental dimensions: Language, Space, and Time (LST). That is, datasets covering more languages, broader geographical areas, and longer temporal boundaries are preferred for both longitudinal and cross-sectional studies, especially during a global emergency, such as the COVID-19 pandemic. Moreover, training robust machine learning (ML) and natural language processing (NLP) models, as well as building predictive analytics tools require large-scale datasets for better inference and generalization. However, existing datasets vary in their LST coverage. Many of them are restricted to a single language, e.g., English [7,8] or Arabic [9,10], or confined to specific geographies [11,12]. The data collection period also differs from one dataset to another. Among all, the dataset by Banda and colleagues stands out as one of the largest, long-running collections with 383 million tweets [13], however, only a handful of English keywords (only 10) were used for data collection—a common issue with existing datasets.
To bridge these gaps, we present TBCOV, a large-scale Twitter dataset comprising Two Billion multilingual tweets related to the COVID-19 pandemic. Specifically, TBCOV offers 2,014,792,896 tweets collected using more than 800 multilingual keywords over a 14-month period from 1 February 2020 till 31 March 2021. These tweets span 67 international languages, posted by 87 million unique users across 218 countries worldwide. More importantly, covering public chatter on various societal, health, and economic issues caused by the pandemic, TBCOV captures different perspectives and opinions about governments’ policy decisions ranging from lock downs to aid allocation for individuals and businesses. It also contains several important implications of the pandemic, such as food scarcity, shortage of equipment and supplies, reports of anxiety and depression symptoms, among others. In addition, its broad topical and LST coverage, TBCOV is also enriched with several attributes derived from tweet text and meta-data using ML techniques. These attributes include sentiment labels, geolocation information, named-entities, as well as user types and gender.
Public sentiment: Distilling tweets to understand people’s opinions, emotions, and attitudes towards an issue (e.g., low vaccination rate) or a policy decision has paramount importance for various government entities [14]. Uncertainties in authorities’ perception of public sentiment during health crises can otherwise result in poor risk communication [15]. Computational techniques such as sentiment analysis can help authorities to understand aggregated public opinion during crises and devise appropriate strategies [16]. To this end, we employ a multilingual transformer-based deep learning model [17] to tag each tweet in TBCOV according to its sentiment polarity (i.e., positive, neutral, negative).
Geolocation information: Geotagging [18] is indispensable for geographic information systems (GIS) for timely and effective monitoring of outbreaks, hot-spot prediction, disease spread monitoring, and predictive risk mapping [19,20]. User-generated data on social media platforms can fuel many of these applications [5,21]. However, low prevalence of geo-referenced information on social media poses a challenge. To tackle this challenge, we propose a geolocation tagging approach to map each tweet in TBCOV at country, state, county, or city level.
Named-entities: Mentions of persons, organizations, and locations hold key information in text documents and are crucial for various NLP tasks, such as question answering, online reputation management, and automatic text summarization [22]. Named-entity recognition (NER) is a widely used NLP technique to identify references to entities in text documents [23]. Past studies propose several NER techniques ranging from rule- and ML-based to hybrid methods [24,25]. To identify named-entities in our multilingual tweets, we use language-specific NER models for the most prevalent five languages in TBCOV and one multilingual NER model for all other languages.
User types and gender: Understanding gender disparities is important for addressing societal challenges such as identifying knowledge gaps [26], digital divide [27], and health-related issues [28,29]. Tweets in TBCOV are mainly sourced from three types of users, i.e., individuals, organizations, and bots. We first distinguish the user type by running an NER model on the name field in a Twitter profile, and then, determine the gender information using an ML classifier if the predicted user type is individuals.
To the best of our knowledge, TBCOV is the largest Twitter dataset related to COVID-19 with broad LST coverage and rich information derived from multilingual tweets that can be used for many NLP, data mining, and real-world applications. The dataset is accessible at the CrisisNLP repository [30].
2. Methods
This section first presents the data collection procedure and general statistics of the dataset. Then, it elaborates on the computational techniques used to derive various attributes such as sentiment and geo labels from tweets.
2.1. Data Collection and Description
Twitter offers different APIs for data collection. We use the Twitter Streaming API, which allows for collecting tweets based on (i) a list of hashtags/keywords or (ii) geographical bounding boxes. Following the keyword-based streaming approach, we started our data collection on 1 February 2020 using trending hashtags such as #covid19, #coronavirus, #covid_19 and forming new keywords by pairing country names with different COVID-related terms for all countries (e.g., United States coronavirus and Brazil COVID-19). We then kept updating the keyword list based on the list of keywords used by Twitter for their COVID-19 data stream (https://developer.twitter.com/en/docs/labs/covid19-stream/filtering-rules (last accessed on 1 March 2021)). Additionally, we included other COVID-related hashtags as they trended on Twitter as well as keywords related to newly emerging situations such as a particular new symptom, vaccine development, food shortages, etc. In total, more than 800 multilingual keywords and hashtags encompassing a large set of topics including social distancing, shortages of masks, personal protective equipment (PPE), food, medicine, and reports of COVID-19 symptoms and deaths were used. Table 1 lists some of the terms while the full list of keywords can be found in Appendix A. Twitter offers filtered streams for specific languages; however, we did not filter by any language, and hence, our data is multilingual. Although the data collection was still running at the time of writing this manuscript, all the statistics and analyses presented in this study are based on data collected till 31 March 2021—i.e., 2,014,792,896 tweets. To the best of our knowledge, this is the largest multilingual Twitter dataset covering a broad spectrum of topics and issues the world has been facing amidst the COVID-19 pandemic.
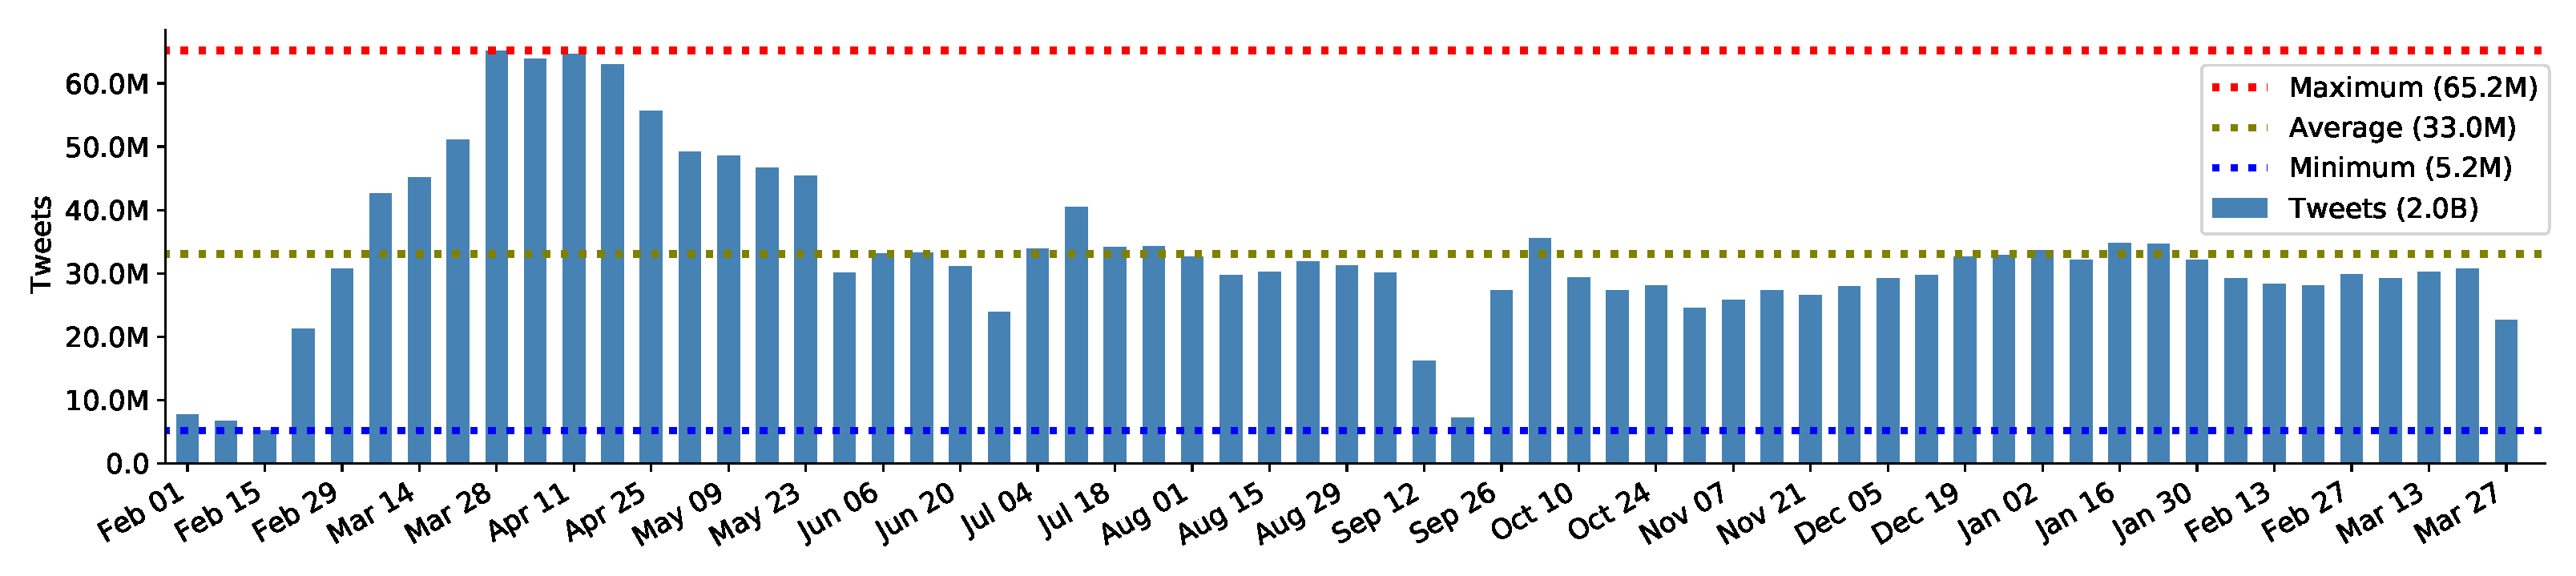
Figure 1 depicts the volume of tweets ingested across the 61 weeks of the data collection (1 February 2020 to 31 March 2021). The data do not show any gaps, which is an important factor for many types of analysis. The volume of tweets in the first three weeks is relatively lower, e.g., ∼5 million daily tweets on average. However, a sudden surge can be noticed starting from week four, which amounts to an overall average of 33 million tweets per week. The maximum number of tweets recorded in a week is 65 million.
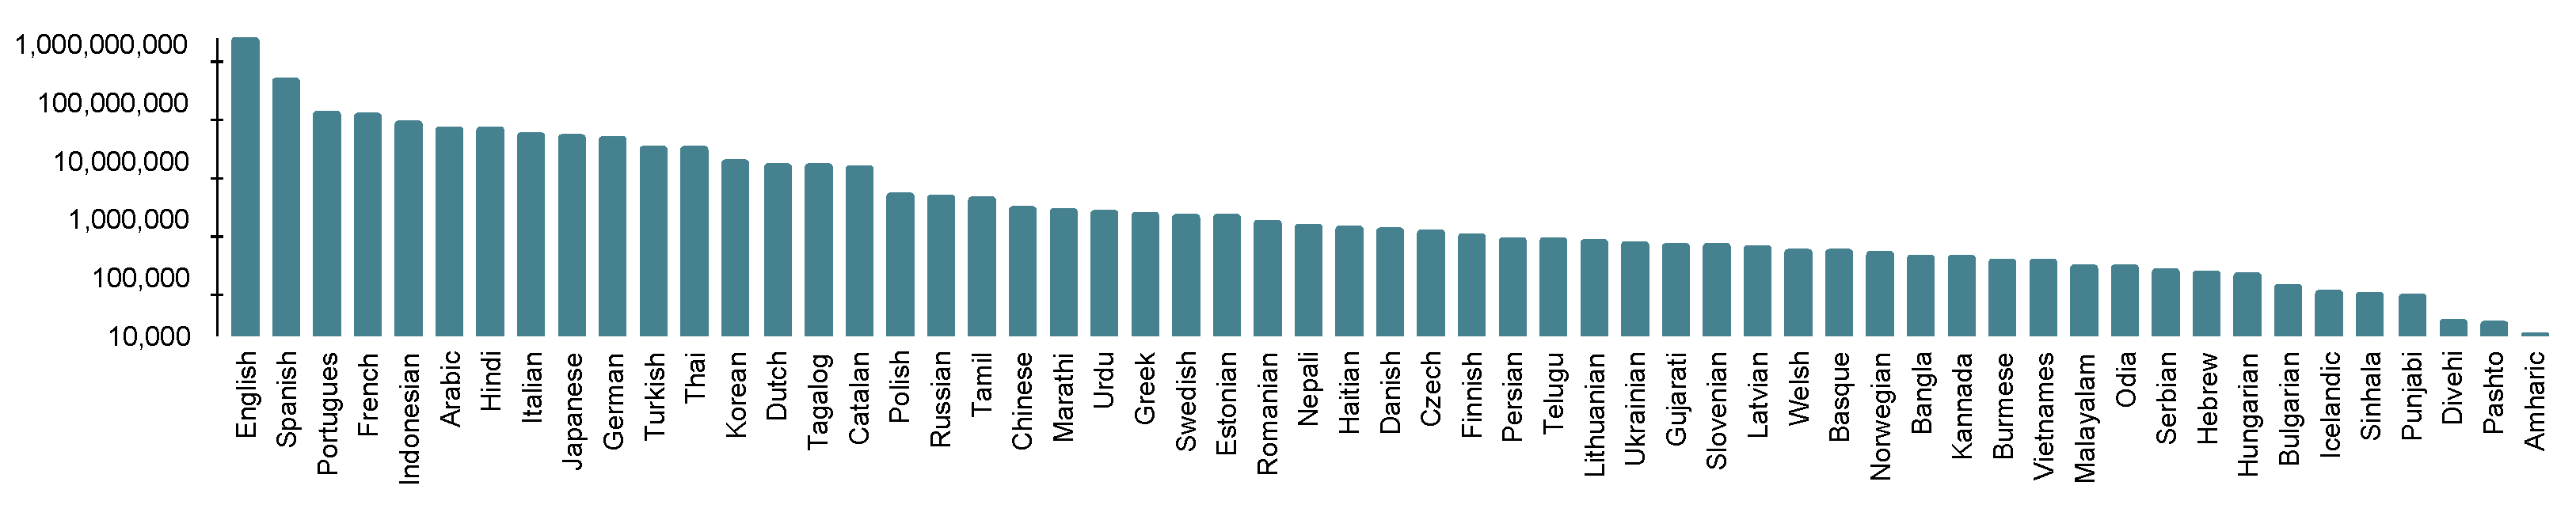
The tweets in TBCOV dataset are posted by 87,771,834 unique users and among them 268,642 are verified users (https://help.twitter.com/en/managing-your-account/about-twitter-verified-accounts (accessed on 20 November 2021)). In total, the dataset covers 67 international languages. Figure 2 shows the distribution of languages with at least 10K tweets and the corresponding number of tweets in the log scale. The English language dominates with around 1 billion tweets and the second and third largest languages are Spanish and Portuguese, respectively. There are around 55 million tweets for which the language is undetermined—this is an important set of tweets suitable for the language detection task with code-mixing properties [31].
The TBCOV dataset is a substantial extension of our previous COVID-19 data release named GeoCoV19 [32]. The TBCOV dataset is superior in many ways. First, the TBCOV dataset contains 1.5 billion more tweets than the GeoCoV19 dataset that consists of 524 million tweets. Second, the data collection period of GeoCoV19 was restricted to only four months (February 2020 to May 2020), whereas the TBCOV coverage is 14 months (February 2020 to March 2021). The third and the most critical extension represents several derived attributes that TBCOV offers, including sentiment labels, named-entities, user types, and gender information. None of these attributes were available in the GeoCoV19 data. Furthermore, the geotagging method used in GeoCoV19 has been substantially improved in TBCOV, which yields better inference results.
2.2. Named-Entity Recognition
Named entities represent key elements in a text, including names of persons, organizations, locations, brands, and dates, among others [22]. Past studies demonstrate diverse applications of named entities on social media, such as finding adverse drug reactions [33] and identifying temporal variations of locations, actors, and concepts from tweets about the Zika outbreak [34]. Moreover, such entities, especially in unstructured social media messages, elicit critical information about an event or a situation along different dimensions—who, where, when, what—i.e., people or organizations involved in a situation, their locations, date or time of the event, their tasks, etc. Named-entity recognition (NER), i.e., the task of identifying and extracting named entities, serves as the basis of many NLP tasks, such as question answering, semantic annotation, information extraction, and text summarization.
Several classical machine learning, and more recently deep learning, techniques have been proposed to perform NER on standard web documents, as well as social media data [35]. NER techniques and models can be either language-specific (i.e., trained for a particular language) or multilingual (i.e., trained to operate on multiple languages). Language-specific models usually outperform multilingual models. Hence, we use five language-specific, deep learning-based NER models targeting the top five languages in our dataset, i.e., English, Spanish, Portuguese, French, and Italian, and a multilingual deep learning model to cover the remaining 62 languages. To this end, we used spaCy [36], which offers state-of-the-art language-specific and multilingual NER models. The English NER model can recognize eighteen different types of entities, including persons, organizations, locations, language, product, time, money, etc. However, all other NER models can detect only the three fundamental entity types, i.e., persons, organizations, and locations in addition to a miscellaneous type representing other entities. We introduced an additional entity, named COVID-ENTITY, to represent different COVID-19 related terms (), including coronavirus, SARS-CoV, SARS-COVID-19, Corona, Covid19, etc. Text of all two billion tweets was first preprocessed by removing URLs, usernames, emojis, and other special characters, and then fed to one of the six NER models depending on the language attribute. Four NVIDIA Tesla P100 GPUs were used to process all the data. Both inference and validation results are presented in the next section.
2.3. Geographic Information
Geotagged social media messages with situational or actionable information have a profound impact on decision-making processes during emergencies [37,38]. For example, recurring tweets showing face mask violations in a shopping mall or a park, or on a beach, can potentially inform authorities’ decisions regarding stricter measures. Moreover, when governments’ official helplines are overwhelmed [39], social media reports, e.g., shortages of essential equipment in a remote hospital or patients stuck in traffic requiring urgent oxygen supply [40], could be life-saving if processed and geotagged timely and effectively. Furthermore, GIS systems, which heavily rely on geotagged information, are critical for many real-world applications, such as mobility analysis, hot-spot prediction, and disease spread monitoring. Despite these advantages, social media messages are often not geotagged, thus are not suitable for automatic consumption and processing by GIS systems. However, they may still contain toponyms or place names, such as street, road, or city—information useful for geotagging.
This work geotags tweets using five meta-data attributes. Three of them, i.e., tweet text, user location, and user profile description, are free-form text fields potentially containing toponym mentions. The tweet text attribute, which represents the actual content of a tweet in 280 characters, can have multiple toponym mentions for various reasons. The user location is an optional field that allows users to add location information, such as their country, state, and city whereas the user profile description field usually carries users’ demographic data [41]. The latter two user-related attributes are potential sources for user location inference [42]. The remaining two attributes, i.e., geo-coordinates and place tags carry geo-information in a structured form that is suitable for the direct consumption by the automatic GIS systems. The geo-coordinates field contains latitude and longitude, which are directly obtained from the users’ GPS-enabled devices. However, many users refrain from enabling this feature, thus only 1–2% of tweets contain exact coordinates [43]. The place attribute carries a bounding box representing a location tag that users optionally provide while posting tweets. Although geo-coordinates and place attributes suit GIS consumption, for the sake of standardization with text-based attributes, we convert them to country, state, county, and city-level information using a process known as “reverse geocoding” which is described next.
The pseudo-codes of the proposed geotagging procedures are presented in Algorithms 1–3. Two common processes across three procedures are (i) geocoding and (ii) reverse geocoding. The geocoding process is used to obtain geo-coordinates from a given place name (e.g., California) while the reverse geocoding process is used to retrieve the place name corresponding to a given geo-coordinates. Multiple geographical databases exist and support these two processes. We use the Nominatim database, which is a search engine of OpenStreetMap [44]. The official online Nominatim service restricts 60 calls/minute, and hence, is not suitable for us to make billions of calls in a reasonable time period. Therefore, we set up a local installation of the Nominatim database. Both Nominatim calls (i.e., geocoding and reverse geocoding) return, among others, a dictionary object named “address” which comprises several attributes, such as country, state, county, and city, depending on the granularity of the location query.
The procedure to process toponyms from text fields (except user location) is highlighted in Algorithm 1. The procedure assumes that all six NER models are already loaded (line 1). After initializing the required arrays, preprocessing of the text (i.e., remove all URLs, usernames, emoticons, etc.) is performed (line 3). The lang attribute, which represents the language of a tweet, determines the NER model to be applied on the processed text for entity extraction. Recall that five language-specific and one multilingual NER models are used in this study. Since NER models return different types of entities, next we iterate over all predicted entities (line 7) to retain the ones with the following types: LOC, FAC, or GPE (line 8). The LOC entity type represents locations of type mountain ranges, bodies of water; the FAC corresponds to buildings, airports, highways, bridges, etc., and GPE represents countries, cities, and states. Finally, a geocoding call per entity is made and responses are stored (line 9 and 10).
| Algorithm 1: Pseudo-code for processing toponyms from text. |
 |
Algorithm 2 outlines the procedure for processing the place attribute. The place_type attribute inside the place object helps determine if a reverse or a simple geocoding call is required (lines 2 and 5). Places of type POI (Point-of-Interest) contain exact latitude and longitude coordinates, and thus, suitable to perform reverse geocoding calls (line 4). However, non-POI places (i.e., city, neighborhood, admin or country) are represented with a bounding box spanning a few hundred square feet (e.g., for buildings) to thousands of square kilometers (e.g., for cities or countries). Moreover, large bounding boxes can potentially cover multiple geographic areas, e.g., two neighboring countries, and, hence, can be ambiguous to resolve. To tackle this issue, we use full_name attribute to make geocoding calls (lines 7 and 16) and compare the country name of the obtained address with that of the original place object (lines 9 and 18). In case countries do not match, as a last resort, a midpoint of the bounding box is obtained (lines 11 and 20) to make reverse geocoding calls (lines 12 and 21).
| Algorithm 2: Pseudo-code for geotagging place object. |
 |
Algorithm 3 outlines the pseudo-code of the overall geotagging process. It starts with loading a batch of tweets (line 1) and iterating over them (line 2). Tweets with coordinates are used to make a reverse geocoding call (lines 3–5). For place tweets, the geoLocalizePlace procedure is called, which is defined in Algorithm 2. Additionally, for the two text-based attributes (i.e., text, user profile description), the geoLocalizeText procedure is called, which is defined in Algorithm 1. However, the user location attribute is pre-processed and geo-coded without applying any NER model (lines 13–15). The evaluation results of the proposed geotagging approach are presented in the next section.
| Algorithm 3: Pseudo-code for the overall processing of all attributes. |
 |
2.4. Sentiment Classification
Understanding public opinion and sentiment is important for governments and authorities to maintain social stability during health emergencies and disasters [45,46]. Prior studies highlighted social networks as a potential medium for analyzing public sentiment and attitude towards a topic [47]. Opinionated messages on social media can vary from reactions on a policy decision [48] or expressions of sentiment about a situation[49] to sharing opinions during sociopolitical events, such as the Arab Spring [50]. Sentiment analysis, which is a computational method to determine text polarity, is a growing field of research in the text mining and NLP communities [51]. There is a vast literature on the algorithms and techniques proposed for sentiment analysis—detailed surveys can be found in [52,53,54]. Moreover, numerous studies employ sentiment analysis techniques to comprehend public sentiment during events ranging from elections and sports, to health emergencies [49,55]. We are interested in understanding the public sentiment perceived from multilingual and multi-topic COVID-19 tweets from worldwide.
Our Twitter data are multilingual and cover dozens of real-world problems and incidents, such as lockdowns, travel bans, and food shortages, among others. Thus, sentiment analysis models that focus on specific topics or domains and support specific languages do not suit our purpose. For this reason, we ideally need a language model which is not tied to one single sentiment analysis task, rather trained on general-purpose multilingual representations.
The NLP community offers a myriad of multilingual architectures ranging from LSTMs to more famous transformer-based models [54]. Most recently, a transformer-based model called XLM-T has been proposed as a multilingual variant of the XLM-R model [56] by fine-tuning it on millions of Twitter general-purpose data in eight languages [17]. Although the original XLM-R model is trained on 100 languages using more than two terabytes of filtered CommonCrawl data, its Twitter variant XLM-T achieves better performance on a large multilingual benchmark for sentiment analysis [17]. Hence, we used the XLM-T model to obtain sentiment labels and confidence scores for all two billion tweets in our dataset.
2.5. User Type and Gender Classification
Twitter has 186 million daily active users, with 70.4% male and 29.7% female users [57]. Twitter users represent, among others, businesses, government agencies, NGOs, bots, and, most importantly, the general public [58,59]. Information about user types is helpful for many application areas, including customer segmentation and engagement [60], making recommendations [61], users profiling for content filtering [62], and more. Moreover, users demographic information, such as gender, is important for addressing societal challenges, such as identifying knowledge gaps [26], health inequities [28], digital divide [27], and other health-related issues [29]. The tweets in TBCOV are from 87.7 million unique users worldwide, which is 47% of the daily active users on Twitter. Our aim is to determine accounts which belong to the general public, hereinafter personal accounts, and their gender. However, Twitter neither provides account types nor their gender information. To this end, we observed that user-provided names in personal accounts can potentially be used to not only distinguish them from other types such as organizational accounts, their morphological pattern are indicative of gender as well [63,64]. For example, the username “Capital Press” is a media account whereas the username “Laura Sanchez” is a personal account that likely belongs to a female.
First, we determine user type (i.e., personal, organizations, etc.) by applying the English NER model (described previously) on user-provided names. Usernames are preprocessed (i.e., remove URLs, numerals, emojis, tabs spaces, newlines) prior to feeding the model, which assigns one of the 18 entity types to a username, including person.
Next, we seek to further disaggregate the identified personal accounts by their gender. Prior studies demonstrate that morphological features of a person’s given name (also known as a first name or forename) provide gender cues, such as voiced phonemes are associated with male names and unvoiced phonemes are associated with female names [64]. Hence, the first names of the identified personal accounts are employed for training a supervised machine learning classifier. Several publicly available name-gender resources were used [65,66,67] as our training datasets. Names in these datasets are written using the English alphabets. We combined the datasets and removed duplicates. This process yielded 121,335 unique names with a distribution of female and male as 73,314 (60%) and 48,021 (40%), respectively.
Prior to training the classifier, data were split into train and test sets with a 80:20 ratio, respectively, and phonetic features from first names are extracted by moving a variable-sized window over them in two directions (i.e., left-to-right and the opposite). The window of length one moves from its starting point (i.e., either the first or the last character of a name). Subsequent moves increase window size by one until a threshold value is reached. The threshold limits the number of features required in one direction, which we empirically learned by experimenting several values ranging from 1 to 7 (i.e., 7 is the average length of names in our dataset). Fewer than four features (in one direction) negatively impact classifiers’ performance, whereas, larger values yield diminishing effect. Thus, a threshold of four is set, i.e., representing the first four and last four features of a name. For example, given a name “Michael”, the feature extraction method extracts eight features, four from the start (i.e., ‘m’, ‘mi’, ‘mic’, ‘mich’) and four from the last (i.e., ‘l’, ‘el’, ‘ael’, ‘hael’). The extracted features are then encoded with their corresponding positions in names, e.g., the ‘mic’ feature in the earlier example caries its position, i.e., first-three-letters. The extracted positional features are then used to train several well-known machine learning classifiers, including Naive Bayes [68], Decision Trees [69], and Random Forests [70]. We present validation results in the next section.
3. Results
This section presents validation details and performances of the employed computational methods. Moreover, results obtained by applying the computational methods to all two billion tweets to infer latent attributes such as sentiment, entities, geo, and gender, are presented in this section.
3.1. Named-Entities Results
The named-entities extraction process used five language-specific and one multilingual NER models. Table 2 shows the performance of these six NER models as reported on the spaCy website [36] (We note that these performance scores may be updated by spaCy when/if they release newer trained models and pipelines). The entities recognition and extraction process resulted 4.7 billion entities from all tweets. Table 3 shows the number of entities extracted of type person, organization, location, and misc (i.e., miscellaneous) for the top four languages. The selected languages represent 38% of person, 68% of organization, and 76% of location out of all the extracted entities. The remaining entities represent a long-tail distribution. The high proportion of the location-based entities in tweets is interesting and potentially useful for several tasks, such as virus hot-spot prediction and mobility analysis. However, such applications require an efficient extraction and geolocalization of the location toponyms from tweets, which we obtain using the proposed geotagging method.
3.2. Geotagging Results
To evaluate the proposed geotagging method, we first obtain ground-truth data for different attributes. Geotagged tweets with GPS coordinates, i.e., latitude and longitude, were used as ground truth for the evaluation of the place field. Specifically, tweets with (i) geo-coordinates and (ii) place fields are sampled and their location granularities, such as country, state, county, and city were obtained from Nominatim using its reverse geocoding API. Finally, we compute the precision metric, i.e., the ratio of correctly predicted locations (true positives) to the total predicted outcomes (i.e., sum of true positives and false positives) at each granularity. Table 4 shows the evaluation results along with the number of sampled tweets (in parenthesis). All location granularity scores except county are promising.
The evaluation of the user location geotagging method is performed on a manually annotated (The authors of this paper performed the manual annotation). We used a random sample of 500 user locations, which satisfies the minimum sample size of 385 for populations greater than one million with a confidence level of 95% and a confidence interval of 5% according to Cochran’s formula [71], a commonly used metric in statistics. Specifically, each user location string was examined to determine its corresponding country, state, county, and city. Google search, Wikipedia, and other sources were allowed to search and disambiguate when multiple candidates emerged. Location strings, such as “Planet earth”, were annotated as “NA” and used in the evaluation procedure (i.e., the system’s output for an “NA” case is considered True Positive if blank and False Positive otherwise). Table 5 shows the evaluation results in terms of precision, recall, and F1-score. Overall, the F1-scores for all location granularities are high. However, fine-grained location resolution poses more challenges for the method (e.g., the recall at the city level is 0.656 compared to the recall of 1.0 at the country level).
Lastly, to evaluate text-based attributes (i.e., tweet text and user profile description), 1000 tweets in English were randomly sampled and crowdsourced on Appen, which is a paid crowdsourcing platform. Specifically, given a tweet text, annotators were asked to (i) tag toponyms (i.e., location names such as USA, Paris) and (ii) specify the location type (i.e., country, state, county, and city) of the identified toponyms. Three evaluation metrics, i.e., precision, recall, and F1-score were computed using the annotated location tokens. Table 6 presents geotagging evaluation results for the two text-based attributes (i.e., tweet text and user profile description). Geotagging at country and state levels yields promising F1-scores (i.e., 0.803 and 0.703, respectively). However, the results for county and city are weak.
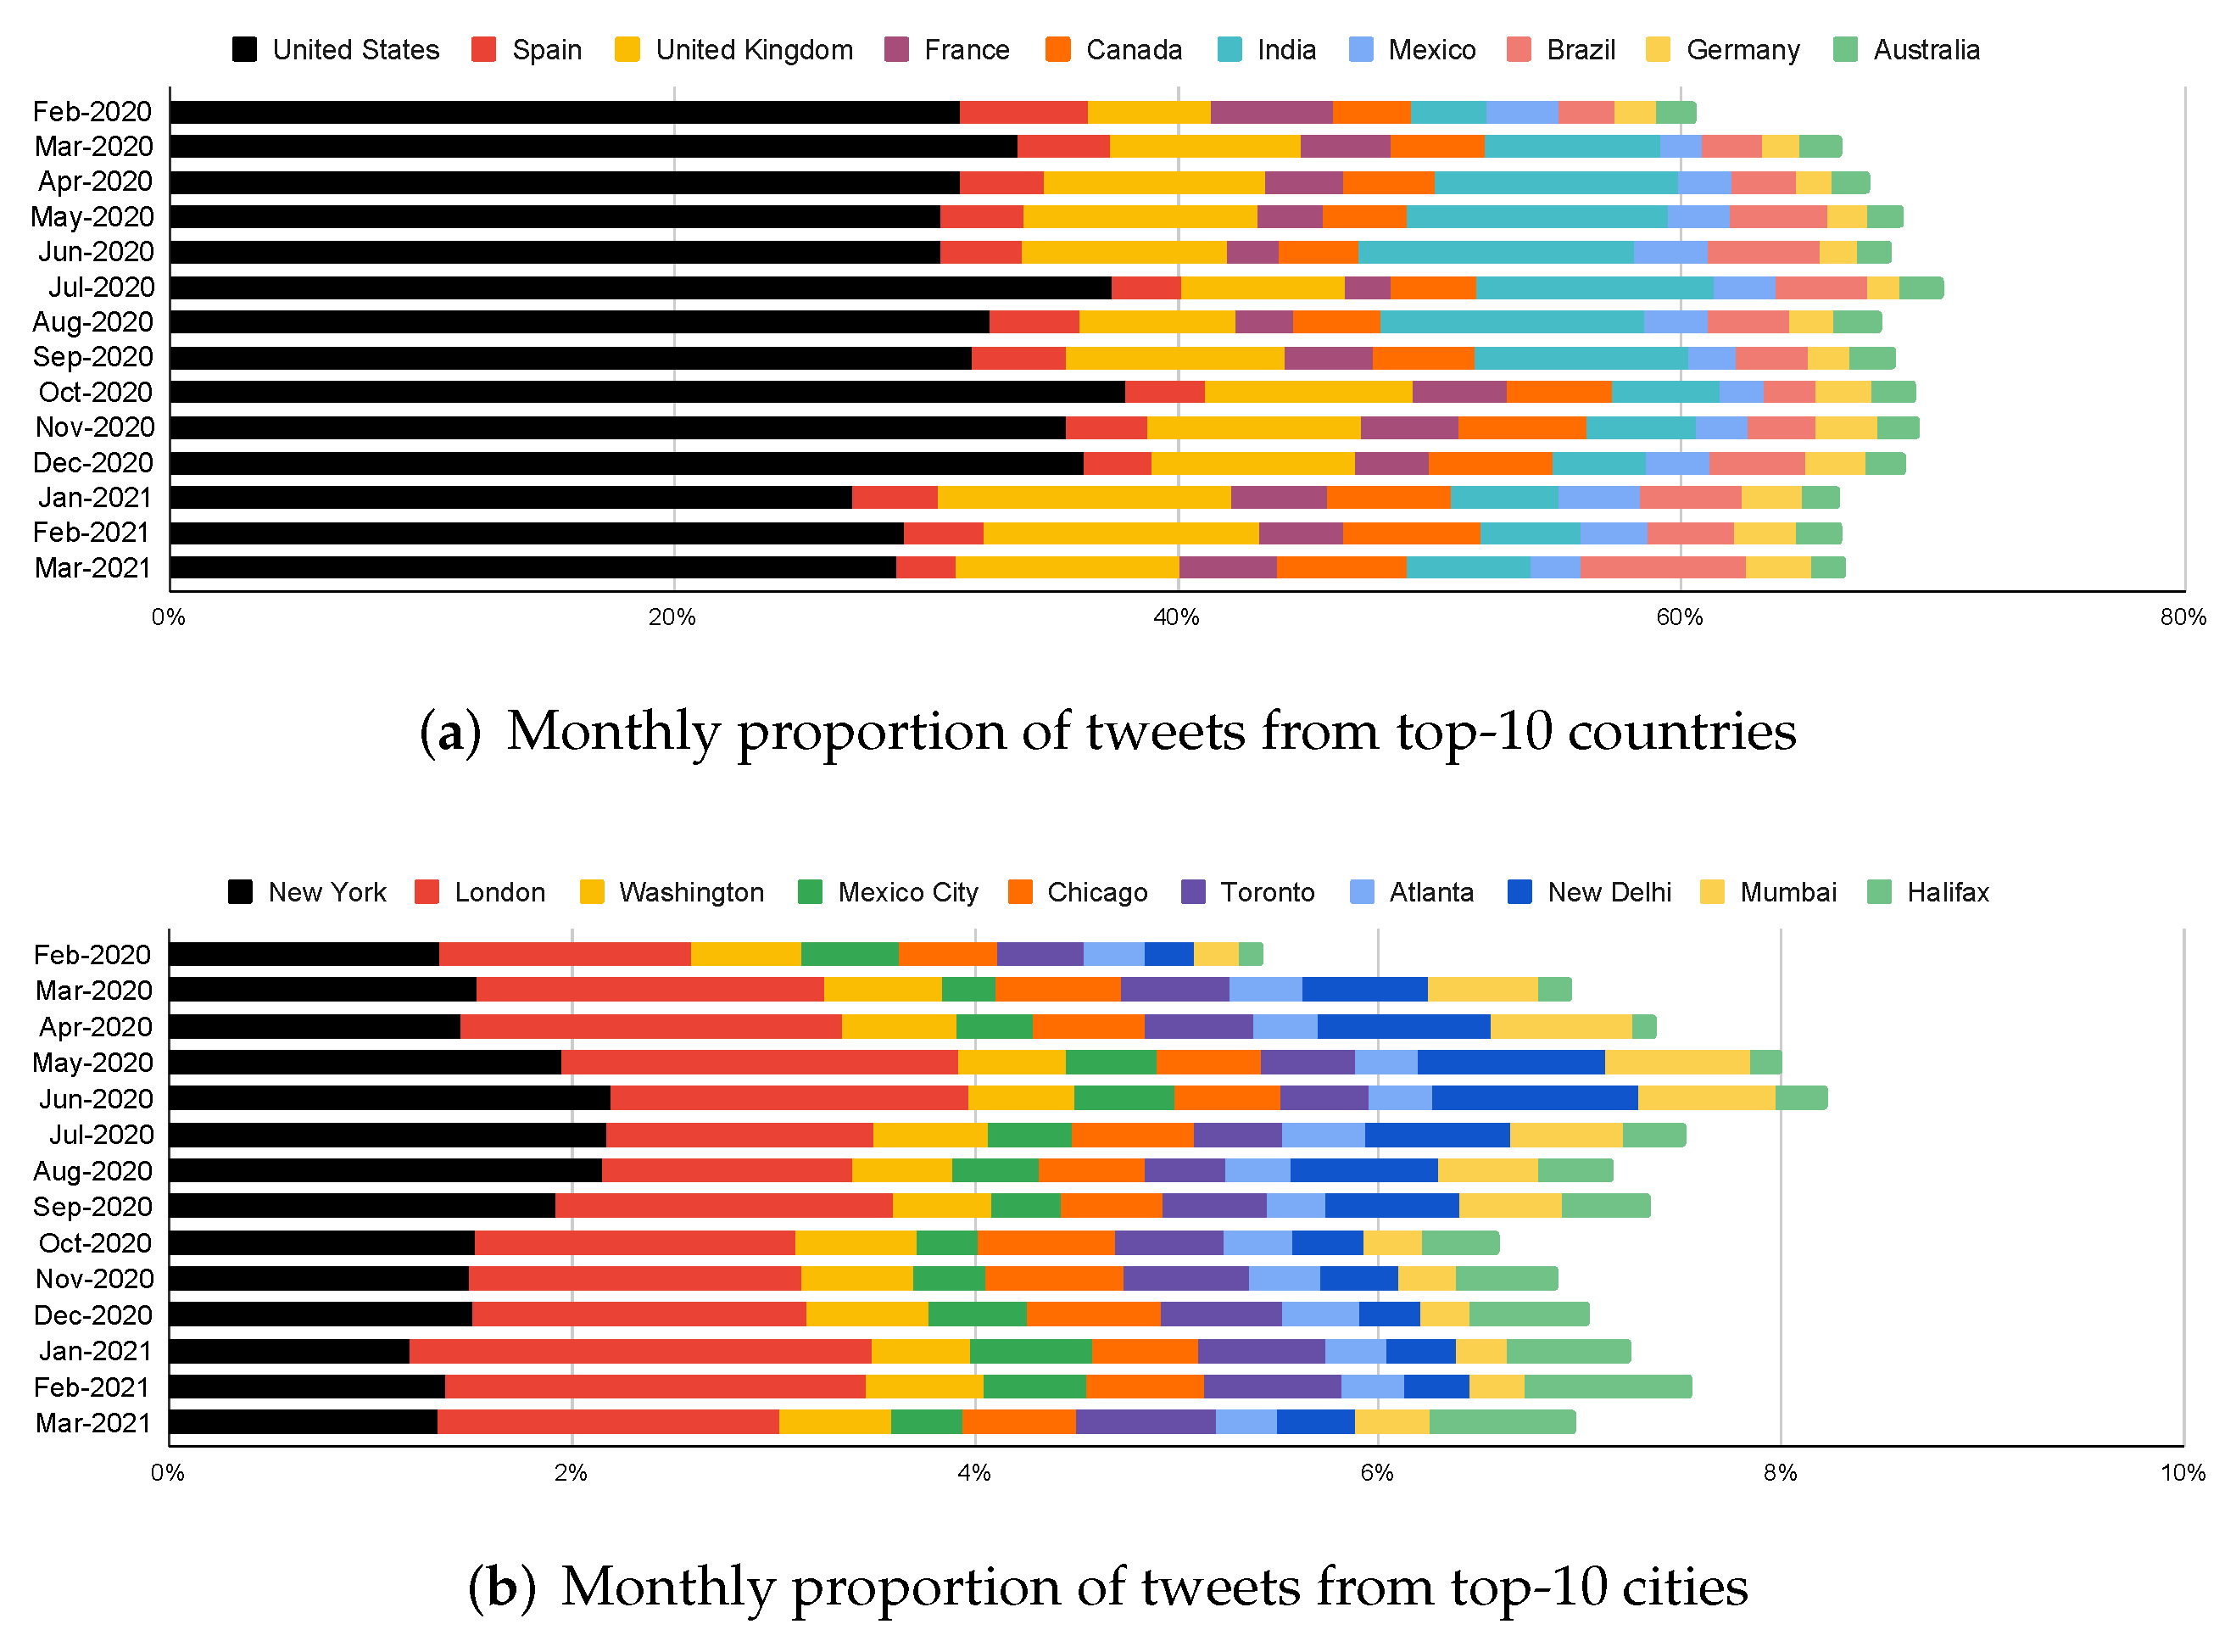
Next, the geotagging approach is applied on all the tweets in TBCOV, which identified 515,802,081 mentions of valid toponyms from tweet text and 180,508,901 from user profile description. More importantly, out of all 1,284,668,011 users’ self-declared locations in the user location field, 1,132,595,646 (88%) were successfully geotagged. Moreover, the process yielded 2,799,378 and 51,061,938 locations for geo-coordinates and place fields, respectively. Table 7 shows important geotagging results, including total occurrences, geotagging yield, and resultant resolved locations granularity at country, state, county, and city level. To determine the country, state, county, and city of a tweet, we mainly rely on three attributes. The first two attributes are users’ self-reported location in the user location or user profile description fields. GPS coordinates are used (if available) in case a tweet is not resolved through user location and user profile description fields. Altogether more than 1.8 billion locations corresponding to 218 unique countries, 2518 states, 26,605 counties, and 24,424 cities worldwide were resolved based on OpenStreetMap’s Nominatim database. The dataset contains 175 countries and 609 cities around the world with at least 100K tweets. Figure 3 depicts the monthly distribution of top-10 countries and cities throughout the data collection period.
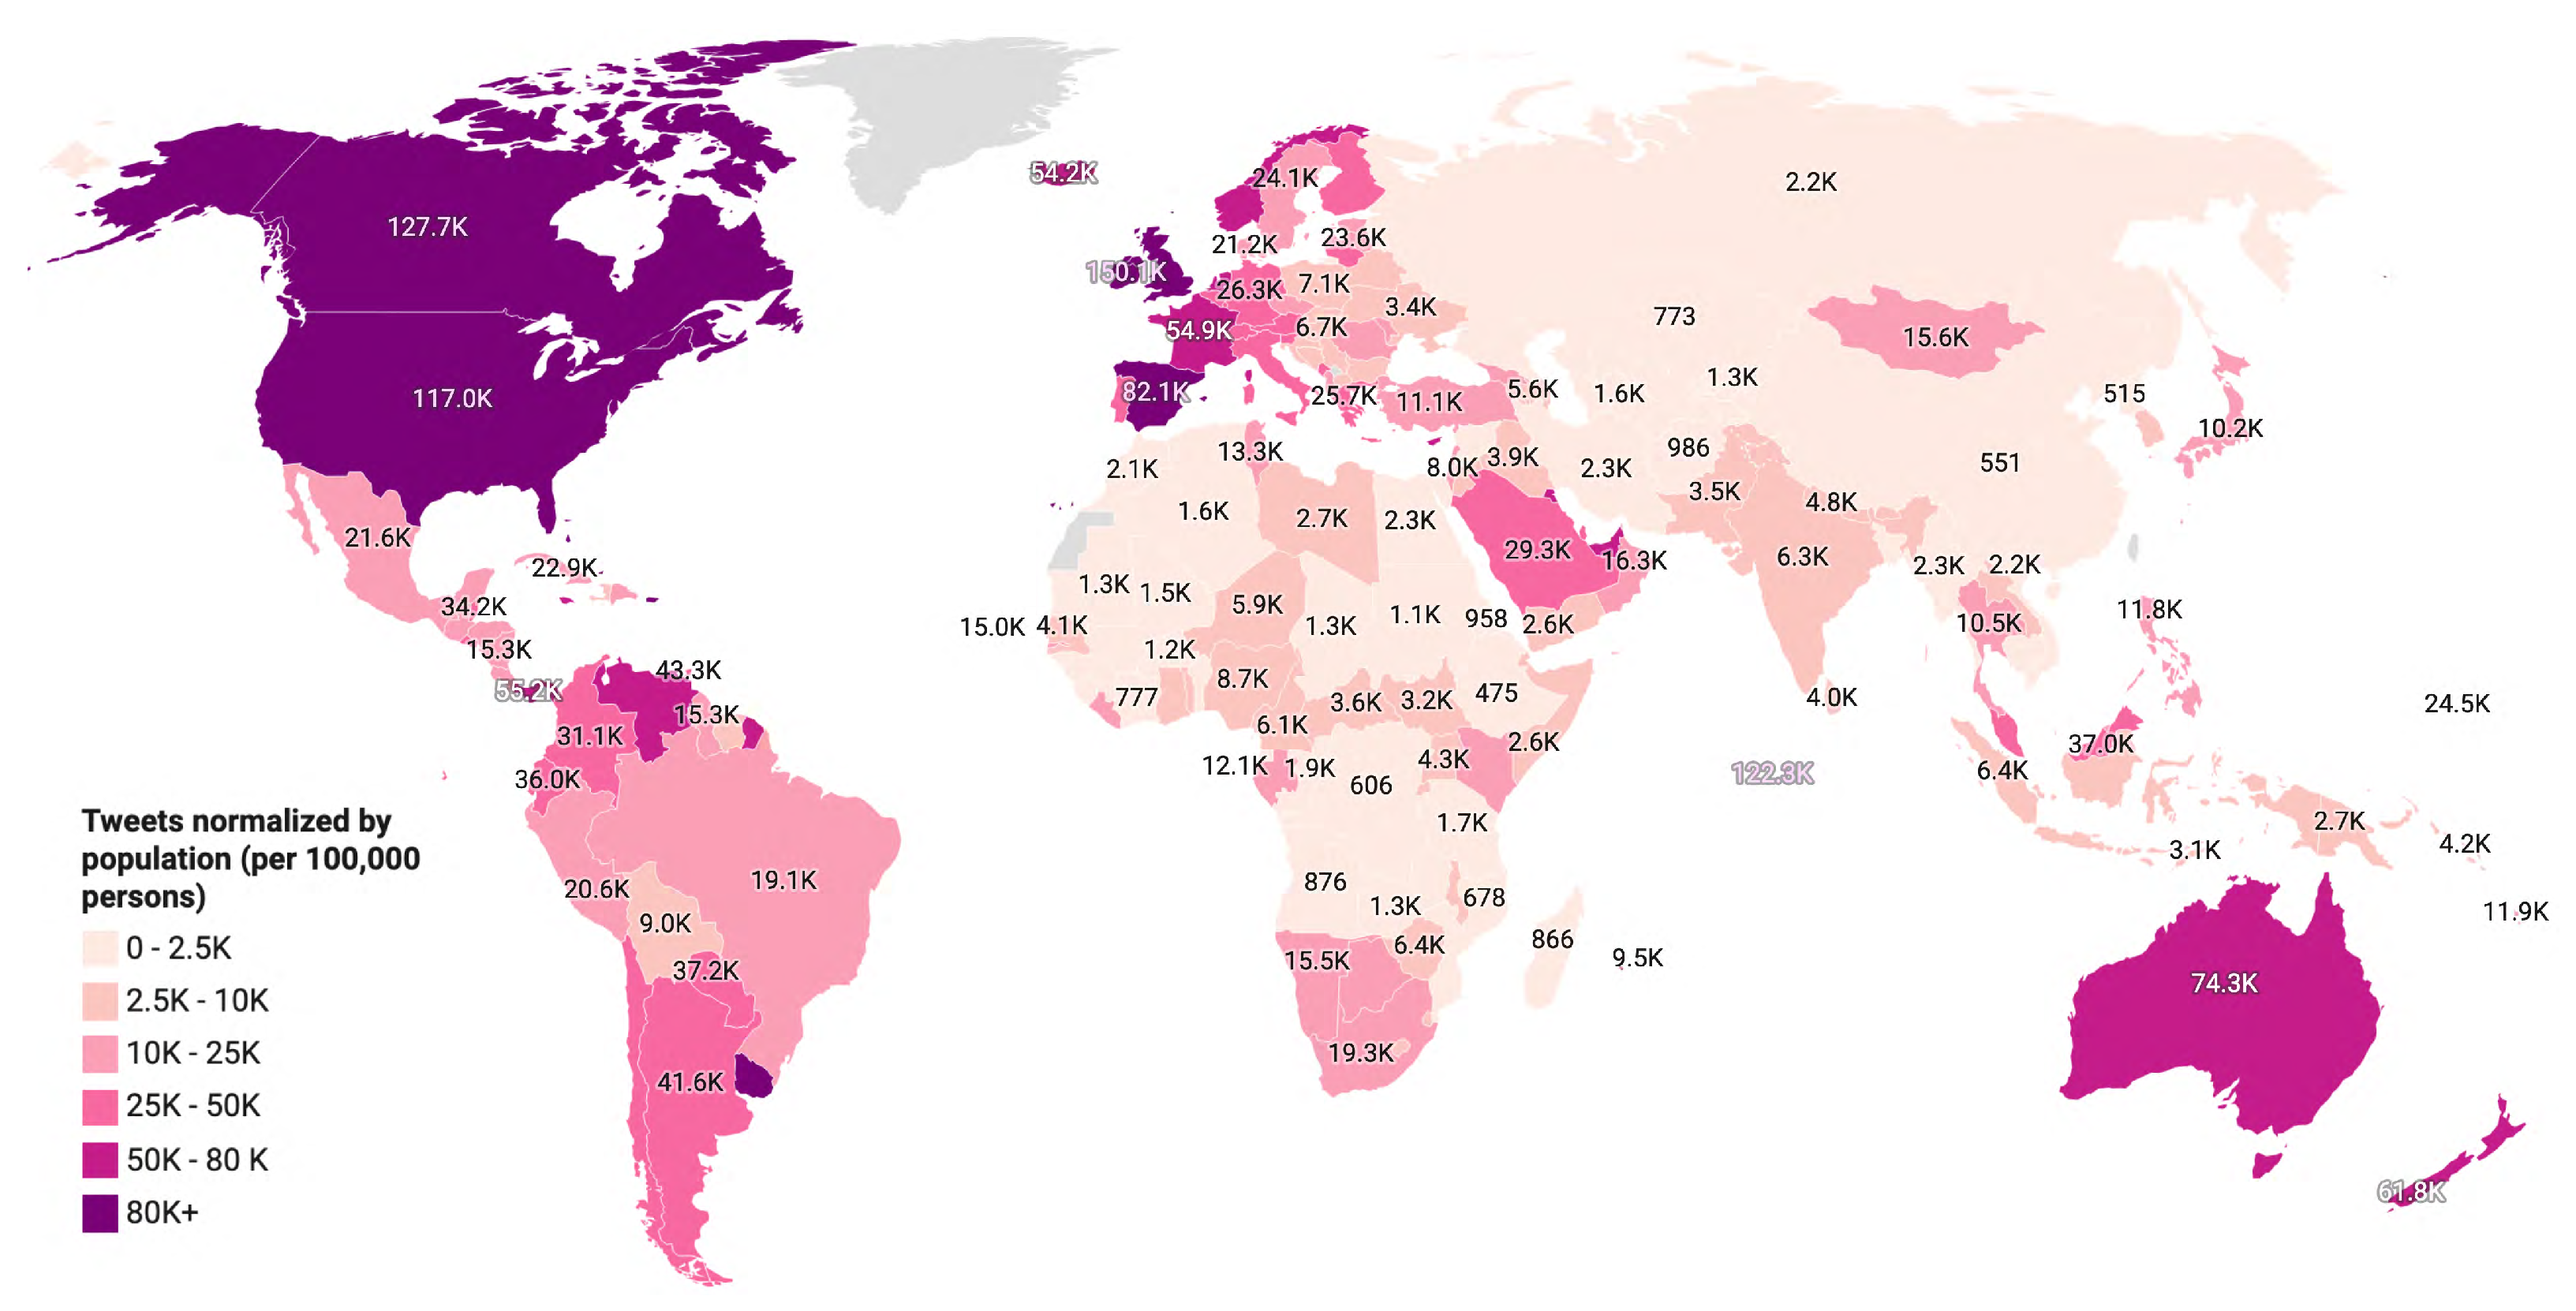
To allow meaningful comparisons of geotagged tweets across different countries, we normalize tweets from each country by its population and calculate posts per 100,000 persons. For this purpose, geotagged tweets resolved through user location, user profile description, and geo coordinates attributes were used. Figure 4 shows the normalized counts of geotagged tweets for each country on a world map.
3.3. Sentiment Analysis Results
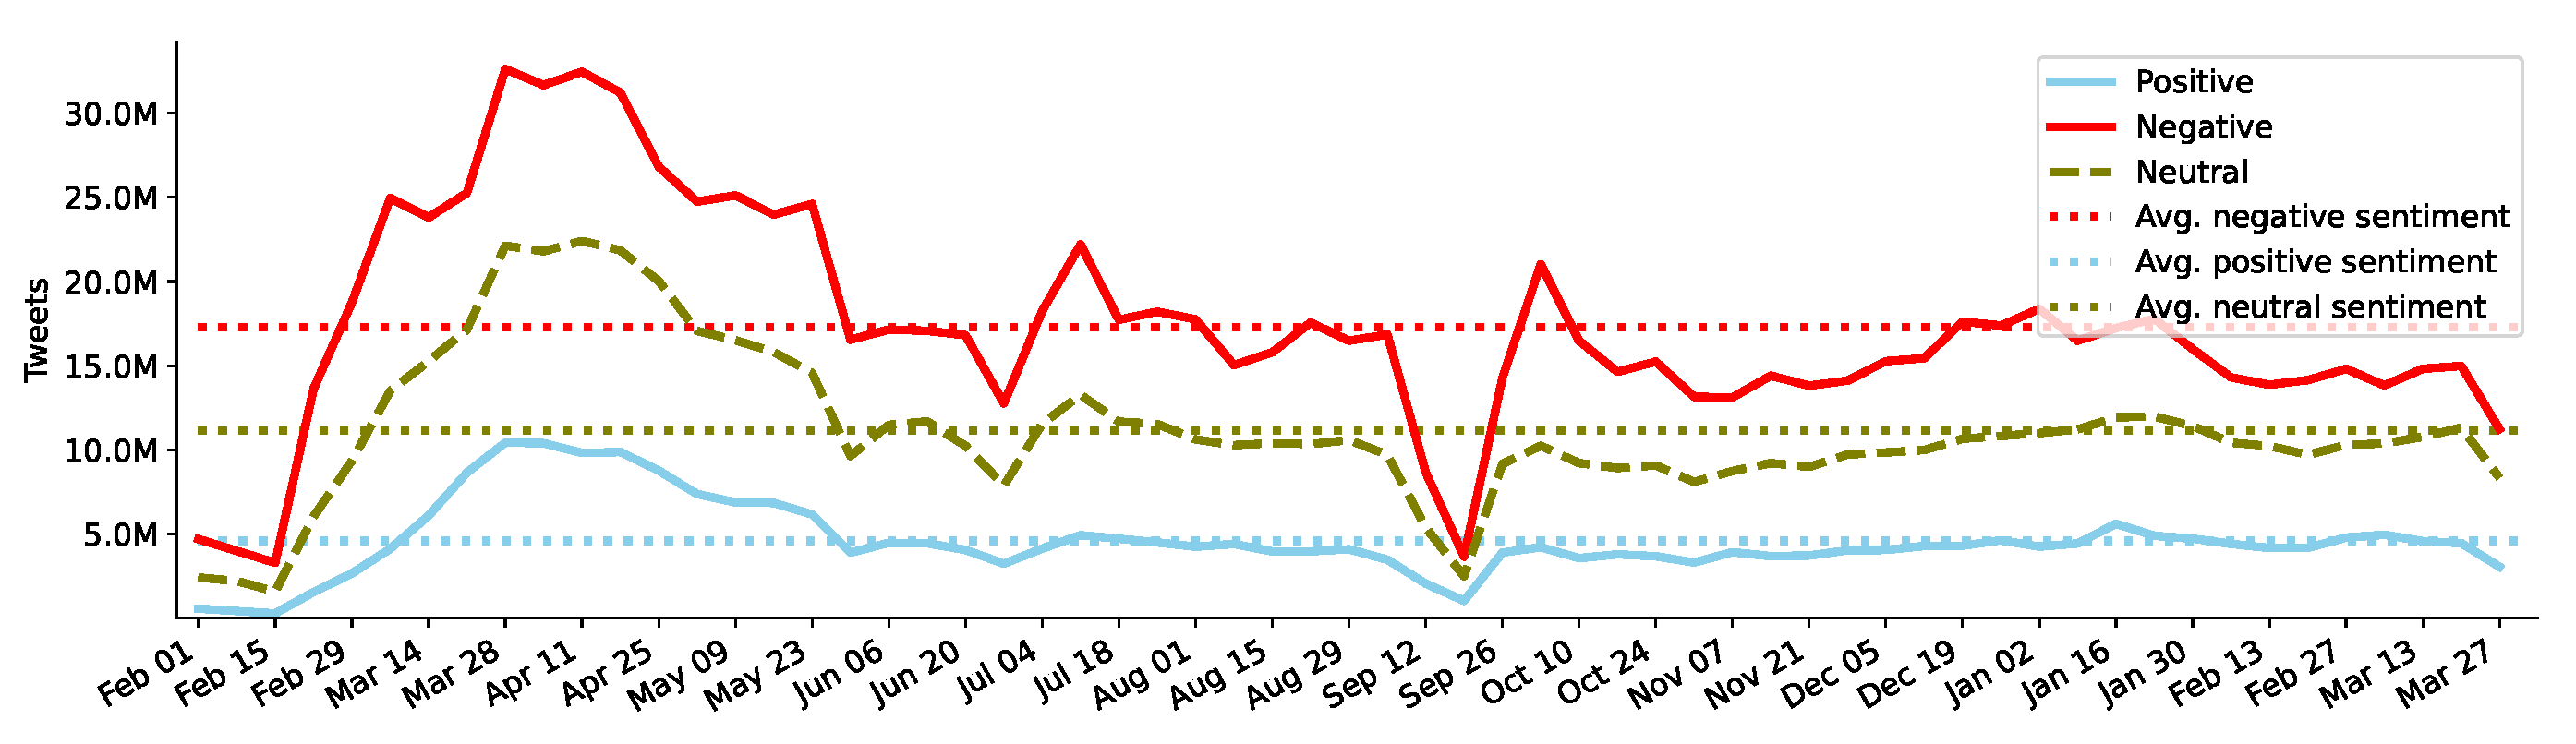
As mentioned in the methods section, we used the multilingual XLM-T model [17] to obtain sentiment labels and confidence scores for all two billion tweets in our dataset. Of all tweets, 1,054,008,922 (52.31%) labeled as negative, 680,300,793 (33.77%) as neutral, and 280,483,181 (13.92%) as positive. Figure 5 presents weekly aggregation of sentiment labels for all tweets in all languages. As anticipated, the negative sentiment dominates throughout (i.e., all 14 months) the data collection period. A significant surge of negative sentiment is apparent in the beginning of March, peaking in April (first week), and then averaging down during the later months. Several hills and valleys appear, but no week after April 2020 reaches as high as negative tweets surged in April. The neutral sentiment worldwide stays always lower than the negative, but follows a similar pattern as in the case of the negative sentiment. Not surprisingly though, the positive sentiment remains the lowest sentiment expressed in tweets with steady average except a few weeks in April 2020.
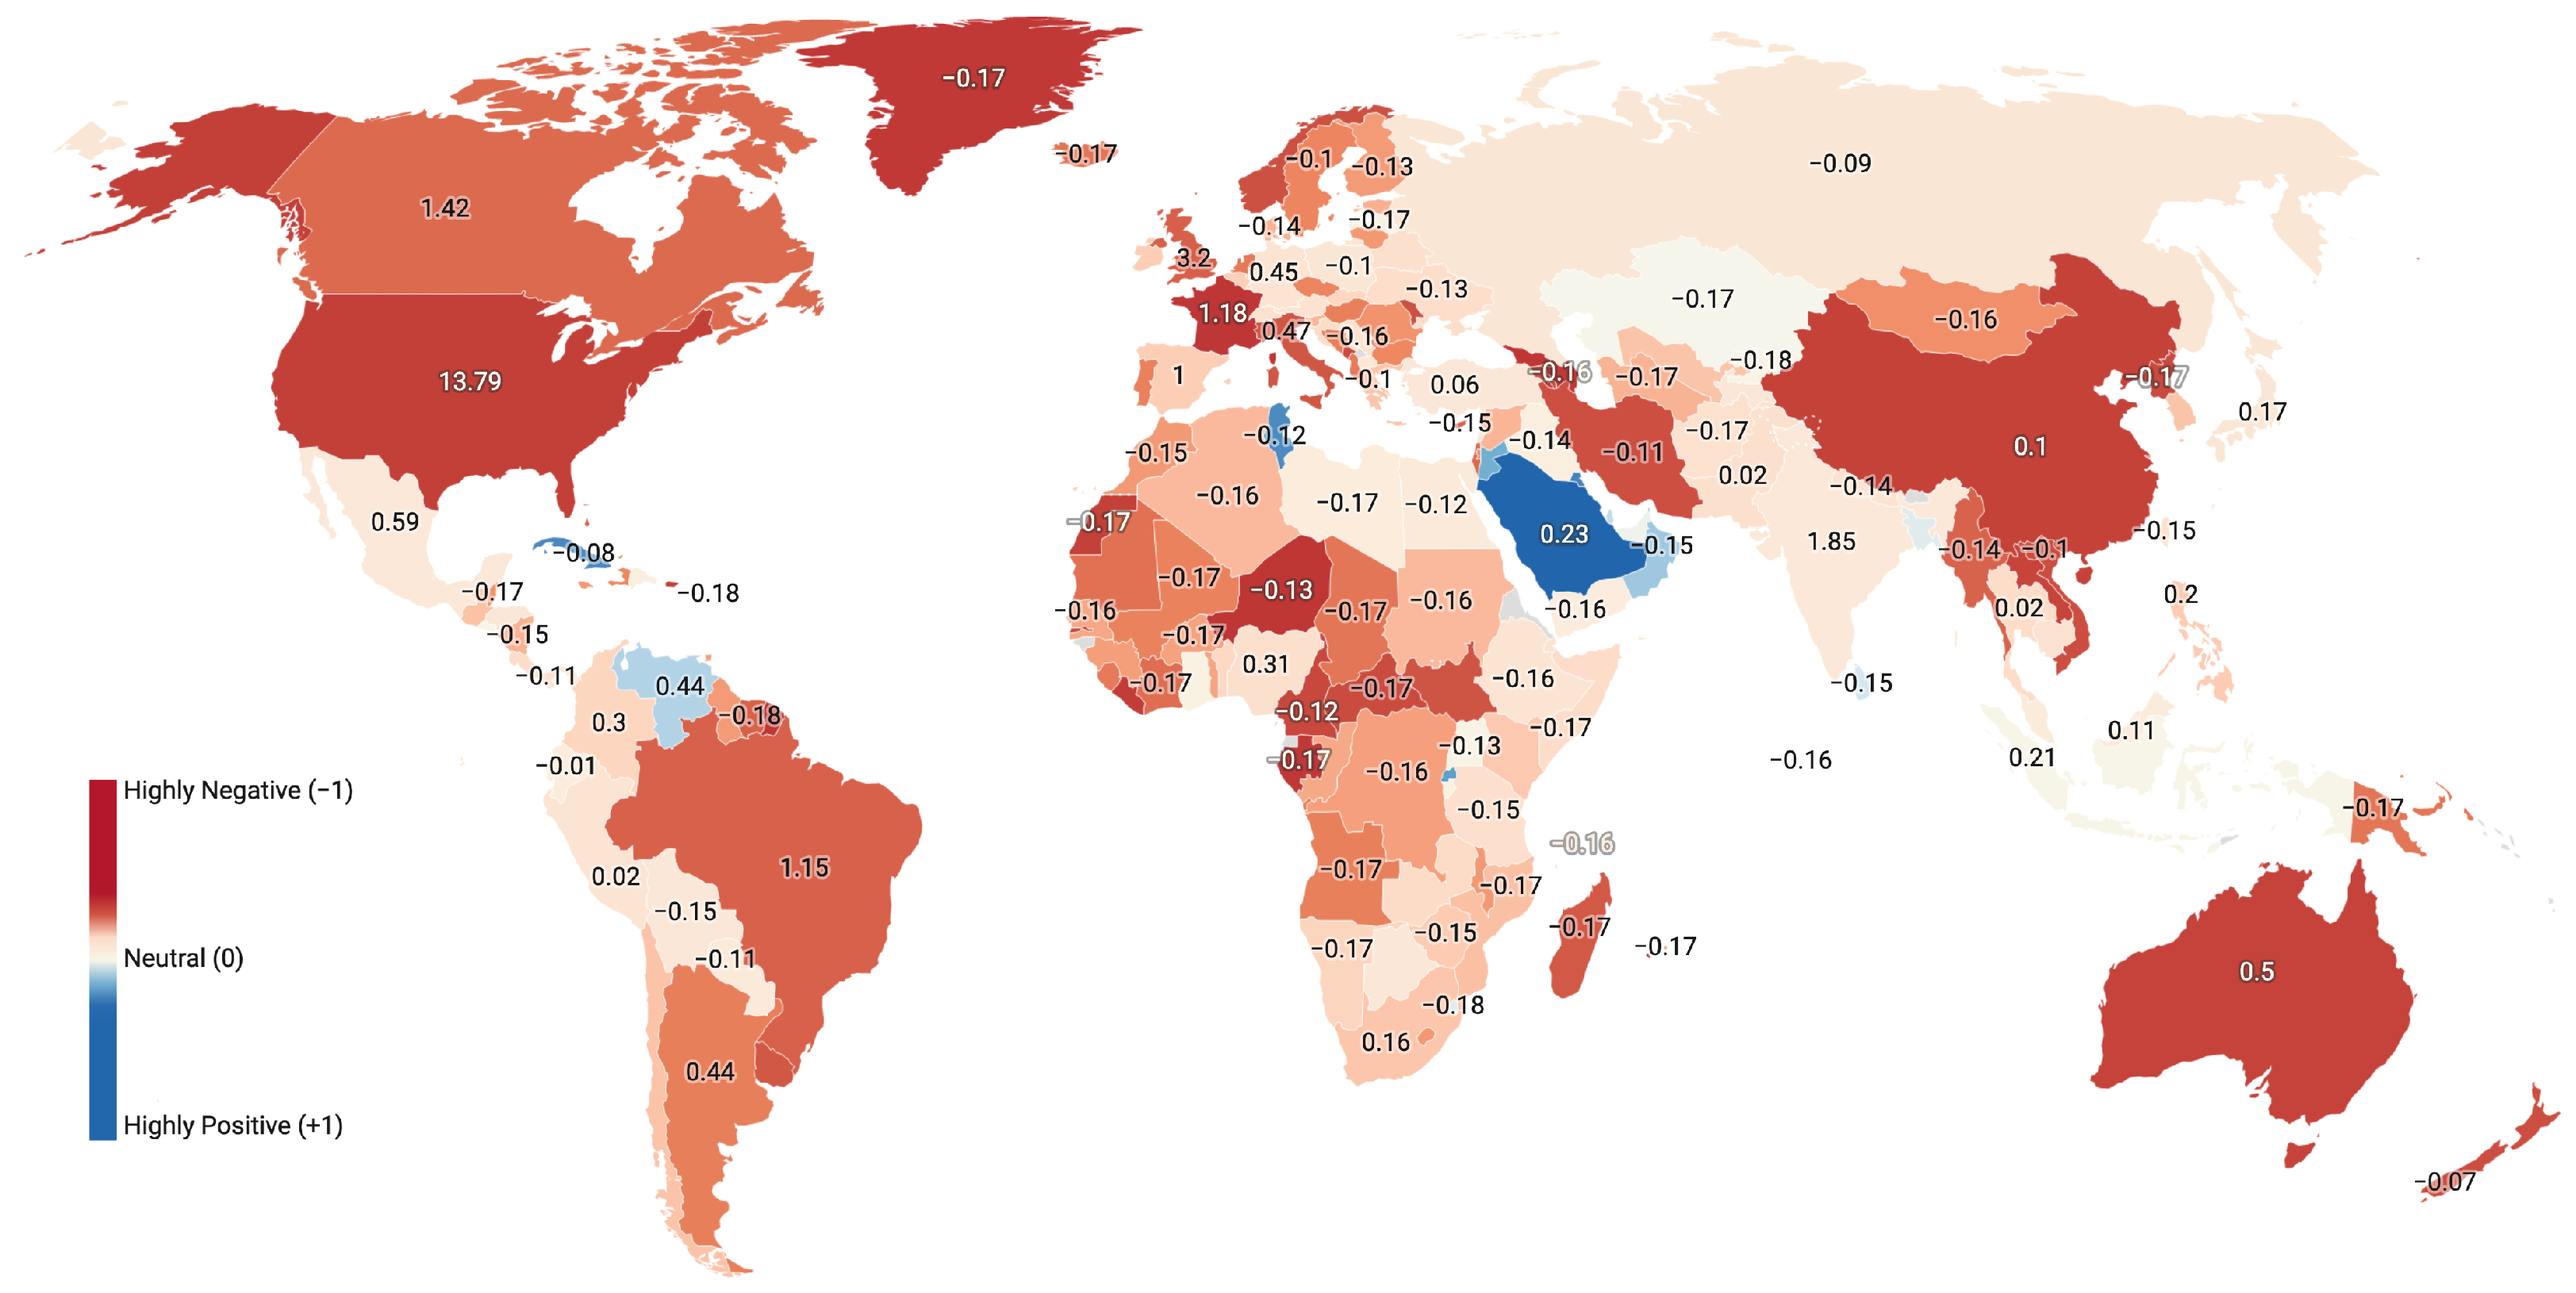
Figure 6 shows countries’ aggregated sentiment on a world map. The sentiment scores for countries represent normalized weighted averages based on the total number of tweets from a country and model’s confidence scores for positive, negative, and neutral tweets. Equation (1) shows the computation of weighted average sentiment score for a country:
where represents the sentiment label of tweet i form country c while indicates the model’s confidence score for , and corresponds to the total number of tweets from the country. The normalized score () ranges from −1 to 1, where −1 represents high-negative and 1 high-positive, with zero being neutral. The model confidence score () represents the model’s trust level for assigning a sentiment class to a tweet and it ranges between 0 and 1. It is important to note that particularly aims to proportion negative sentiment tweets against other positive or neutral sentiment tweets since neutral sentiment can be considered as a weak form of positive sentiment from a practitioner perspective especially during emergencies. Therefore, Equation (1) does not completely exclude neutral sentiment tweets by assigning zero weight to them. The numbers on top of each country are z-scores computed using the representative sentiment tweets normalized by the total tweets from all countries. Overall, the map shows overwhelming negative sentiment across all except a few countries. Surprisingly, Saudi Arabia and other Gulf countries, including Qatar, UAE, and Kuwait, show a strong positive sentiment. Rest of the world, including the US, Canada, and Australia, show moderate to strong negative sentiment.
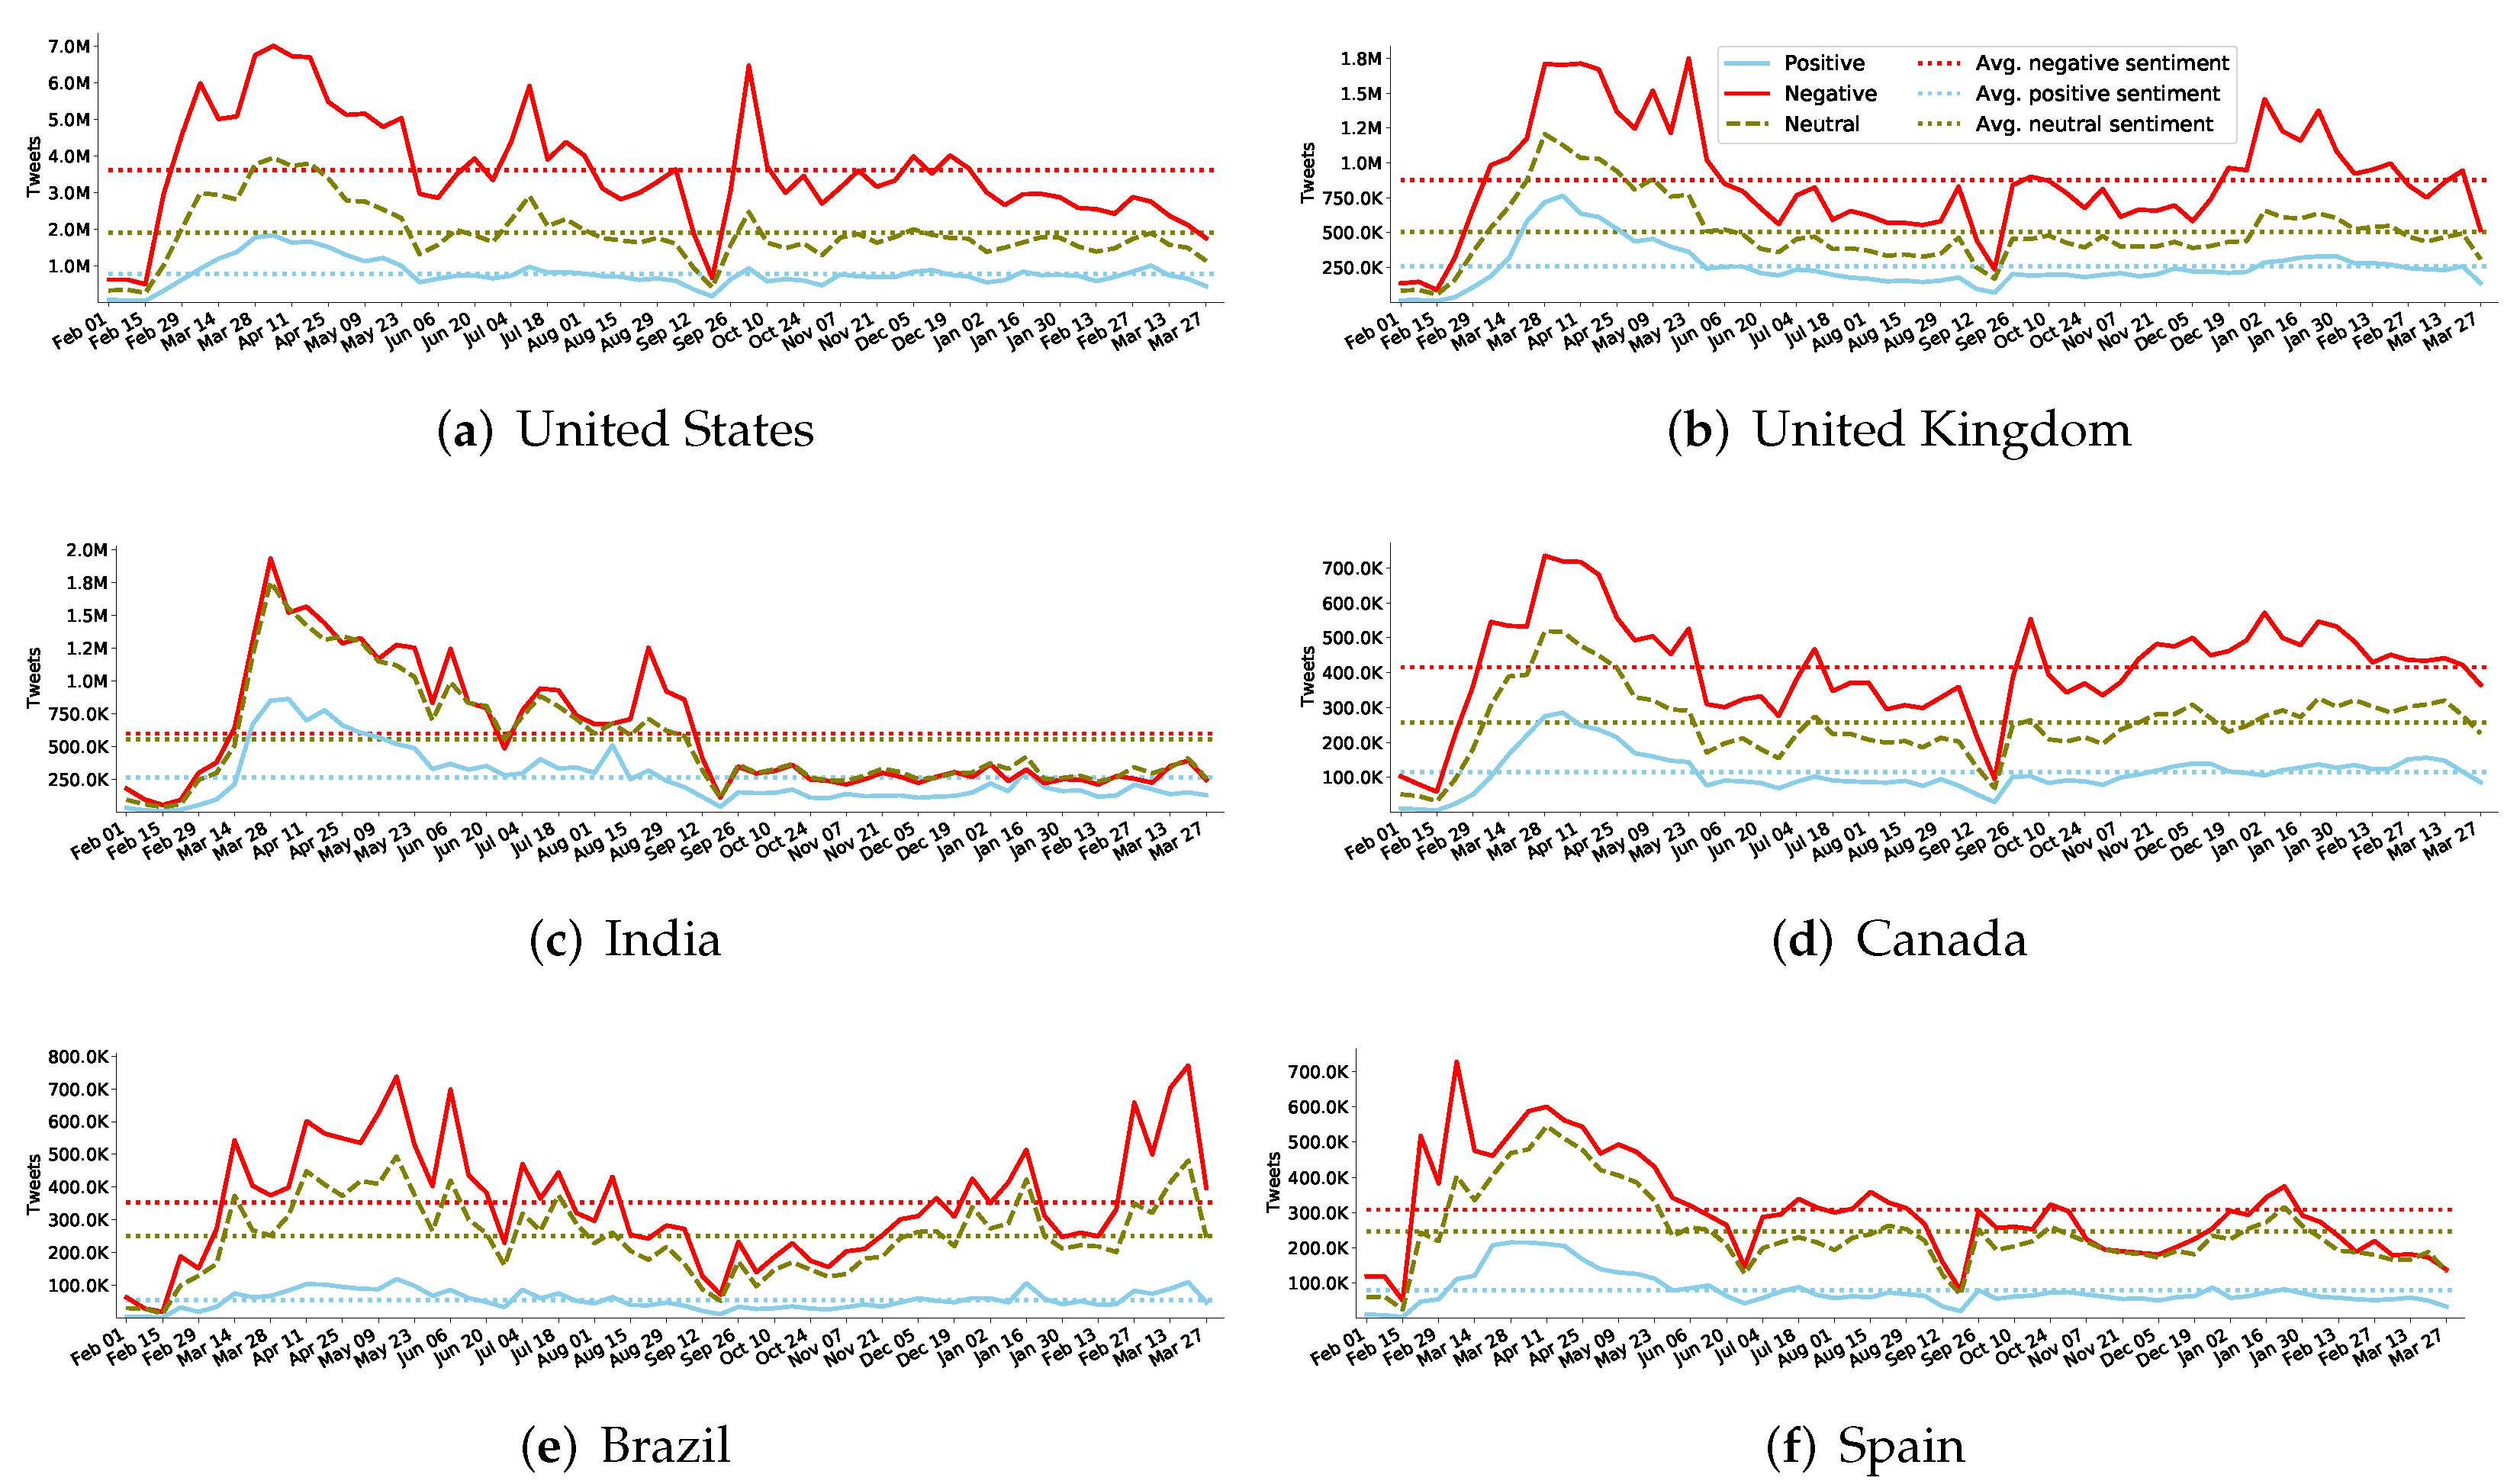
Figure 7 shows the weekly sentiment trends for the top-six countries (by total tweets in our data). Consistent to the worldwide sentiment trends, the negative sentiment of all six countries dominates throughout. Although a few countries (US, UK, and India) reach a couple million negative tweets for a few weeks, the other countries stay lower around half a million in the remaining weeks.
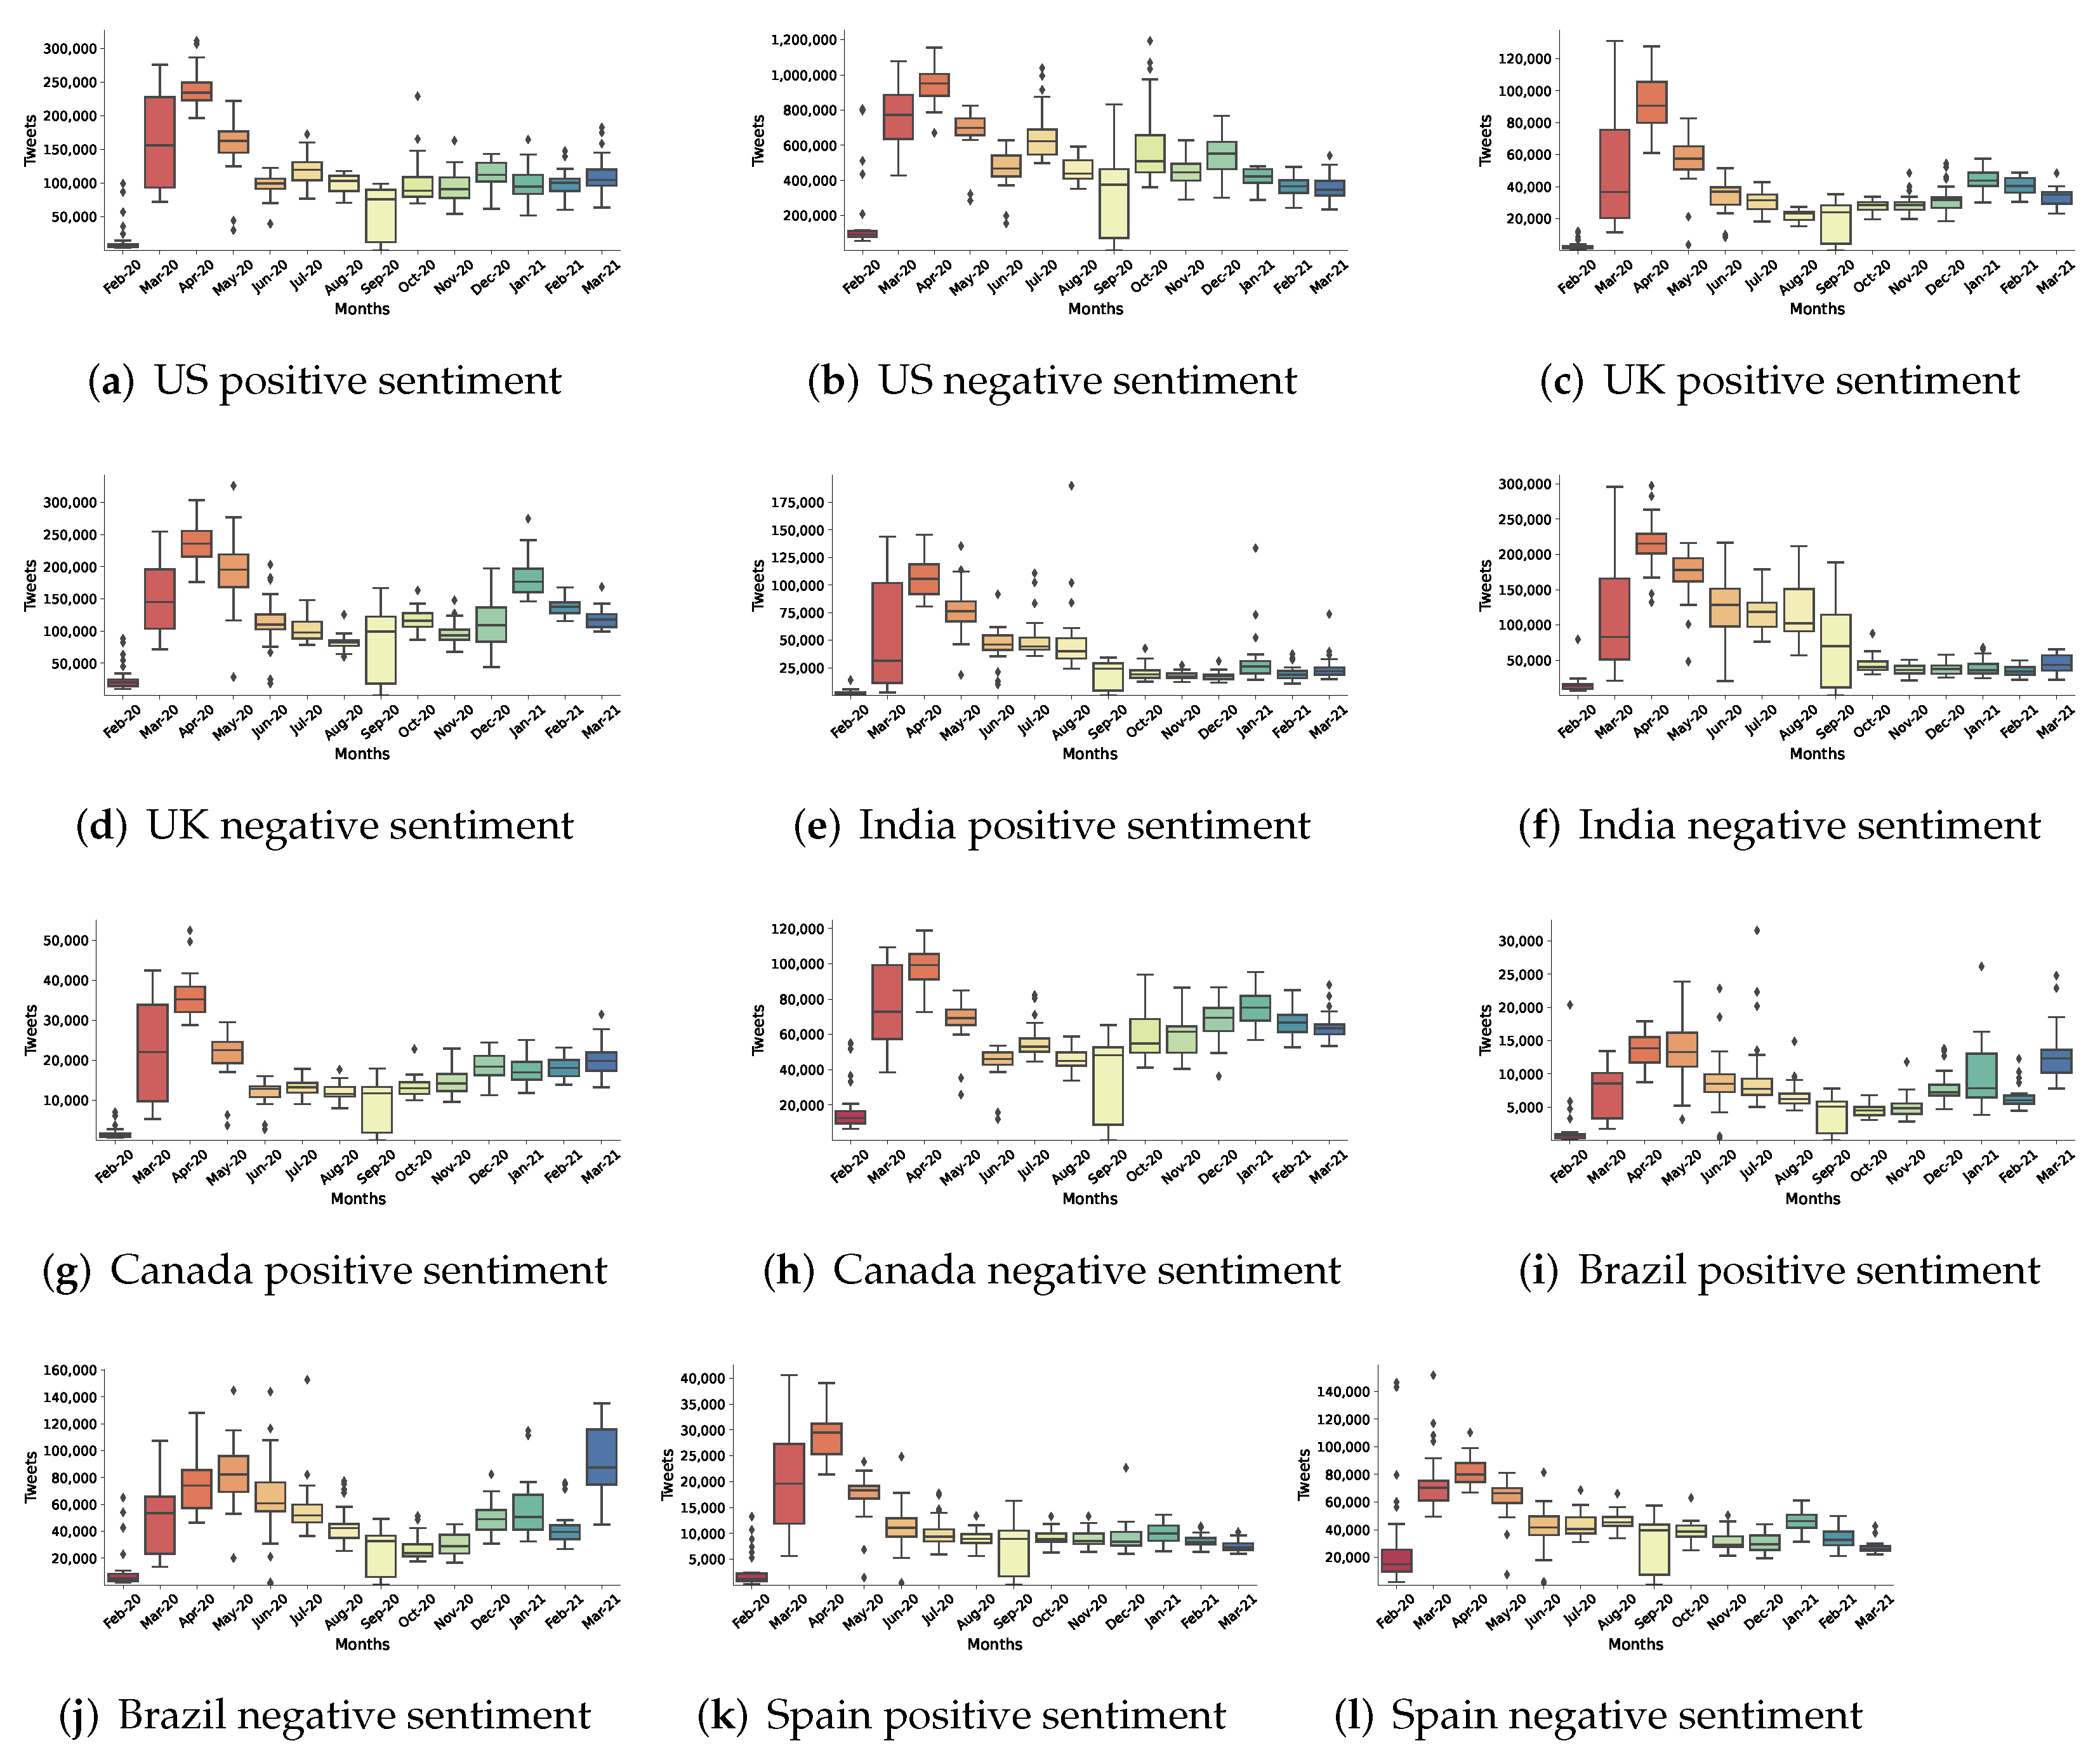
In Figure 8, we provide additional information about the distribution, skewness through quartiles, and median for positive and negative sentiments for the top-six countries. We notice that in most cases the highest variation in both positive and negative sentiment is observed in March 2020, corresponding to the earlier stages of the pandemic where the coronavirus was spreading rapidly around the globe. Most countries seem to have less dispersion in April 2020 with quite high maximum range of any type of sentiment. Then, we observe another high variation trend in both positive and negative sentiment but at a lower overall volume across all countries in September 2020, which corresponds to a time frame in which India was experiencing the peak of its first wave and Spain was experiencing the peak of its second wave. These interesting patterns can reveal many more hidden insights, which could help authorities gain situational awareness leading to timely planning and actions.
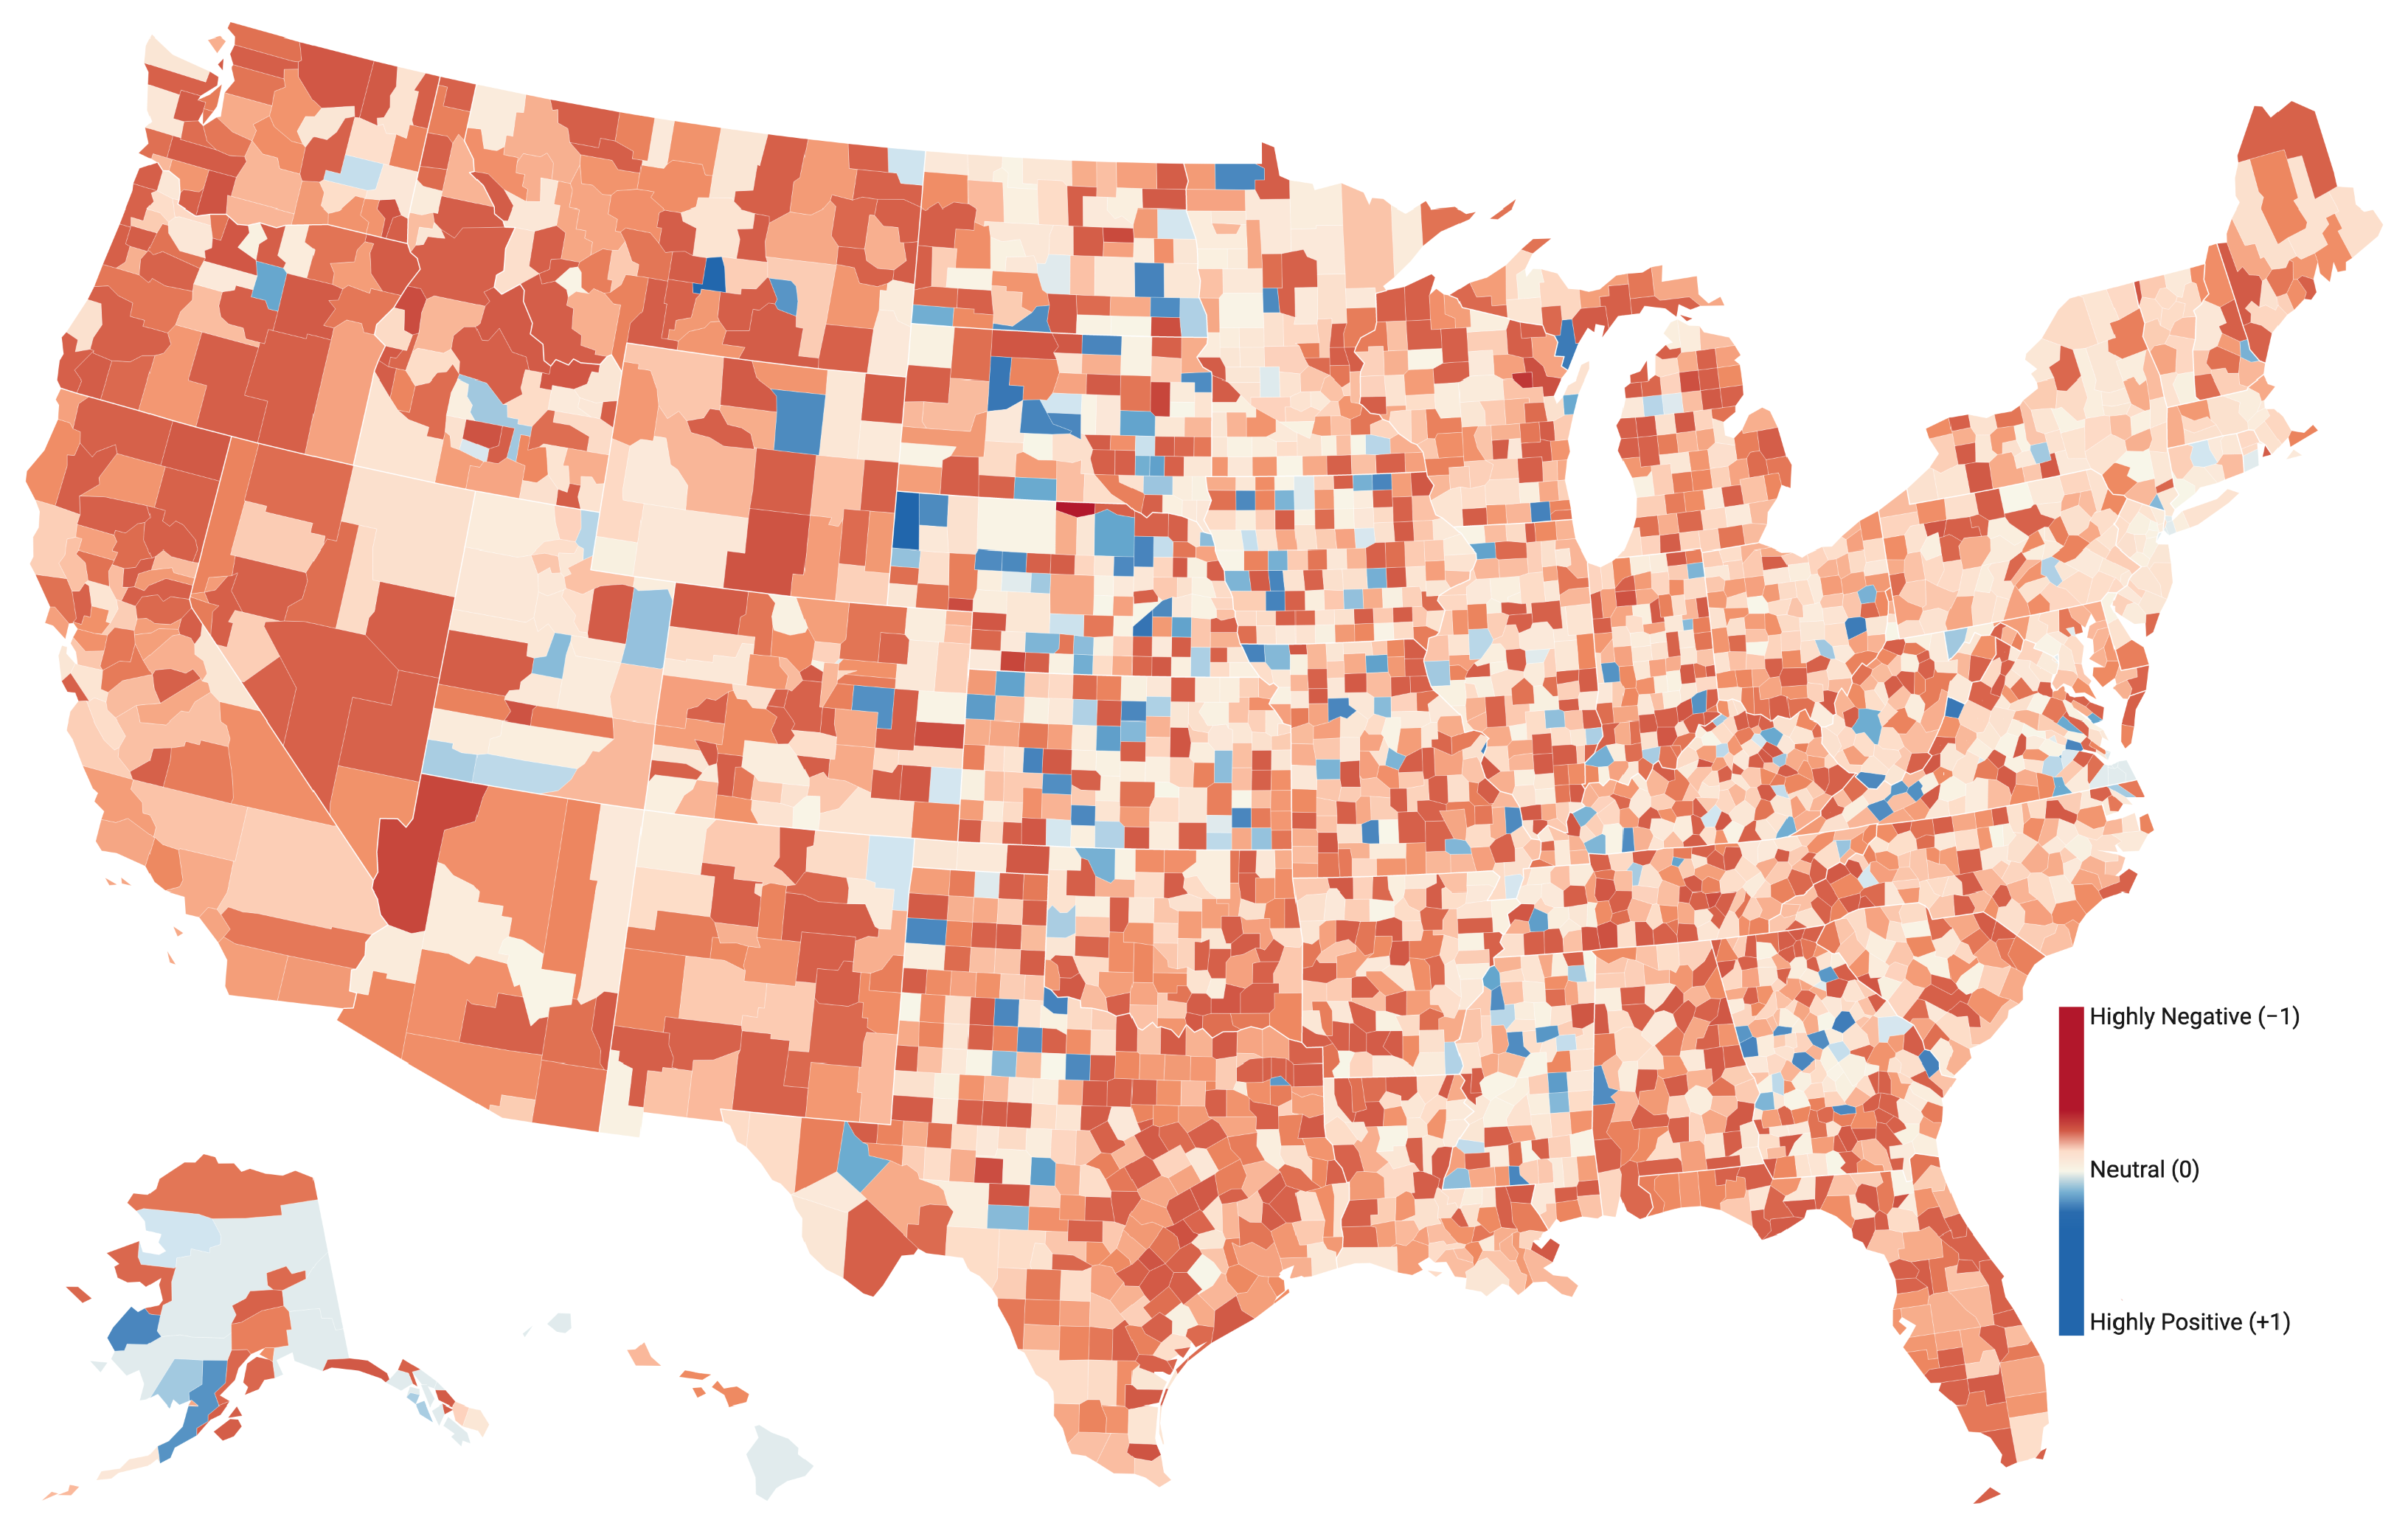
Figure 9 shows the distributions of sentiment scores across the US counties. Similar to the worldwide sentiment map, the sentiment scores for counties are normalized by the total number of tweets from each county using the weighted average for positive, negative, and neutral tweets. Overall, the negative sentiment dominates across different states and counties. Although most counties show strong to moderate negative sentiment, a strong positive sentiment can be observed for the Sioux County in Nebraska, Ziebach County in South Dakota, Highland County in West Virginia, and Golden Valley County in Montana. California is mostly on the negative side whereas New York appears near neutral or on the negative side. Texas seems to represent all ends of the spectrum—covering moderate-to-strong negative as well as some positive sentiment. Florida and Washington are all negative. Overall, the western region is mostly negative, the Midwest is fairly divided but strong in whatever sentiment it exhibits, the Northeast region shows less negative intensity (more towards neutral), and the Southern region shows some counties with positive sentiment, but the majority is either negative or neutral.
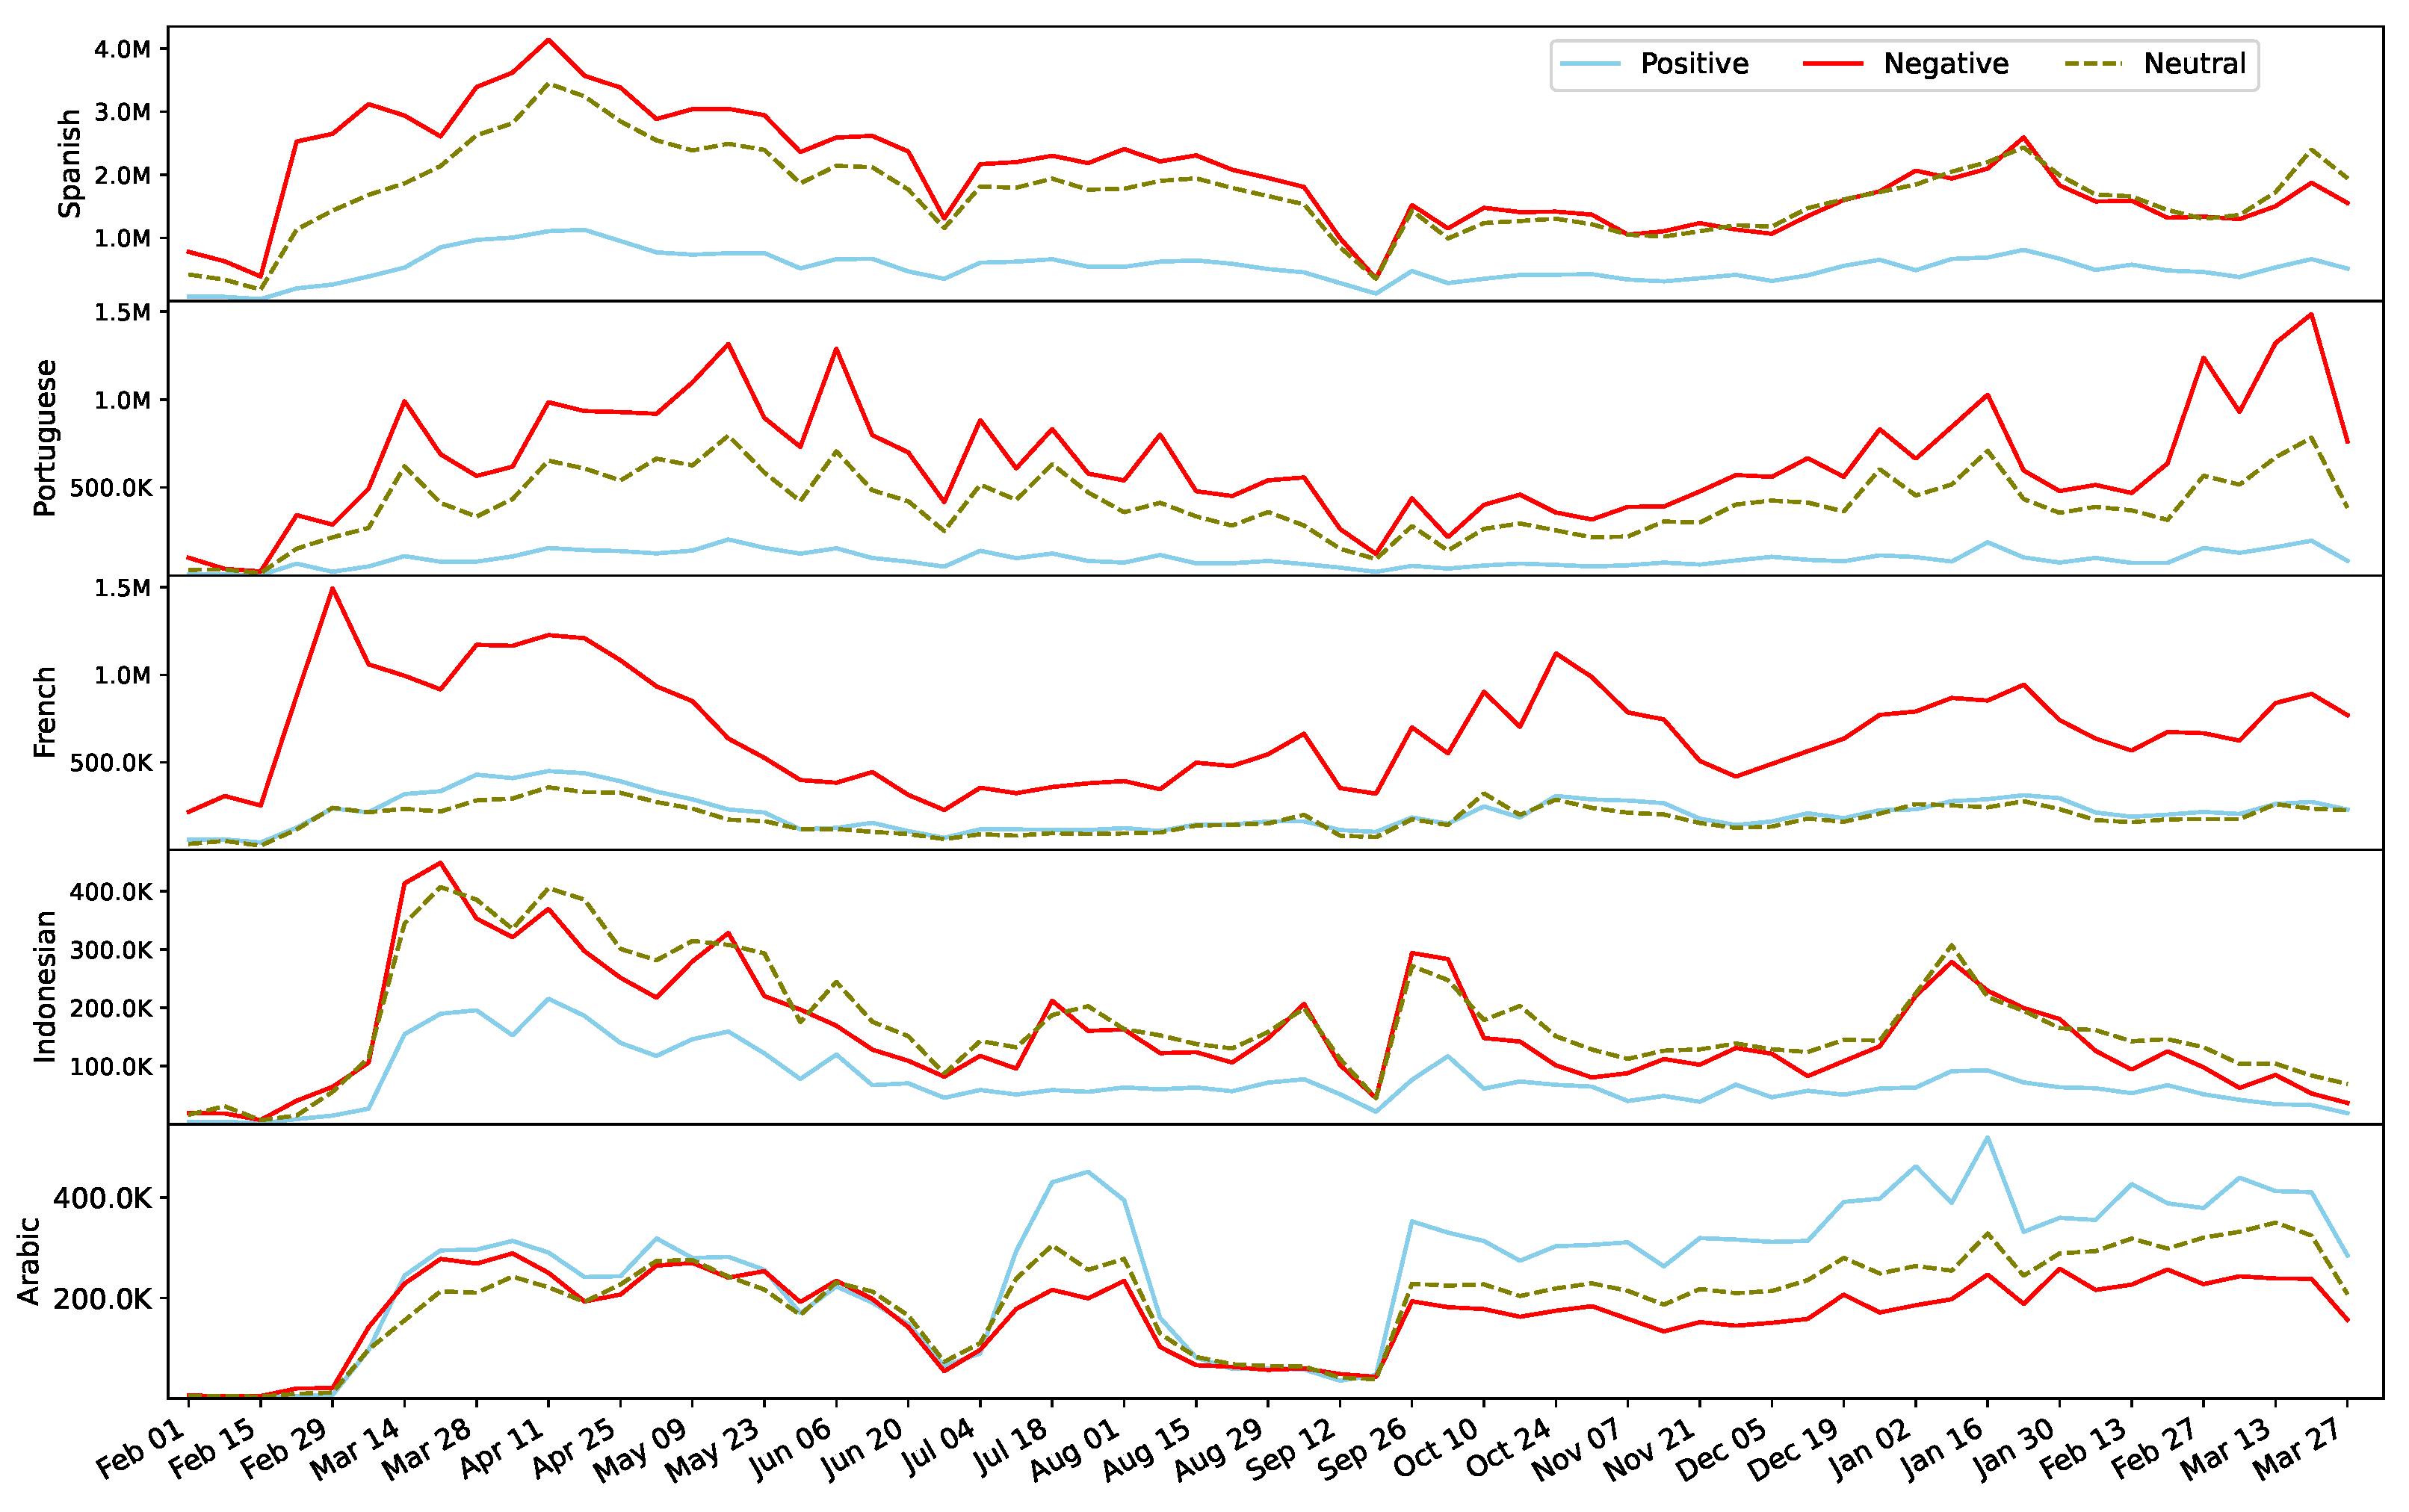
Figure 10 presents the distributions of sentiment labels for the top-five languages excluding English. Interestingly, the Arabic language shows the domination of the positive sentiment throughout the 14 months except February 2020 and a few weeks in the middle. Additionally, for the Indonesian language, the neutral sentiment is on par with negative sentiment, if not higher, throughout the entire data collection period. For the other three languages, the negative sentiment surpasses the other two sentiment classes. Although all languages show peaks in and around April and May 2020, the surge of the negative sentiment in February and March 2021 in the case of Portuguese is noticeable and requires further investigation.
3.4. User Type Identification and Gender Classification Results
Since our main focus is on the tweets posted by the general public, here we evaluate the person entity predictions. A random sample consisting of 400 model predictions of the person entity is selected for the evaluation. The sampled accounts were manually checked by the authors of this paper and marked as either person or non-person. The manual investigation revealed 377 user accounts with correct and 23 with incorrect model predictions. This yields a precision of 0.94 for the Person category, which is quite promising. We obtained entity types of all 87.7 million usernames using the same model. There are 46,504,838 (52.98%) person, 11,909,855 (13.57%) organization, and 29,357,141 (33.45%) miscellaneous user types. More importantly, nearly half (48%) of the tweets in the dataset are posted by personal accounts whereas 11% by organizational accounts and 40% by other user types.
To evaluate the gender classification model, 20% (i.e., 24,267) of the 121,335 annotated names were randomly sampled and held out during the training phase. This held-out set was used to test the model and compute several evaluation metrics. Table 8 shows the evaluation results of the Random Forest model as it yields better performance. The F1-score of the female class is very reasonable (0.878) compared to the male class (0.807). This is probably due to the high prevalence of the female class in the training set.
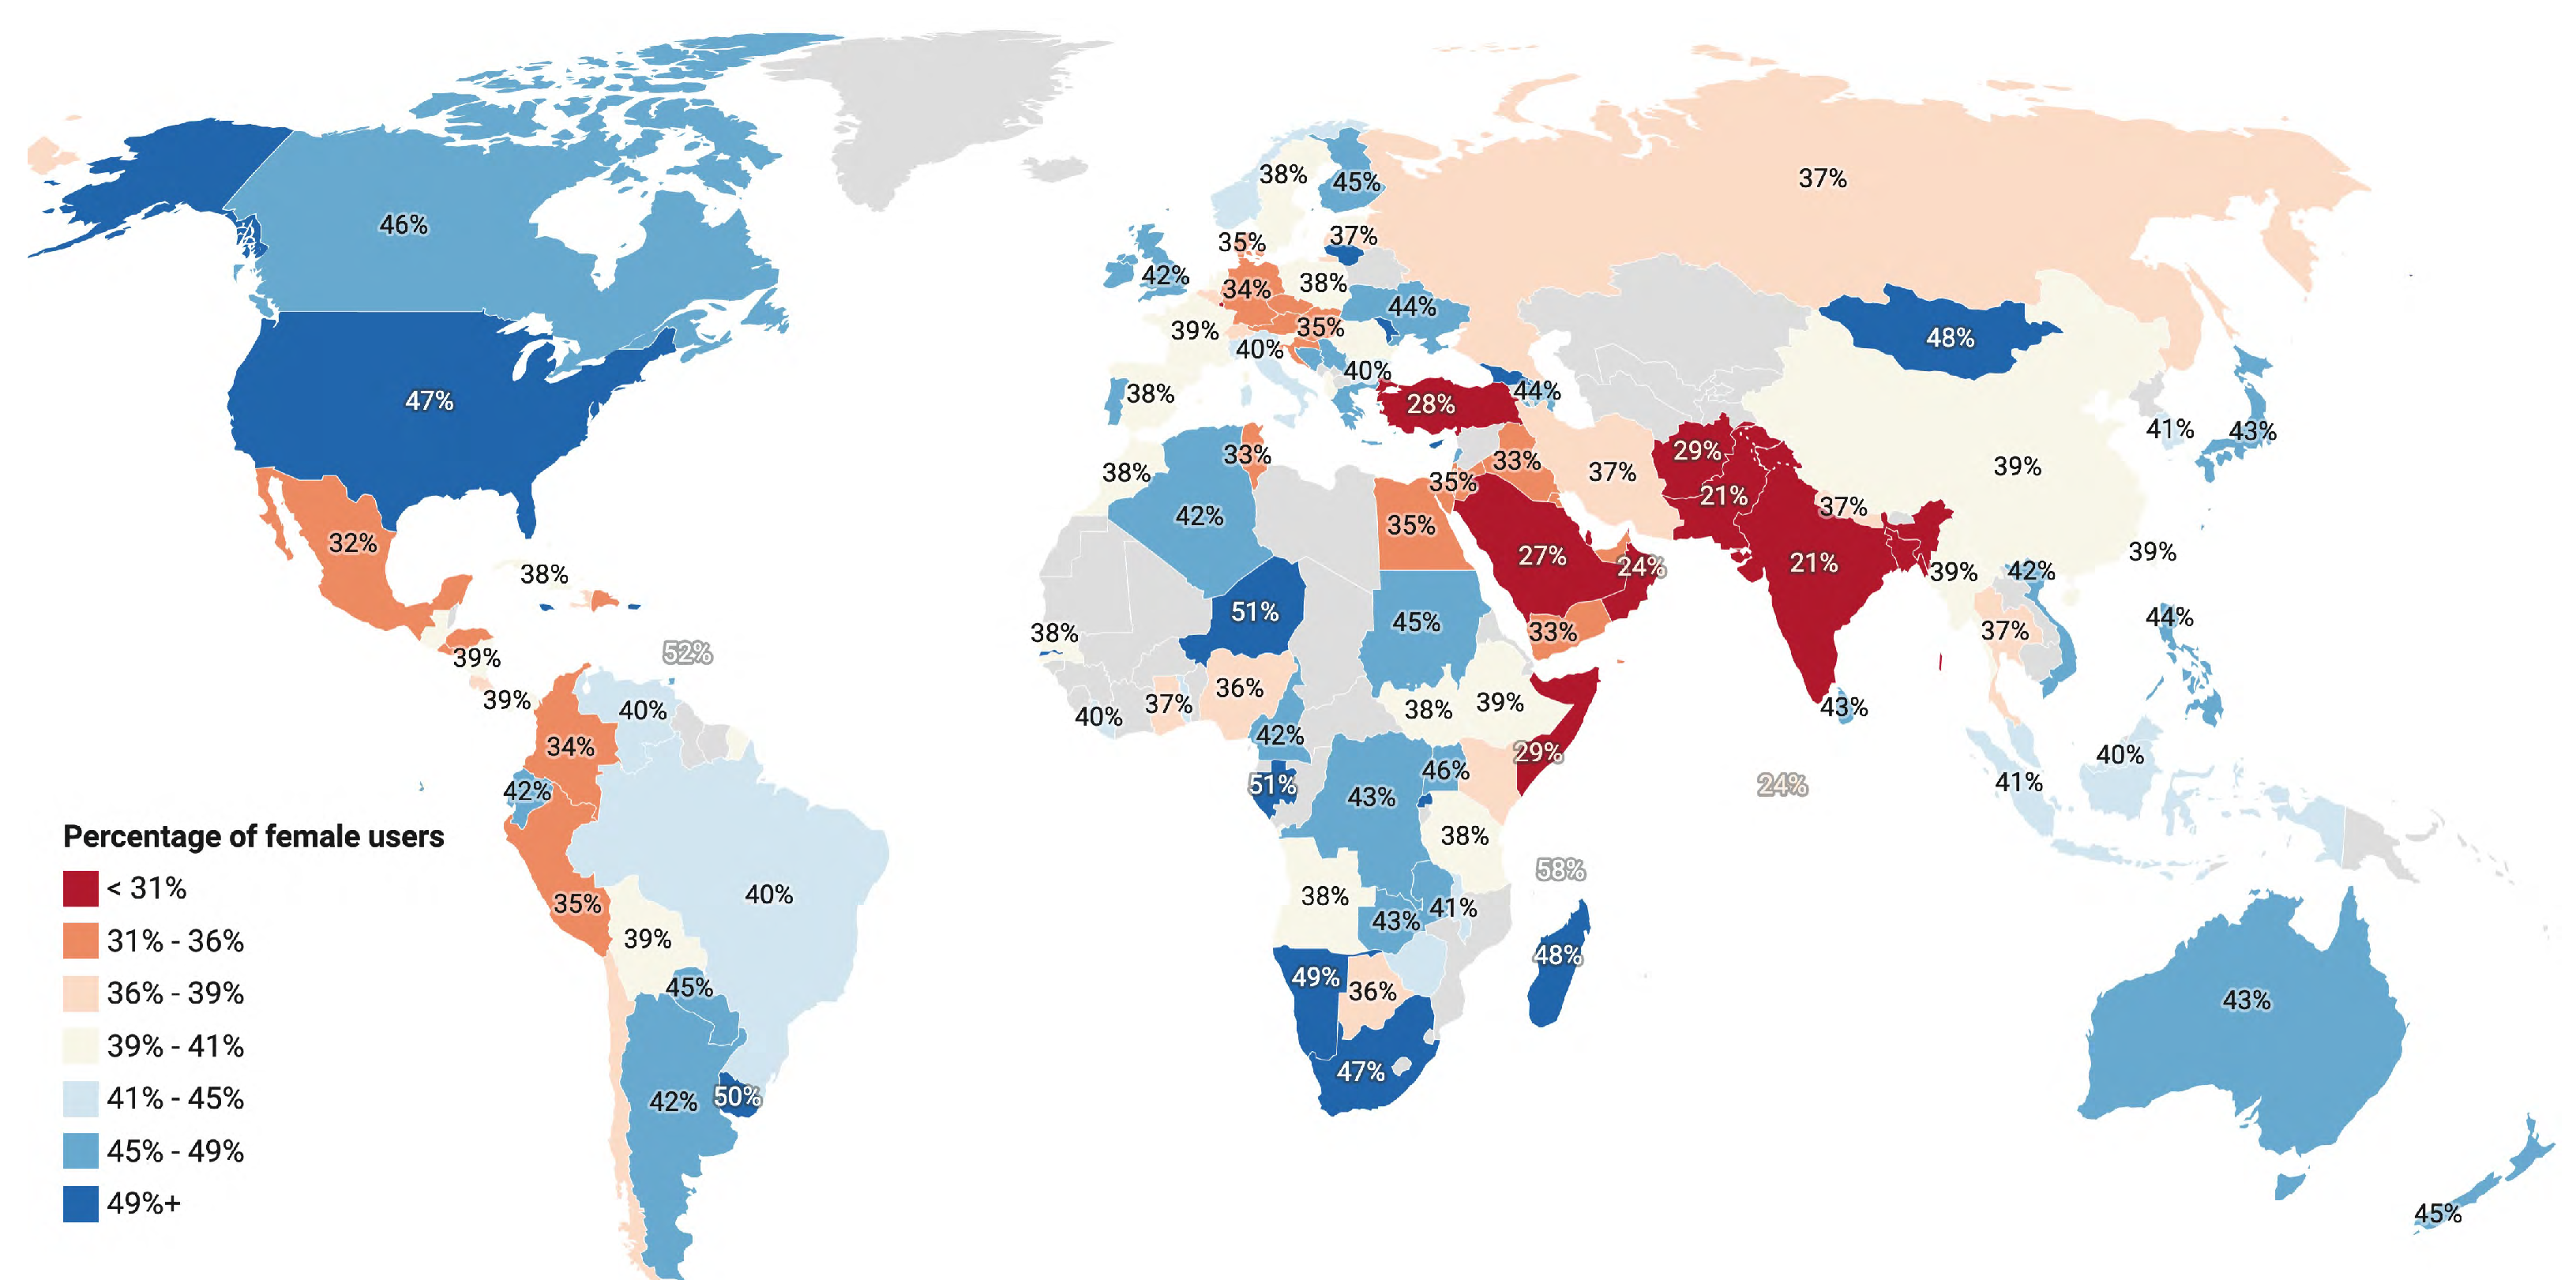
The gender classification process identified 19,598,252 (42.14%) female and 26,906,586 (57.86%) male users. The proportion of male users is higher than the female users so as the number of tweets posted by the male users (15%). Specifically, of all 963,681,513 tweets from personal accounts, 558,259,178 (57.93%) are from male and 405,422,335 (42.07%) from female users. We further determine female to male ratios for each country. To choose countries for computing female to male ratios, we estimated the required sample size for each country. We set our confidence interval at 95% and margin of error to ≤1%. Countries with users (any gender) less than the required sample size are dropped (). Figure 11 shows the percentage of female users for countries meeting the representativeness criteria.
4. Analysis and Applications
To highlight potential applications of this dataset, in this section we perform three types of data analysis. The first analysis aims to determine the topical coverage of the data surrounding several real-world issues the public faced during the pandemic. The second analysis determines global digital divide using the types of devices used for tweeting. The third analysis investigates the evolution of natural cities in the US during the pandemic. Finally, we present a list of potential applications of the dataset.
4.1. Trend Analysis
The impact of the COVID-19 pandemic on people’s livelihoods, health, families, businesses, and employment is devastating. To determine whether TBCOV covers information about such unprecedented challenges, next we perform trend analysis of six important issues. The first two issues are directly related to people’s health, i.e., (i) tweets about anxiety and depression, and (ii) self-declared COVID-19 symptoms. Next two issues represent severe consequences of COVID-19 that millions of families worldwide directly faced, i.e., (iii) deaths of family members and relatives, and (iv) food shortages. The last two issues are about people’s social life and preventive measures, i.e., (v) face mask usage in public areas as well as shortages, and (vi) willingness to take or already taken vaccine.
For each issue, a set of related terms are curated manually to form logical expressions by consulting external formal documentations when available. For instance, in the case of the “COVID19 symptoms” issue, we divide it into five sub-groups representing different COVID-19 symptoms listed on the CDC website [72], which can also be seen below in Table 9. Several related terms were added to each sub-group to increase the recall. For example, for COVID deaths of parents, the “parents” group contains two sets of terms: (i) “father OR mother OR dad OR mom”, and (ii) “deceased OR succumbed OR perished OR lost battle OR killed OR my * passed OR my * died’ (Asterisk (*) allows one term from set (i) to appear in between.). The logical operator ‘AND’ between these two sets forms the final expression used to retrieve weekly tweets. The full list of terms will be released with the dataset.
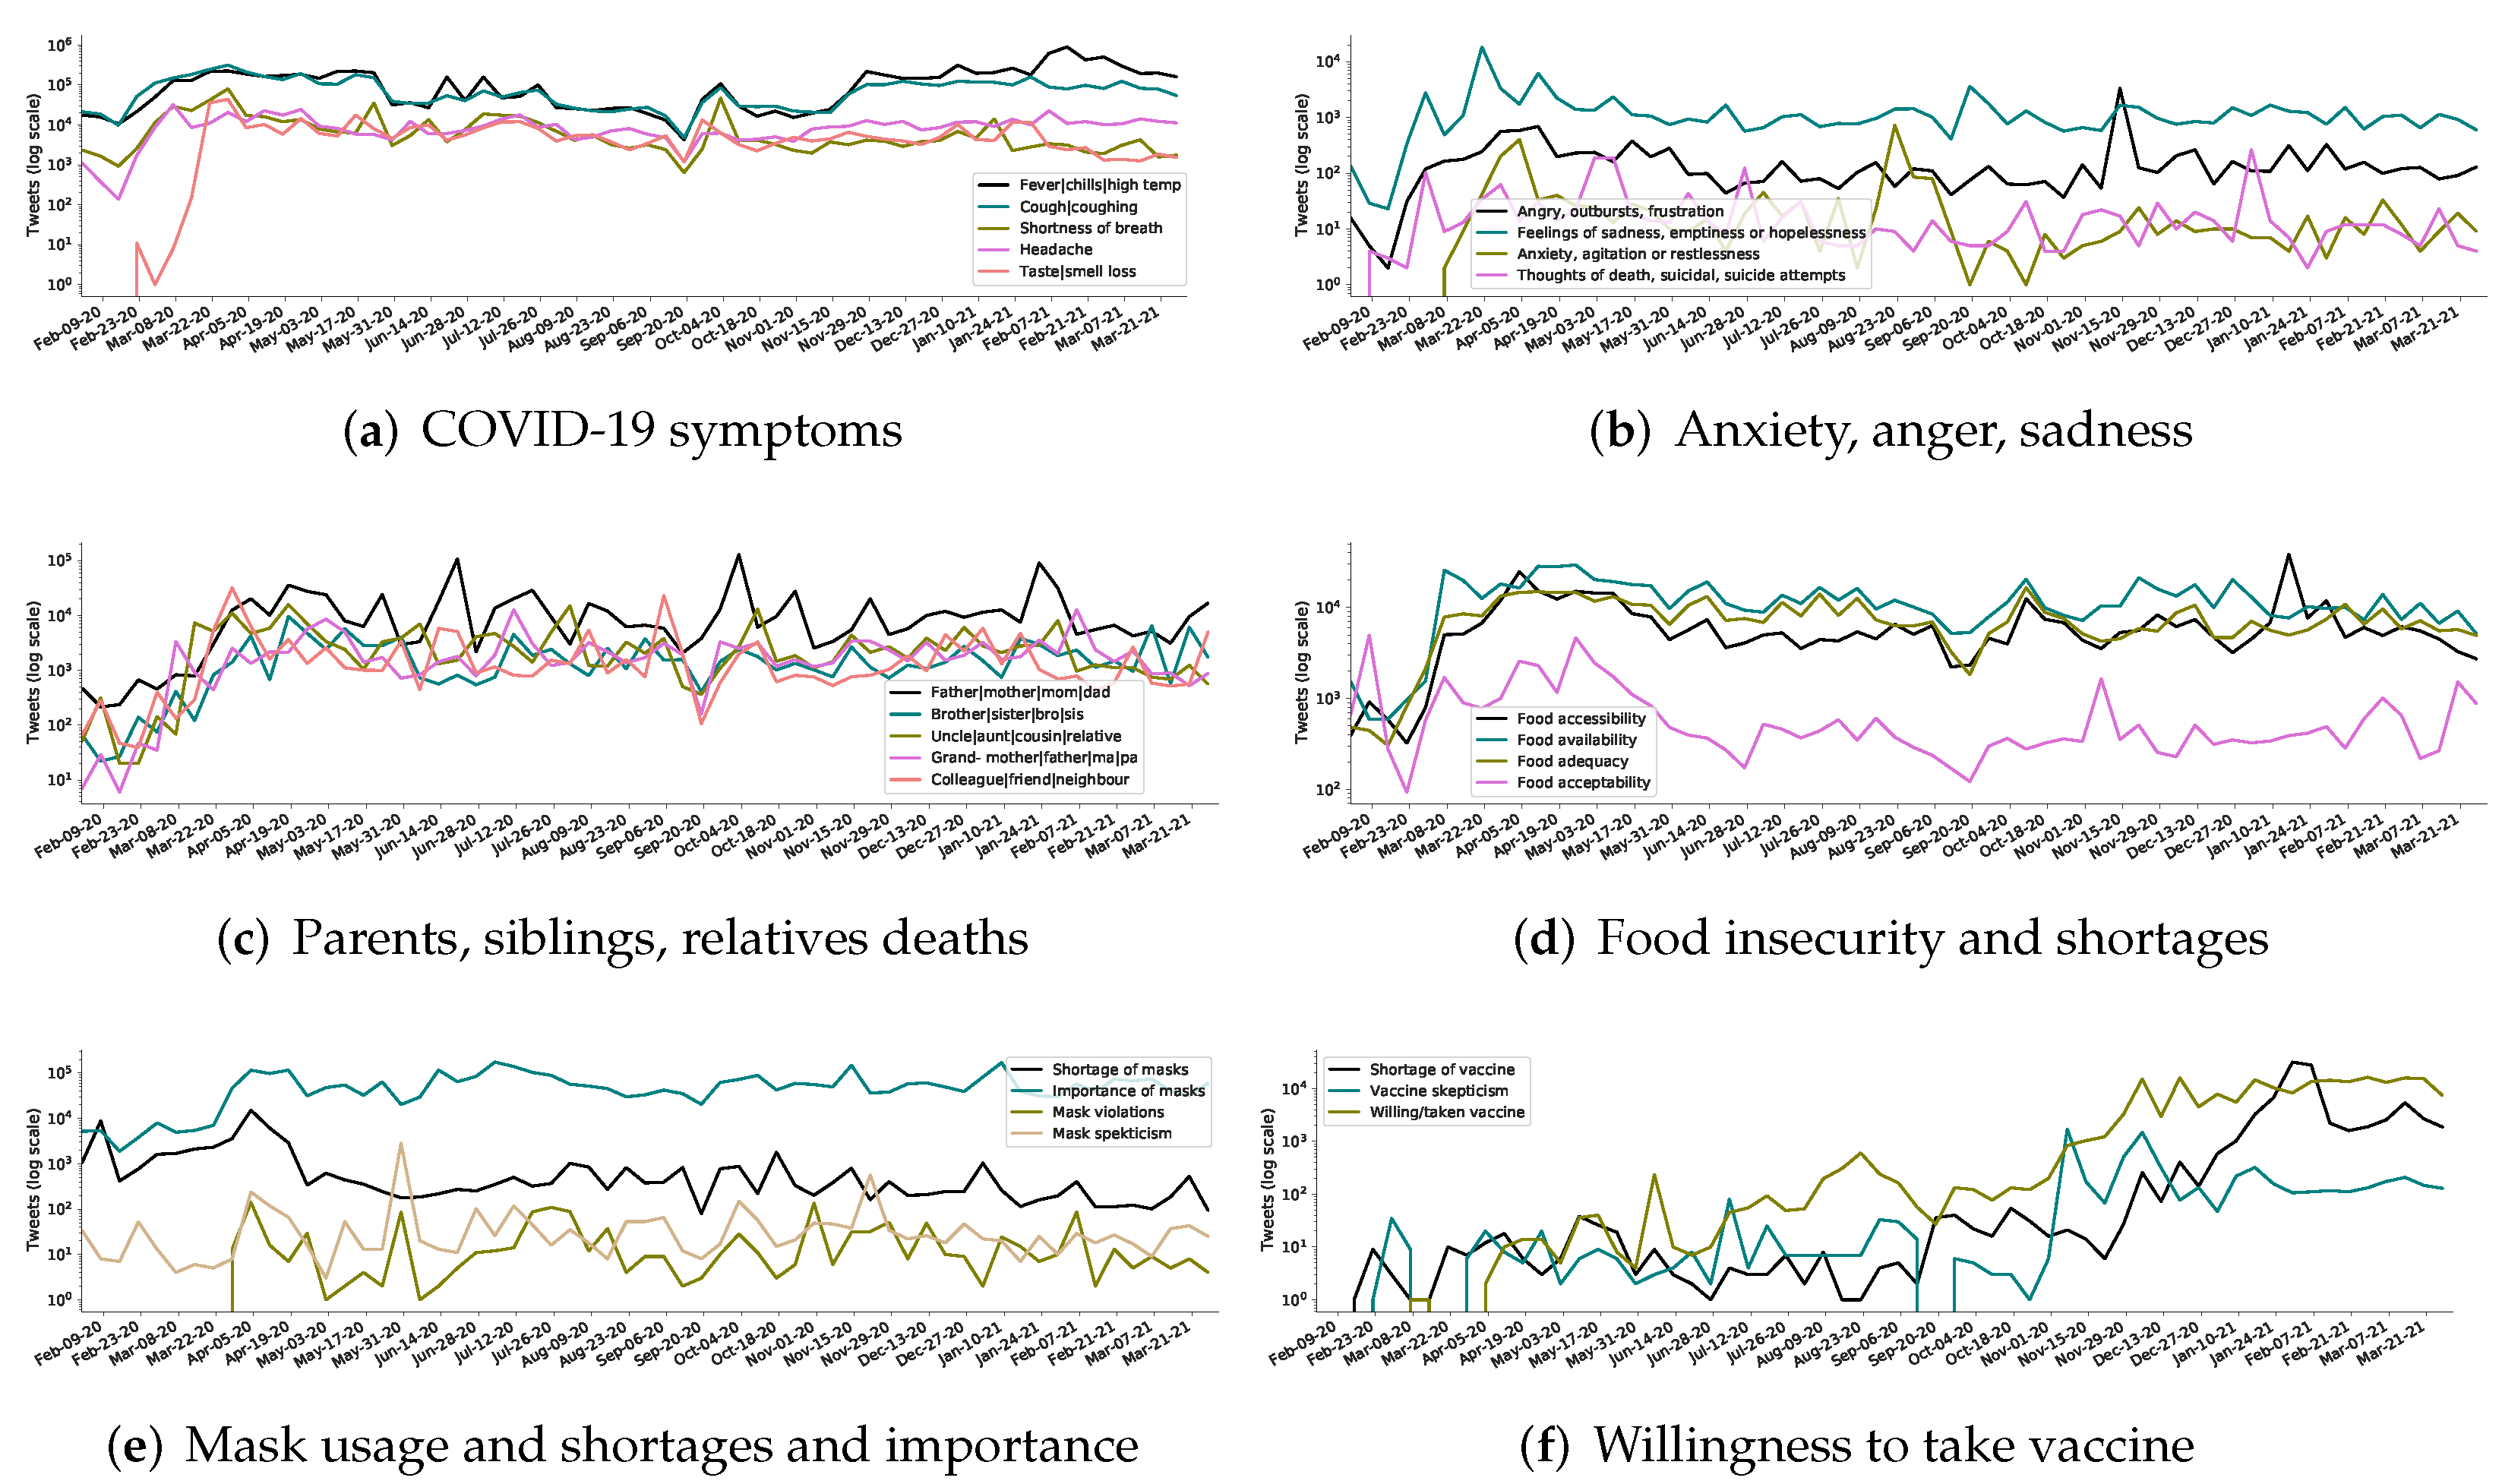
Figure 12 depicts weekly distributions (in log scale) of the retrieved tweets. Figure 12a shows sub-groups of the COVID-19 symptoms category. The two most reported symptoms in tweets are fever and cough followed by the shortness of breath and headache. Interestingly, reports of loss of taste and smell are almost zero until the end of February 2020, which then suddenly spike from March 8th onward. Figure 12b shows trends of different groups for the anxiety and depression topic. The feelings of sadness and hopelessness seem to dominate throughout the year followed by anger, outburst, and frustration. Surprisingly, the expressions with suicidal thoughts are captured in the data, as well. These particular trends need an in-depth investigation to better understand motives behind such extreme thoughts for authorities to intervene and offer counselling.
The weekly trends representing two important and direct consequences of COVID-19 on the general public are shown in Figure 12c,d, i.e., tweets mentioning death of parents, siblings, relatives, or close connections; and food insecurity in terms of its availability, accessibility, adequacy, and acceptability. A large number of tweets reporting deaths is observed with majority about parents. Grandparents and the category representing uncle and aunt are significant as well. Overall, elderly death reports are significantly higher than younger population.
Similarly, TBCOV shows coverage of the food insecurity topics (i.e., Figure 12d. Food availability dominates over food accessibility and adequacy in most weeks. However, food acceptability, other than a few spikes in February and May 2020, remains less of a concern for the public, thus not discussed on Twitter. Food shortage was one of the critical issues faced by many countries around the world. These Twitter data might help detect hot-spots with severe food shortages ultimately helping authorities focus on most vulnerable areas.
Figure 12e,f shows trends for mask usage and shortage, as well as vaccination. The “Importance of mask” category, which includes mask usage, importance of mask, etc., leads the discussion throughout. The mask shortage category spikes in the early months of 2020 and then averages out. Mask violations seem to surge in May and November 2020 and for the rest it stays steady. Mask shortage tweets worth further analysis to find out areas with severe shortages. The discussion on vaccines is comparatively lower than all other topics. However, the category on willingness to take or already taken vaccine is hopeful and spiked for the most months, in particular, late 2020 and early 2021.
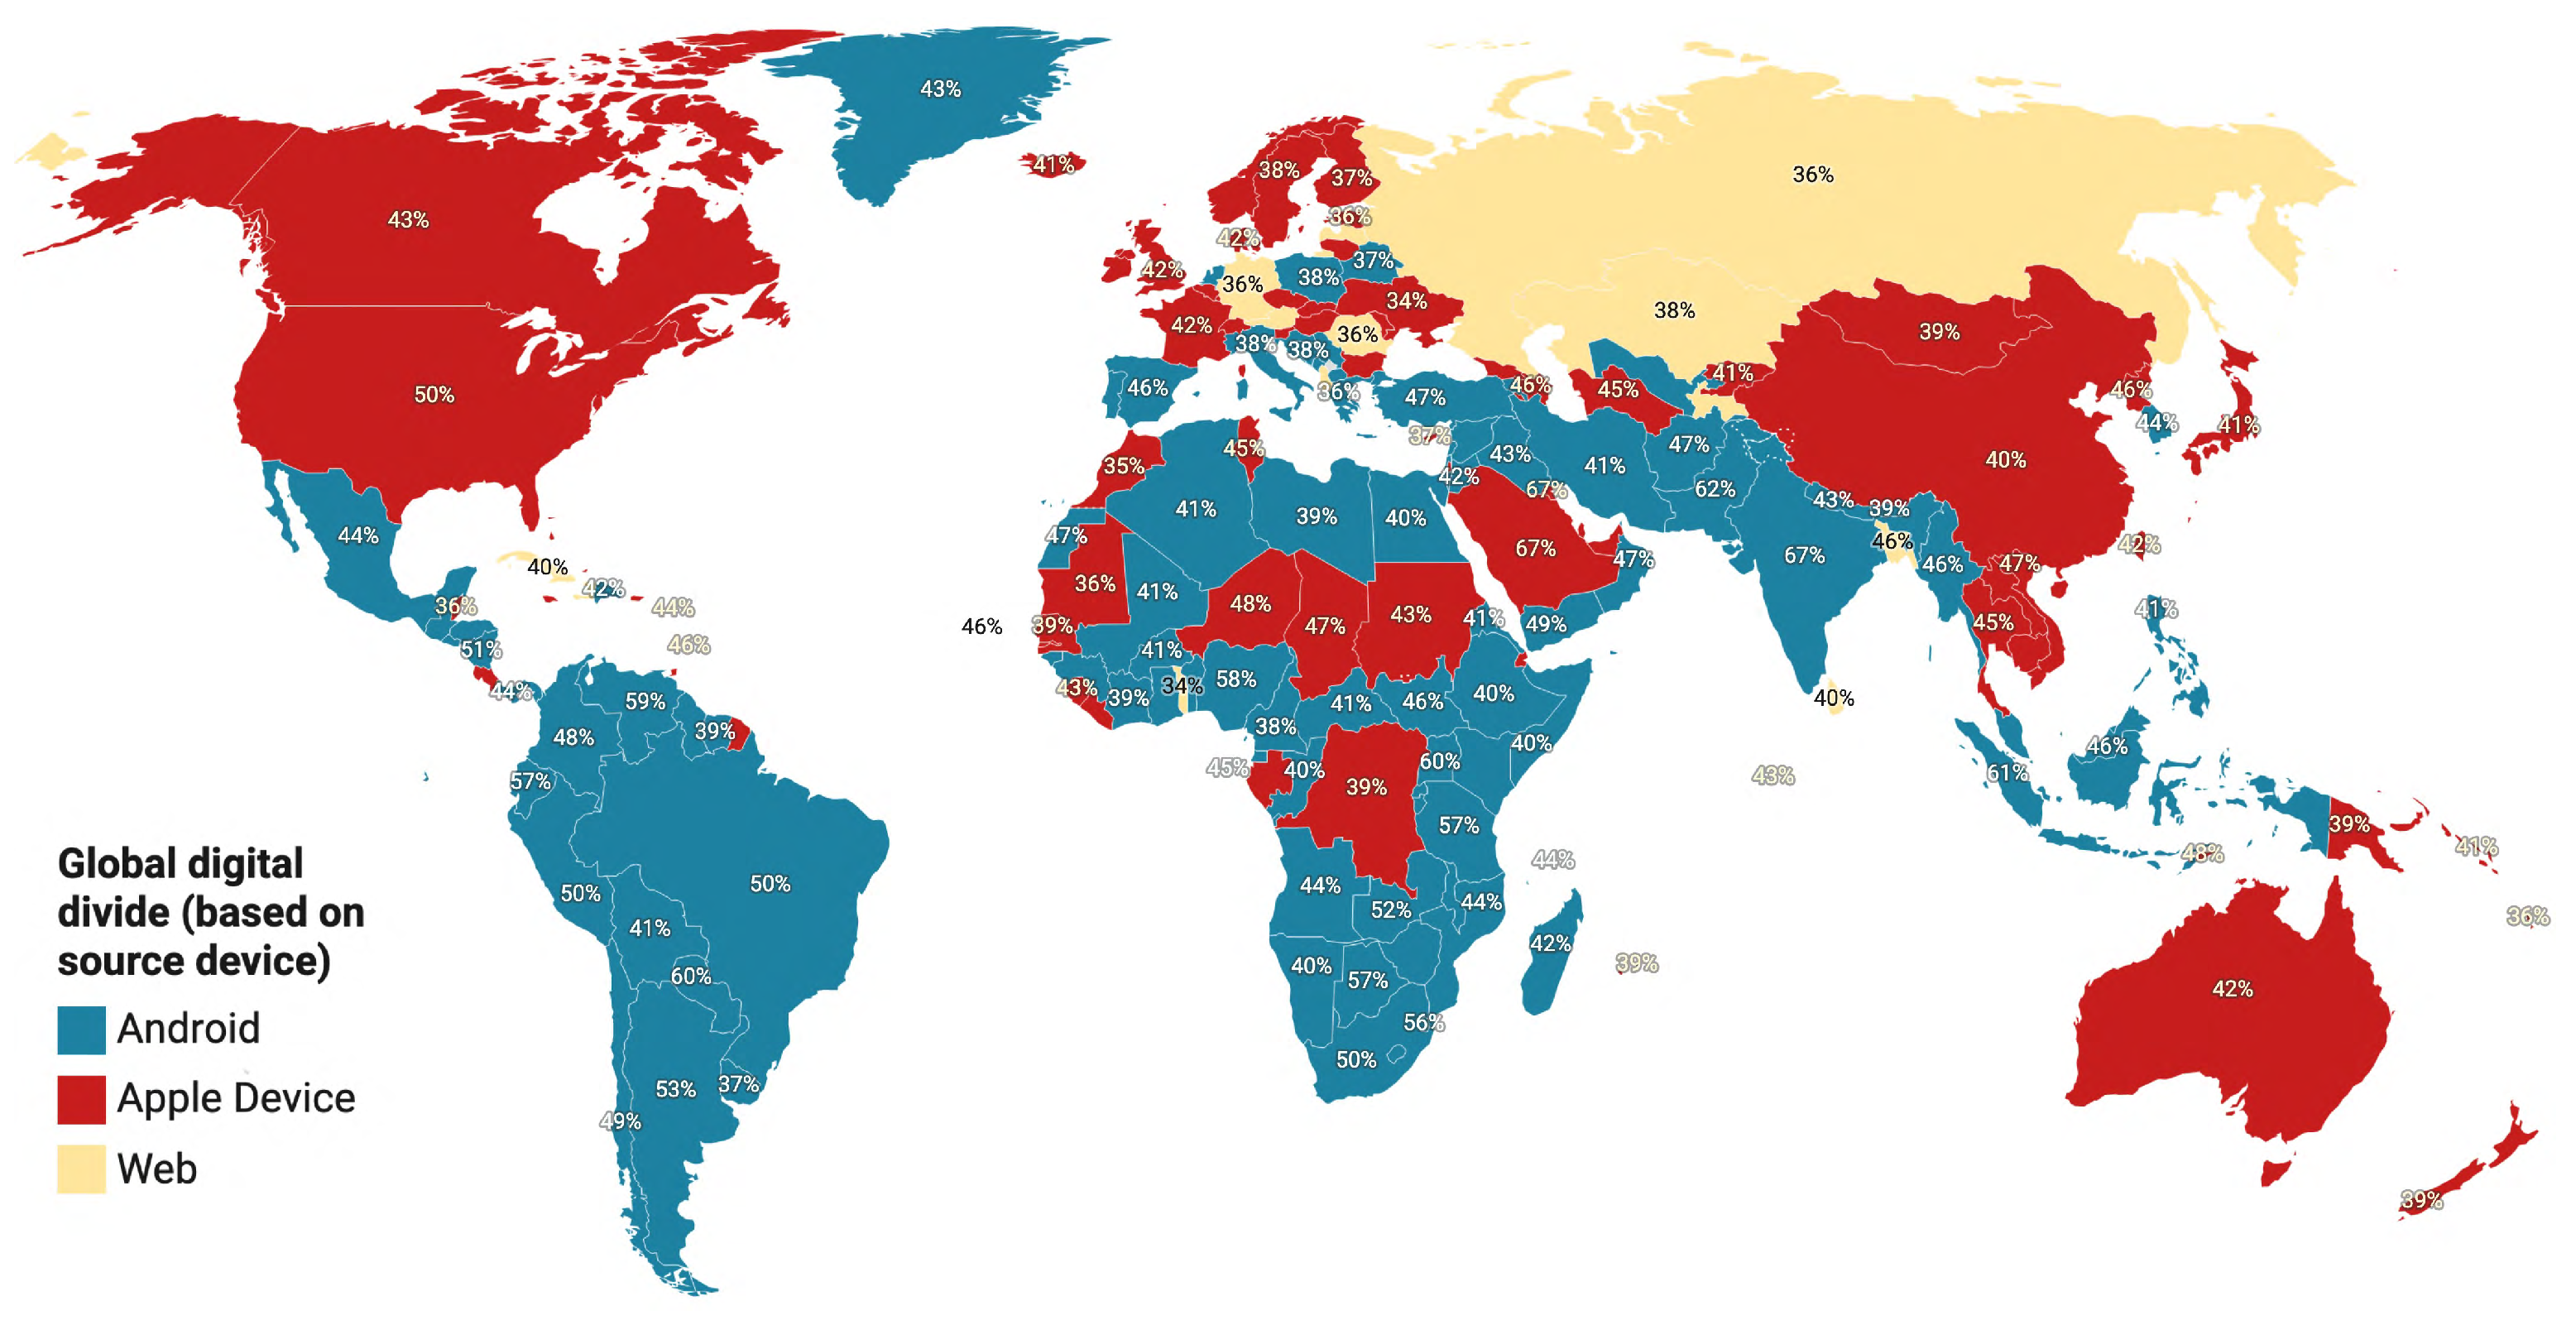
4.2. Global Digital Divide
Measuring the global digital divide reveals global disparities between developed and developing countries. Often access to computing and other information communication technologies, such as the Internet, are used to determine technologies access, gaps, and inequalities. TBCOV’s worldwide coverage over a long period during a severe global pandemic makes it suitable to perform such an analysis. To this end, next we sought to determine the global digital divide by relying on users access to different types of devices used for tweeting. Out of all more than two billion tweets, we extracted 1003 unique application types (provided by Twitter) supporting the tweet posting feature. Dozens of applications support tweeting feature, including both web- and mobile-based apps. We manually analyzed all the applications to determine the operating system they are built for (e.g., iOS, Android). Next, based on the operating system information, we categorized each application into one of the three device types, i.e., (i) Apple device—representing all iOS devices such as iPhone, iPad, etc.; (ii) Android—representing all types of Android-based devices; and(iii) Web—representing all the web-based applications for tweeting. Finally, an aggregation is performed on device types for each county and the most frequent device is selected.
Figure 13 shows the most frequently used device type in each country. The map shows a device type for 217 countries worldwide. Of all, the Android is the most used device type with (48%), Apple with (45%), and Web is the least used with (7%). As Apple devices are more expensive than Android, we expect to see Apple’s domination in rich countries. This assumption stands true except a couple of countries, including Niger and Senegal, among others.
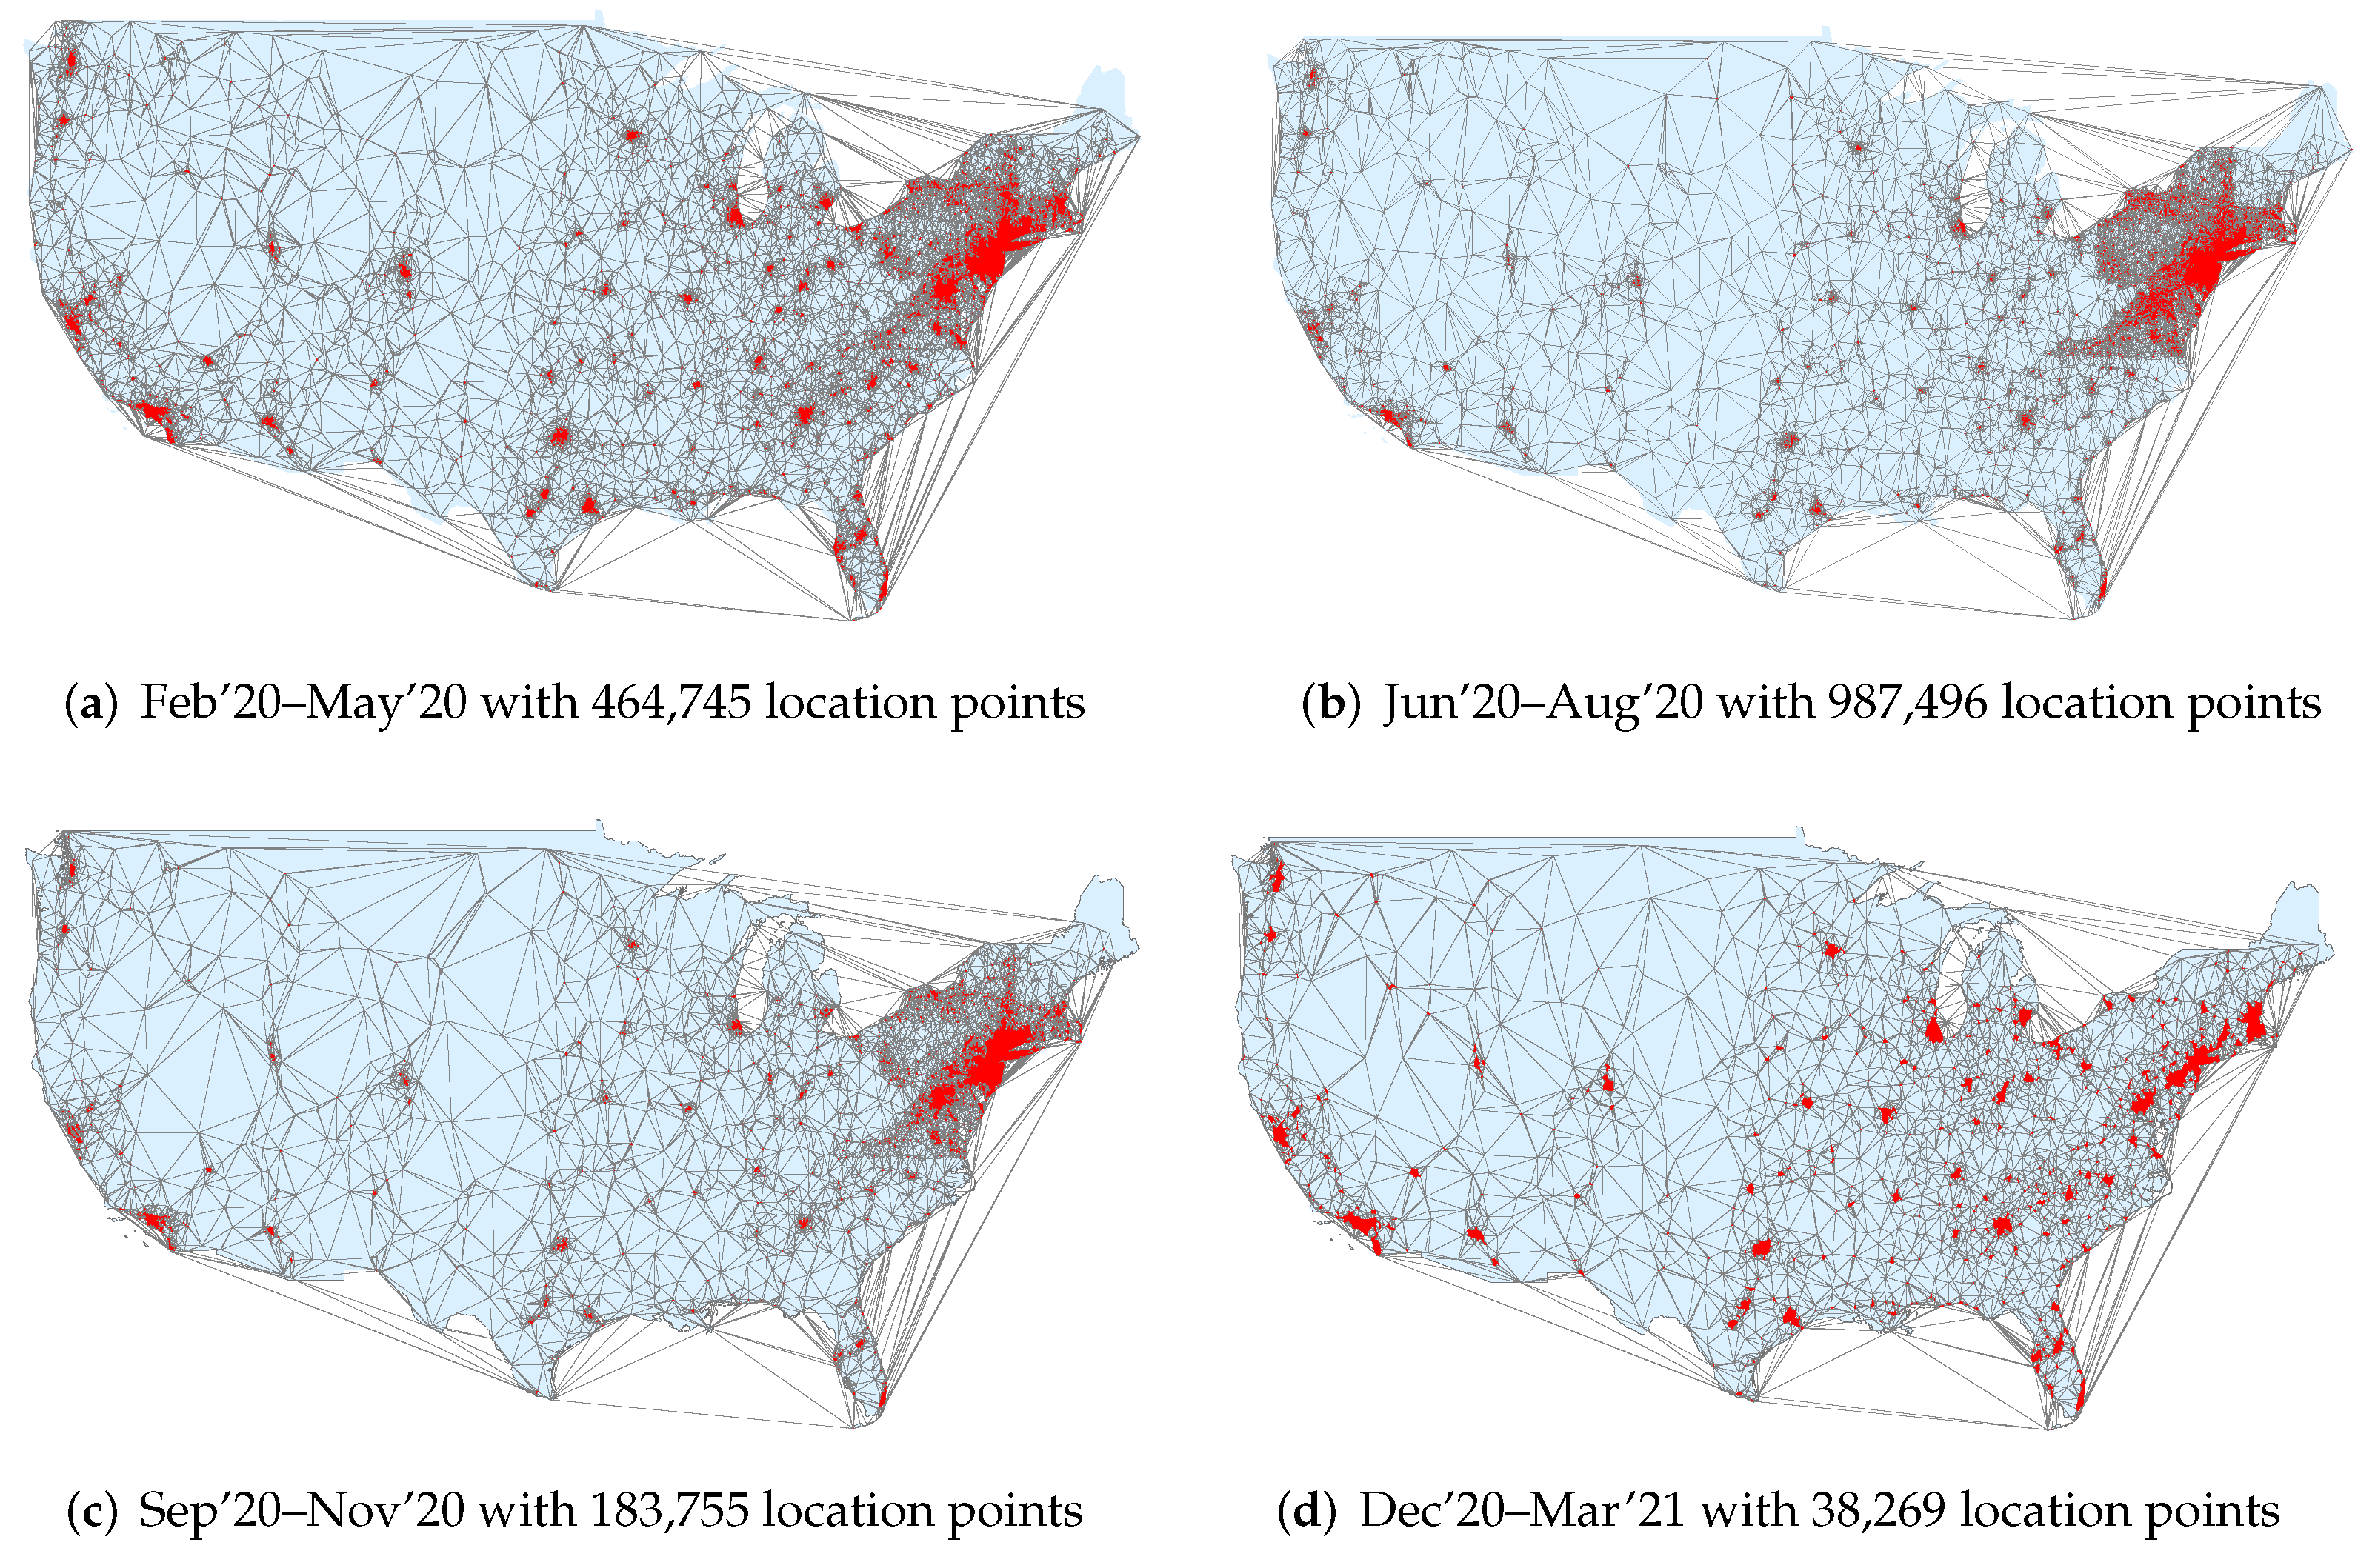
4.3. Evolution of Natural Cities in the US
Jiang and Miao [73] define “natural cities” as human settlements or human activities in general on Earth’s surface that are naturally or objectively defined and delineated from massive geographic information based on head/tail division rule, a non-recursive form of head/tail breaks [74]. To that end, a massive collection of geo-referenced tweets (as available in TBCOV) can be used to delineate natural cities using tweet densities as a proxy to population densities, and eventually, lead to more meaningful delineation of city centers and borders rather than arbitrarily defined administrative units [75]. Furthermore, longitudinal analysis of the geo-referenced tweets can help track the evolution of natural cities in terms of changes in the spatial distribution and density of the COVID-19-related chatter across time, and provide new insights into the underlying structure and dynamics of the natural cities occurred during the COVID-19 pandemic. For this purpose, we analyzed the 1,674,265 tweets with accurate geo-coordinates collected across the mainland US and investigated evolution of the natural cities during different phases of the pandemic following the methodology introduced by Jiang and Miao [73].
Figure 14 shows the results of mapping natural cities at four different time intervals. We see that New York and its surrounding region appears to be the most prominent natural city across the first three time intervals which can be explained by the daunting levels of COVID-19 cases and deaths reported in this region. In addition, other major metropolitan areas such as San Francisco, Los Angeles, Seattle, Dallas, Houston, Chicago, Atlanta, and Miami, among others, persist across all time intervals while showing relatively smaller regional and population variations. Surprisingly, in the first and last time intervals, we observe higher numbers of natural cities and a sparse network with more prominent populations as opposed to the second and third time intervals which have denser network structures but fewer natural cities.
4.4. Potential Applications
We believe TBCOV can enable a broad range of applications. Research communities and scholars can use it for monitoring and surveillance, understanding public issues, effects of social isolation, identification of shortages of food, equipment, and others. In the below, we discuss some potential applications of our data;
- Disease forecasting and surveillance lead to the early detection and prevention of an outbreak. Moreover, early warning systems alert authorities and healthcare providers to prepare and respond to outbreaks in a timely fashion. TBCOV’s broad topical coverage, particularly about self-reported symptoms and deaths, can be a strong indicator for the early warning systems;
- Identification of fake information is essential to tackle negative influences on societies, especially during health emergencies. Tweets’ temporal information, re-sharing and retweeting patterns, and the use of specific tone in the textual content can potentially lead to the identification of rumors and fake information. More than two billion tweets in the TBCOV dataset is a goldmine for detecting conspiracies, rumors, and misinformation circulated on social media (e.g., drinking bleach can cure COVID-19). More importantly, the data can be used to develop robust models for fake news and rumor detection;
- Understanding communities’ knowledge gaps during emergency situations, such as the COVID-19 pandemic is crucial for authorities to deal with the surge of uncertainties. TBCOV’s comprehensive geographic, as well as temporal coverage can be analyzed to understand public questions and queries;
- Identification of shortages of important items such as Personal Protective Equipment (PPE), oxygen, and face mask becomes the top priority for governments during health emergencies. Building models to identify pertinent social media reports could help authorities plan and prevent devastating consequences of shortages;
- Understanding public sentiment and reactions against governments policies, such as lockdowns, closure of businesses, as well as slow response or vaccination rate can be performed using social media data, such as TBCOV;
- Rapid needs assessment informs humanitarian organizations’ and governments’ response operations and determines relief priorities for an affected population during emergencies, such as the COVID-19 pandemic. Our trends analysis results highlighted the effectiveness of TBCOV for mining priority needs of population in terms of food, cash, medicines, and more;
- Identification of self-reported symptoms, such as fever, cough, loss of taste, etc., through social media data could indicate a likely future hot-spot when reports spike in a geographical area. TBCOV tweets geotagged with fine-grained locations, such as counties and cities, can be useful to build models for symptom detection and hot-spot prediction;
- Finding correlations is an important measure of relationship between two variables. We remark that the TBCOV dataset can be used to perform various types of correlation analysis to detect patterns and generate hypotheses. These analyses include, but are not limited to, finding correlations between COVID-19 cases and self-reported symptoms on Twitter; or between COVID-19 cases and death reports. Correlations between COVID-19 cases and negative sentiment in a geographical location or the surge of messages showing anxiety and unemployment rate; or correlation between daily negative tweets and the rate of food insufficiency in an area can open new avenues for interesting analyses.
The aforementioned topics mainly cover real-world applications of the TBCOV dataset. However, we believe that the dataset is useful for several computing problems, such as unsupervised learning to identify clusters of related messages, transfer learning between topical domains and language domains, geographic information systems, automatic recognition and disambiguation of location mentions, named-entity extraction, topic evolution, and concept-drift detection, among others.
5. Conclusions
This work presented a large-scale Twitter dataset comprising more than two billion COVID-19 related tweets, which were collected over a continuous period of 14 months. The tweets were posted by 87 million unique users from 218 countries in 67 different languages. More importantly, several state-of-the-art machine learning methods were employed to annotate tweets with a number of important latent attributes such as sentiment polarity, named-entities, geolocation, user type, and gender. We postulate that this large-scale, multilingual, geotagged social sensing data can empower multidisciplinary research communities to perform longitudinal studies, evaluate how societies are collectively coping with this unprecedented global crisis, as well as to develop computational methods to address real-world challenges.
Author Contributions
Conceptualization, M.I. and F.O.; methodology, M.I.; software, M.I. and U.Q.; validation, M.I., U.Q. and F.O.; formal analysis, M.I.; investigation, M.I. and F.O.; resources, M.I.; data curation, M.I., U.Q. and F.O.; writing—original draft preparation, M.I.; writing—review and editing, M.I. and F.O.; visualization, M.I. and U.Q.; supervision, M.I. and F.O.; project administration, M.I. All authors have read and agreed to the published version of the manuscript.
Funding
This research received no external funding.
Data Availability Statement
Adhering to Twitter’s data redistribution policies, we only share tweet ids and user ids along with all derived attributes, such as sentiment labels, named entities. We make the whole dataset available at https://crisisnlp.qcri.org/tbcov (accessed on 9 November 2021).
Conflicts of Interest
The authors declare no conflict of interest.
Appendix A. Keywords

Table A1.
Full list of keywords and hashtags used for data collection.
 , Japan Coronavirus, Turkey Coronavirus, #coronavid19, #新冠肺炎, #socialdistancing Connecticut, Belgium Coronavirus, withings.com kg, #earth, Haiti COVID-19, #COVID19, wuhan virus, #socialdistancing Washington, Hungary Coronavirus, Togo COVID-19, Covid19DE, Botswana COVID-19, #Coronavirustexas, #coronavirusnobrasil, #COVIDPakistan, Mexico COVID-19, coronavirus china, #chinavirus, Corona Ausbruch, Poland COVID-19, #pandemic, coronavirus outbreak, mehl, korona, #coronavirusoutbreak, Kuwait Coronavirus, #COVD, Namibia Coronavirus, #socialdistancing Indiana, #coronavirusuk, Saudi Arabia COVID-19, #NouveauCoronavirus, Vatican City Coronavirus, Cape Verde Coronavirus, Niger Coronavirus, #socialdistancing Alabama, United Arab Emirates Coronavirus, Finland COVID-19, Roma, pandemic, CoronaVirus Japan, corona vairus, #covid19uk, #China, Bangladesh COVID-19, #Lockdown, United Arab Emirates COVID-19, Austria Coronavirus, Uganda COVID-19, New Zealand Coronavirus, local food, Covid19 US, Lockdown Switzerland, coronavirus bio-weapon, #Koronavirus, #CoronaSchlager, food scarcity, Tanzania COVID-19, coronavirusupdate, #facemask, #LockdownNow, meat shortage, #socialdistancing Kansas, #socialdistancing Montana, #socialdistancing Wyoming, coronga virus, Bosnia Herzegovina Coronavirus, Suffolk Hardship, queue, recesión económica, Cameroon Coronavirus, #Coronavírus, Bahamas Coronavirus, Sierra Leone Coronavirus, Lithuania COVID-19, Algeria Coronavirus, CoronaSymptoms, #socialdistancing, Afghanistan Coronavirus, Corona, Oman Coronavirus, San Marino COVID-19, Sierra Leone COVID-19, كورونا_الأردن#, Suffolk hopeless, Kazakhstan COVID-19, Denmark Coronavirus, Kiribati Coronavirus, #veyekow, Jordan COVID-19, mask, #oustduterte, Morocco Coronavirus, virus, #chinacoronavirus, statistics, #YoMeQuedoEnCasa, Ukraine COVID-19, Torino, Chile Coronavirus, #coronavirusrd, #coronavirusupdates, Hungary COVID-19, Suffolk Corona Depressed, #vizagcovid19 #covid19vizag #indiavizagcovid19 #covid19vskp, #caronavirus, Rwanda COVID-19, Uzbekistan Coronavirus, #caronavirususa, Loss of Smell, علاج_كورونا#, Pakistan Coronavirus, #vizag, Slovakia COVID-19, Netherlands COVID-19, #coronaapocolypse, #新冠病毒, Burma COVID-19, Benin COVID-19, #coronaviruscalifornia, #socialdistancing Delaware, Napoli, Vanuatu COVID-19, abdominal pain, mass testing, #CoronavirusOutbreak, Belize COVID-19, breathing issues, corona virus, Guatemala COVID-19, #wuhanvirus, security, Suffolk lockdown, virus corona, #coronaviruses, Outdoor Masks, Cuarentena Colombia, #COVID19, #COVID_19uk, Thailand COVID-19, Mali COVID-19, covid-19 doctors, Norway Coronavirus, Coronavirus Vaccine, Finland Coronavirus, #FlattenTheCurve, Latvia Coronavirus, #coronavirusbrasil, eggs shortage, #socialdistancing Colorado, Paraguay Coronavirus, #coronavirusmumbai, Jordan Coronavirus, #socialdistancing North Carolina, #Pandemic, Ivory Coast Coronavirus, curfew news, Mauritius COVID-19, #masks4all, #Swiss, #socialdistancing Maryland, South Sudan Coronavirus, #Outbreak, #socialdistancing us, Uganda Coronavirus, #codvid19, #covid-19 #covid19, Djibouti COVID-19, #coronaviruscolombia, China Coronavirus, Philippines COVID-19, coronaviridae, Argentina Coronavirus, #CoronaUpdate, #Piacenza, coronavirus transmission, Corona Riverhead NY, Covid-19 Suffolk NY, respiradores Colombia, فيروس كورونا, #fakenewscovid19, Panama COVID-19, China COVID-19, Corona East Hampton NY, Indonesia COVID-19, Denmark COVID-19, #socialdistancing Iowa, كورونا#, Covid19Deutschland, #coronavirusmexico, Austria COVID-19, Armenia Coronavirus, Kenya Coronavirus, #코로나, Coronavirus, #Coronavirus, France COVID-19, #socialdistancing Kentucky, فيروس_كورونا_المستجد#, Cameroon COVID-19, Guinea COVID-19, 新冠病毒, Kyrgyzstan Coronavirus, #coronavirusargentina, Economic recession Switzerland, Tonga COVID-19, #shelterinplace, #socialdistancing Hawaii, Bergamo, #caronavirusoutbreak #Quarantined, Mauritius Coronavirus, Zambia COVID-19, bread shortage, Montenegro Coronavirus, Cyprus Coronavirus, CORONA VIRUS, covid-19 usa, #safety, COVID-19-Pandemie, #CoronaVirusitaly, Saudi Arabia coronavirus update, CSA, #2019nCoV, Peru COVID-19, #supermercato #quarantena, Serbia Coronavirus, Sweden Coronavirus, sore throat, Italy COVID-19, #socialdistancing Tennessee, #coronaviruspandemic, Barbados Coronavirus, #coronaVirus, CoronaVirusInNigeria, Somalia Coronavirus, #kamitidaktakutviruscorona, #socialdistancing Wisconsin, #2019ncov, ayuda gobierno, Corona virus كورونا, 加油武汉, Djibouti Coronavirus, 武汉肺炎, #CoronavirusFR, Social distance, Saudi Arabia Coronavirus, #IStayHome, Guinea Coronavirus, Australia COVID-19, #mask4all, Slovenia Coronavirus, Brunei COVID-19, Nicaragua COVID-19, Sudan COVID-19, Korea South Coronavirus, #covid19Canada, Eritrea COVID-19, #coronavirusIndonesia, Bologna, Kosovo COVID-19, #covid-19, Coronavirus Switzerland, Coronavirus Geneva, covid recovered, Kyrgyzstan COVID-19, #CoronavirusEnColombia, #Wuhan, #caronavirusindia, Corona Brookhaven NY, novelcoronavirus, #corona, Turkey COVID-19, Mauritania Coronavirus, #2019nCov, Bulgaria COVID-19, Oman COVID-19, Bulgaria Coronavirus, #coronaviruspuertorico, #coronavirus, #socialdistancing California, #coronavirusnewyork, coronavirus weapon, Cuba COVID-19, Suffolk covid, #coronaflu, #COVIDpain, #Covid, #socialdistancing Rhode Island, إشاعات_كورونا#, #covid19vizag #vizagcovid19, #covid19Indonesia, Outdoor, Switzerland COVID-19, Slovenia COVID-19, #socialdistancing Minnesota, 2019nCoV, Kosovo Coronavirus, covidiot, #marchapelocorona, dry beans shortage, 武漢肺炎, #socialdistancing Mississippi, Bahrain COVID-19, Serbia COVID-19, mascherina #Covid, United States COVID-19, food supply chain, #covid, #covid19italia, CoronaVirus Iran, Emergency food supply, Togo Coronavirus, Latvia COVID-19, muscle pain, brot, Ecuador Coronavirus, Covid19, Laos COVID-19, diarrhoea, #ncoV2019, Swaziland COVID-19, #COVID, Colombia Coronavirus, Online ordering, Suffolk Pandemic, People, UAE Coronavirus, Iraq COVID-19, Palau COVID-19, Korea South COVID-19, Coronavírus brasil, #coronavirususa, East Timor Coronavirus, #Corona virus, #COVID-19, Bolivia Coronavirus, COVID -19., Corona Southold NY, #コロナ,Benin Coronavirus, #COVID–19, test kits, Qatar COVID-19, Congo COVID-19, Comoros COVID-19, Coronavirus-Pandemie, #ForcaCoronaVirus, #socialdistancing New Mexico, #武汉加油, Mask, Tajikistan Coronavirus, maske, #coronaviruskerala, #Covid-19 United States, Myanmar, #myfitnesspal, Piacenza, #covid haiti, Libya COVID-19, supplies shortage, #新型コロナウイルス, Firenze, 코로나바이러스, Philippines Coronavirus, Grenada COVID-19, Israel Coronavirus, #covid-19 brasil, Cuba Coronavirus, Turkmenistan Coronavirus, #MASKS, #PánicoPorCoranovirus, Germany Coronavirus, #Ncov, Dominican Republic Coronavirus, Norway COVID-19, South Hampton NY, Syria COVID-19, #CoronaVirusSeattle, UK Coronavirus, flour shortage, Tunisia Coronavirus, Nicaragua Coronavirus, suffolk sick, Samoa COVID-19, Italia, #iorestoacasa, #coronavirusdelhi, Papua New Guinea Coronavirus, #ohiocoronavirus, COVID19NIGERIA, #武汉疫情, #coronafest, #Covid19Switzerland, Bhutan Coronavirus, Somalia COVID-19, #Sinophobia, #Covid_19india, #Corvid19virus, Luxembourg COVID-19, #socialdistancing Missouri, Malaysia COVID-19, #socialdistancing Illinois, Chad Coronavirus, #2019_ncov, #socialdistancing Georgia, Cutremur, Mongolia Coronavirus, Sudan Coronavirus, covid-19 healthcare, N95, #coronaviruschile, Madagascar Coronavirus, Syria Coronavirus, Solomon Islands Coronavirus,كورونا_قطر#, Spain COVID-19, Tonga Coronavirus, #DoingMyPartCO, Suffolk unemployment, quédate en casa Colombia, Liechtenstein COVID-19, Nauru COVID-19, #NeuerCoronavirus, #caronavirusoutbreak, #socialdistancing Arkansas, Ethiopia Coronavirus, Guatemala Coronavirus, Pakistan COVID-19, Dominica COVID-19, CORONA, Treatment, #CoronaLockdown, Coronavirus usa, walk, #SARSCoV2, Suffolk loss, corvid-19, Portugal Coronavirus, #coronacure, Chile COVID-19, COVID19 USA, Sweden COVID-19, France Coronavirus, #Foodbank, #kowona, Botswana Coronavirus, extension, Lithuania Coronavirus, Albania Coronavirus, Burkina Coronavirus, #WuhanCoronavirus, Ecuador COVID-19, Tajikistan COVID-19, Lebanon Coronavirus, Cambodia Coronavirus, #ncov19, CoronaVirus Korean, Seychelles Coronavirus, Honduras Coronavirus, Nariño Covid19, #socialdistancing Virginia, safety , Japan Coronavirus, Turkey Coronavirus, #coronavid19, #新冠肺炎, #socialdistancing Connecticut, Belgium Coronavirus, withings.com kg, #earth, Haiti COVID-19, #COVID19, wuhan virus, #socialdistancing Washington, Hungary Coronavirus, Togo COVID-19, Covid19DE, Botswana COVID-19, #Coronavirustexas, #coronavirusnobrasil, #COVIDPakistan, Mexico COVID-19, coronavirus china, #chinavirus, Corona Ausbruch, Poland COVID-19, #pandemic, coronavirus outbreak, mehl, korona, #coronavirusoutbreak, Kuwait Coronavirus, #COVD, Namibia Coronavirus, #socialdistancing Indiana, #coronavirusuk, Saudi Arabia COVID-19, #NouveauCoronavirus, Vatican City Coronavirus, Cape Verde Coronavirus, Niger Coronavirus, #socialdistancing Alabama, United Arab Emirates Coronavirus, Finland COVID-19, Roma, pandemic, CoronaVirus Japan, corona vairus, #covid19uk, #China, Bangladesh COVID-19, #Lockdown, United Arab Emirates COVID-19, Austria Coronavirus, Uganda COVID-19, New Zealand Coronavirus, local food, Covid19 US, Lockdown Switzerland, coronavirus bio-weapon, #Koronavirus, #CoronaSchlager, food scarcity, Tanzania COVID-19, coronavirusupdate, #facemask, #LockdownNow, meat shortage, #socialdistancing Kansas, #socialdistancing Montana, #socialdistancing Wyoming, coronga virus, Bosnia Herzegovina Coronavirus, Suffolk Hardship, queue, recesión económica, Cameroon Coronavirus, #Coronavírus, Bahamas Coronavirus, Sierra Leone Coronavirus, Lithuania COVID-19, Algeria Coronavirus, CoronaSymptoms, #socialdistancing, Afghanistan Coronavirus, Corona, Oman Coronavirus, San Marino COVID-19, Sierra Leone COVID-19, كورونا_الأردن#, Suffolk hopeless, Kazakhstan COVID-19, Denmark Coronavirus, Kiribati Coronavirus, #veyekow, Jordan COVID-19, mask, #oustduterte, Morocco Coronavirus, virus, #chinacoronavirus, statistics, #YoMeQuedoEnCasa, Ukraine COVID-19, Torino, Chile Coronavirus, #coronavirusrd, #coronavirusupdates, Hungary COVID-19, Suffolk Corona Depressed, #vizagcovid19 #covid19vizag #indiavizagcovid19 #covid19vskp, #caronavirus, Rwanda COVID-19, Uzbekistan Coronavirus, #caronavirususa, Loss of Smell, علاج_كورونا#, Pakistan Coronavirus, #vizag, Slovakia COVID-19, Netherlands COVID-19, #coronaapocolypse, #新冠病毒, Burma COVID-19, Benin COVID-19, #coronaviruscalifornia, #socialdistancing Delaware, Napoli, Vanuatu COVID-19, abdominal pain, mass testing, #CoronavirusOutbreak, Belize COVID-19, breathing issues, corona virus, Guatemala COVID-19, #wuhanvirus, security, Suffolk lockdown, virus corona, #coronaviruses, Outdoor Masks, Cuarentena Colombia, #COVID19, #COVID_19uk, Thailand COVID-19, Mali COVID-19, covid-19 doctors, Norway Coronavirus, Coronavirus Vaccine, Finland Coronavirus, #FlattenTheCurve, Latvia Coronavirus, #coronavirusbrasil, eggs shortage, #socialdistancing Colorado, Paraguay Coronavirus, #coronavirusmumbai, Jordan Coronavirus, #socialdistancing North Carolina, #Pandemic, Ivory Coast Coronavirus, curfew news, Mauritius COVID-19, #masks4all, #Swiss, #socialdistancing Maryland, South Sudan Coronavirus, #Outbreak, #socialdistancing us, Uganda Coronavirus, #codvid19, #covid-19 #covid19, Djibouti COVID-19, #coronaviruscolombia, China Coronavirus, Philippines COVID-19, coronaviridae, Argentina Coronavirus, #CoronaUpdate, #Piacenza, coronavirus transmission, Corona Riverhead NY, Covid-19 Suffolk NY, respiradores Colombia, فيروس كورونا, #fakenewscovid19, Panama COVID-19, China COVID-19, Corona East Hampton NY, Indonesia COVID-19, Denmark COVID-19, #socialdistancing Iowa, كورونا#, Covid19Deutschland, #coronavirusmexico, Austria COVID-19, Armenia Coronavirus, Kenya Coronavirus, #코로나, Coronavirus, #Coronavirus, France COVID-19, #socialdistancing Kentucky, فيروس_كورونا_المستجد#, Cameroon COVID-19, Guinea COVID-19, 新冠病毒, Kyrgyzstan Coronavirus, #coronavirusargentina, Economic recession Switzerland, Tonga COVID-19, #shelterinplace, #socialdistancing Hawaii, Bergamo, #caronavirusoutbreak #Quarantined, Mauritius Coronavirus, Zambia COVID-19, bread shortage, Montenegro Coronavirus, Cyprus Coronavirus, CORONA VIRUS, covid-19 usa, #safety, COVID-19-Pandemie, #CoronaVirusitaly, Saudi Arabia coronavirus update, CSA, #2019nCoV, Peru COVID-19, #supermercato #quarantena, Serbia Coronavirus, Sweden Coronavirus, sore throat, Italy COVID-19, #socialdistancing Tennessee, #coronaviruspandemic, Barbados Coronavirus, #coronaVirus, CoronaVirusInNigeria, Somalia Coronavirus, #kamitidaktakutviruscorona, #socialdistancing Wisconsin, #2019ncov, ayuda gobierno, Corona virus كورونا, 加油武汉, Djibouti Coronavirus, 武汉肺炎, #CoronavirusFR, Social distance, Saudi Arabia Coronavirus, #IStayHome, Guinea Coronavirus, Australia COVID-19, #mask4all, Slovenia Coronavirus, Brunei COVID-19, Nicaragua COVID-19, Sudan COVID-19, Korea South Coronavirus, #covid19Canada, Eritrea COVID-19, #coronavirusIndonesia, Bologna, Kosovo COVID-19, #covid-19, Coronavirus Switzerland, Coronavirus Geneva, covid recovered, Kyrgyzstan COVID-19, #CoronavirusEnColombia, #Wuhan, #caronavirusindia, Corona Brookhaven NY, novelcoronavirus, #corona, Turkey COVID-19, Mauritania Coronavirus, #2019nCov, Bulgaria COVID-19, Oman COVID-19, Bulgaria Coronavirus, #coronaviruspuertorico, #coronavirus, #socialdistancing California, #coronavirusnewyork, coronavirus weapon, Cuba COVID-19, Suffolk covid, #coronaflu, #COVIDpain, #Covid, #socialdistancing Rhode Island, إشاعات_كورونا#, #covid19vizag #vizagcovid19, #covid19Indonesia, Outdoor, Switzerland COVID-19, Slovenia COVID-19, #socialdistancing Minnesota, 2019nCoV, Kosovo Coronavirus, covidiot, #marchapelocorona, dry beans shortage, 武漢肺炎, #socialdistancing Mississippi, Bahrain COVID-19, Serbia COVID-19, mascherina #Covid, United States COVID-19, food supply chain, #covid, #covid19italia, CoronaVirus Iran, Emergency food supply, Togo Coronavirus, Latvia COVID-19, muscle pain, brot, Ecuador Coronavirus, Covid19, Laos COVID-19, diarrhoea, #ncoV2019, Swaziland COVID-19, #COVID, Colombia Coronavirus, Online ordering, Suffolk Pandemic, People, UAE Coronavirus, Iraq COVID-19, Palau COVID-19, Korea South COVID-19, Coronavírus brasil, #coronavirususa, East Timor Coronavirus, #Corona virus, #COVID-19, Bolivia Coronavirus, COVID -19., Corona Southold NY, #コロナ,Benin Coronavirus, #COVID–19, test kits, Qatar COVID-19, Congo COVID-19, Comoros COVID-19, Coronavirus-Pandemie, #ForcaCoronaVirus, #socialdistancing New Mexico, #武汉加油, Mask, Tajikistan Coronavirus, maske, #coronaviruskerala, #Covid-19 United States, Myanmar, #myfitnesspal, Piacenza, #covid haiti, Libya COVID-19, supplies shortage, #新型コロナウイルス, Firenze, 코로나바이러스, Philippines Coronavirus, Grenada COVID-19, Israel Coronavirus, #covid-19 brasil, Cuba Coronavirus, Turkmenistan Coronavirus, #MASKS, #PánicoPorCoranovirus, Germany Coronavirus, #Ncov, Dominican Republic Coronavirus, Norway COVID-19, South Hampton NY, Syria COVID-19, #CoronaVirusSeattle, UK Coronavirus, flour shortage, Tunisia Coronavirus, Nicaragua Coronavirus, suffolk sick, Samoa COVID-19, Italia, #iorestoacasa, #coronavirusdelhi, Papua New Guinea Coronavirus, #ohiocoronavirus, COVID19NIGERIA, #武汉疫情, #coronafest, #Covid19Switzerland, Bhutan Coronavirus, Somalia COVID-19, #Sinophobia, #Covid_19india, #Corvid19virus, Luxembourg COVID-19, #socialdistancing Missouri, Malaysia COVID-19, #socialdistancing Illinois, Chad Coronavirus, #2019_ncov, #socialdistancing Georgia, Cutremur, Mongolia Coronavirus, Sudan Coronavirus, covid-19 healthcare, N95, #coronaviruschile, Madagascar Coronavirus, Syria Coronavirus, Solomon Islands Coronavirus,كورونا_قطر#, Spain COVID-19, Tonga Coronavirus, #DoingMyPartCO, Suffolk unemployment, quédate en casa Colombia, Liechtenstein COVID-19, Nauru COVID-19, #NeuerCoronavirus, #caronavirusoutbreak, #socialdistancing Arkansas, Ethiopia Coronavirus, Guatemala Coronavirus, Pakistan COVID-19, Dominica COVID-19, CORONA, Treatment, #CoronaLockdown, Coronavirus usa, walk, #SARSCoV2, Suffolk loss, corvid-19, Portugal Coronavirus, #coronacure, Chile COVID-19, COVID19 USA, Sweden COVID-19, France Coronavirus, #Foodbank, #kowona, Botswana Coronavirus, extension, Lithuania Coronavirus, Albania Coronavirus, Burkina Coronavirus, #WuhanCoronavirus, Ecuador COVID-19, Tajikistan COVID-19, Lebanon Coronavirus, Cambodia Coronavirus, #ncov19, CoronaVirus Korean, Seychelles Coronavirus, Honduras Coronavirus, Nariño Covid19, #socialdistancing Virginia, safety
|
Table A2.
Full list of keywords and hashtags used for data collection (cont’d).
| Brazil COVID-19, Micronesia Coronavirus, Coronavirus crisis, #socialdistancing Nevada, Mongolia COVID-19, Malta Coronavirus, Estonia Coronavirus, #Briefing_COVID19, Burundi Coronavirus, Canada COVID-19, Ghana Coronavirus, Iceland Coronavirus, #PhysicalDistancing, #emergency, كورونا_مصر#, Peru Coronavirus, Mexico Coronavirus, photo, Equatorial Guinea Coronavirus, #CoronaVirusCA, Estonia COVID-19, coronavírus brasil, Gabon COVID-19, Canada Coronavirus, #coronavirusperu, Bangladesh Coronavirus, Belarus Coronavirus, Suriname Coronavirus, Iran Coronavirus, #coronavirusinindia, #2019_nocv, Namibia COVID-19, Corona, #PutusRantaiCovid19, 武汉加油, image, Armenia COVID-19, Liberia COVID-19, Maldives COVID-19, Taiwan COVID-19, Nepal Coronavirus, Bhutan COVID-19, Ethiopia COVID-19, Jamaica Coronavirus, #dontgoviral, فيروس_كورونا#, Coronavirus US, Andorra COVID-19, Poland Coronavirus, Liberia Coronavirus, Tunisia COVID-19, Suffolk worry, #virus, Georgia Coronavirus, #武漢肺炎, nCov2019, كورونا_الكويت#, Central African Rep Coronavirus, Dominica Coronavirus, food shortage, Fiji COVID-19, Belarus COVID-19, Palau Coronavirus, #covid19france, government, Singapore COVID-19, #Corona, Papua New Guinea COVID-19, #Coronavirusnyc, carona virus, #mascherina, 2 week food supply, Bahamas COVID-19, Libya Coronavirus, Ireland Coronavirus, shopping, Thailand Coronavirus, Tuvalu Coronavirus, corona, #Coronavirusireland, Bahrain Coronavirus, coronavirus conspiracy, 2019-nCoV, Venezuela COVID-19, Burundi COVID-19, #socialdistancing Pennsylvania, Sri Lanka COVID-19, coronavirus new york, lombardia, #코로나바이러스, #CDC, Guinea-Bissau COVID-19, coronavirus pandemic, كورونا_لبنان#, COVID, El Salvador Coronavirus, coronavirus wuhan, #CoronaAlert, #Epidemic, Czech Republic COVID-19, #coronavirusmadrid, #covid19, Colombia COVID-19, NeuerCoronavirus, #QuarantineAndChill, #Coronapanik, South Africa COVID-19, Romania Coronavirus, Afghanistan COVID-19, corongavirus, covid-19, Grenada Coronavirus, Liechtenstein Coronavirus, test kit, Bosnia Herzegovina COVID-19, quarantena, Angola COVID-19, Greece COVID-19, Lesotho Coronavirus, covid19, corona virus news, groceries, muertes Colombia, #coronavirusu, #socialdistancing West Virginia, #DuringMy14DayQuarantine, park, activities, Lesotho COVID-19, Gambia COVID-19, Yemen Coronavirus, cutremur, covid, #socialdistancing Arizona, Uruguay COVID-19, mascarilla, #socialdistancing South Dakota, Micronesia COVID-19, Brescia, East Timor COVID-19, Masks4all, #MyPandemicSurvivalPlan, Croatia COVID-19, Turkmenistan COVID-19, Covid-19 US, Vanuatu Coronavirus, #socialdistancing North Dakota, Moldova COVID-19, Samoa Coronavirus, magnitude, nCoV, Nigeria COVID-19, recuperados covid19 Colombia, supermercato, #coronavirusbrazil, Monaco COVID-19, Mozambique Coronavirus, Mozambique COVID-19, #socialdistancing New Jersey, Measures, Malaysia Coronavirus, potatoes shortage, Niger COVID-19, Greece Coronavirus, Croatia Coronavirus, San Marino Coronavirus, Corona Suffolk NY, Haiti Coronavirus, #coronapocalypse, Ukraine Coronavirus, food supply, Guyana COVID-19, Senegal Coronavirus, Costa Rica COVID-19, CoV, Australia Coronavirus, #covid_19, #Coronaferien, #FarmersMarket, Nauru Coronavirus, Lebanon COVID-19, Vietnam Coronavirus, ecq, Spain Coronavirus, Cambodia COVID-19, #socialdistancing Louisiana, United Kingdom Coronavirus, Vietnam COVID-19, Kenya COVID-19, Macedonia Coronavirus, optimista, #coronavirustelangana, Zambia Coronavirus, withings.com st, #NovelCorona, Cape Verde COVID-19, Suffolk corona, #corona haiti, Macedonia COVID-19, Honduras COVID-19, #Covid_19Colombia, Burkina COVID-19, #PresidentCuomo, Ireland COVID-19, #firenze, #africacoronacure, #wuhan, #COVID19NIGERIA, Covid19_DE, #疫情, Covid-19 nurses, #Coronavirusmexico, Equatorial Guinea COVID-19, #CoronavirusSwitzerland, Swaziland Coronavirus, St Lucia Coronavirus, Egypt COVID-19, Paraguay COVID-19, Belgium COVID-19, #coronapandemic, Guyana Coronavirus, ncov-19, Nariño Coronavirus, Central African Rep COVID-19, masque, #coronavirusespana, #fakenewscorona, #covid2019pt, Iceland COVID-19, Andorra Coronavirus, Luxembourg Coronavirus, Nouveau coronavirus, Rwanda Coronavirus, Madagascar COVID-19, Masks, Saudi Arabia Covid-19 Update, #yellowalert #chinavirus, ncov, #socialdistancing Texas, emergency, Kiribati COVID-19, Korea North Coronavirus, cough, covid 19, #Sars-cov-2, #socialdistancing Idaho, #coronavirusuruguay, #武汉肺炎, picture, #socialdistancing Michigan, Covid19 Switzerland, Iraq Coronavirus, #socialdistancing Florida, Eritrea Coronavirus, breathing difficulties, Venezuela Coronavirus, #coronavirusafrica, Smithtown NY, #coronavirus, Fiji Coronavirus, Covid-19 brasil, rice shortage, Slovakia Coronavirus, UK COVID-19, كورونا_إيران#, #Wuhancoronavirus, #Anakapalli #covid19, Azerbaijan COVID-19, seism, Germany COVID-19, #Wuhanlockdown, Chad COVID-19, Italy Coronavirus, Nigeria Coronavirus, Russian Federation Coronavirus, Portugal COVID-19, St Lucia COVID-19, #socialdistancing Vermont, #coronaviruscure, #CoronavirusPandemic, كورونا_البحرين#, CoV2019 WHO 2019CoV coronovirus PHAC Canada Toronto, South Africa Coronavirus, 疫情, fatigue, Uruguay Coronavirus, Zimbabwe Coronavirus, Dominican Republic COVID-19, earthquake, Azerbaijan Coronavirus, Georgia COVID-19, India Coronavirus, Montenegro COVID-19, #CoronaVirusInNigeria, #covid19espana, India COVID-19, mala gestión, #socialdistancing Oregon, #StayHomeSaveLives, Long Island Corona, bohnen, lock down, outside, Malawi COVID-19, #Coronavirus, #socialdistancing South Carolina, #covid-19uk, Mauritania COVID-19, #N95, corona recovered, Costa Rica Coronavirus, novel coronavirus, testkit. #StayAtHome, Albania COVID-19, Marshall Islands COVID-19, coronavirus, fever, #coronavirustruth, Egypt Coronavirus, #socialdistancing Utah, Malta COVID-19, كورونا_الجديد#, Virus Corona, #COVID19Pandemic, #WuhanVirus, #coronaoutbreak, Comoros Coronavirus, #Chile, Cyprus COVID-19, Russian Federation COVID-19, Jamaica COVID-19, #coronavirusUP, Sri Lanka Coronavirus, Kuwait COVID-19, Netherlands Coronavirus, safe, CoronaTreatment, #coronavirusoutbreak, Belize Coronavirus, COVID-19, #socialdistancing Oklahoma, covid19 recovered, #CoronaVirusDE, Moldova Coronavirus, CoronavirusFR, nCov, #socialdistancing Massachusetts, Korea North COVID-19, 코로나, #COVID19PT, #shortage, Switzerland Coronavirus, Tuvalu COVID-19, outdoor, #covd19, Coronavirus Colombia, withings.com lb, #加油武汉, #staysafe, New Zealand COVID-19, UCI disponibles, disaster, El Salvador COVID-19, Seychelles COVID-19, コロナ, Malawi Coronavirus, Vatican City COVID-19, Angola Coronavirus, Kazakhstan Coronavirus, #infocoronavirus, #nCoV, Czech Republic Coronavirus, #covid_19uk, #socialdistancing New York, 新型冠状病毒, #新型冠状病毒, #Distancing, Marshall Islands Coronavirus, #CoronaVirusCanada, Argentina COVID-19, Mali Coronavirus, coronavirus news, #Covid19, 新冠肺炎, #Kungflu, #codvid_19, masks, nCoV2019, Covid_19, Wuhan virus, images, testkits, كورونا_السعودية#, Nepal COVID-19, Corona Islip NY, vegetables shortage, #socialdistancing Ohio, #coronavirus #covid-19, Tanzania Coronavirus, Brazil Coronavirus, COVID-19 USA, #coronavirusnyc, #socialdistancing Maine, #コロナウイルス, social distancing, #sentom, #Covid-19, UAE COVID-19, corona virus outbreak, Taiwan Coronavirus, Monaco Coronavirus, Israel COVID-19, #socialdistancing New Hampshire, #coronaday, Indonesia Coronavirus, Symptoms, loss of smell, #CoronaVirusIreland, Panama Coronavirus, Barbados COVID-19, #covid19ireland, Burma Coronavirus, Covid19 Suffolk NY, Milano, Gabon Coronavirus, #security, #africa, Iran COVID-19, #covid19india, Ivory Coast COVID-19, #Covid19 united states, #masks, Senegal COVID-19, South Sudan COVID-19, coronavirus epidemic, #Connecting, Gambia Coronavirus, mascherina, Corona Babylon NY, social distance, United Kingdom COVID-19, Singapore Coronavirus, restrictions, #Covid-19brasil, tapabocas Colombia, #CoronavirusAustralia, Suriname COVID-19, Algeria COVID-19, #coronavirusecuador, #conronaviruspandemic, Yemen COVID-19, #Covid-19 US, #coronaviruscure, cereals shortage, Morocco COVID-19, #socialdistancing Nebraska, ncov19, Bolivia COVID-19, Japan COVID-19, Solomon Islands COVID-19, Corona Huntington NY, United States Coronavirus, #socialdistancing Alaska, Guinea-Bissau Coronavirus, #ncov2019, duterte, novel corona virus, Romania COVID-19, #quarantine, #covid2019, #socialdistancing usa, #Socialdistancing, Brunei Coronavirus, Qatar Coronavirus, #milano, #코로나19, Maldives Coronavirus, #coronavirusmaharashtra, Congo Coronavirus, Uzbekistan COVID-19, كورونا_العراق#, Ghana COVID-19, Laos Coronavirus, Zimbabwe COVID-19, #coronadeutschland |
References
- Castillo, C. Big Crisis Data; Cambridge University Press: Cambridge, UK, 2016. [Google Scholar]
- Fraustino, J.D.; Liu, B.F.; Jin, Y. Social media use during disasters. Soc. Media Crisis Commun. 2017, 283, 32–47. [Google Scholar]
- Starbird, K.; Palen, L.; Hughes, A.L.; Vieweg, S. Chatter on the red: What hazards threat reveals about the social life of microblogged information. In ACM Conference on Computer Supported Cooperative Work; Association for Computing Machinery: New York, NY, USA, 2010; pp. 241–250. [Google Scholar]
- Sinnenberg, L.; Buttenheim, A.M.; Padrez, K.; Mancheno, C.; Ungar, L.; Merchant, R.M. Twitter as a tool for health research: A systematic review. Am. J. Public Health 2017, 107, e1–e8. [Google Scholar] [CrossRef] [PubMed]
- Zadeh, A.H.; Zolbanin, H.M.; Sharda, R.; Delen, D. Social media for nowcasting flu activity: Spatio-temporal big data analysis. Inf. Syst. Front. 2019, 21, 743–760. [Google Scholar] [CrossRef]
- Broniatowski, D.A.; Paul, M.J.; Dredze, M. National and local influenza surveillance through Twitter: An analysis of the 2012–2013 influenza epidemic. PLoS ONE 2013, 8, e83672. [Google Scholar] [CrossRef] [Green Version]
- Lamsal, R. Corona Virus (COVID-19) Geolocation-based Sentiment Data. IEEE Dataport 2020. [Google Scholar] [CrossRef]
- Lamsal, R. Corona Virus (COVID-19) Tweets Dataset. IEEE Dataport 2020. [Google Scholar] [CrossRef]
- Alqurashi, S.; Alhindi, A.; Alanazi, E. Large Arabic Twitter Dataset on COVID-19. arXiv 2020, arXiv:2004.04315. [Google Scholar]
- Haouari, F.; Hasanain, M.; Suwaileh, R.; Elsayed, T. ArCOV-19: The First Arabic COVID-19 Twitter Dataset with Propagation Networks. arXiv 2020, arXiv:2004.05861. [Google Scholar]
- Kang, Y.; Gao, S.; Liang, Y.; Li, M.; Rao, J.; Kruse, J. Multiscale dynamic human mobility flow dataset in the US during the COVID-19 epidemic. Sci. Data 2020, 7, 1–13. [Google Scholar] [CrossRef]
- Park, S.; Han, S.; Kim, J.; Molaie, M.M.; Vu, H.D.; Singh, K.; Han, J.; Lee, W.; Cha, M. COVID-19 Discourse on Twitter in Four Asian Countries: Case Study of Risk Communication. J. Med. Internet Res. 2021, 23, e23272. [Google Scholar] [CrossRef] [PubMed]
- Banda, J.M.; Tekumalla, R.; Wang, G.; Yu, J.; Liu, T.; Ding, Y.; Chowell, G. A large-scale COVID-19 Twitter chatter dataset for open scientific research—An international collaboration. arXiv 2020, arXiv:2004.03688. [Google Scholar] [CrossRef]
- Gohil, S.; Vuik, S.; Darzi, A. Sentiment analysis of health care tweets: Review of the methods used. JMIR Public Health Surveill. 2018, 4, e43. [Google Scholar] [CrossRef]
- Gui, X.; Kou, Y.; Pine, K.H.; Chen, Y. Managing uncertainty: Using social media for risk assessment during a public health crisis. In Proceedings of the 2017 CHI Conference on Human Factors in Computing Systems, Denver, CO, USA, 2 May 2017; pp. 4520–4533. [Google Scholar]
- Alamoodi, A.; Zaidan, B.; Zaidan, A.; Albahri, O.; Mohammed, K.; Malik, R.; Almahdi, E.; Chyad, M.; Tareq, Z.; Albahri, A.; et al. Sentiment analysis and its applications in fighting COVID-19 and infectious diseases: A systematic review. Expert Syst. Appl. 2020, 167, 114155. [Google Scholar] [CrossRef]
- Barbieri, F.; Espinosa-Anke, L.; Camacho-Collados, J. A Multilingual Language Model Toolkit for Twitter. arXiv 2021, arXiv:2104.12250. [Google Scholar]
- Geotagging. 2021. Available online: https://en.wikipedia.org/wiki/Geotagging (accessed on 20 June 2021).
- Boulos, M.N.K.; Geraghty, E.M. Geographical Tracking and Mapping of Coronavirus Disease COVID-19/Severe Acute Respiratory Syndrome Coronavirus 2 (SARS-CoV-2) Epidemic and Associated Events around the World: How 21st Century GIS Technologies Are Supporting the Global Fight against Outbreaks and Epidemics. Int. J. Health Geogr. 2020, 19, 8. [Google Scholar]
- Haworth, B. Emergency management perspectives on volunteered geographic information: Opportunities, challenges and change. Comput. Environ. Urban Syst. 2016, 57, 189–198. [Google Scholar] [CrossRef]
- Tzavella, K.; Fekete, A.; Fiedrich, F. Opportunities provided by geographic information systems and volunteered geographic information for a timely emergency response during flood events in Cologne, Germany. Nat. Hazards 2018, 91, 29–57. [Google Scholar] [CrossRef]
- Marrero, M.; Urbano, J.; Sánchez-Cuadrado, S.; Morato, J.; Gómez-Berbís, J.M. Named entity recognition: Fallacies, challenges and opportunities. Comput. Stand. Interfaces 2013, 35, 482–489. [Google Scholar] [CrossRef]
- Sekine, S.; Ranchhod, E. Named Entities: Recognition, Classification and Use; John Benjamins Publishing: Amsterdam, The Netherlands, 2009; Volume 19. [Google Scholar]
- Farmakiotou, D.; Karkaletsis, V.; Koutsias, J.; Sigletos, G.; Spyropoulos, C.D.; Stamatopoulos, P. Rule-based named entity recognition for Greek financial texts. In Proceedings of the Workshop on Computational Lexicography and Multimedia Dictionaries (COMLEX 2000), Kato Achaia, Greece, 22–23 September 2000; pp. 75–78. [Google Scholar]
- Finkel, J.R.; Manning, C.D. Nested named entity recognition. In Proceedings of the 2009 Conference on Empirical Methods in Natural Language Processing, Singapore, 6 August 2009; pp. 141–150. [Google Scholar]
- Manierre, M.J. Gaps in knowledge: Tracking and explaining gender differences in health information seeking. Soc. Sci. Med. 2015, 128, 151–158. [Google Scholar] [CrossRef]
- Antonio, A.; Tuffley, D. The gender digital divide in developing countries. Future Internet 2014, 6, 673–687. [Google Scholar] [CrossRef] [Green Version]
- Johnson, J.L.; Greaves, L.; Repta, R. Better science with sex and gender: Facilitating the use of a sex and gender-based analysis in health research. Int. J. Equity Health 2009, 8, 14. [Google Scholar] [CrossRef] [Green Version]
- Lawrence, K.; Rieder, A. Methodologic and ethical ramifications of sex and gender differences in public health research. Gender Med. 2007, 4, S96–S105. [Google Scholar] [CrossRef]
- CrisisNLP. TBCOV Data Repository. 2021. Available online: https://crisisnlp.qcri.org/tbcov (accessed on 9 November 2021).
- Thara, S.; Poornachandran, P. Code-mixing: A brief survey. In Proceedings of the 2018 International Conference on Advances in Computing, Communications and Informatics (ICACCI), Bangalore, India, 19–22 September 2018; pp. 2382–2388. [Google Scholar]
- Qazi, U.; Imran, M.; Ofli, F. GeoCoV19: A dataset of hundreds of millions of multilingual COVID-19 tweets with location information. Sigspatial Spec. 2020, 12, 6–15. [Google Scholar] [CrossRef]
- MacKinlay, A.; Aamer, H.; Yepes, A.J. Detection of adverse drug reactions using medical named entities on Twitter. In AMIA Annual Symposium Proceedings; American Medical Informatics Association: Bethesda, MD, USA, 2017; Volume 2017, p. 1215. [Google Scholar]
- Stefanidis, A.; Vraga, E.; Lamprianidis, G.; Radzikowski, J.; Delamater, P.L.; Jacobsen, K.H.; Pfoser, D.; Croitoru, A.; Crooks, A. Zika in Twitter: Temporal variations of locations, actors, and concepts. JMIR Public Health Surveill. 2017, 3, e22. [Google Scholar] [CrossRef]
- Li, J.; Sun, A.; Han, J.; Li, C. A survey on deep learning for named entity recognition. IEEE Trans. Knowl. Data Eng. 2020, 34, 50–70. [Google Scholar] [CrossRef] [Green Version]
- spaCy. Trained Models & Pipelines. 2021. Available online: https://spacy.io/models (accessed on 7 December 2021).
- Grace, R. Toponym usage in social media in emergencies. Int. J. Disaster Risk Reduct. 2021, 52, 101923. [Google Scholar] [CrossRef]
- Zade, H.; Shah, K.; Rangarajan, V.; Kshirsagar, P.; Imran, M.; Starbird, K. From Situational Awareness to Actionability: Towards Improving the Utility of Social Media Data for Crisis Response. Proc. ACM-Hum.-Comput. Interact. 2018, 2, 195. [Google Scholar] [CrossRef]
- Hindustan Times. Inundated, COVID-19 Helplines Crumble. 2021. Available online: https://www.hindustantimes.com/india-news/inundated-covid-helplines-crumble-101618684641863.html (accessed on 20 June 2021).
- Times of India. Social Media Is the New Helpline. 2021. Available online: https://timesofindia.indiatimes.com/viral-news/covid-19-india-social-media-is-the-new-helpline-for-a-crisis-hit-country/articleshow/82345645.cms (accessed on 20 June 2021).
- Sloan, L.; Morgan, J.; Burnap, P.; Williams, M. Who tweets? Deriving the demographic characteristics of age, occupation and social class from Twitter user meta-data. PLoS ONE 2015, 10, e0115545. [Google Scholar] [CrossRef] [Green Version]
- Ajao, O.; Hong, J.; Liu, W. A survey of location inference techniques on Twitter. J. Inf. Sci. 2015, 41, 855–864. [Google Scholar] [CrossRef] [Green Version]
- Carley, K.M.; Malik, M.; Landwehr, P.M.; Pfeffer, J.; Kowalchuck, M. Crowd sourcing disaster management: The complex nature of Twitter usage in Padang Indonesia. Saf. Sci. 2016, 90, 48–61. [Google Scholar] [CrossRef] [Green Version]
- Haklay, M.; Weber, P. Openstreetmap: User-generated street maps. IEEE Pervasive Comput. 2008, 7, 12–18. [Google Scholar] [CrossRef] [Green Version]
- Huang, H.; Chen, W.; Xie, T.; Wei, Y.; Feng, Z.; Wu, W. The Impact of Individual Behaviors and Governmental Guidance Measures on Pandemic-Triggered Public Sentiment: Based on System Dynamics and Cross-Validation. Int. J. Environ. Res. Public Health 2021, 18, 4245. [Google Scholar] [CrossRef]
- Zhang, T.; Cheng, C. Temporal and Spatial Evolution and Influencing Factors of Public Sentiment in Natural Disasters—A Case Study of Typhoon Haiyan. ISPRS Int. J.-Geo-Inf. 2021, 10, 299. [Google Scholar] [CrossRef]
- O’Connor, B.; Balasubramanyan, R.; Routledge, B.; Smith, N. From tweets to polls: Linking text sentiment to public opinion time series. In Proceedings of the International AAAI Conference on Web and Social Media, Washington, DC, USA, 23 May 2010. [Google Scholar]
- Burnap, P.; Williams, M.L. Cyber hate speech on twitter: An application of machine classification and statistical modeling for policy and decision making. Policy Internet 2015, 7, 223–242. [Google Scholar] [CrossRef] [Green Version]
- Beigi, G.; Hu, X.; Maciejewski, R.; Liu, H. An overview of sentiment analysis in social media and its applications in disaster relief. Sentim. Anal. Ontol. Eng. 2016, 313–340. [Google Scholar] [CrossRef]
- Aday, S.; Farrell, H.; Lynch, M.; Sides, J.; Freelon, D. New media and conflict after the Arab Spring. U. S. Inst. Peace 2012, 80, 1–24. [Google Scholar]
- Liu, B. Sentiment analysis and opinion mining. Synth. Lect. Hum. Lang. Technol. 2012, 5, 1–167. [Google Scholar] [CrossRef] [Green Version]
- Medhat, W.; Hassan, A.; Korashy, H. Sentiment analysis algorithms and applications: A survey. Ain Shams Eng. J. 2014, 5, 1093–1113. [Google Scholar] [CrossRef] [Green Version]
- Zhang, L.; Wang, S.; Liu, B. Deep learning for sentiment analysis: A survey. Wiley Interdiscip. Rev. Data Min. Knowl. Discov. 2018, 8, e1253. [Google Scholar] [CrossRef] [Green Version]
- Yue, L.; Chen, W.; Li, X.; Zuo, W.; Yin, M. A survey of sentiment analysis in social media. Knowl. Inf. Syst. 2019, 60, 617–663. [Google Scholar] [CrossRef]
- Ceron, A.; Curini, L.; Iacus, S.M.; Porro, G. Every tweet counts? How sentiment analysis of social media can improve our knowledge of citizens’ political preferences with an application to Italy and France. New Media Soc. 2014, 16, 340–358. [Google Scholar] [CrossRef]
- Conneau, A.; Khandelwal, K.; Goyal, N.; Chaudhary, V.; Wenzek, G.; Guzmán, F.; Grave, É.; Ott, M.; Zettlemoyer, L.; Stoyanov, V. Unsupervised Cross-lingual Representation Learning at Scale. In Proceedings of the 58th Annual Meeting of the Association for Computational Linguistics, Online, 5 July 2020; pp. 8440–8451. [Google Scholar]
- Twitter Statistics. 2021. Available online: https://www.businessofapps.com/data/twitter-statistics/ (accessed on 22 June 2021).
- Zhang, Z.; Bors, G. “Less is more”: Mining useful features from Twitter user profiles for Twitter user classification in the public health domain. Online Inf. Rev. 2019, 44, 213–237. [Google Scholar] [CrossRef]
- Uddin, M.M.; Imran, M.; Sajjad, H. Understanding types of users on Twitter. arXiv 2014, arXiv:1406.1335. [Google Scholar]
- Okazaki, S.; Díaz-Martín, A.M.; Rozano, M.; Menéndez-Benito, H.D. Using Twitter to engage with customers: A data mining approach. Internet Res. 2015, 25, 416–434. [Google Scholar] [CrossRef]
- Hannon, J.; Bennett, M.; Smyth, B. Recommending twitter users to follow using content and collaborative filtering approaches. In Proceedings of the Fourth ACM Conference on Recommender Systems, Barcelona, Spain, 26 September 2010; pp. 199–206. [Google Scholar]
- Garcia Esparza, S.; O’Mahony, M.P.; Smyth, B. Catstream: Categorising tweets for user profiling and stream filtering. In Proceedings of the 2013 International Conference on Intelligent User Interfaces, Santa Monica, CA, USA, 19 March 2013; pp. 25–36. [Google Scholar]
- Ali, M. The Morphological Gender Assignment for English Personal Names. Ph.D. Thesis, California State University, Northridge, CA, USA, 2019. [Google Scholar]
- Slepian, M.L.; Galinsky, A.D. The voiced pronunciation of initial phonemes predicts the gender of names. J. Personal. Soc. Psychol. 2016, 110, 509. [Google Scholar] [CrossRef]
- Babu, A. Data World: Gender-by-Names Dataset. 2018. Available online: https://data.world/arunbabu/gender-by-names (accessed on 21 January 2021).
- Kantrowitz, M. CMU: Name Gender Dataset. 1995. Available online: http://www.cs.cmu.edu/afs/cs/project/ai-repository/ai/areas/nlp/corpora/names/ (accessed on 21 January 2021).
- Howard, D. Data World: Gender-by-Name Dataset. 2017. Available online: https://data.world/howarder/gender-by-name (accessed on 21 January 2021).
- Rish, I. An empirical study of the naive Bayes classifier. In Proceedings of the IJCAI Workshop on Empirical Methods in Artificial Intelligence, Seattle, WA, USA, 4 August 2001. [Google Scholar]
- Quinlan, J.R. Induction of decision trees. Mach. Learn. 1986, 1, 81–106. [Google Scholar] [CrossRef] [Green Version]
- Breiman, L. Random forests. Mach. Learn. 2001, 45, 5–32. [Google Scholar] [CrossRef] [Green Version]
- Cochran, W.G. Sampling Techniques, 2nd ed.; John Wiley & Sons: Hoboken, NJ, USA, 1963. [Google Scholar]
- Centers for Disease Control and Prevention. Symptoms of COVID-19. 2021. Available online: https://www.cdc.gov/coronavirus/2019-ncov/symptoms-testing/symptoms.html (accessed on 9 November 2012).
- Jiang, B.; Miao, Y. The Evolution of Natural Cities from the Perspective of Location-Based Social Media. Prof. Geogr. 2015, 67, 295–306. [Google Scholar] [CrossRef] [Green Version]
- Jiang, B. Head/tail breaks: A new classification scheme for data with a heavy-tailed distribution. Prof. Geogr. 2013, 65, 482–494. [Google Scholar] [CrossRef]
- Jiang, B.; Ma, D.; Yin, J.; Sandberg, M. Spatial Distribution of City Tweets and Their Densities. Geogr. Anal. 2016, 48, 337–351. [Google Scholar] [CrossRef] [Green Version]
Figure 1.
Weekly distribution of 2,014,792,896 tweets from 1 February 2020 to 31 March 2021.

Figure 2.
Distribution of languages with more than 10K tweets. The y-axis indicates the number of tweets in log scale.
Figure 2.
Distribution of languages with more than 10K tweets. The y-axis indicates the number of tweets in log scale.

Figure 3.
Country and city distributions across months sorted by overall tweet proportions.

Figure 4.
Geotagged tweets worldwide normalized by country’s population (per 100,000 persons). Tweets geotagged using user location, user profile description, and GPS-coordinates are included.
Figure 4.
Geotagged tweets worldwide normalized by country’s population (per 100,000 persons). Tweets geotagged using user location, user profile description, and GPS-coordinates are included.

Figure 5.
Weekly distribution representing public sentiment based on worldwide tweets in all languages.
Figure 5.
Weekly distribution representing public sentiment based on worldwide tweets in all languages.

Figure 6.
Worldwide sentiment based on normalized classifier scores of the representative sentiment in each country. Numbers on countries are z-scores computed using the representative sentiment tweets normalized by total tweets from all countries.
Figure 6.
Worldwide sentiment based on normalized classifier scores of the representative sentiment in each country. Numbers on countries are z-scores computed using the representative sentiment tweets normalized by total tweets from all countries.

Figure 7.
Weekly distribution of sentiment labels for the top-six countries.

Figure 8.
Monthly distributions of positive and negative sentiment tweets for the top-six countries.
Figure 8.
Monthly distributions of positive and negative sentiment tweets for the top-six countries.

Figure 9.
Sentiment across US counties. Tweets geotagged using user location, user profile description, and GPS-coordinates are included after normalizing by the total number of tweets from each county.
Figure 9.
Sentiment across US counties. Tweets geotagged using user location, user profile description, and GPS-coordinates are included after normalizing by the total number of tweets from each county.

Figure 10.
Weekly distribution of sentiment labels of tweets in top-five languages excluding English (i.e., Spanish, Portuguese, French, Indonesian, and Arabic).
Figure 10.
Weekly distribution of sentiment labels of tweets in top-five languages excluding English (i.e., Spanish, Portuguese, French, Indonesian, and Arabic).

Figure 11.
Percentage of female users for countries meeting representative sampling criteria (confidence interval = 95%; margin of error ). Gray color indicates the countries excluded due to under representation ().
Figure 11.
Percentage of female users for countries meeting representative sampling criteria (confidence interval = 95%; margin of error ). Gray color indicates the countries excluded due to under representation ().

Figure 12.
Weekly trends of important issues related to personal and social lives of users linked to COVID-19.
Figure 12.
Weekly trends of important issues related to personal and social lives of users linked to COVID-19.

Figure 13.
Global digital divide estimated through the type of device used for tweeting. Representative device type penetration (percentage) is shown on top of each country.
Figure 13.
Global digital divide estimated through the type of device used for tweeting. Representative device type penetration (percentage) is shown on top of each country.

Figure 14.
The evolution of natural cities in the mainland US during the pandemic. Note that the red patches correspond to the natural cities while the gray lines indicate the triangulated irregular network of geo-referenced tweets.
Figure 14.
The evolution of natural cities in the mainland US during the pandemic. Note that the red patches correspond to the natural cities while the gray lines indicate the triangulated irregular network of geo-referenced tweets.

Table 1.
A sample of keywords/hashtags used for data collection.
| Argentina Coronavirus, Armenia Coronavirus, Australia Coronavirus, Austria Coronavirus, Azerbaijan Coronavirus, Bahamas Coronavirus, Bahrain Coronavirus, Bangladesh Coronavirus, Barbados Coronavirus, Belarus Coronavirus, Belgium Coronavirus, Belize Coronavirus, Benin Coronavirus, Bhutan Coronavirus, Bolivia Coronavirus, Bosnia Herzegovina Coronavirus, Botswana Coronavirus, Brazil Coronavirus, Brunei Coronavirus, Bulgaria Coronavirus, Burkina Coronavirus, Burundi Coronavirus, Cambodia Coronavirus, Cameroon Coronavirus, Canada Coronavirus, COVID-19, Congo COVID-19, Congo COVID-19, Costa Rica COVID-19, Croatia COVID-19, Cuba COVID-19, Cyprus COVID-19, Czech Republic COVID-19, Denmark COVID-19, Djibouti COVID-19, Dominica COVID-19, Dominican Republic COVID-19, East Timor COVID-19, Ecuador COVID-19, Egypt COVID-19, El Salvador COVID-19, Equatorial Guinea COVID-19, Eritrea COVID-19, Estonia COVID-19, Ethiopia COVID-19, Fiji COVID-19, Finland COVID-19, France COVID-19, Gabon COVID-19, Gambia COVID-19, Georgia COVID-19, Germany COVID-19, Ghana COVID-19, #socialdistancing us, #socialdistancing usa, #socialdistancing Alabama, #socialdistancing Alaska, #socialdistancing Arizona, #socialdistancing Arkansas, #socialdistancing California, #socialdistancing Colorado, #socialdistancing Connecticut, #socialdistancing Delaware, #socialdistancing Florida, #socialdistancing Georgia, #socialdistancing Hawaii, #socialdistancing Idaho, #socialdistancing Illinois, #socialdistancing Indiana, #socialdistancing Iowa, #socialdistancing Kansas, #socialdistancing Kentucky, #socialdistancing Louisiana, #socialdistancing Maine, #socialdistancing Maryland, #socialdistancing Massachusetts, #socialdistancing Michigan, económica, quédate en casa Colombia, respiradores Colombia, tapabocas Colombia, UCI disponibles, recuperados covid19 Colombia, muertes Colombia, Nariño Coronavirus, Nariño Covid19, #coronavirus, #Corona, #COVID19, #WuhanCoronavirus, #ncoV2019, #coronavirus, Italia, lombardia, #covid19italia, #COVID19Pandemic, Covid, #CoronavirusAustralia, #pandemic, Covid-19 USA |
Table 2.
Performance of the NER models as reported on the spaCy website [36].
Table 2.
Performance of the NER models as reported on the spaCy website [36].
| Model | Precision | Recall | F1-Score |
|---|---|---|---|
| English | 0.85 | 0.85 | 0.85 |
| Spanish | 0.90 | 0.90 | 0.90 |
| Portuguese | 0.90 | 0.90 | 0.90 |
| French | 0.84 | 0.84 | 0.84 |
| Italian | 0.86 | 0.85 | 0.86 |
| Multilingual | 0.84 | 0.83 | 0.84 |
Table 3.
Named-entities extraction results for the top four languages. ‘U’ denotes “unique occurrences” and ‘A’ denotes “all occurrences” of entities.
Table 3.
Named-entities extraction results for the top four languages. ‘U’ denotes “unique occurrences” and ‘A’ denotes “all occurrences” of entities.
| Language | Person | Organization | Location | Miscellaneous |
|---|---|---|---|---|
| English (U) | 14,796,271 | 18,887,285 | 2,930,148 | 10,798,850 |
| English (A) | 409,794,668 | 611,669,779 | 483,680,780 | 1,690,122,455 |
| Spanish (U) | 3,777,463 | 2,230,017 | 3,265,204 | 14,968,547 |
| Spanish (A) | 98,561,105 | 69,581,078 | 169,903,131 | 301,512,355 |
| Portuguese (U) | 1,439,192 | 932,504 | 1,006,396 | 2,845,321 |
| Portuguese (A) | 27,577,759 | 15,896,880 | 40,090,891 | 52,440,351 |
| French (U) | 1,374,884 | 804,336 | 719,896 | 3,894,968 |
| French (A) | 23,595,420 | 17,256,551 | 34,064,424 | 63,010,283 |
| Total (U) | 55,721,884 | 33,324,173 | 10,336,415 | 40,767,983 |
| Total (A) | 803,832,752 | 814,205,050 | 805,175,906 | 2,320,195,791 |
Table 4.
Geotagging method evaluation for the place attribute (in terms of precision). Numbers in parenthesis represent the sample size.
Table 4.
Geotagging method evaluation for the place attribute (in terms of precision). Numbers in parenthesis represent the sample size.
| Country | State | County | City | |
|---|---|---|---|---|
| Place | 0.988 (7990) | 0.967 (7871) | 0.771 (7394) | 0.967 (4903) |
Table 5.
Geotagging method evaluation for the user location attribute.
| Metric | Country | State | County | City |
|---|---|---|---|---|
| Precision | 0.868 | 0.839 | 0.648 | 0.802 |
| Recall | 1.000 | 0.968 | 0.922 | 0.656 |
| F1-score | 0.929 | 0.899 | 0.761 | 0.722 |
Table 6.
Geotagging method evaluation for tweet text and user profile description attributes.
| Metric | Country | State | County | City |
|---|---|---|---|---|
| Precision | 0.888 | 0.781 | 0.056 | 0.430 |
| Recall | 0.732 | 0.640 | 0.462 | 0.184 |
| F1-score | 0.803 | 0.703 | 0.100 | 0.258 |
Table 7.
Geotagging results for all five attributes with unique occurrences, geotagging yield, and resolved countries, states, counties, and cities.
Table 7.
Geotagging results for all five attributes with unique occurrences, geotagging yield, and resolved countries, states, counties, and cities.
| Attribute | Occurrences | Geotagged (Yield) | Countries | States | Counties | Cities |
|---|---|---|---|---|---|---|
| Coordinates | 2,799,378 | 2,799,378 (100%) | 211 | 1912 | 9037 | 8079 |
| Place | 51,411,442 | 51,061,938 (99%) | 215 | 1906 | 13,343 | 9932 |
| User location | 1,284,668,011 | 1,132,595,646 (88%) | 218 | 2511 | 24,806 | 20,648 |
| User prof. desc. | 1,642,116,879 | 180,508,901 (11%) | 218 | 2485 | 18,588 | 14,600 |
| Tweet text | 2,014,792,896 | 515,802,081 (26%) | 218 | 2513 | 24,235 | 20,549 |
Table 8.
Gender classification results (model = Random Forest).
| Metric | Female | Male | Macro Avg. | Weighted Avg. |
|---|---|---|---|---|
| Precision | 0.872 | 0.816 | 0.844 | 0.850 |
| Recall | 0.885 | 0.797 | 0.841 | 0.851 |
| F1-score | 0.878 | 0.807 | 0.843 | 0.850 |
Table 9.
Term groups of four topics for trend analysis.
| Main Topics | Sub-Topics |
|---|---|
| COVID-19 symptoms | Fever, cough, shortness of breath, headache, loss of taste and smell |
| COVID deaths mentions | Parents, siblings, grandparents, relatives, and close connections |
| Food shortages | Food availability, food access, food adequacy, and food acceptability |
| Anxiety and depression | Anger, sleepless, fearful, upset, restless, and anxious |
| Mask usage and importance | Mask violation, masks are important, wear masks, masks save lives |
| Willingness to take vaccine | Reactions, harmfulness, got vaccine, covid jab taken |
Publisher’s Note: MDPI stays neutral with regard to jurisdictional claims in published maps and institutional affiliations. |
© 2022 by the authors. Licensee MDPI, Basel, Switzerland. This article is an open access article distributed under the terms and conditions of the Creative Commons Attribution (CC BY) license (https://creativecommons.org/licenses/by/4.0/).
Share and Cite
MDPI and ACS Style
Imran, M.; Qazi, U.; Ofli, F. TBCOV: Two Billion Multilingual COVID-19 Tweets with Sentiment, Entity, Geo, and Gender Labels. Data 2022, 7, 8. https://doi.org/10.3390/data7010008
AMA Style
Imran M, Qazi U, Ofli F. TBCOV: Two Billion Multilingual COVID-19 Tweets with Sentiment, Entity, Geo, and Gender Labels. Data. 2022; 7(1):8. https://doi.org/10.3390/data7010008
Chicago/Turabian StyleImran, Muhammad, Umair Qazi, and Ferda Ofli. 2022. "TBCOV: Two Billion Multilingual COVID-19 Tweets with Sentiment, Entity, Geo, and Gender Labels" Data 7, no. 1: 8. https://doi.org/10.3390/data7010008