Data Descriptor

Large-Scale Dataset for the Analysis of Outdoor-to-Indoor Propagation for 5G Mid-Band Operational Networks

1
Department of Information Engineering, Electronics and Telecommunications, Sapienza University of Rome, 00184 Rome, Italy
2
Ericsson Research, Radio Systems and Standards, Ericsson AB, 164 40 Kista, Sweden
3
Department of Engineering Complex Software Systems, Simula Research Laboratory, 0164 Oslo, Norway
4
Department of Computer Science, Karlstad University, 651 88 Karlstad, Sweden
5
Department of Informatics, University of Oslo, 0373 Oslo, Norway
6
Rohde & Schwarz, 00156 Rome, Italy
*
Author to whom correspondence should be addressed.
Submission received: 5 February 2022 / Revised: 3 March 2022 / Accepted: 9 March 2022 / Published: 15 March 2022

Abstract

:
Understanding radio propagation characteristics and developing channel models is fundamental to building and operating wireless communication systems. Among others uses, channel characterization and modeling can be used for coverage and performance analysis and prediction. Within this context, this paper describes a comprehensive dataset of channel measurements performed to analyze outdoor-to-indoor propagation characteristics in the mid-band spectrum identified for the operation of 5th Generation (5G) cellular systems. Previous efforts to analyze outdoor-to-indoor propagation characteristics in this band were made by using measurements collected on dedicated, mostly single-link setups. Hence, measurements performed on deployed and operational 5G networks still lack in the literature. To fill this gap, this paper presents a dataset of measurements performed over commercial 5G networks. In particular, the dataset includes measurements of channel power delay profiles from two 5G networks in Band n78, i.e., 3.3–3.8 GHz. Such measurements were collected at multiple locations in a large office building in the city of Rome, Italy by using the Rohde & Schwarz (R&S) TSMA6 network scanner during several weeks in 2020 and 2021. A primary goal of the dataset is to provide an opportunity for researchers to investigate a large set of 5G channel measurements, aiming at analyzing the corresponding propagation characteristics toward the definition and refinement of empirical channel propagation models.
Dataset: 10.5281/zenodo.6322868
Dataset License: Creative Commons Attribution 4.0 International

1. Introduction

The New Radio (NR) standard of 5G cellular networks promises to connect a massive number of heterogeneous devices, accommodate high data rates, and support low latency applications [1,2]. The 5G NR supports a large variety of use cases with diverse requirements and in particular enhanced Mobile Broadband (eMBB), Ultra-Reliable Low Latency Communications (URLLC), and massive Machine-Type Communications (mMTC) [3]. In addition to traditional broadband services, novel applications that can benefit from 5G include logistics and shipping, smart grids, smart factories, agriculture, extended reality, healthcare, mission-critical services, and autonomous driving [4,5,6].
The 5G NR operates over two different frequency ranges. Frequency Range 1 (FR1) includes sub-6 GHz frequency bands, which are also referred to as low-band (up to 2 GHz) and mid-band (up to 6 GHz) [7]. Frequency Range 2 (FR2) includes the millimeter-wave (mm-wave) band, from 24.25 to 52.6 GHz.
A significant number of commercial 5G networks are currently under deployment in the mid-band, and in particular in the 3.3–3.8 GHz spectrum portion, called Band n78, which offers a good trade-off between coverage and capacity [8,9,10,11,12]. Therefore, understanding signal propagation characteristics in the mid-band is particularly important especially in the urban scenario where most of the 5G deployments are taking place.
Various 5G use cases target indoor scenarios, such as smart buildings with different types of sensors, factory automation, object tracking in a factory, remote control of robotic machinery, and automated vehicles in logistic applications, to mention a few [13,14,15,16]. Currently, these scenarios are likely to be addressed via outdoor deployments of 5G Base Stations (BS). This emphasizes the need for understanding propagation characteristics in outdoor-to-indoor scenarios.
There are a few works performing outdoor-to-indoor measurements to characterize the communication channel at around 3.5 GHz in different scenarios such as urban microcell [17], urban macrocell [18], non-line of sight [19], residential buildings [20], multiple-input-multiple-output (MIMO) in an office building [21], dense urban [22], and university buildings [23,24].
A few investigations of 5G channel characterization in the mid-band were also carried out for channel modeling purposes in both outdoor-to-indoor [22,25,26,27] and indoor-to-indoor [4,8,9,10,28,29,30,31,32,33,34,35,36] scenarios. However, none of the above investigations makes use of measurements collected in the wild, i.e., on commercially deployed 5G networks. Furthermore, there is currently no available dataset including measurements collected on commercial 5G networks. Additionally, the datasets used in the aforementioned studies are not publicly available.
This paper fills the above gap by making open-source a dataset of outdoor-to-indoor measurements collected on commercial 5G mid-band systems deployed in an urban scenario. To the best of our knowledge, this is the first work to provide a large-scale dataset of measurements performed over commercially deployed 5G mid-band networks in an outdoor-to-indoor scenario.
The paper is organized as follows. The experimental setup and data collection methodology are discussed in Section 2. Section 3 describes the collected data, including an explanation of the dataset structure, while Section 4 draws conclusions and identifies future work made possible by the use of the provided dataset.

2. Measurement System and Data Collection Methodology

This section provides information regarding the adopted measurement system and the methodology for data collection as well as a description of the locations where measurements were performed.

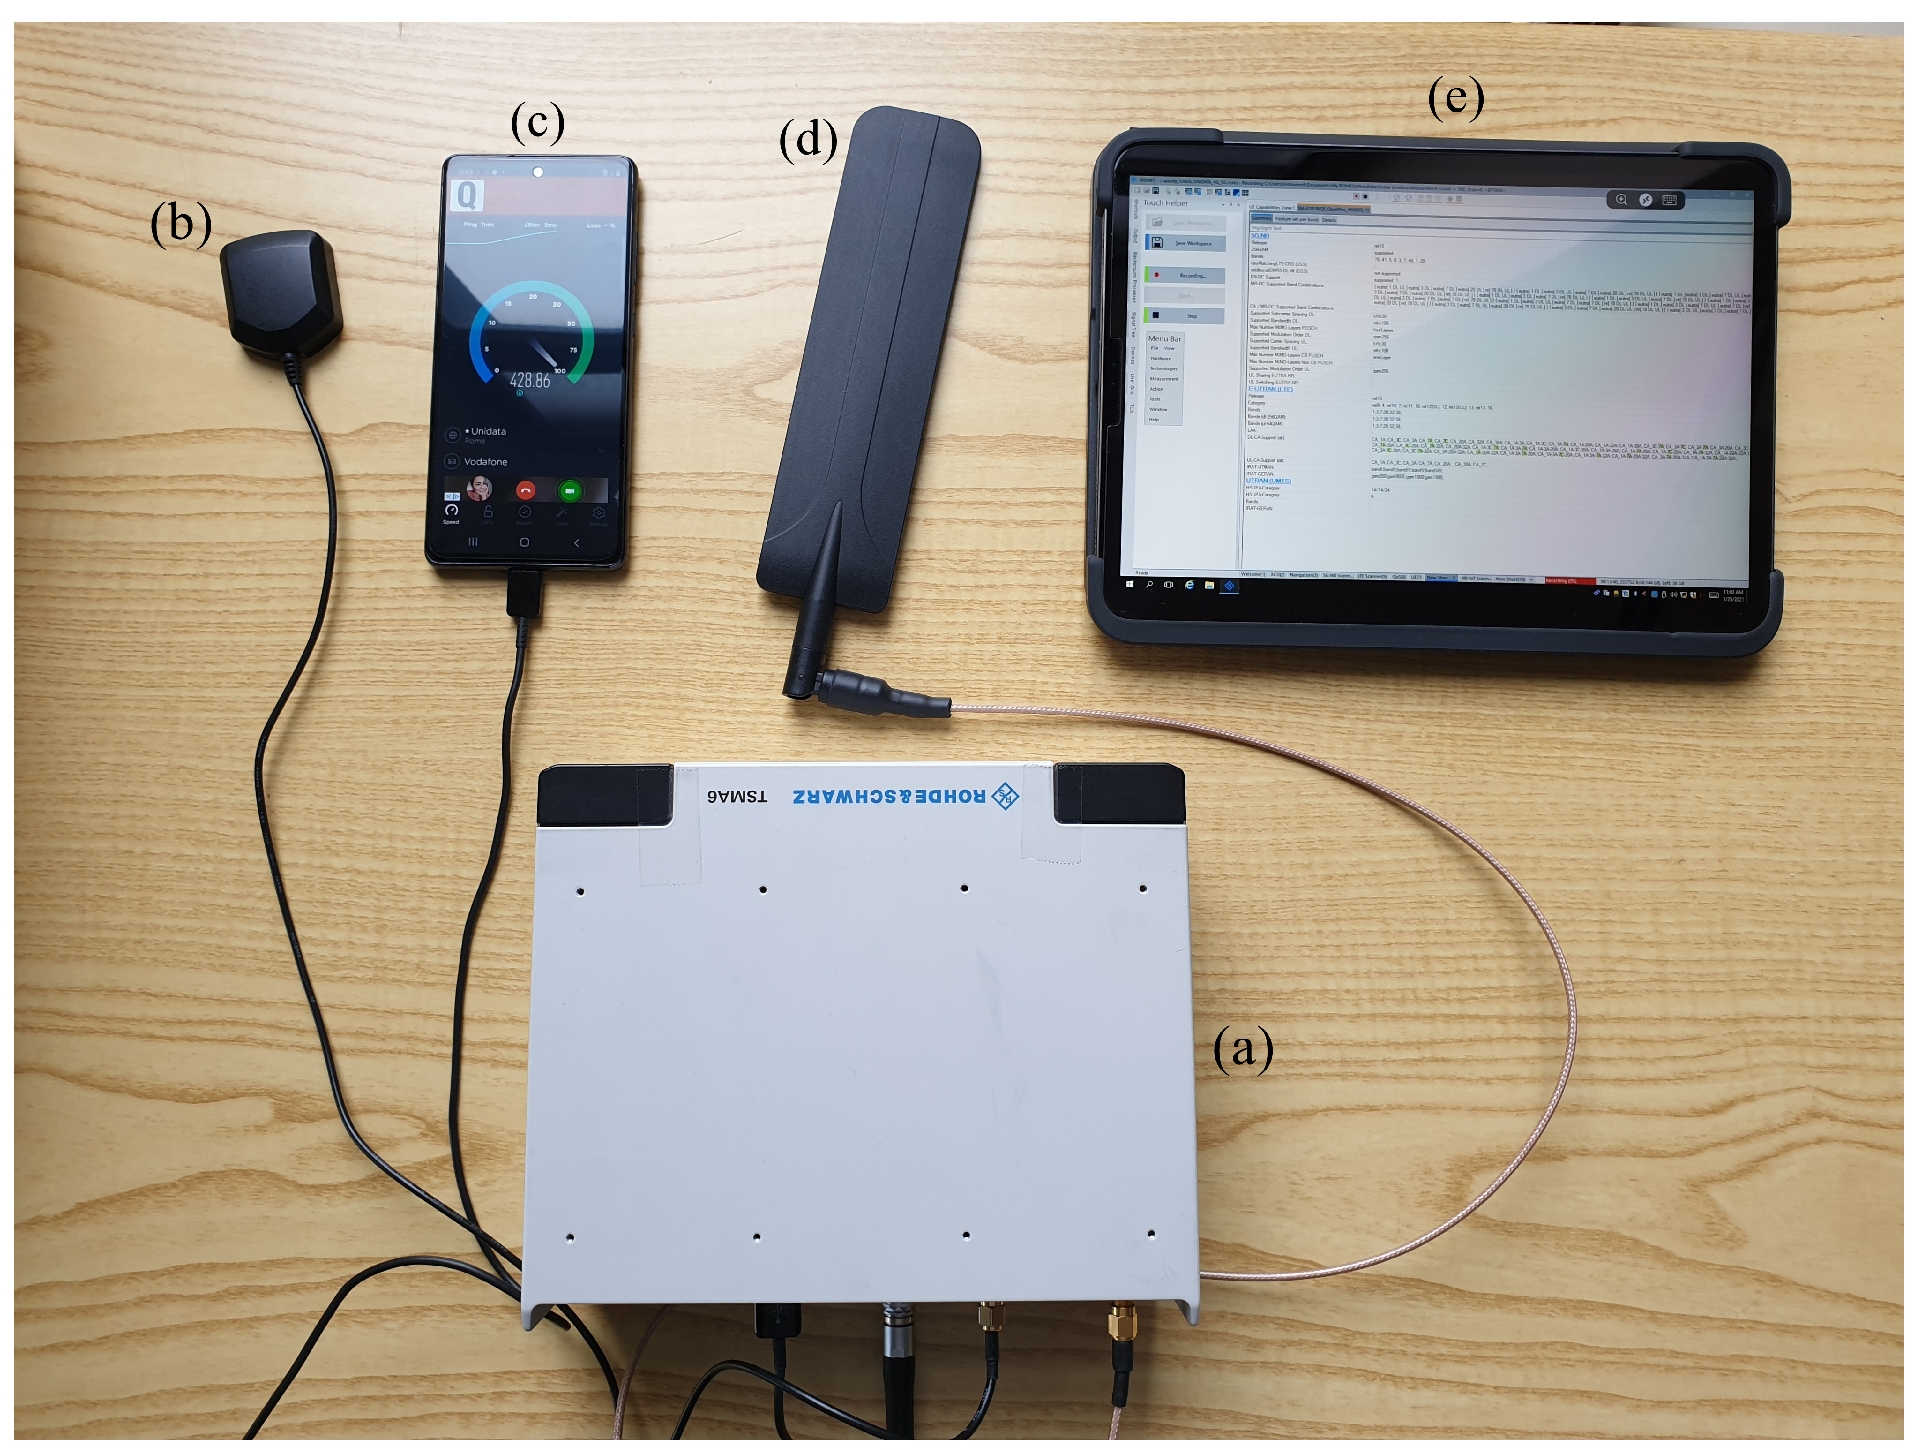
2.1. Measurement System

The measurement campaigns were performed using the Rohde & Schwarz (R&S) TSMA6 toolkit [37], which includes the R&S TSMA6 network scanner and a laptop running the ROMES software. ROMES was used for visual inspection of the ongoing measurement campaigns and for exporting the corresponding collected data. The R&S TSMA6 network scanner is an integrated system comprising a Radio Frequency (RF) omnidirectional antenna and a Global Positioning System (GPS) antenna. The RF antenna was used for passive monitoring of downlink control signals transmitted by 3rd Generation Partnership Project (3GPP) access technologies, i.e., 5G NR, Long-Term Evolution (LTE), and Narrowband Internet of Things (NB-IoT), working at different licensed frequency bands. The GPS antenna was used to identify the geographic information of the measurements being collected. As shown in Figure 1, the used measurement system included an R&S TSMA6 toolkit, RF and GPS antennas, ROMES software, and also a 5G-capable device running performance measurements. Note that performance-related data collected via the 5G-capable device are not included in the present dataset, which instead contains coverage-related data collected via TSMA6 scanner, as further detailed in Section 3.
More in detail, the R&S TSMA6 scanner was used to measure 5G NR Synchronization Signal Blocks (SSBs) transmitted by the 5G BSs active in the area covered by the measurement campaigns. In particular, TSMA6 was used to (a) provide Automatic Channel Detection (ACD), in order to detect downlink signals by cellular systems operating at different channel frequencies, and (b) decode Physical Cell Identifiers (PCIs)/SSBs information, ultimately providing quantitative coverage measures for all the detected signals. TSMA6 was also used to provide estimated positions of the detected 5G BSs, which were identified by the corresponding PCIs.

2.2. Data Collection Methodology

A set of measurement campaigns was performed at the second floor of the Department of Information Engineering, Electronics, and Telecommunications (DIET) of Sapienza University of Rome, Italy. All measurement campaigns were conducted statically in different indoor locations. Figure 2 shows the map of the second floor of the DIET Department, along with the eight specific locations where measurement campaigns were performed. Location 1 and Location 4 are laboratories, Location 8 is a study hall, and all other locations are offices. Green, blue, and red lines represent walls, windows, and doors, respectively.
In total, 18 measurement campaigns were performed at the eight locations. During these measurement campaigns, multiple 5G PCIs from four different operators were detected in Band n78. However, the present dataset focuses on the two 5G operators resulting in the highest number of data samples. We refer to these two operators as Op1 and Op2, operating at carrier frequencies of 3649 MHz and 3725 MHz, respectively. Figure 3 shows the PCIs detected at each location for both operators and included in the dataset.
Once the measurement campaigns were executed, the corresponding data were exported using ROMES [38]. It was observed that both operators deploy a 5G NR system with a sub-carrier spacing of 30 kHz. It was also noticed that Op1 adopts a beam-based transmission scheme where each PCI transmits multiple SSBs (up to eight SSBs). On the contrary, each PCI of Op2 transmitted a single SSB. A detailed discussion on beam-based transmission is given in [39]. However, it can be observed that due to different propagation conditions, a different number of SSBs was detected at different locations, with a maximum of eight SSBs detected. Moreover, the received power of each SSB also differs due to the direction of the beams associated to the SSBs. Figure 4 shows an example of the received power measured at Location 1 for all the SSBs of the same PCI of Op1 and the unique PCI/SSB pair of Op2. For Op1, the average and median of the received power of SSB 6 are higher than all the other SSBs of Op1. For this reason, SSB 6 is defined as the strongest SSB of Op1 at Location 1.
Following the above definition of strongest SSB, the dataset in this paper provides data on the strongest SSBs for each PCI of Op1 at each location, i.e., those SSBs having the highest average Reference Signal Received Power (RSRP) at each measurement location. For Op2, since each PCI transmits only one SSB, the dataset provides data on a single PCI/SSB pair.
Ultimately, the dataset is composed of so-called channel power delay profiles (PDPs). Each PDP represents a channel measurement at a given location and time. Since the PDP is measured over SSB signals, each PDP sample in the dataset corresponds to a detected PCI/SSB pair. Moreover, since the propagation channel is composed by several propagation paths, each PDP includes its paths with their absolute propagation time in microseconds ( μ s) and received power (in dBm) values. The total PDP in-band power level is also provided in the dataset (in dBm). From the PDP, various propagation parameters can be calculated, such as the number of paths, inter-arrival times, root mean square delay spread, and mean excess delay. A comprehensive discussion and analysis on such propagation parameters, also including a correlation analysis for them, can be found in [39].
Table 1 summarizes the performed measurement campaigns for each operator and location in terms of number of measurement campaigns and corresponding number of collected PDPs for each location. Note that the dataset includes measurements of PCIs/SSBs for which the number of PDPs, collected at a given location during an entire measurement campaign, was more than 50. We set this threshold empirically after observing that a reasonable estimate of the propagation parameters mentioned above can be obtained when the number of PDPs is at least equal to 50. Therefore, PCI/SSB pairs with less than 50 PDPs are not provided in the dataset.

3. Data Description

Figure 5 shows the file structure of the folders containing the dataset. The main folder “Dataset” includes three subfolders: “(1) Figures for DIET Map with locations”, “(2) Detected Operators”, and “(3) Additional Information”.
Subfolder “(1) Figures for DIET Map with locations” contains the Joint Photographic Experts Group (JPEG) files of the Google Map of the DIET Department and the locations where all measurements were performed. Subfolder “(2) Detected Operators” has two further subfolders named “Op1_PDP” and “Op2_PDP” for PDP measurement data of Op1 and Op2, respectively. Furthermore, subfolder “Op1_PDP” contains five separate sub-folders for each measurement location named as “Location_1”, “Location_2”, “Location_3”, “Location_4”, and “Location_5”. Each of these folders has comma-separated values (CSV) files of PDP measurements. Similarly, subfolder “Op2_PDP” contains seven separate sub-folders for each measurement location named as “Location_1”, “Location_2”, “Location_4”, “Location_5”, “Location_6”, “Location_7”, and “Location_8”. Each of these folders has CSV files of the measurement data for each conducted campaign and detected PCI. The structure of CSV file format explained in Figure 6. Finally, subfolder “(3) Additional Information” contains a text file with the information of transmit power and estimated position of each PCI. Additionally, the estimated Signal to Interference plus Noise Ratio (SINR) values for each PCI and measurement location are also given in the text file. A description of the variables in the CSV files in subfolders “Op1_PDP” and “Op2_PDP” is given below:
  • ID represents the sequence number of PDPs.
  • Longitude and Latitude shows the GPS coordinates of the current measurement location.
  • PCI refers to the Physical Cell Identity. PCI is a cell identifier used to distinguish the different cells of a 5G system. Cellular BSs are most often referred to in terms of their PCI for their identification.
  • SSB index (SSB Idx) stands for the synchronization signal block (SSB) index to indicate which SSB was transmitted from the BS. The 5G NR cells may transmit up to 8 SSBs.
  • SS-Ref-MHz represents the synchronization signal’s reference frequency in MHz, which is also called the channel frequency.
  • Power-dBm represents the power of each multipath component in a PDP, which is calculated based on the synchronization signals (SS). Its unit is dBm.
  • P-total-dBm is the average in-band power corresponding to a PDP in dBm, which is calculated based on the SS.
  • Delay-us denotes the absolute propagation time of each multipath component within a PDP. The Delay-us column contains the absolute propagation time values in microseconds ( μ s). The relative delay of each multipath component corresponding to a PDP sample can be calculated by considering the delay of the first multipath component equal to zero.
As a reference example, an excerpt of the dataset containing two collected PDPs is shown in Table 2. Note that each PDP is identified by a unique ID. It follows that in the excerpt reported in Table 2, the first PDP (ID = 1) is composed by three paths, while the second PDP (ID = 2) is composed by seven paths.

4. Conclusions

This paper presents a dataset of measurements performed over commercial 5G networks operating in the mid-band. To the best of our knowledge, this is the first 5G dataset collected and made available for operational 5G mid-band networks. The provided dataset contains power delay profiles, and related information, for measurements in outdoor-to-indoor scenarios, such as the number of paths, delay and power of each path, and total received power. Measurements originate from multiple campaigns and were collected at different locations. The dataset can serve as the basis for multiple analyses, including comprehensive channel propagation characterizations and modeling, based on real-deployed networks and standardized signals. The presented dataset can also be used for coverage evaluation of 5G communication systems deployed in urban environments. In general, measurements performed in dedicated laboratory setups do not always ensure a proper characterization and modeling of the channel propagation experienced in real-world scenarios. On the other hand, measurements performed on real deployed networks, such as the ones made available in the present dataset, can lead to channel characterization and modeling that better represent real-world scenarios. As a future work, we plan to adopt the same measurement setup to perform novel measurement campaigns on 5G networks, focusing on outdoor scenarios under mobility (e.g., user walking and driving). Hence, we also plan to make the corresponding dataset available in order to trigger further analysis of the propagation characteristics of mid-band 5G systems.

Author Contributions

Software, U.A.; conceptualization, methodology and data curation, U.A., G.C.; writing—original draft preparation, review and editing, U.A., G.C., L.D.N. and M.-G.D.B.; review and editing, K.K., M.R., Ö.A., M.N. and A.B.; project supervision, M.-G.D.B. All authors have read and agreed to the published version of the manuscript.

Funding

This work was supported by Sapienza University of Rome within research projects with Grants No. RP11816433F508D1, RP11916B88A04AE6 and RP120172B6D62941.

Institutional Review Board Statement

Not applicable.

Informed Consent Statement

Not applicable.

Data Availability Statement

The dataset described in this study is openly available at Zenodo website: https://doi.org/10.5281/zenodo.6322868 (accessed on 5 February 2022).

Conflicts of Interest

The authors declare no conflict of interest.

References

  1. 3GPP TR 21.915; Digital Cellular Telecommunications System (Phase 2+) (GSM). Universal Mobile Telecommunications System (UMTS); LTE; 5G, Version 15.0.0 Release 15. 3GPP: Sophia Antipolis Cedex, France, 2019.
  2. 3GPP TR 21.916; Digital Cellular Telecommunications System (Phase 2+) (GSM). Universal Mobile Telecommunications System (UMTS); LTE; 5G, Version 16.0.1 Release 16. 3GPP: Sophia Antipolis Cedex, France, 2021.
  3. Zhang, S. An overview of network slicing for 5G. IEEE Wirel. Commun. 2019, 26, 111–117. [Google Scholar] [CrossRef]
  4. Adegoke, E.I.; Kampert, E.; Higgins, M.D. Channel Modeling and Over-the-Air Signal Quality at 3.5 GHz for 5G New Radio. IEEE Access 2021, 9, 11183–11193. [Google Scholar] [CrossRef]
  5. Cero, E.; Baraković Husić, J.; Baraković, S. IoT’s tiny steps towards 5G: Telco’s perspective. Symmetry 2017, 9, 213. [Google Scholar] [CrossRef]
  6. Chiu, W.; Su, C.; Fan, C.Y.; Chen, C.M.; Yeh, K.H. Authentication with what you see and remember in the internet of things. Symmetry 2018, 10, 537. [Google Scholar] [CrossRef] [Green Version]
  7. Li, S.D.; Liu, Y.J.; Lin, L.K.; Sheng, Z.; Sun, X.C.; Chen, Z.P.; Zhang, X.J. Channel measurements and modeling at 6 GHz in the tunnel environments for 5G wireless systems. Int. J. Antennas Propag. 2017, 2017, 1513038. [Google Scholar] [CrossRef] [Green Version]
  8. Huang, F.; Tian, L.; Zheng, Y.; Zhang, J. Propagation characteristics of indoor radio channel from 3.5 GHz to 28 GHz. In Proceedings of the 2016 IEEE 84th Vehicular Technology Conference (VTC-Fall), Montreal, QC, Canada, 18–21 September 2016; pp. 1–5. [Google Scholar]
  9. Adegoke, E.I.; Edwards, R.; Whittow, W.G.; Bindel, A. Characterizing the indoor industrial channel at 3.5 GHz for 5G. In Proceedings of the 2019 Wireless Days (WD), Manchester, UK, 24–26 April 2019; pp. 1–4. [Google Scholar]
  10. Kaya, A.O.; Calin, D.; Viswanathan, H. 28 GHz and 3.5 GHz wireless channels: Fading, delay and angular dispersion. In Proceedings of the 2016 IEEE Global Communications Conference (GLOBECOM), Washington, DC, USA, 4–8 December 2016; pp. 1–7. [Google Scholar]
  11. Halvarsson, B.; Simonsson, A.; Elgcrona, A.; Chana, R.; Machado, P.; Asplund, H. 5G NR testbed 3.5 GHz coverage results. In Proceedings of the 2018 IEEE 87th Vehicular Technology Conference (VTC Spring), Porto, Portugal, 3–6 June 2018; pp. 1–5. [Google Scholar]
  12. He, D.; Ai, B.; Guan, K.; Wang, L.; Zhong, Z.; Kürner, T. The design and applications of high-performance ray-tracing simulation platform for 5G and beyond wireless communications: A tutorial. IEEE Commun. Surv. Tutor. 2018, 21, 10–27. [Google Scholar] [CrossRef]
  13. Siriwardhana, Y.; Gür, G.; Ylianttila, M.; Liyanage, M. The role of 5G for digital healthcare against COVID-19 pandemic: Opportunities and challenges. ICT Express 2020, 7, 244–252. [Google Scholar] [CrossRef]
  14. El Boudani, B.; Kanaris, L.; Kokkinis, A.; Kyriacou, M.; Chrysoulas, C.; Stavrou, S.; Dagiuklas, T. Implementing deep learning techniques in 5G IoT networks for 3D indoor positioning: DELTA (DeEp Learning-Based Co-operaTive Architecture). Sensors 2020, 20, 5495. [Google Scholar] [CrossRef]
  15. Attaran, M. The impact of 5G on the evolution of intelligent automation and industry digitization. J. Ambient. Intell. Humaniz. Comput. 2021, 1–17. [Google Scholar] [CrossRef]
  16. Karrenbauer, M.; Ludwig, S.; Buhr, H.; Klessig, H.; Bernardy, A.; Wu, H.; Pallasch, C.; Fellan, A.; Hoffmann, N.; Seelmann, V.; et al. Future industrial networking: From use cases to wireless technologies to a flexible system architecture. At-Automatisierungstechnik 2019, 67, 526–544. [Google Scholar] [CrossRef] [Green Version]
  17. Jiang, Y.; Pan, S.; Zhang, R.; Li, C.; Zhai, D. Space-Time Domain Power Spectrum Measurement and Modeling of UMi O2I Channel at 3.5 GHz. In Proceedings of the 2019 11th International Conference on Wireless Communications and Signal Processing (WCSP), Xi’an, China, 23–25 October 2019; pp. 1–6. [Google Scholar]
  18. Zhang, R.; Xu, H.; Du, X.; Zhou, D.; Guizani, M. Dual-polarized spatial–temporal propagation measurement and modeling in UMa O2I scenario at 3.5 GHz. IEEE Access 2019, 7, 122988–123001. [Google Scholar] [CrossRef]
  19. Diago-Mosquera, M.E.; Aragón-Zavala, A.; Rodriguez, M. Testing a 5g communication system: Kriging-aided o2i path loss modeling based on 3.5 ghz measurement analysis. Sensors 2021, 21, 6716. [Google Scholar] [CrossRef]
  20. Valcarce, A.; Zhang, J. Empirical indoor-to-outdoor propagation model for residential areas at 0.9–3.5 GHz. IEEE Antennas Wirel. Propag. Lett. 2010, 9, 682–685. [Google Scholar] [CrossRef]
  21. Du, D.; Zhang, J.; Pan, C.; Zhang, C. Cluster characteristics of wideband 3D MIMO channels in outdoor-to-indoor scenario at 3.5 GHz. In Proceedings of the 2014 IEEE 79th Vehicular Technology Conference (VTC Spring), Seoul, Korea, 18–21 May 2014; pp. 1–6. [Google Scholar]
  22. Li, C.; Zhao, Z.; Tian, L.; Zhang, J.; Zheng, Z.; Kang, J.; Guan, H.; Zheng, Y.; Sun, H. Height gain modeling of outdoor-to-indoor path loss in metropolitan small cell based on measurements at 3.5 GHz. In Proceedings of the 2014 International Symposium on Wireless Personal Multimedia Communications (WPMC), Sydney, Australia, 7–10 September 2014; pp. 552–556. [Google Scholar]
  23. Sheikh, M.U.; Mela, L.; Saba, N.; Ruttik, K.; Jäntti, R. Outdoor to Indoor Path Loss Measurement at 1.8 GHz, 3.5 GHz, 6.5 GHz, and 26 GHz Commercial Frequency Bands. In Proceedings of the 2021 24th International Symposium on Wireless Personal Multimedia Communications (WPMC), Okayama, Japan, 14–16 December 2021; pp. 1–5. [Google Scholar]
  24. Samad, M.A.; Diba, F.D.; Kim, Y.J.; Choi, D.Y. Results of Large-Scale Propagation Models in Campus Corridor at 3.7 and 28 GHz. Sensors 2021, 21, 7747. [Google Scholar] [CrossRef]
  25. Zhong, Z.; Zhao, J.; Li, C. Outdoor-to-Indoor channel measurement and coverage analysis for 5G Typical Spectrums. Int. J. Antennas Propag. 2019, 2019, 3981678. [Google Scholar] [CrossRef] [Green Version]
  26. Diakhate, C.A.; Conrat, J.M.; Cousin, J.C.; Sibille, A. Millimeter-wave outdoor-to-indoor channel measurements at 3, 10, 17 and 60 GHz. In Proceedings of the 2017 11th European Conference on Antennas and Propagation (EUCAP), Paris, France, 19–24 March 2017; pp. 1798–1802. [Google Scholar]
  27. Yu, Y.; Zhang, J.; Shafi, M.; Zhang, M.; Mirza, J. Statistical characteristics of measured 3-dimensional MIMO channel for outdoor-to-indoor scenario in China and New Zealand. Chin. J. Eng. 2016, 2016, 27. [Google Scholar] [CrossRef] [Green Version]
  28. Debaenst, W.; Feys, A.; Cuiñas, I.; Garcia Sanchez, M.; Verhaevert, J. RMS delay spread vs. coherence bandwidth from 5G indoor radio channel measurements at 3.5 GHz band. Sensors 2020, 20, 750. [Google Scholar] [CrossRef] [Green Version]
  29. Pérez, J.R.; Torres, R.P.; Rubio, L.; Basterrechea, J.; Domingo, M.; Peñarrocha, V.M.R.; Reig, J. Empirical characterization of the indoor radio channel for array antenna systems in the 3 to 4 GHz frequency band. IEEE Access 2019, 7, 94725–94736. [Google Scholar] [CrossRef]
  30. Zeng, J.; Zhang, J. Propagation characteristics in indoor office scenario at 3.5 GHz. In Proceedings of the 2013 8th International Conference on Communications and Networking in China (CHINACOM), Guilin, China, 14–16 August 2013; pp. 332–336. [Google Scholar]
  31. Adegoke, E.I.; Kampert, E.; Higgins, M.D. Empirical indoor path loss models at 3.5 GHz for 5G communications network planning. In Proceedings of the 2020 International Conference on UK-China Emerging Technologies (UCET), Glasgow, UK, 20–21 August 2020; pp. 1–4. [Google Scholar]
  32. He, R.; Yang, M.; Xiong, L.; Dong, H.; Guan, K.; He, D.; Zhang, B.; Fei, D.; Ai, B.; Zhong, Z.; et al. Channel measurements and modeling for 5G communication systems at 3.5 GHz band. In Proceedings of the 2016 URSI Asia-Pacific Radio Science Conference (URSI AP-RASC), Seoul, Korea, 21–25 August 2016; pp. 1855–1858. [Google Scholar]
  33. Lai, Z.; Bessis, N.; de la Roche, G.; Kuonen, P.; Zhang, J.; Clapworthy, G. The characterisation of human body influence on indoor 3.5 GHz path loss measurement. In Proceedings of the 2010 IEEE Wireless Communication and Networking Conference Workshops, Sydney, Australia, 18 April 2010; pp. 1–6. [Google Scholar]
  34. Jiang, T.; Zhang, J.; Shafi, M.; Tian, L.; Tang, P. The comparative study of sv model between 3.5 and 28 GHz in indoor and outdoor scenarios. IEEE Trans. Veh. Technol. 2019, 69, 2351–2364. [Google Scholar] [CrossRef]
  35. Al-Saman, A.; Mohamed, M.; Cheffena, M. Radio propagation measurements in the indoor stairwell environment at 3.5 and 28 GHz for 5G wireless networks. Int. J. Antennas Propag. 2020, 2020, 6634050. [Google Scholar] [CrossRef]
  36. Al-Samman, A.M.; Al-Hadhrami, T.; Daho, A.; Hindia, M.; Azmi, M.H.; Dimyati, K.; Alazab, M. Comparative study of indoor propagation model below and above 6 GHz for 5G wireless networks. Electronics 2019, 8, 44. [Google Scholar] [CrossRef] [Green Version]
  37. Rohde&Schwarz. R&S®TSMx Drive and Walk Test Scanner. Available online: https://www.rohde-schwarz.com/products/test-and-measurement/network-data-collection/rs-tsmx-drive-and-walk-test-scanner_63493-526400.html (accessed on 4 February 2022).
  38. Rohde&Schwarz. R&S®Romes4 Drive Test Software. Available online: https://www.rohde-schwarz.com/products/test-and-measurement/network-data-collection/rs-romes4-drive-test-software_63493-8650.html (accessed on 4 February 2022).
  39. Ali, U.; Caso, G.; De Nardis, L.; Kousias, K.; Rajiullah, M.; Alay, Ö.; Brunstrom, A.; Di Benedetto, M.G. Data-driven analysis of outdoor-to-indoor propagation for 5G mid band operational networks. Sensors, 2022; Submitted and currently under review. [Google Scholar]
Figure 1. The system adopted for the measurement campaign: R&S TSMA6 toolkit (a), GPS antenna (b), 5G-capable device (c), RF antenna (d), and ROMES software (e). Note that ROMES runs in the laptop within the TSMA6 toolkit (a); the tablet in (e) was only used as a remote monitor, connected via Wireless Local Area Network (WLAN) to TSMA6.
Data 07 00034 g001
Figure 2. Measurement locations at DIET Department. Green, blue, and red lines represent walls, windows, and doors, respectively.
Data 07 00034 g002
Figure 3. PCIs included in the dataset at each location for Op1 (a) and Op2 (b).
Data 07 00034 g003
Figure 4. Boxplots of the received power of the detected SSBs for Op1 (multiple SSBs) and Op2 (single SSB) at Location 1. The boxplots named Op1_SSBn (n = 0 , 1 , 2 , , 7 ) show the Received Power of the SSBs of the Op1, while Op2_SSB shows the Received Power of transmitted SSB of operator 2. For Op1, SSB 6 is considered the strongest SSB, with the average and median of the Received Power higher than all other SSBs of Op1. In contrast, Op2 operates on a single SSB.
Data 07 00034 g004
Figure 5. File structure of the dataset folders.
Data 07 00034 g005
Figure 6. Format of the CSV files included in the dataset.
Data 07 00034 g006
Table 1. Summary of performed measurement campaigns. N/A stands for Not Available and indicates that no PCI/SSB pair was detected in that location for that operator.
Location IDNo. of CampaignsPCINo. of PDPs for Op1No. of PDPs for Op2
181744143N/A
81753809N/A
81764156N/A
81772675N/A
81794329N/A
83022133N/A
8261N/A4194
8362N/A2441
21148175N/A
1174230N/A
1176241N/A
1179244N/A
1282236N/A
1156N/A239
1261N/A259
1362N/A246
31176115N/A
4117689N/A
1282189N/A
1261N/A191
51261N/A294
64261N/A3158
71261N/A291
81176259N/A
1282267N/A
1261N/A266
Table 2. An example of two PDPs collected at the same location and frequency carrier of 3649 MHz. The first PDP (ID = 1) includes three paths, while the second PDP (ID = 2) includes seven paths.
IDTimestampLongitudeLatitudePCISSB_IdxPower__dBmP_total__dBmDelay__us
112:00:25 AM12.49439841.8932741740−119.55−112.378494.06
112:00:25 AM12.49439841.8932741740−136.19−112.378494.33
112:00:25 AM12.49439841.8932741740−126.01−112.378495.49
212:00:33 AM12.4944241.8932481740−118.83−114.268494.03
212:00:33 AM12.4944241.8932481740−125.31−114.268494.08
212:00:33 AM12.4944241.8932481740−134.59−114.268494.33
212:00:33 AM12.4944241.8932481740−133.27−114.268494.37
212:00:33 AM12.4944241.8932481740−144.66−114.268494.51
212:00:33 AM12.4944241.8932481740−139.42−114.268495.03
212:00:33 AM12.4944241.8932481740−127.19−114.268495.47
Publisher’s Note: MDPI stays neutral with regard to jurisdictional claims in published maps and institutional affiliations.

