Data Descriptor

Deep Learning Dataset for Estimating Burned Areas: Case Study, Indonesia

1
National Research and Innovation Agency (BRIN), Jakarta 13220, Indonesia
2
Remote Sensing and Geographic Information Science Research Group, Faculty of Earth Sciences and Technology, Institut Teknologi Bandung, Bandung 40132, Indonesia
3
Department of Physics, University of Indonesia, Depok City 16424, Indonesia
*
Author to whom correspondence should be addressed.
Submission received: 11 October 2021 / Revised: 10 January 2022 / Accepted: 11 January 2022 / Published: 9 June 2022
(This article belongs to the Section Spatial Data Science and Digital Earth)

Abstract

:
Wildland fire is one of the most causes of deforestation, and it has an important impact on atmospheric emissions, notably CO2. It occurs almost every year in Indonesia, especially during the dry season. Therefore, it is necessary to identify the burned areas from remote sensing images to establish the zoning map of areas prone to wildland fires. Many methods have been developed for mapping burned areas from low-resolution to medium-resolution satellite images. One of the popular approaches for mapping tasks is a deep learning approach using U-Net architecture. However, it needs a large amount of representative training data to develop the model. In this paper, we present a new dataset of burned areas in Indonesia for training or evaluating the U-Net model. We delineate burned areas manually by visual interpretation on Landsat-8 satellite images. The dataset is collected from some regions in Indonesia, and it consists of 227 images with a size of 512 × 512 pixels. It contains one or more burned scars or only the background and its labeled masks. The dataset can be used to train and evaluate the deep learning model for image detection, segmentation, and classification tasks related to burned area mapping.
Dataset License: CC-BY.

1. Summary

Indonesia is a tropical country that has a large forest area. Based on the data from the Indonesian Ministry of Environment and Forestry, the total Indonesian forest area in 2019 was 94.1 million ha, or around 50.1% of the total land area [1]. Globally, Indonesia ranks third in the world as a country with the largest tropical rainforest area after Brazil and the Republic of the Congo [2,3]. However, the rate of wildland fires in Indonesia is relatively high. For example, over the past five years, Indonesia’s most significant forest fire rate was in 2019, which was 1.64 million ha [4]. Several provinces affected by fires in that year were Riau, Jambi, South Sumatra, Central Kalimantan, South Kalimantan, West Kalimantan, East Nusa Tenggara, and Papua.
Data of burned areas are important for monitoring forest conditions and calculating the annual rate of deforestation [5,6,7]. However, due to the large forest area in Indonesia, the monitoring of forest condition will certainly be difficult if based only on field survey results. The use of satellite remote sensing images for burned landscape mapping facilitates the calculation of fire-affected areas and assessment of burn severity [8]. In addition, satellites’ temporal resolution capability enables them to carry out periodic monitoring to see the development of deforestation.
Generally, the mapping technique in the remote sensing field can be conducted by two approaches: visual interpretation and digital classification. The visual interpretation of satellite images is precise and accurate but can be costly and time intensive [9,10]. On the contrary, modern digital classification, such as machine learning and deep learning, is relatively fast, cost effective, and able to give a result with high accuracy [11,12]. However, it requires a large number of representative training data of burned areas to build the model. In this paper, we contribute to fulfilling this need by presenting a dataset of the burned area particularly designated for building convolutional neural network (CNN) models, such as U-Net and ResUNet. We delineate burned areas manually based on visual interpretation of Landsat-8 satellite images. Our dataset is collected from some regions in Indonesia with a total of 227 images subsets and their annotation images. This dataset can be used to develop and evaluate the performance of deep learning models for burned area detection, segmentation, and classification tasks.

2. Data Description

The dataset presented in this paper consists of three categories: image subsets, burned area masks, and quicklooks. The specification of the dataset is generally summarized in Table 1 and will be described in detail in each subsection.

2.1. Image Subset

The image subsets are derived from Landsat-8 scenes taken between the years 2019 and 2021. Each image has a size of 512 × 512 pixels and consists of eight multispectral bands, as shown in Table 2. The sequence of band names, from band 1 to band 7 of the image subset, is the same as the sequence of band names of the Landsat-8 scene [13], except for band 8 of the image subset, which is band 9 (cirrus band) in the original Landsat-8 scene. The image subsets are saved in GeoTIFF file format with the latitude–longitude coordinate system and World Geodetic System (WGS) 1984 as the datum. The spatial resolution of image subsets is 0.00025 degrees, and the pixel values are stored in a 16-bit unsigned integer with a range of values from 0 to 65,535.
The total of the dataset is 227 images containing the object of burned area surrounded by various ecological diversity backgrounds, such as forest, shrub, grassland, waterbody, bare land, settlement, cloud, and cloud shadow. In some cases, there are some image subsets with the burned areas covered by smoke due to the fire that was still active. Some image subsets also overlap each other to cover the area of the burned scar, which is too large.

2.2. Burned Area Mask

The burned area mask is a binary annotation image that consists of two classes: burned area as the foreground and non-burned area as the background. These binary images are saved in an 8-bit unsigned integer, where the burned and non-burned areas are indicated by the pixel value of 255 and 0, respectively. The burned area masks in this dataset contain only burned scars and are not contaminated with thick clouds, shadows, and vegetation. Samples of them are depicted in Figure 1.
The information on image distribution based on the coverage percentage of burned areas is described in Table 3 below. Among 227 images, 206 images contain burned areas, whereas 21 images contain only the background. In addition, the highest number of images in this dataset is dominated by images with a coverage percentage of the burned area between 0 and 10 percent.

2.3. Quicklook

Our dataset also provides quicklook image as a quick preview of the image subset. It offers a fast and full-size preview of the image subset without opening the file using any GIS software. The quicklook images can also be used to train and evaluate the model as a substitute for image subsets. The image size is 512 × 512 pixels, same as the size of the image subset and the annotation image. It consists of three bands as a false color composite image, with a combination of band 7 (SWIR-2), band 5 (NIR), and band 4 (red). We stretched the quicklook images contrast to enhance image visualizations using the parameters described in Table 4. The quicklook images are stored in GeoTIFF file format with an 8-bit unsigned integer.

3. Methods

Generally, there are three stages for generating the dataset of burned areas: (1) scene selection, (2) pre-processing, and (3) burned area masking.

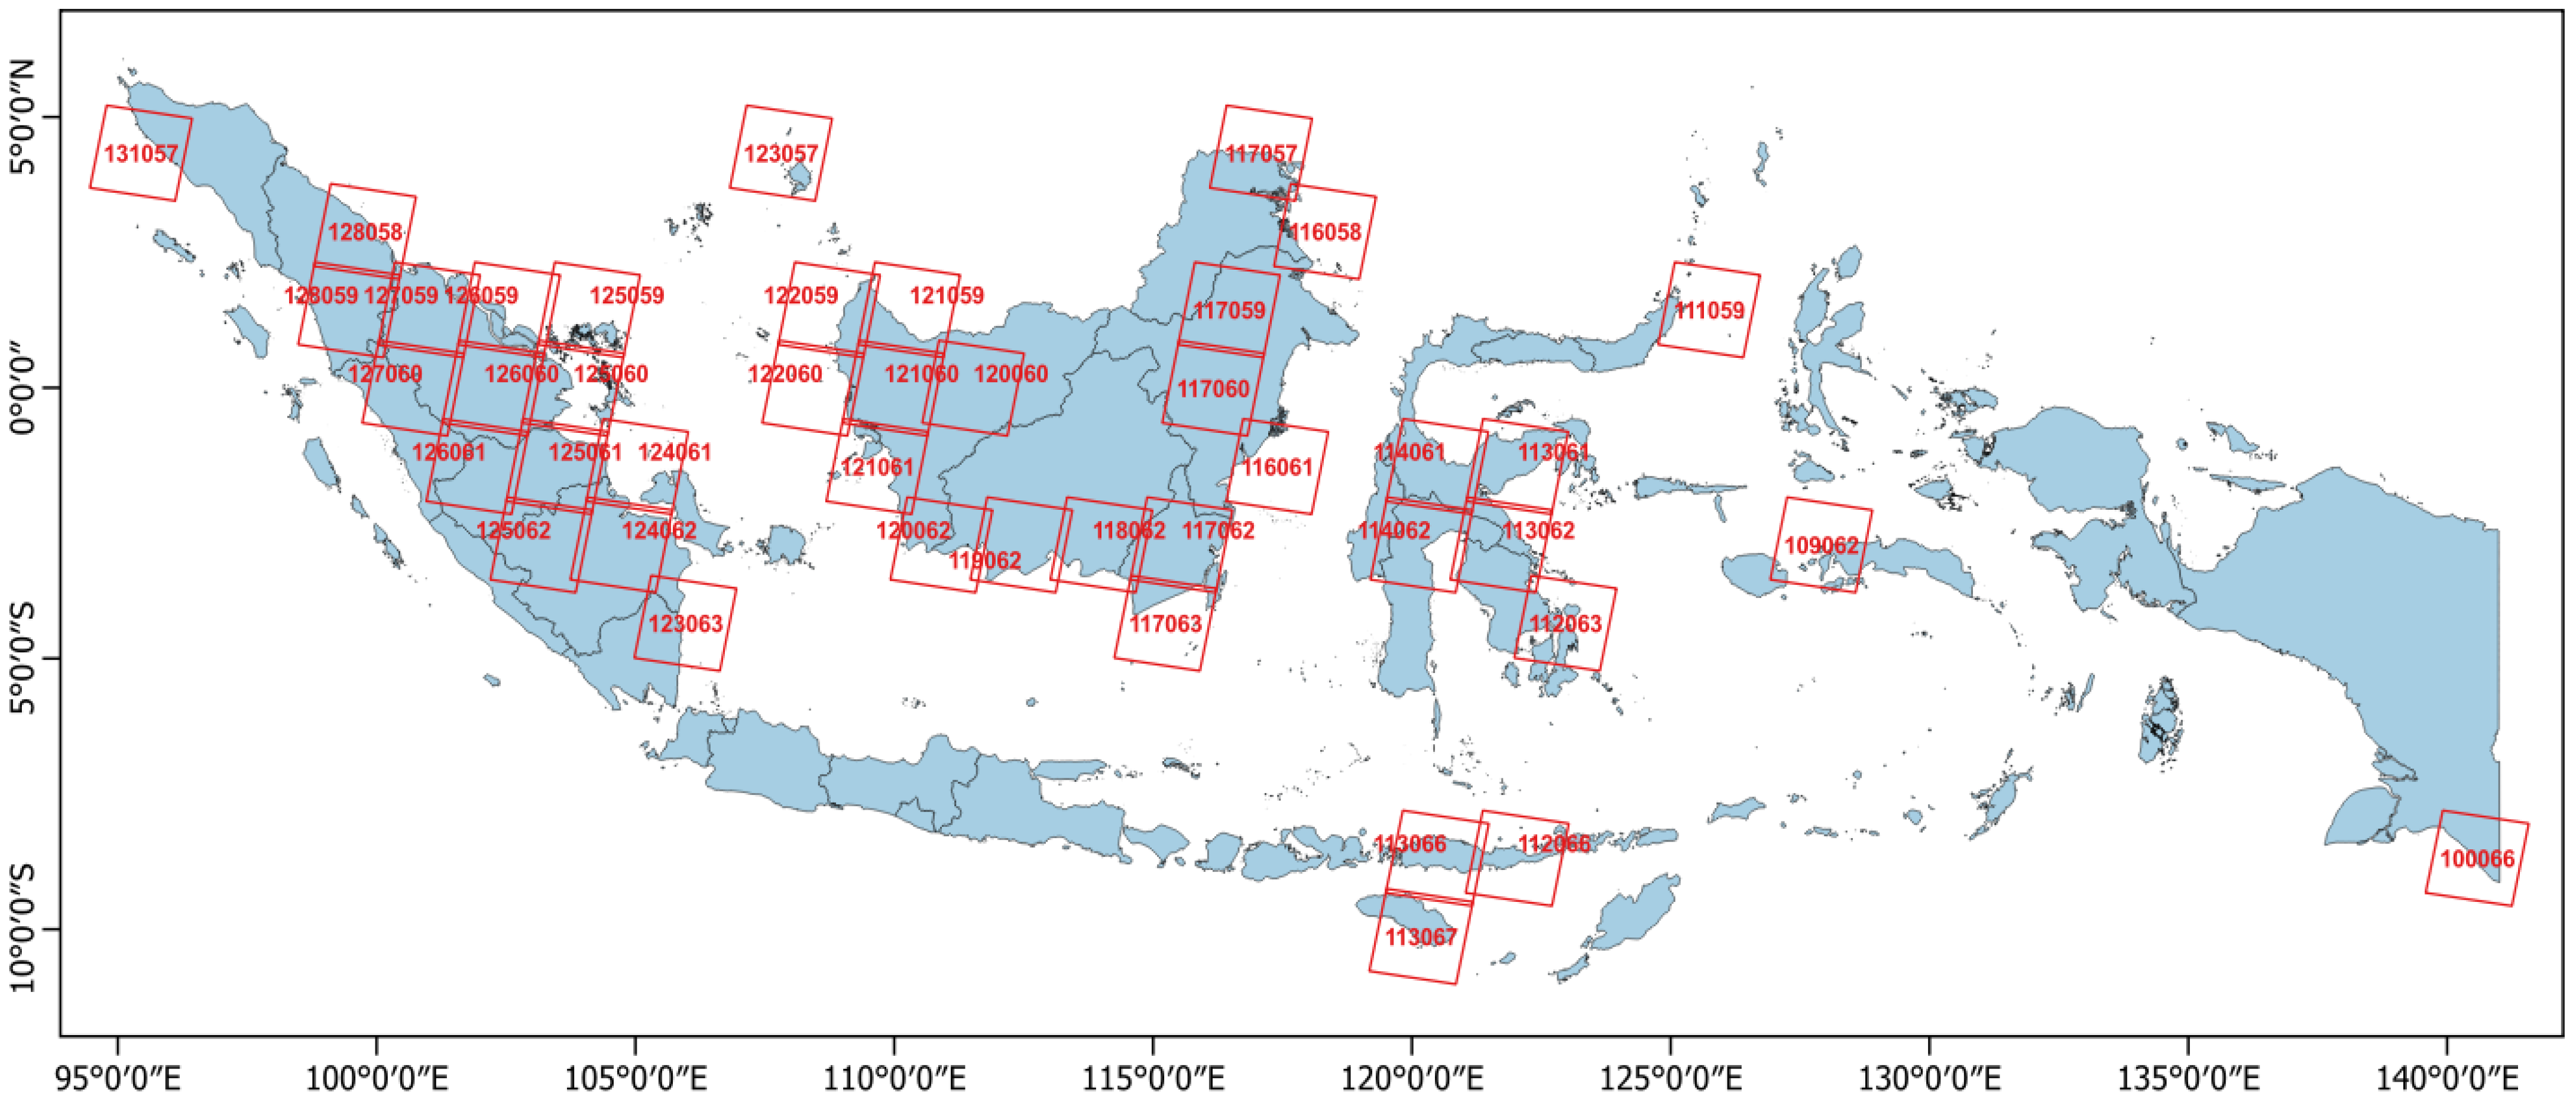
3.1. Scene Selection

The burned area dataset was created from Landsat-8 OLI multispectral images with a spatial resolution of 30 m. We used Landsat-8 scenes from L1GT and L1TP product levels that have been geometrically corrected [14]. The process of scene selection was carried out by manually checking one-by-one from many Landsat-8 scenes taken between the years 2019 and 2021. As a result, 81 Landsat-8 scenes were selected from several regions in Indonesia with various ecological diversity backgrounds, such as forest, shrub, grassland, waterbody, bare land, and settlement. The selected scenes are spread over 43 path row locations, as depicted in Figure 2.

3.2. Pre-Processing

First, we conducted radiometric correction for the selected Landsat-8 scenes before being used for creating the dataset. We performed top of atmosphere (ToA) correction to eliminate the undesirable atmospheric effects [15]. It was carried out by converting the digital number of images to the ToA planetary reflectance using the conversion parameters available in the metadata. The ToA reflectance values were then rescaled to a 16-bit unsigned integer with a range of values from 0 to 65,535.
Then, the selected Landsat-8 scenes were re-projected from the Universal Transverse Mercator (UTM) map projection to geographic projection with the datum of WGS 1984 (EPSG:4326). The result was Landsat-8 scenes in the latitude–longitude coordinate system, with the size of the pixels being resampled to 0.00025 degrees using cubic convolution interpolation method. Finally, the pre-processing stage was performed using the GDAL library in python.

3.3. Burned Area Masking

3.3.1. Delineation Process

The burned area polygons were delineated by four GIS experts using Quantum GIS software. The delineation process was carried out manually on Landsat-8 images using SWIR-2, NIR, and red band combinations. This combination was determined because it looked the most visually clear and suitable for mapping burned area and burn severity [16]. The visualization of Landsat-8 images was enhanced using contrast stretching to assist delineators during the visual interpretation process. The stretching parameters used for enhancing the images were the same as the stretching parameters for creating the quicklook of the images (see Table 4). Through this Landsat-8 image visualization, the burned areas appear dark red or maroon, while active fire areas appear orange. The other ground features similar to burned areas, such as settlements and bare land, appear pink to normal red. The delineation process was performed carefully by drawing polygons along the border of burned areas without including the background, such as bare land, vegetation, thick cloud, and shadow into the burned area polygons (Figure 3). In some cases, there were some burned areas covered by smoke and small clouds, and it is, in fact, possible for the delineators to estimate the boundaries of burned areas under the clouds; however, the delineators did not draw the polygon over the clouds. The final product of the delineation process was a vector file containing a set of burned area polygons for each scene image.

3.3.2. Cropping and Rasterizing

The dataset was cropped from the Landsat-8 scenes based on the burned area polygon location determined in the previous stage. Before cropping the Landsat-8 scenes, we prepared a square polygon used as a frame for cropping. The frame polygon was fitted for cropping the dataset in 512 × 512 pixels size. The frame polygon can be duplicated and moved to some burned area locations that will be cropped (Figure 4). The following process is cropping and rasterizing, which is implemented using the GDAL library in python. The process of cropping generates image subsets and quicklooks, whereas the process of rasterizing generates burned area masks. The distribution of the dataset based on the location of the path row is described in Table 5.

3.4. Validation

The quality of delineation results depends on the delineators’ prior knowledge. However, the ground features related to the burned area are not always easy to identify in the satellite images. For instance, some features, such as settlements and bare lands, look similar to the burned area. Therefore, other GIS experts were involved as validators to evaluate delineation results to resolve this issue.
We used the agreement between delineators and validators to assess the consistency of delineation results. Three validators were involved in inspecting delineation results and correcting the delineators’ polygon vector. The validation process was carried out together with the delineators to agree on the boundaries of the burned area. The polygons identified by the delineators and validators were then evaluated and assessed quantitatively using evaluation metrics, such as precision, recall, F1-score, and accuracy [17] (see Table 6). The evaluation metric was calculated based on the number of pixels categorized as true positive (TP), true negative (TN), false positive (FP), and false negative (FN), as described in Table 7.
The number of images associated with the mentioned metrics is summarized and simplified in Table 8. The percentage of overlap between the polygons identified by the validators and delineators is also calculated. The polygons identified by the delineators and validators are almost perfectly matched with 218 images. These images have an overlapping area in the range of 90 to 100 percent. Moreover, more than 200 images score above 90 percent for precision, recall, accuracy, and F1-score.

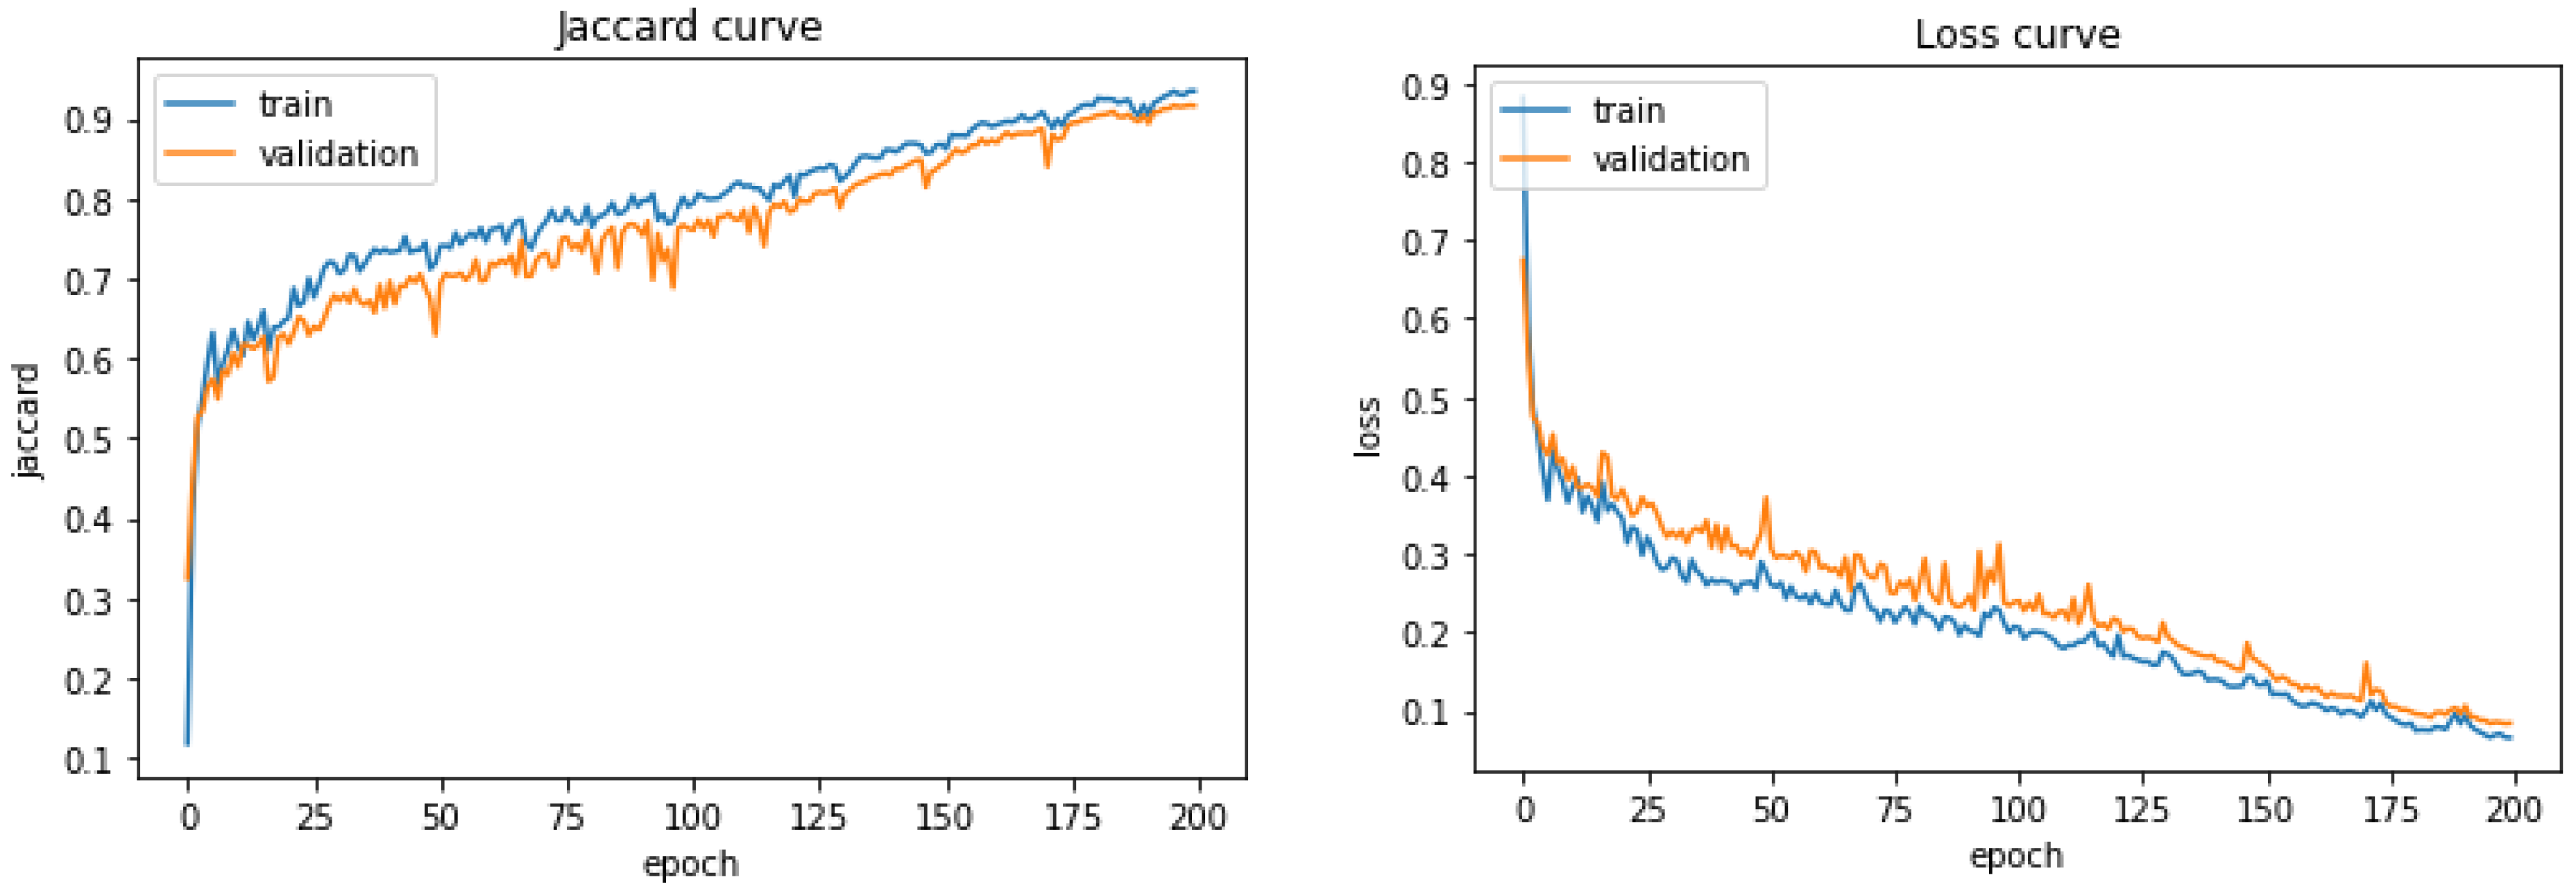
3.5. The Training Performance on the Dataset

To test the performance of the dataset, we have also used our dataset for training the model of U-Net (Figure 5). We trained the model using quicklook images of 512 × 512 pixels containing band SWIR-2, NIR, and red as its color composite. Each image was rotated by 90, 180, and 270 degrees during the data augmentation process before it passed through the model. Eighty percent of the dataset was used for the training and twenty percent for the validation. During network training, we used the Jaccard coefficient as the evaluation metric and Adam as the optimizer, with an initial learning rate of 0.0001.
We trained the model for 200 epochs, where each epoch comprised 46 batches with 5 images per batch, as shown in Figure 6, where the left side is the curve of metric change of the model on the training set and the validation set, and the right side is the curve of loss change. Our dataset can support the training of U-Net model with the loss value and the Jaccard index of 0.07 and 0.93, respectively.

4. User Notes

This dataset could be used for training, testing, and validating a deep learning model, such as U-Net and ResUNet, for the purposes of mapping or monitoring burned areas. The specification of the dataset has been described in the previous section. The additional information for implementing this dataset is the following:
  • The released dataset is organized into three folders: “images”, “masks”, and “quicklooks” folders that contain the image subsets, burned area masks, and quicklook images, respectively.
  • The name of each file in this dataset indicates the image derived from such a scene.
    • File name of image subset: L8_PPPRRR_DDMMYY_XXX.tif
    • File name of burned area mask: L8_PPPRRR_DDMMYY_XXX_mask.tif
    • File name of quicklook: L8_PPPRRR_DDMMYY_XXX_ql.tif
    where:
    L8 = Landsat-8
    PPP = WRS path
    RRR = WRS row
    DDMMYY = Acquisition date (Day, Month, Year)
    XXX = Collection number of dataset (001, 002, …)
    mask = Indicates burned area mask file
    ql = Indicates quicklook file
  • This dataset provides all multispectral bands of Landsat-8 image (see Table 2) to facilitate the users in selecting input bands to obtain the best performance from their model. They may choose one band or more to be used as input for training their model, or a combination of bands using spectral indices, such as Normalized Difference Vegetation Indices (NDVI), Normalized Burn Ratio (NBR), etc.
  • The quicklook can also be used as an alternative substitute for image subset if the users only need bands SWIR-2, NIR, and Red for their model input. However, it should be noted that the quicklook is a false composite image of band combination SWIR-2, NIR, and Red, which has been performed contrast enhancement using the parameters described in Table 4.
  • The dataset can be used by researchers and professionals working on remote sensing or computer vision-based models for image segmentation, object detection, and classification related to the burned area. However, this dataset only supports binary classification for mapping burned areas and non-burned areas. Users are free to utilize the dataset and to contribute by improving the existing dataset or adding new ones.
  • The dataset has been collected from some path row locations in Indonesia. Therefore, it can represent different conditions in some regions of Indonesia.
  • Finally, some of the data may not be accurate and have errors in interpretation due to visual human error.

Author Contributions

Y.P.: conceptualization, methodology, software, data curation, visualization, validation, writing—original draft, writing—review and editing. A.D.S.: funding acquisition, writing—review and editing. K.A.P.: data curation, writing—original draft. Q.A.: data curation, writing—original draft. F.H.R.: validation. I.B.: validation. K.U.: data curation, writing—original draft. D.S.C.: writing—original draft, writing—review and editing. M.T.I.: data curation. S.A.: validation. All authors have read and agreed to the published version of the manuscript.

Funding

This research was funded by the National Research and Innovation Agency (BRIN) and Capacity Building Research Program for ITB Young Scientists by the Institute of Research and Community Service, Institut Teknologi Bandung.

Data Availability Statement

This dataset can be accessed at: Mendeley Data; DOI:10.17632/fs7mtkg2wk.4; direct URL to data: https://data.mendeley.com/datasets/fs7mtkg2wk (accessed on 5 October 2021).

Acknowledgments

The authors are grateful to acknowledge the support from Research Center for Remote Sensing, the National Research and Innovation Agency (BRIN), and Institut Teknologi Bandung (ITB). We also thank the anonymous reviewers whose critical and constructive comments greatly helped us to prepare an improved and clearer version of this paper. All persons and institutes who kindly made their data available for this research are acknowledged.

Conflicts of Interest

The authors declare no conflict of interest.

References

  1. Ministry of Environment and Forestry Republic of Indonesia (KLHK). Siaran Pers: Hutan dan Deforestasi Indonesia Tahun 2019. Available online: http://ppid.menlhk.go.id/siaran_pers/browse/2435 (accessed on 1 October 2021).
  2. FAO; UNEP. The State of the World’s Forests (SOFO); FAO and UNEP: Rome, Italy, 2020. [Google Scholar]
  3. Nurofiq, H.F.; Prihatno, K.B.; Margono, B.A.; Sudijanto, A.; Primiantoro, E.T.; Saputro, T.; Parisy, Y.; Nugroho, D.; Ramdhany, D.; Kumar, K. The State of Indonesia’s Forest 2020; Ministry of Environment and Forestry Republic of Indonesia: Jakarta, Indonesia, 2020.
  4. Ministry of Environment and Forestry Republic of Indonesia (KLHK). SiPongi Karhutla Monitoring Sistem. Available online: http://sipongi.menlhk.go.id/hotspot/luas_kebakaran (accessed on 4 October 2021).
  5. Ongeri, D.; Kenduiywo, B.K. Burnt area detection using medium resolution sentinel 2 and landsat 8 satellites. Int. Arch. Photogramm. Remote Sens. Spat. Inf. Sci. ISPRS Arch. 2020, 43, 131–137. [Google Scholar] [CrossRef]
  6. Thapa, S.; Vishwas, S.C.; Pradhan, S.; Shakya, B.; Sharma, S.; Regmi, S.; Bajracharya, S.; Adhikari, S.; Dangol, G.S. Forest Fire Detection and Monitoring. In Earth Observation Science and Applications for Risk Reduction and Enhanced Resilience in Hindu Kush Himalaya Region; Birendra, B., Rajesh, B.T., Eds.; Springer Nature: Cham, Switzerland, 2021; pp. 147–167. [Google Scholar]
  7. Purnomo, E.P.; Ramdani, R.; Agustiyara; Nurmandi, A.; Trisnawati, D.W.; Fathani, A.T. Bureaucratic inertia in dealing with annual forest fires in Indonesia. Int. J. Wildl. Fire 2021, 30, 733–744. [Google Scholar] [CrossRef]
  8. Roteta, E.; Bastarrika, A.; Padilla, M.; Storm, T.; Chuvieco, E. Development of a Sentinel-2 burned area algorithm: Generation of a small fire database for sub-Saharan Africa. Remote Sens. Environ. 2019, 222, 1–17. [Google Scholar] [CrossRef]
  9. Sari, I.L.; Weston, C.J.; Newnham, G.J.; Volkova, L. Assessing accuracy of land cover change maps derived from automated digital processing and visual interpretation in tropical forests in indonesia. Remote Sens. 2021, 13, 1446. [Google Scholar] [CrossRef]
  10. Tarko, A.; Tsendbazar, N.E.; Bruin, S.; Bregt, A.K. Producing consistent visually interpreted land cover reference data: Learning from feedback. Int. J. Digit. Earth. 2021, 14, 52–70. [Google Scholar] [CrossRef]
  11. Alganci, U.; Soydas, M.; Sertel, E. Comparative research on deep learning approaches for airplane detection from very high-resolution satellite images. Remote Sens. 2020, 12, 458. [Google Scholar] [CrossRef] [Green Version]
  12. Scott, G.J.; Marcum, R.A.; Davis, C.H.; Nivin, T.W. Fusion of Deep Convolutional Neural Networks for Land Cover Classification of High-Resolution Imagery. IEEE Geosci. Remote Sens. Lett. 2017, 14, 1638–1642. [Google Scholar] [CrossRef]
  13. USGS. Landsat Missions: Landsat 8. Available online: https://www.usgs.gov/landsat-missions/landsat-8 (accessed on 11 January 2022).
  14. USGS. Landsat Missions: Landsat Levels of Processing. Available online: https://www.usgs.gov/core-science-systems/nli/landsat/landsat-levels-processing (accessed on 4 October 2021).
  15. USGS. Landsat Missions: Using the USGS Landsat Level-1 Data Product. Available online: https://www.usgs.gov/core-science-systems/nli/landsat/using-usgs-landsat-level-1-data-product (accessed on 4 October 2021).
  16. Hawbaker, T.J.; Vanderhoof, M.K.; Schmidt, G.L.; Beal, Y.J.; Picotte, J.J.; Takacs, J.D.; Falgout, J.T.; Dwyer, J.L. The Landsat Burned Area algorithm and products for the conterminous United States. Remote Sens. Environ. 2020, 244, 111801. [Google Scholar] [CrossRef]
  17. Taner, A.; Oztekin, Y.B.; Duran, H. Performance Analysis of Deep Learning CNN Models for Variety Classification in Hazelnut. Sustainability 2020, 13, 6527. [Google Scholar] [CrossRef]
Figure 1. Sample of three image subsets (a,e,i) in false color composite (R = 7, G = 5, B = 4), image subsets with the burned areas masked in black color (b,f,j), image subsets with background masked in black color (c,g,k), and the burned area masks in binary images (d,h,l).
Data 07 00078 g001
Figure 2. The path row locations of selected Landsat-8 scenes.
Data 07 00078 g002
Figure 3. The polygons (blue line) are delineated along the border of burned areas without including the background, such as bare land, vegetation, thick cloud, and shadow.
Data 07 00078 g003
Figure 4. The sample of placement of frame polygon (red line) on some burned area location (blue line).
Data 07 00078 g004
Figure 5. U-Net model architecture with characteristics of layer and filter sizes used in our model.
Data 07 00078 g005
Figure 6. The loss and the Jaccard index curves of U-Net model training using our dataset.
Data 07 00078 g006
Table 1. Specification of the dataset.
SpecificationImage SubsetsBurned Area MasksQuicklooks
Image size (in pixel)512 × 512512 × 512512 × 512
Number of bands813
Bit depth16 bit
(unsigned integer)
8 bit
(unsigned integer)
8 bit
(unsigned integer)
File formatGeoTIFFGeoTIFFGeoTIFF
GeoreferencedYesYesYes
Total number227227227
Table 2. Bands sequence of image subset.
Band NamesWavelength [µm]Resolution (Degree)
Band 1—Coastal/Aerosol0.43–0.450.00025
Band 2—Blue0.45–0.510.00025
Band 3—Green0.53–0.590.00025
Band 4—Red0.64–0.670.00025
Band 5—Near Infrared (NIR)0.85–0.880.00025
Band 6—Short Wave Infrared (SWIR-1)1.57–1.650.00025
Band 7—Short Wave Infrared (SWIR-2)2.11–2.290.00025
Band 8—Cirrus1.36–1.380.00025
Table 3. Distribution of images according to the coverage percentage of burned areas.
Percentage of Burned Area (%)Number of Images
021
0–10145
10–2036
20–3018
30–402
40–502
50–601
60–702
>700
Total227
Table 4. The stretching parameters for creating the quicklooks.
Composite BandMinimumMaximum
Red (Band 7)350015,000
Green (Band 5)11,00027,000
Blue (Band 4)500018,000
Table 5. The distribution of the dataset according to the path row location.
Path/RowNumber of ImagesPath/RowNumber of Images
100/0661121/0592
109/0621121/06010
111/0591121/06116
112/0632122/05910
112/0662122/0607
113/0612123/0571
113/0621123/0631
113/0661124/0611
113/0671124/0623
114/0611125/0597
114/0621125/0608
116/0584125/06120
116/0621125/0622
117/0571126/0597
117/0591126/0607
117/06011126/0611
117/06230127/05916
117/0636127/0601
118/06217128/0582
119/0623128/0593
120/0603131/0571
120/06210
Table 6. Metrics used to assess the dataset.
Evaluation MetricEquation
Precision (P) P = T P ( T P + F P )
Recall (R) R = T P ( T P + F N )
F1-Score (F1) F 1 = 2 × ( P × R ) ( P + R )
Accuracy (A) A = ( T P + T N ) ( T P + T N + F P + F N )
Table 7. The confusion matrix.
Validator Result
Burned AreaNon-Burned Area
Delineator ResultBurned AreaTrue Positive (TP)False Positive (FP)
Non-Burned AreaFalse Negative (FN)True Negative (TN)
Table 8. The number of images associated with the performance metric.
Percentage (%)OverlapPrecisionRecallF1 ScoreAccuracy
90–100218223206223210
80–907312413
70–8011904
60–7010000
50–6000000
<5000000
Total227227227227227
Publisher’s Note: MDPI stays neutral with regard to jurisdictional claims in published maps and institutional affiliations.

