1. Summary
Harmful algal blooms (HABs) are natural phenomena that occur when conditions are favourable and can make a huge impact on marine biodiversity and human activities [
1,
2]. Some of the species causing these blooms are toxic and can present significant risks to human health through the consumption of seafood contaminated by algal toxins, also known as phycotoxins [
1,
3]. To deal with these threats and protect human health, the management system has established a strategy based on two main actions. The first one aims at monitoring the occurrences of HABs and their level of toxicity. This monitoring system represents the core management and most adopted strategy in many countries in order to mitigate HAB impacts [
4,
5,
6]. The second action, based on monitoring data, consists of the implementation of a range of measures including fisheries and harvest bans in order to avoid the marketing of contaminated products to the end consumers. These bans may lead to economic impacts on activities depending on water quality and marine resources, such as fisheries and aquaculture [
6,
7,
8,
9]. The implementation of these measures is a complex process which is mainly based on monitoring, but also involves other factors in order to minimise the economic impacts. The analysis of this process identifies the assessment of HAB consequences on these activities in order to support decisions and policies to better manage and mitigate impacts. It can also provide valuable insights to identify the management challenges and needs regarding HABs. Therefore, this analysis requires detailed data on trade bans and administrative closures, as well as a full understanding of the whole management system, from the in situ observation to the decision-making.
In France, HAB monitoring is carried out by the REPHY (French Observation and Monitoring program for Phytoplankton and Hydrology in coastal waters) and the REPHYTOX (French Monitoring program for Phycotoxins in marine organisms) monitoring networks. The objectives of REPHY are mainly environmental, whereas the objectives of REPHYTOX are strictly sanitary. However, these two monitoring networks, based on in situ observations, remain closely associated for better monitoring and understanding of contamination events in marine organisms [
10]. Although REPHY and REPHYTOX data have been available since 1984 for environmental data and DSP toxins, 1988 for PSP toxins and 1999 for ASP toxins [
10], there are no historical records on the commercial bans and closures related to HABs. Since 2016, the management authorities have digitalized some of the closure decrees, but the information is still scattered and uncompleted, and there are no available data on older periods. Guillotreau et al. (2021) [
9] have created a database of closures based on legal decrees regarding HAB-related closures, but this dataset concerns only shellfish farming activities and it is only related to the coastal area along the western French coasts (Finistère, Morbihan, Loire-Atlantique and Vendée). Data on administrative fishing restrictions are still very few and sparse. This lack of data limits the understanding of decision-making processes and the analysis of the associated impacts. In addition, existing data from legal decrees are not only attached to closures due to sanitary reasons (i.e., exceedances of regulatory thresholds) but also to closures related to resource management as well as precautionary closures, and this can lead to biases in the impact assessments. To deal with all these constraints, this work aims to simulate closures due to HAB events using REPHYTOX data through the case study of the king scallop (
Pecten maximus) fishery in the French area of the eastern English Channel. The resulting dataset only covers closures associated with regulatory threshold exceedances of phycotoxins in scallop and reflect the real risk of HABs. This provides valuable insight for impact assessments and enables a better understanding of the management system and adaptation strategies developed by authorities to cope with HAB events.
This data paper presents the dataset of the estimated closures of scallop (
Pecten maximus) fishing areas due to HAB toxicities. These data were produced within the framework of the French (Channel) English (FCE) Interreg project S-3 EUROHAB (Sentinel-3 products for detecting EUtROphication and Harmful Algal Bloom events), which aims to better understand the dynamics of harmful algal blooms and to assess their impacts over the English Channel area. The simulated closure data were issued from an algorithm [
11] which calculates the number and duration of bans for each scallop fishing area. This algorithm was built based on regulations which determine the safety limits for each group of phycotoxins (1), monitoring strategies (2) and closures mechanisms (3), taking into account the characteristics of the scallop fishery in the French eastern area of the Channel (e.g., management system, fishing seasonality). The input data were created by combining the following data: a time series of phycotoxin concentrations in shellfish by fishing area, and information about phycotoxin thresholds and the scallop fishing season from October 2011 to May 2020.
2. Value and Use of the Data
In France, data on HAB biotoxins in shellfish and data on management strategies such as closures and commercial bans are separated. Therefore, the management process from the in situ observation to the decision-making and economic consequences associated are not well documented. The algorithm created to produce the data presented in this paper combines the in situ data on phycotoxin concentrations in scallops (HAB ecological dimension), information on regulations (regulatory thresholds), and fisheries management data such as the delineation of production areas and the opening and closing periods of the fishing season (HAB management dimension) to transcribe HAB impacts in terms of fishing area closures (HAB socioeconomic dimension). This algorithm is valuable to analyse the management strategies to deal with HABs. In particular, these data, based on a strictly objective study of in situ phycotoxin monitoring data and regulations, can be confronted with the observed closures happening in the realm in order to analyse the social process and the challenges of the fisheries management system in the context of HABs. They can be also reused to analyse the consequences of HABs in terms of fishing bans over a longer time scale, beyond the occurrence of HABs.
The data presented in this paper were thoroughly used and discussed in a research article (Accepted): “Addressing the Governance Challenges of Harmful Algal Blooms impacts: A Case Study of the Scallop Fishery in the Eastern French Coasts of the English Channel”, which analyses the governance and the management actions regarding HAB risks through the case study of the French scallop fishery in the eastern English Channel.
These data are also useful for the assessment of HAB impacts on human activities through the analysis of an objective ecological risk associated with HABs (theoretical closures). Many studies are now focusing on the early detection of HABs and the possibilities of their prediction based on remote sensing and modelling. The algorithm and the resulting dataset presented in this paper can be integrated to those models to predict the economic impacts if the early warning of HABs and their toxicities are ever possible.
Finally, although the methodology and the script developed to provide these data concern the scallop fishery of the English Channel, they can be reused and applied to other species, other areas and other economic activities. HAB monitoring data are available for all impacted species and areas and, with a simple adaptation in terms of species and areas, the script could be reproduced and applied to any other case study.
3. Data Description
The dataset described in this article includes the number and duration of closures due to HABs simulated for each scallop production area between October 2011 and May 2020. It concerns the scallop beds of the eastern Channel, from the Pas-de-Calais Strait (50°57′ N, 1°51′ E) in the east to the Pointe de Barfleur, to the north-western limit of the Bay of Seine (49°41′ N, 1°16′ W) in the west. The dataset is available in a CSV format under the SEANOE data repository (
https://doi.org/10.17882/71912, accessed on 22 May 2022). Data are shown by fishing zones (management areas), weeks and fishing seasons. Data presented by week (Table 91595) and by fishing season (Table 91596) are separately displayed in each CSV table. A shape file showing the location of scallop fishing areas is associated with this data article as supplementary data and it is presented in the zip file 91597 in the SEANOE repository. The input data (phycotoxin monitoring data) used to calculate the number and duration of closures presented in this article are also available in SEANOE and are publicly accessible (
https://doi.org/10.17882/47251, accessed on 22 May 2022). The R code developed to generate this dataset is also available on GitHub and Zenodo (
https://doi.org/10.5281/zenodo.6320765, accessed on 22 May 2022).
3.1. Data File n°1: TheoreticalClosures_Weeks (File 91595)
This CSV file includes theoretical closures of scallop production areas. The table contains 4199 rows and 13 variables. The first variable (Week) contains an accumulation of the numbers of weeks starting from the 1 January 2011. The time series concerns only the fishing season of scallop; the weeks outside of this period are excluded from the dataset. The second variable (FishingZone) describes the 17 scallop production areas that are likely to be closed in the case of scallop contamination by phycotoxins. These areas are described in detail in the data file n°2, of which a description can be found in
Section 3.2. The third variable of the dataset (Season) represents the fishing season of scallop in the eastern Channel, from 2011–2012 to 2019–2020. Each season ranges from October to May of the next year, which represents the fishing season of scallop as indicated in the regulations. The fourth, fifth and sixth variables, named ClosureNbrDSP, ClosureNbrASP and ClosureNbrPSP, respectively, contain the number of closures by type of phycotoxin (reason of closures). This means closures due to threshold exceedances of toxins in shellfish causing lipophilic shellfish poisoning (DSP), amnesic shellfish poisoning (ASP) and paralytic shellfish poisoning (PSP), respectively. These values were calculated for each fishing area and each fishing season. The seventh, eighth and nineth variables, named ClosureDurationDSP, ClosureDurationASP and ClosureDurationPSP, respectively, represent the duration of closures in the number of days per phycotoxin family: DSP, ASP and PSP, for each week, fishing area and fishing season. The objective of estimating closures by type of toxin is to specify the reason of closures and, thus, measure the risk level, because the consequences of contamination are different between DSP, ASP and PSP due to shellfish natural decontamination capacities which vary according to the toxins and the contaminated species. The two variables ClosureNbrTot and ClosureDurationTot concern the total number of closures and the total duration, carried out for each production area, week and fishing season, whatever the reason of closure (DSP, ASP or PSP). The last variables in this dataset (FirstDay and LastDay) represent the start and the end dates of the closures.
3.2. Data File n°2: TheoreticalClosures_Season (File 91596)
This CSV file includes simulated closures of scallop production areas according to fishing zones within a seasonal time frame. Closure data (closure number and duration) are aggregated by fishing season, and the table contains 153 rows and 10 variables: FishingZone, Season, ClosureNbrDSP, ClosureNbrASP, ClosureNbrPSP, ClosureDurationDSP, ClosureDurationASP, ClosureDurationPSP, ClosureNbrTot and ClosureDurationTot.
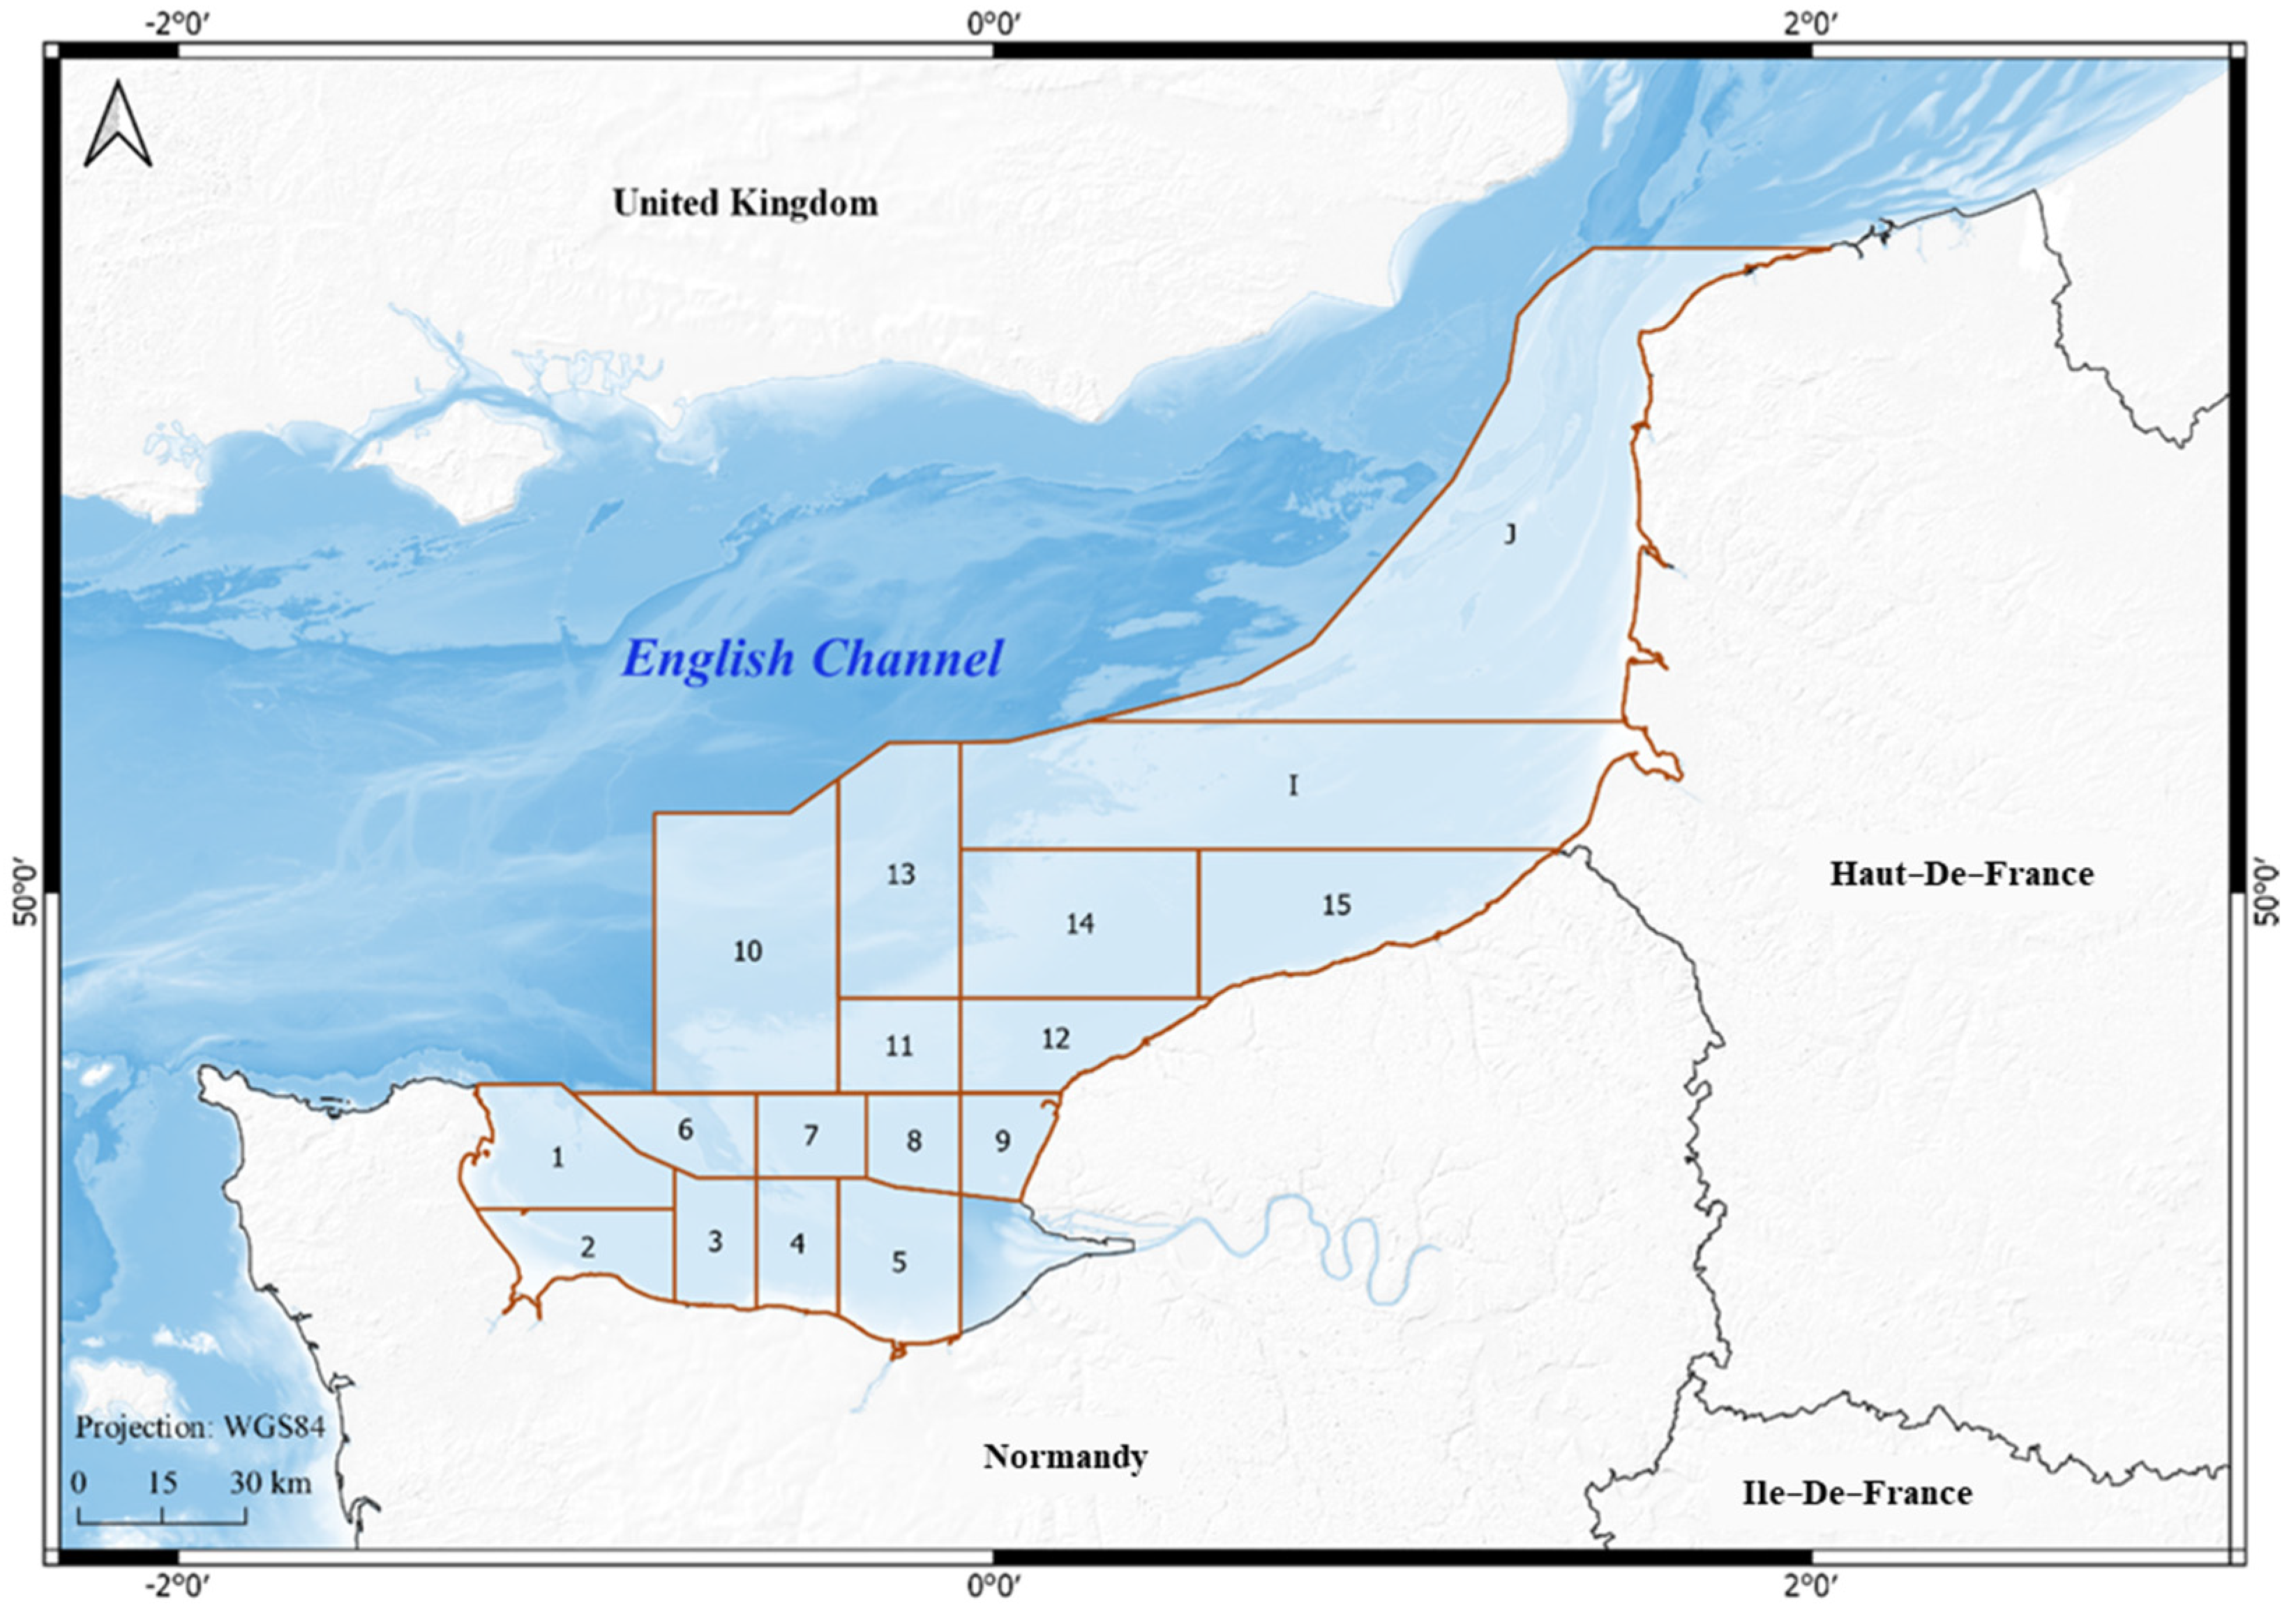
3.3. Data File n°3: Scallop Production Areas (File 91597)
This shape file includes the location of the 17 scallop production areas that are likely to be closed during a toxic bloom, as indicated in the regulations. These zones correspond to a spatial delimitation of the great scallop stock biomass of the eastern Channel, which was proposed and created at the end of 2011 by Ifremer (LERN (Environmental Resources Laboratory of Normandy (Laboratoire Environnement Ressources de Normandie de l’Ifremer))), who are in charge of the stock assessment. The grid lines, also called “sanitary areas” or “management areas”, were created in order to facilitate the management and reduce the impact of closures on the scallop fishing activity. The delineation was based on the results of the stock assessment of the great scallop between 2000 and 2012, carried out during the COMOR (COquilles Manche ORientale) assessment campaigns (
Figure 1).
4. Methods
The simulation of closures is a multi-step process which uses three input data: REPHYTOX data (concentration of phycotoxins in shellfish), data about phycotoxin thresholds and regulations and fishing season data which contain the opening and closing dates of the scallop fishing season on the French side of the eastern Channel. The first step concerns the extraction of data regarding the concentration of phycotoxins in shellfish (flesh) and the selection of the required data for the relevant area. The second step consists of the preprocessing and the preparation of the input data used to calculate the number and the duration of area closures. The third and last step is the script construction and the data processing.
4.1. Extraction of REPHYTOX Data
Data on phycotoxin concentration in shellfish was extracted directly from the Quadrige database (the Quadrige database is a part of the French Water Information System; it includes several data collected by all coastal monitoring networks and REPHYTOX data have been banked in this database since 1987) to ensure data quality and reliability, after a preselection based on a range of criteria. Only regulated toxins responsible for ASP, DSP and PSP were considered and only data used for regulatory monitoring were taken into account in this processing. The objective of this selection was to extract only the regulatory data used for the implementation of management measures (closures of areas attached to contaminated shellfish), and thus, to avoid estimation bias.
4.2. Data Preprocessing
This step represents the preparation of the input data. After the extraction, the data were filtered using three filter criteria: the shellfish species on which the phycotoxin concentration analysis was carried out, the monitoring area and the period. The filtered data concern, therefore, scallops (
Pecten maximus), the eastern Channel area and the period ranging from October 2011 to May 2020. These data represent the first input data used for the processing. The second input data which contain the phycotoxin thresholds were extracted from the regulations (
Table 1).
4.3. Data Processing
The developed script consists of two main steps. A calendar of closures/openings was created by comparing toxin concentration values to the regulatory thresholds: it consists of a binary coding (0 and 1) for each production area and each sampling date in the input data. The 0’s represent the values below or equal to regulatory limits of toxicity which correspond to being open to fishing, and the 1’s indicate values above the regulatory thresholds which correspond to temporary bans on harvesting or marketing of contaminated shellfish. In the case of the fishing sector, the toxin limit exceedences lead to the closure of the production areas. This calendar was then crossed with the scallop fishing calendar, which is used for resource management purposes that involve specific fishing periods over an annual campaign. The new calendar, resulting from this cross-checking, was finally used to generate the second part of the data processing for calculating the duration of closures in a number of days. The rule is: if the concentration of toxins in scallop is higher than the regulatory limits, the concerned area is closed starting from this date, and the algorithm calculates its duration following the existing regulations. The area closed can only be re-opened after two successive values showing a toxicity under the regulatory thresholds (
Figure 2). The data processing was carried out within a time step of one week because the phycotoxin test results (REPHYTOX data) are produced weekly, but the final data (number and duration of bans) were given by week and were then aggregated by fishing season.
Author Contributions
Conceptualization, S.C.; methodology, S.C.; software, M.M. and S.C.; validation, S.C., P.R. and J.A.P.A.; formal analysis, S.C.; investigation, S.C.; data curation, S.C.; writing—original draft preparation, S.C.; writing—review and editing, S.C., P.R. and J.A.P.A.; visualization, S.C.; supervision, P.R. and J.A.P.A.; project administration, P.R., J.A.P.A. and S.C. All authors have read and agreed to the published version of the manuscript.
Funding
This research was performed within the framework of the S-3 EUROHAB project (Sentinel-3 products for detecting EUtROphication and Harmful Algal Bloom events), and funded by the European Regional Development Fund through the INTERREG France-Channel-England (Project Number 106).
Institutional Review Board Statement
Not applicable.
Informed Consent Statement
Not applicable.
Data Availability Statement
The data presented in this paper are available in the SEANOE repository (
https://doi.org/10.17882/71912, accessed on 22 May 2022). The input data and the R code developed to create this dataset are available on GitHub and Zenodo following this link (
https://doi.org/10.5281/zenodo.6320765, accessed on 22 May 2022). All these repositories are publicly accessible.
Conflicts of Interest
The authors declare no conflict of interest. This research did not receive any specific grant from funding agencies in the public, commercia, or not-for-profit sectors.
References
- Berdalet, E.; Fleming, L.E.; Gowen, R.; Davidson, K.; Hess, P.; Backer, L.C.; Moore, S.K.; Hoagland, P.; Enevolsen, H. Marine harmful algal blooms, human health and wellbeing: Challenges and opportunities in the 21st century. J. Mar. Biol. Assoc. United Kingd. 2016, 96, 61–91. [Google Scholar] [CrossRef] [PubMed] [Green Version]
- Moore, S.K.; Dreyer, S.J.; Ekstrom, J.A.; Moore, K.; Norman, K.; Klinger, T.; Allison, E.H.; Jardine, S.L. Harmful algal blooms and coastal communities: Socioeconomic impacts and actions taken to cope with the 2015 U.S. West Coast domoic acid event. Harmful Algae. 2020, 96, 101799. [Google Scholar] [CrossRef] [PubMed]
- Young, N.; Sharpe, R.A.; Barciela, R.; Nichols, G.; Davidson, K.; Berdalet, E.; Fleming, L.E. Marine harmful algal blooms and human health: A systematic scoping review. Harmful Algae. 2020, 98, 101901. [Google Scholar] [CrossRef] [PubMed]
- Lucas, K.M.; Larkin, S.L.; Adams, C.M. Willingness-to-Pay for Red Tide Prevention, Mitigation, and Control Strategies: A Case Study of Florida Coastal Residents. In Proceedings of the 2010 Annual Meeting, Southern Agricultural Economics Association (SAEA), Orlando, FL, USA, 6–9 February 2010; Available online: https://ageconsearch.umn.edu/record/56498 (accessed on 14 April 2021).
- Kudela, R.M.; Bickel, A.; Carter, M.L.; Howard, M.D.A.; Rosenfeld, L. Chapter 5—The Monitoring of Harmful Algal Blooms through Ocean Observing: The Development of the California Harmful Algal Bloom Monitoring and Alert Program. In Coastal Ocean Observing Systems; Liu, Y., Kerkering, H., Weisberg, R.H., Eds.; Academic Press: Boston, MA, USA, 2015; pp. 58–75. Available online: https://linkinghub.elsevier.com/retrieve/pii/B9780128020227000055 (accessed on 24 March 2021). [CrossRef]
- Ekstrom, J.A.; Moore, S.K.; Klinger, T. Examining harmful algal blooms through a disaster risk management lens: A case study of the 2015 U.S. West Coast domoic acid event. Harmful Algae. 2020, 94, 101740. [Google Scholar] [CrossRef] [PubMed]
- Dyson, K.; Huppert, D.D. Regional economic impacts of razor clam beach closures due to harmful algal blooms (HABs) on the Pacific coast of Washington. Harmful Algae. 2010, 9, 264–271. [Google Scholar] [CrossRef]
- Holland, D.S.; Leonard, J. Is a delay a disaster? economic impacts of the delay of the california dungeness crab fishery due to a harmful algal bloom. Harmful Algae. 2020, 98, 101904. [Google Scholar] [CrossRef] [PubMed]
- Guillotreau, P.; Bihan, V.L.; Morineau, B.; Pardo, S. The vulnerability of shellfish farmers to HAB events: An optimal matching analysis of closure decrees. Harmful Algae. 2021, 101, 101968. [Google Scholar] [CrossRef] [PubMed]
- Belin, C.; Soudant, D. Trente Années D’observation des Micro-Algues et des Toxines D’algues sur le Littoral; Editions Quae: Versailles, France, 2018; p. 258. [Google Scholar]
- Chenouf, S.; Merzereaud, M. R Code to Simulate Closures of Scallops Fishing Areas due to Harmful Algal Blooms. Zenodo. 2022. Available online: https://zenodo.org/record/6320765 (accessed on 10 March 2022).
| Publisher’s Note: MDPI stays neutral with regard to jurisdictional claims in published maps and institutional affiliations. |
© 2022 by the authors. Licensee MDPI, Basel, Switzerland. This article is an open access article distributed under the terms and conditions of the Creative Commons Attribution (CC BY) license (https://creativecommons.org/licenses/by/4.0/).


