Data Descriptor

Power-Flow Simulations for Integrating Renewable Distributed Generation from Biogas, Photovoltaic, and Small Wind Sources on an Underground Distribution Feeder

1
Institute of Energy and Environment (IEE), University of São Paulo (USP), São Paulo 05508-010, Brazil
2
Center for Analysis, Planning and Energy Resources Development (CPLEN), São Paulo 05508-010, Brazil
*
Author to whom correspondence should be addressed.
Data 2023, 8(10), 150; https://doi.org/10.3390/data8100150
Submission received: 30 August 2023 / Revised: 26 September 2023 / Accepted: 2 October 2023 / Published: 7 October 2023

Abstract

:
The rapid expansion of distributed generation leads to the integration of an increasing number of energy generation sources. However, integrating these sources into electrical distribution networks presents specific challenges to ensure that the distribution networks can effectively accommodate the associated distributed energy and power. Thus, it is crucial to evaluate the electrical effects of power along the conductors, components, and loads. Power-flow analysis is a well-established numerical methodology for assessing parameters and quantities within power systems during steady-state operation. The University of São Paulo’s Cidade Universitária “Armando de Salles Oliveira” (CUASO) campus in São Paulo, Brazil, features an underground power distribution system. The Institute of Energy and Environment (IEE) leads the integration of several distributed generation (DG) sources, including a biogas plant, photovoltaic installations, and a small wind turbine, into one of the CUASO’s feeders, referred to as “USP-105”. Load-flow simulations were conducted using the PowerWorldTM Simulator v.23, considering the interconnection of these sources. This dataset provides comprehensive information and computational files utilized in the simulations. It serves as a valuable resource for reanalysis, didactic purposes, and the dissemination of technical insights related to DG implementation.
Dataset License: CC-BY

1. Summary

The rapid expansion of distributed generation (DG) throughout the 21st century is one of the many outcomes of the profound transformations that the organization of the electrical industry has been undergoing in nearly all countries.
Following a century dominated by vertically integrated generation, transmission, and distribution systems constituting regulated natural monopolies, structural and regulatory changes were initiated in the last few decades. These changes were driven by advances in information technology, online data management, and the automation and control of the constituent units comprising the electrical systems. Political decisions adopted by various countries or regions aimed at market liberation and the introduction of competitive mechanisms for the generation and commercialization of electric energy.
A new cycle of structural changes has emerged in the current century, propelled by a global movement to respond effectively to a set of concerns and opportunities, including environmental protection on a global scale related to climate change, the reduction in greenhouse gas emissions, and decreased dependency on fossil fuels, coupled with the expansion of energy production and consumption in a manner that is attentive to environmental issues. In addition, the potential for maintaining or even improving access to energy services such as lighting, thermal comfort, motor force, and mobility, among others, can be achieved through the more efficient consumption of energy as a consequence of the introduction of technologies, processes, and demand management systems. Demand Side Management (DSM), for instance, plays an important role, allowing for a reduction in the consumption intensity of primary resources in generation. Technological advances, particularly wind and photovoltaics, have also played a key role when substituting expensive fossil-derived energy. Furthermore, investments in electricity transmission and distribution systems could be postponed or even avoided.
Smaller distributed wind or rooftop photovoltaic installations, combined or not with storage systems, are characterized as Distributed Energy Resources (DER). New challenges arise for distribution system planners as more DER are interconnected to the distribution network, which must handle variable power and operate differently either to supply power to normal consumers or to host excess power injected by DER. Despite distributed sources possibly improving end-user power quality and reliability [1], the concepts of reliability and the learned operation methodology must be fulfilled while respecting the technical requirements and limits, otherwise the photovoltaic DG power fed into the network may lead to technical issues such as overvoltage [2].
When considering electrical energy generation, transmission, and distribution, it is imperative to evaluate the electrical effects of the power along conductors, components, and loads. Load-flow (or power-flow) is a well-established numerical methodology for analyzing parameters and quantities within power systems during steady-state operation. Primarily, power-flow determines voltages, currents, angles, and active and reactive powers. These calculations can be executed using various tools [3], and in [4] a benchmark comparing performance between various computational tools [5,6,7,8,9] for analyzing power grids is presented.
A power-flow study usually employs moderately simplified modelling of the system´s components derived from a single-line diagram and uses the per-unit (p.u.) system to determine the operating point. This approach considers the balance of load and generation, mainly when dealing with multiple generators, as in DG conditions.
The University of São Paulo’s campus, Cidade Universitária “Armando de Salles Oliveira” (CUASO), located in the city of São Paulo, Brazil, features an underground power distribution system. The Institute of Energy and Environment (IEE) is at the forefront of a campus project aimed at integrating multiple DG sources on the campus, including a biogas plant, photovoltaic (both rooftop and ground) installations, and a small wind turbine. These DG installations are predominantly concentrated on a particular feeder referred to as “USP-105”, one of the five circuits constituting the CUASO distribution network.
A hosting capacity study, which outlines a methodology to estimate the potential accommodation of photovoltaic installations within the USP-105 circuit, is detailed in [10]. Figure 1 illustrates a map of CUASO, depicting the main feeder medium voltage path of USP-105, its associated laterals, and the position of twelve load centers comprising educational and research facilities served by the USP-105 circuit. These load centers include the Institute of Energy and Environment (IEE, São Paulo, Brazil), PUSP-C (Prefecture of the USP Campus, São Paulo, Brazil), NUCEL (Cellular and Molecular Therapy Center, São Paulo, Brazil), HU (University Hospital, São Paulo, Brazil), FOFITO (Department of Physiotherapy, Speech Therapy and Occupational Therapy, São Paulo, Brazil), ICB “I”, “II”, “III” and “IV” (Institute of Biomedical Sciences, São Paulo, Brazil), FO (School of Dentistry, São Paulo, Brazil), FMVZ (School of Veterinary Medicine and Animal Science, São Paulo, Brazil), and IB (Institute of Biosciences, São Paulo, Brazil).
This dataset comprises essential information, intricate details, and source files used to conduct power-flow studies of the USP-105 underground feeder within the distribution medium voltage network at the University of São Paulo campus, considering the integration of existing and foreseen DG sources. The power-flow simulations were executed using the PowerWorldTM Simulator, v.23 [11,12,13,14,15]. This dataset provides valuable insights for reanalysis, didactic applications, and the dissemination of technical knowledge regarding the practical implementation of DG.

2. Data Description

The distribution system´s topology, including cables, transformers, loads, and generators, was configured within the PowerWorldTM simulator for processing the power-flow calculations. The computational files associated with the USP-105 circuit were then included in the dataset, titled as follows:
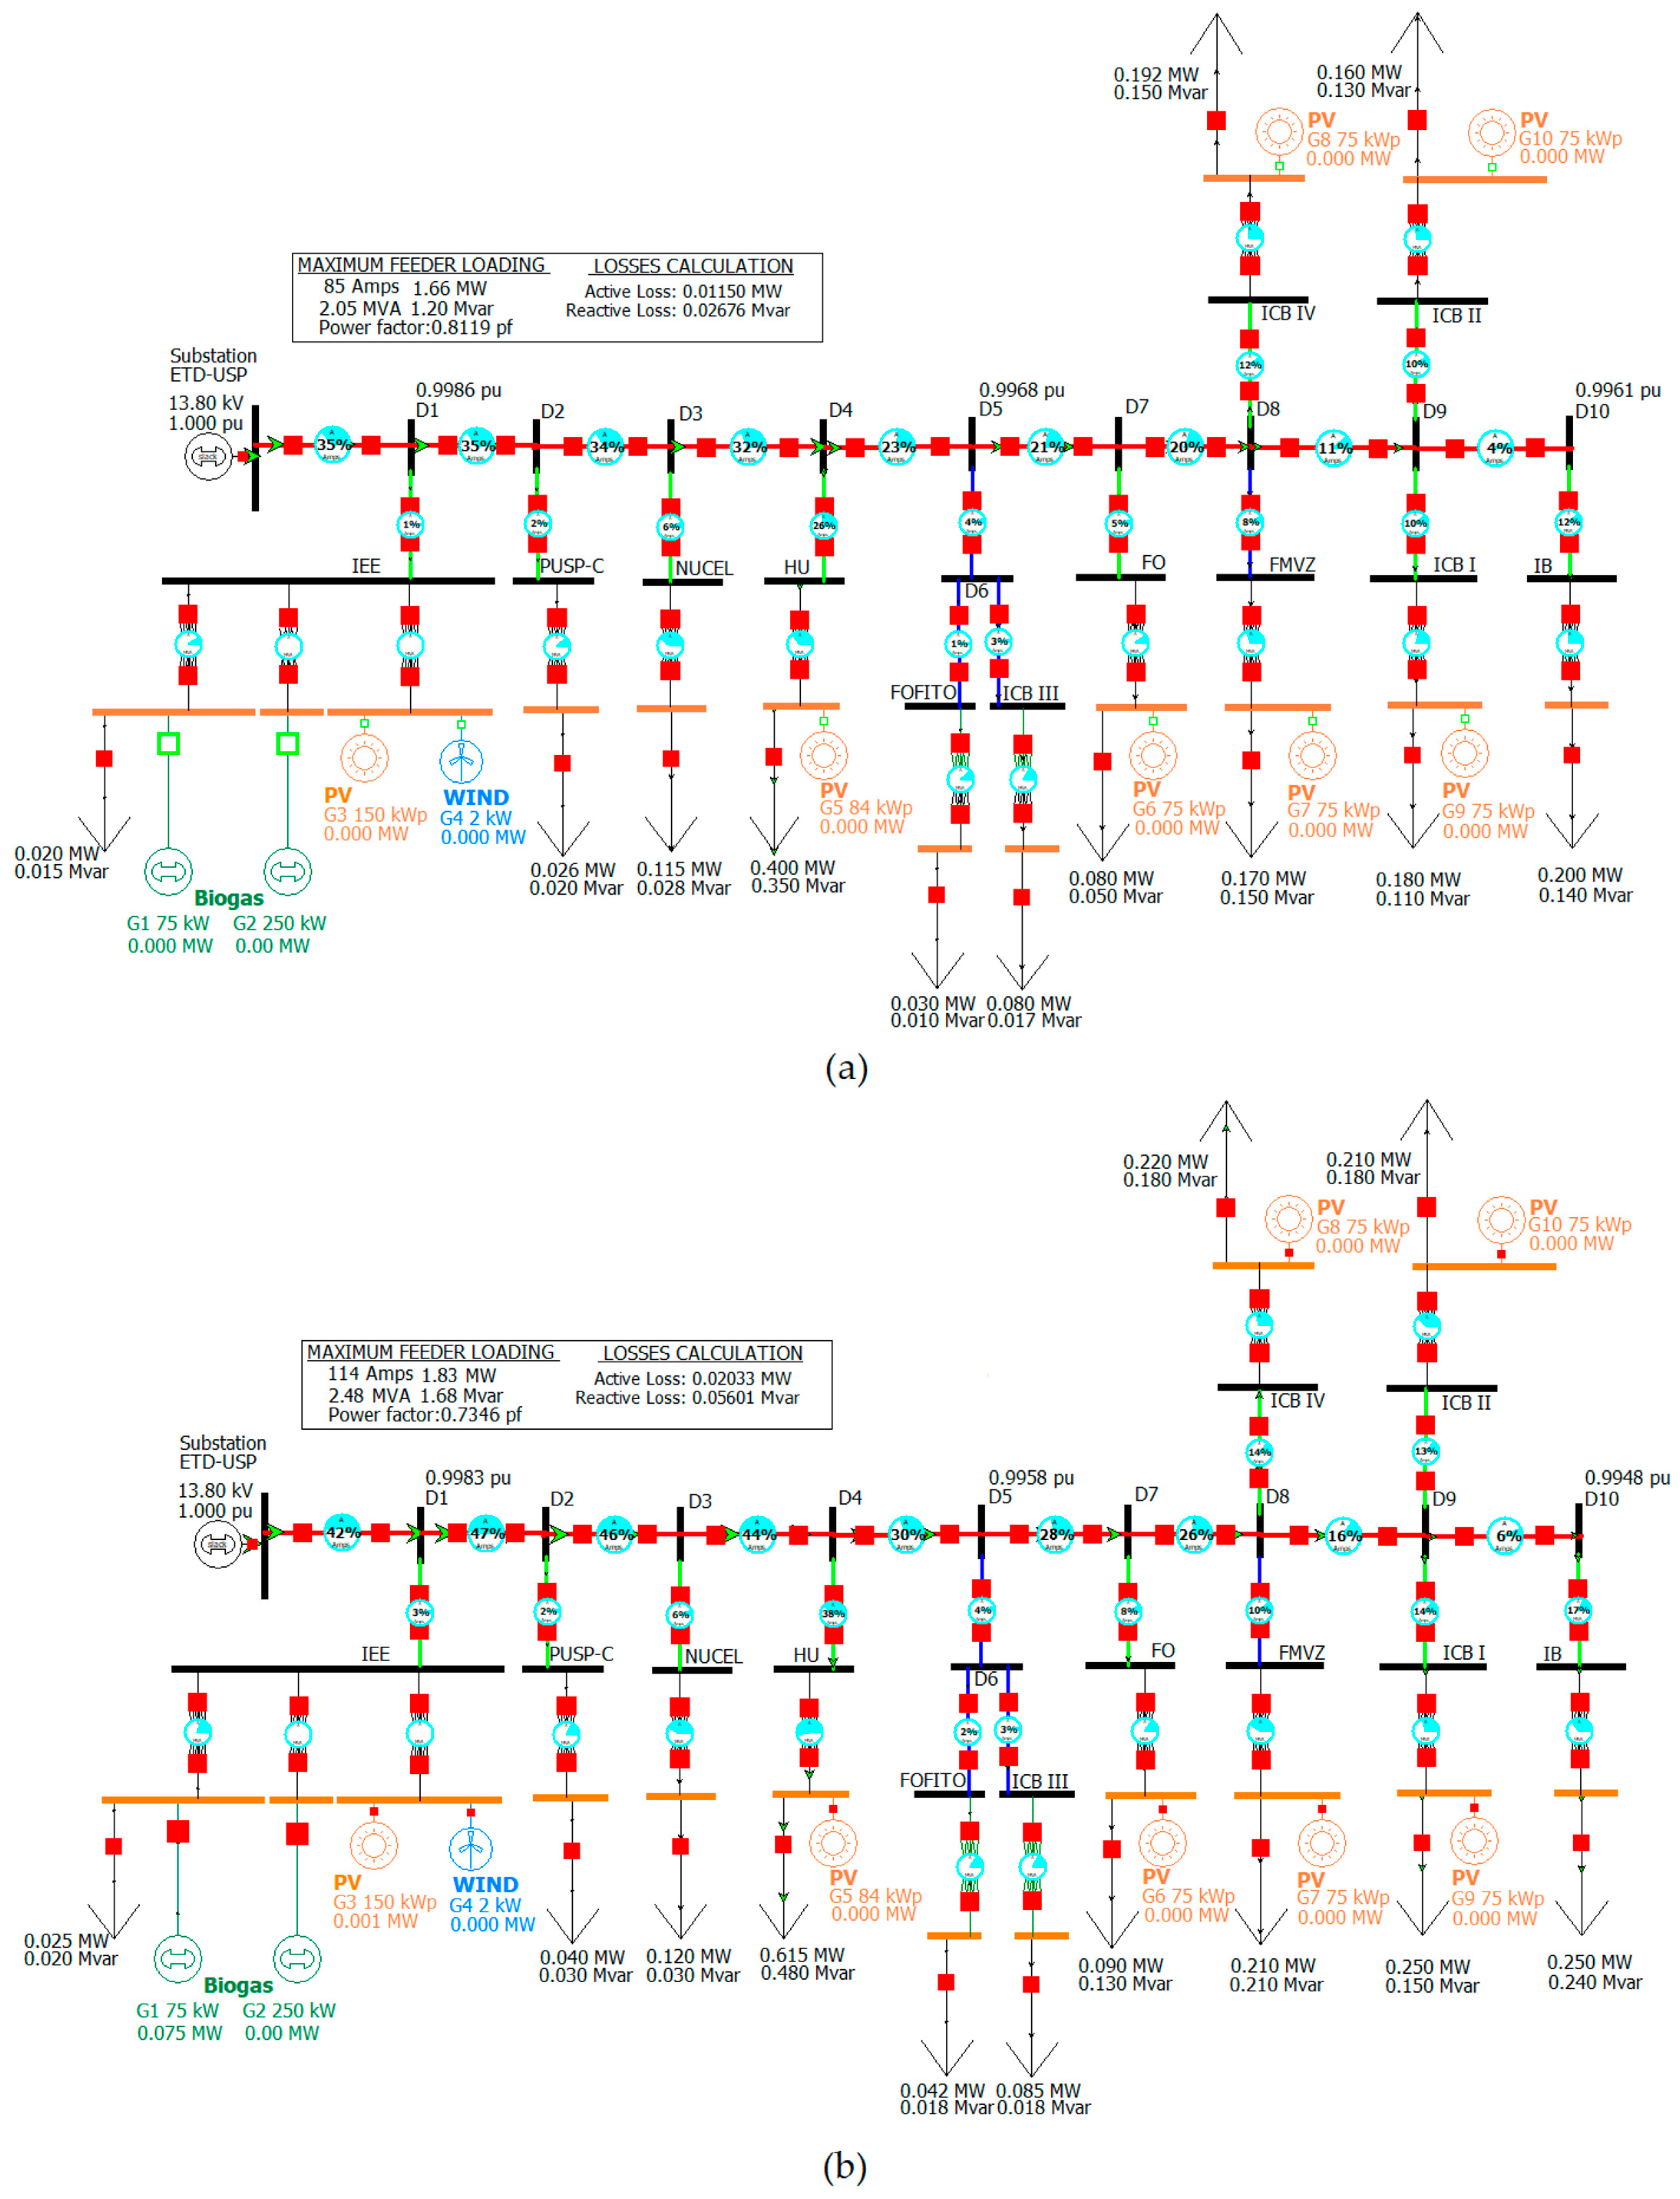
  • Light loading condition without GD generation:
USP-105-Light Load-Flow-NO-DG.pwb;
USP-105-Light Load-Flow-NO-DG.pwd.
  • Light loading condition with GD generation:
USP-105-Light Load-Flow-ALL-DG.pwb;
USP-105-Light Load-Flow-ALL-DG.pwd.
  • Heavy loading condition without GD generation:
USP-105-Heavy Load-Flow-NO-DG.pwb;
USP-105-Heavy Load-Flow-NO-DG.pwd.
  • Heavy loading condition with GD generation:
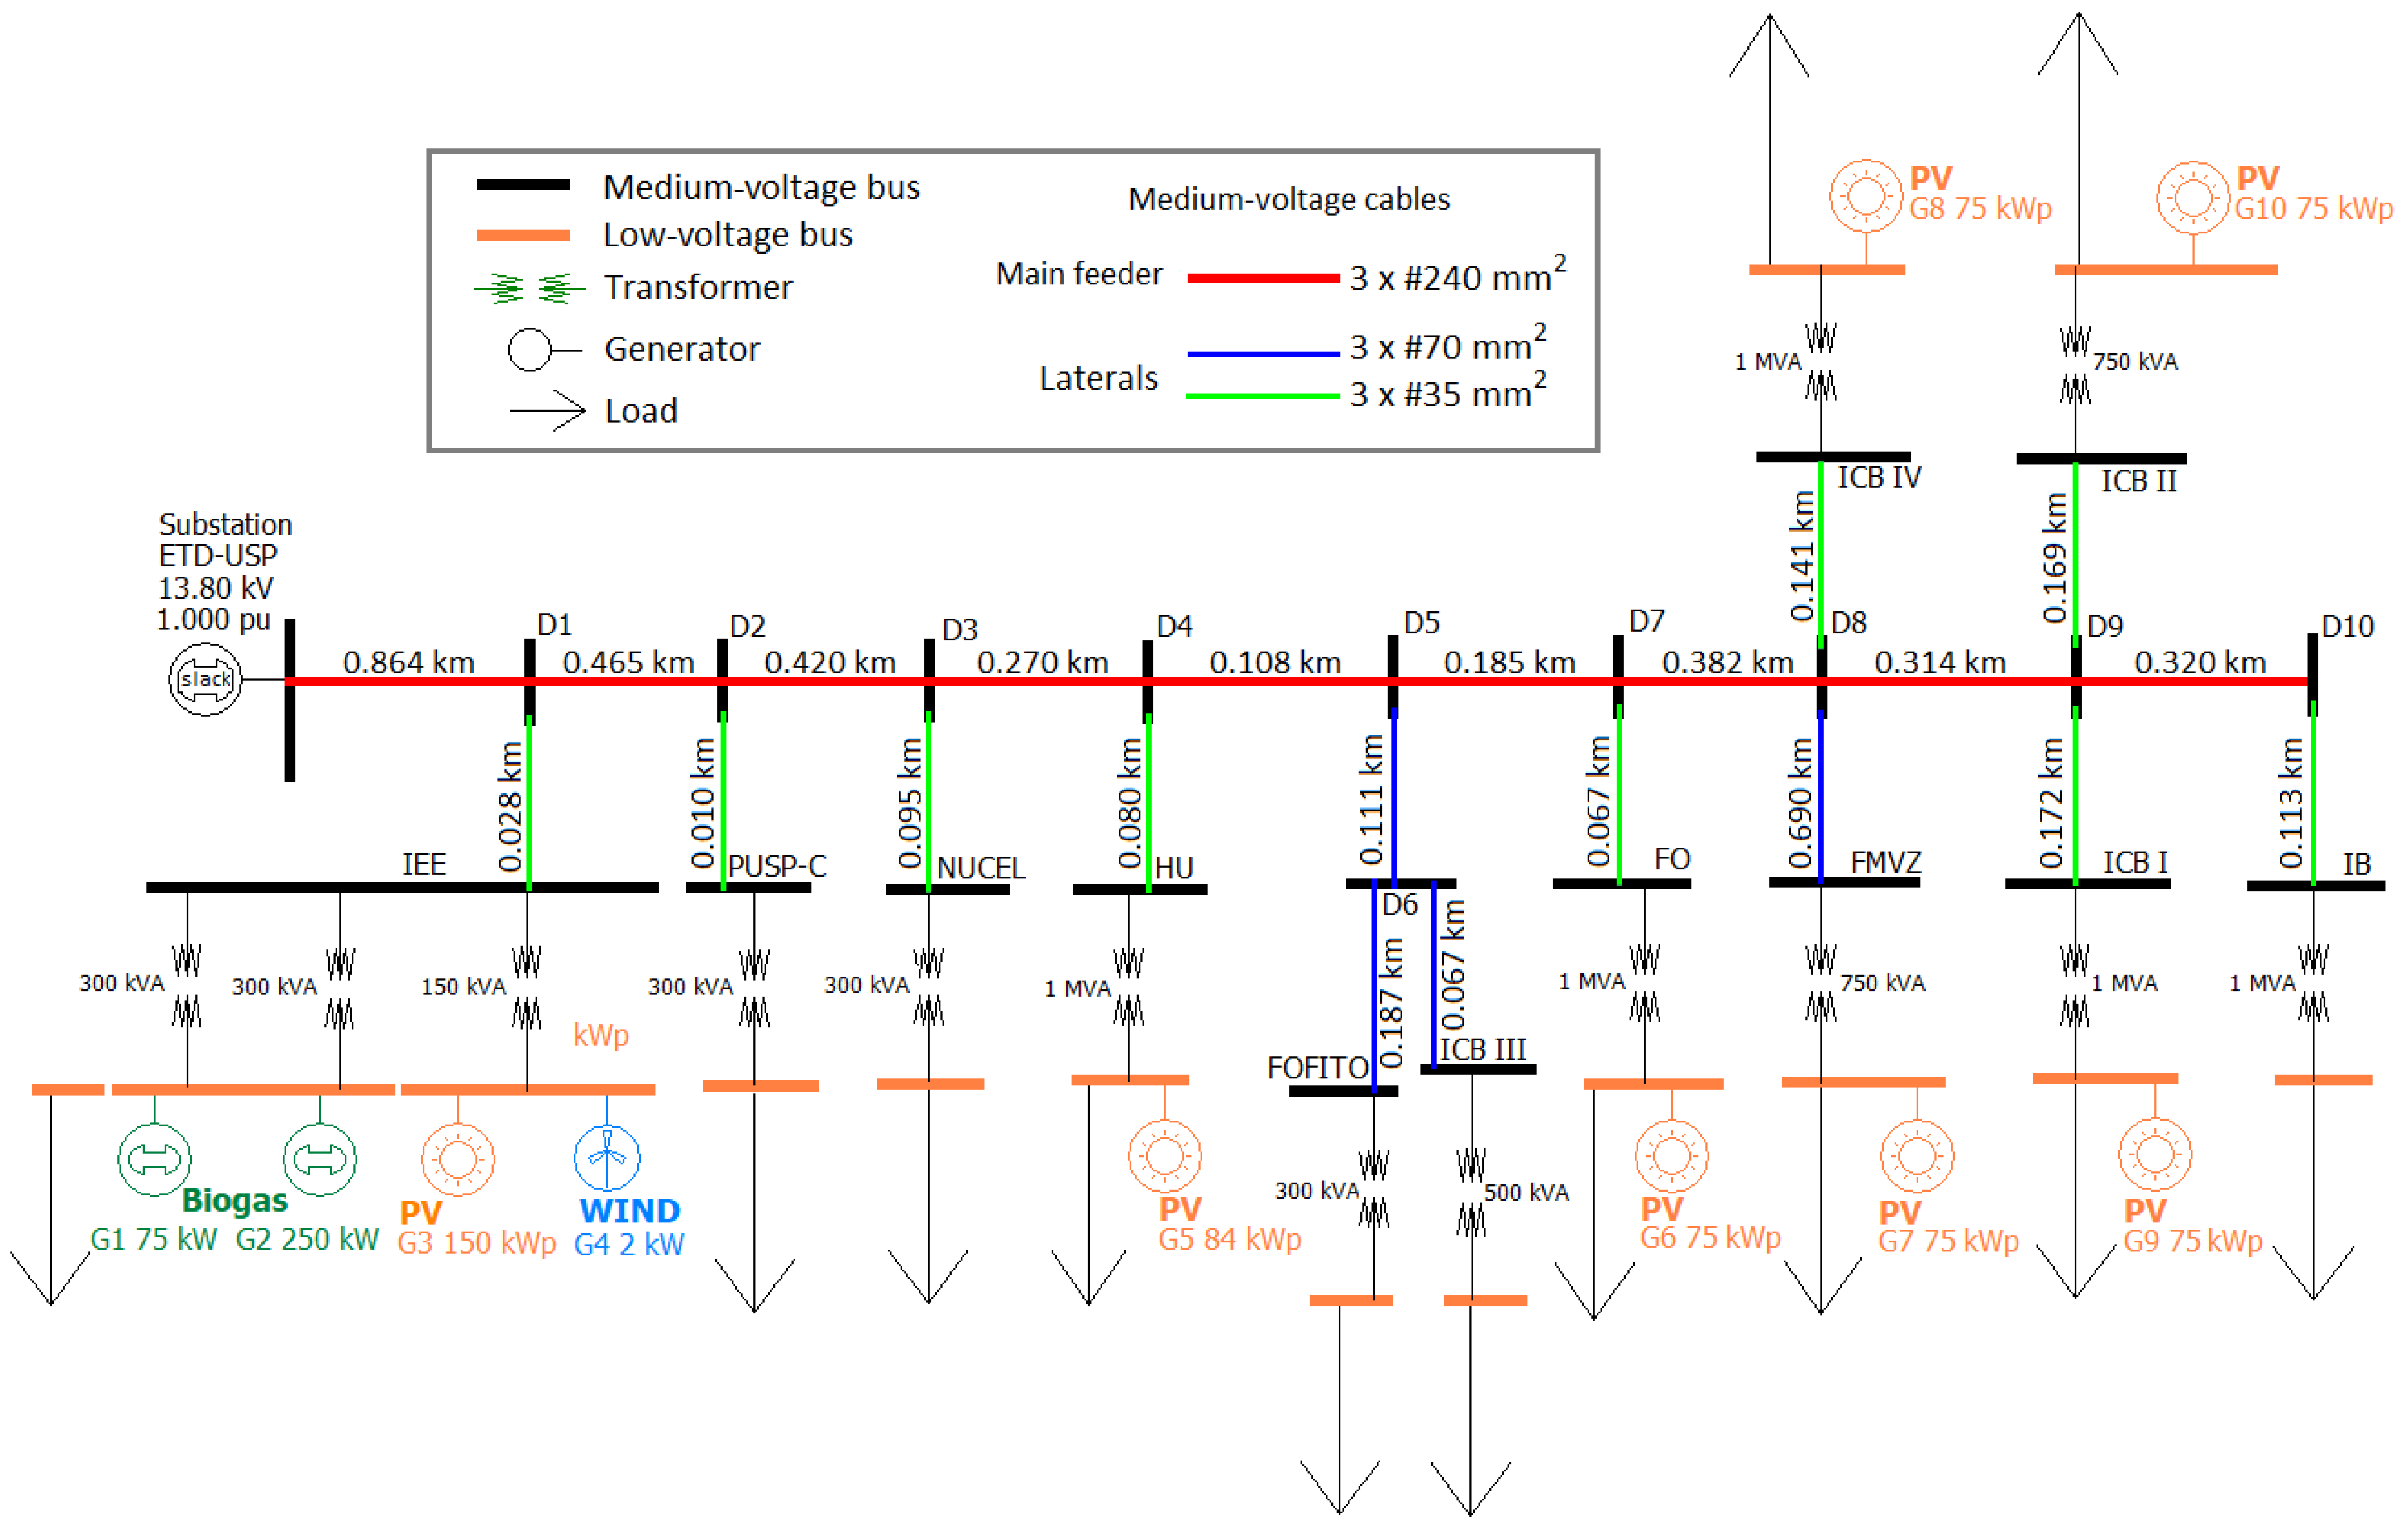
USP-105-Heavy Load-Flow-ALL-DG.pwb;
USP-105-Heavy Load-Flow-ALL-DG.pwd.

2.1. Modelling

The current section presents information regarding the modelling process, including the medium-voltage circuit, loads, DG sources, and the generators.

2.1.1. Medium-Voltage Modelling

The USP-105 single-line diagram is depicted in Figure 2. The simulation model includes the medium-voltage buses and cables and the low-voltage buses and their corresponding transformers once the loads and DG installations have become interconnected within the low-voltage distribution network.
The USP-105 is a radial circuit with a rated voltage of 13.8 kV and a length of 3.5 km. The cross-sectional area of the main feeder cable is 3 × 240 mm2, and its laterals use either 3 × 70 mm2 or 3 × 35 mm2 cables. The main insulation is composed of a polyethylene compound (XLPE) capable of operating at a temperature of 90 °C.
The medium-voltage cable impedances are provided in Table 1, and the ampacity values were reevaluated according to the installation criteria outlined in the IEC 60502-2 Standard [16] (for tripolar cables in buried earthenware ducts).
Based on the distances of the sections depicted in the single-line diagram (Figure 2) and the impedance values (Table 1), the impedances of each section were calculated. For p.u. calculations, a base power of 1 MVA and a base voltage of 13.8 kV were adopted, leading to the base impedance of 190.44 Ω. Consequently, the calculated modelled impedances (both resistance and reactance) are presented in Table 2.
The distribution transformers were modelled using their nominal ratios (13.8 kV/220 V) and the series resistances and reactances according to the rated power, as presented in Table 3.

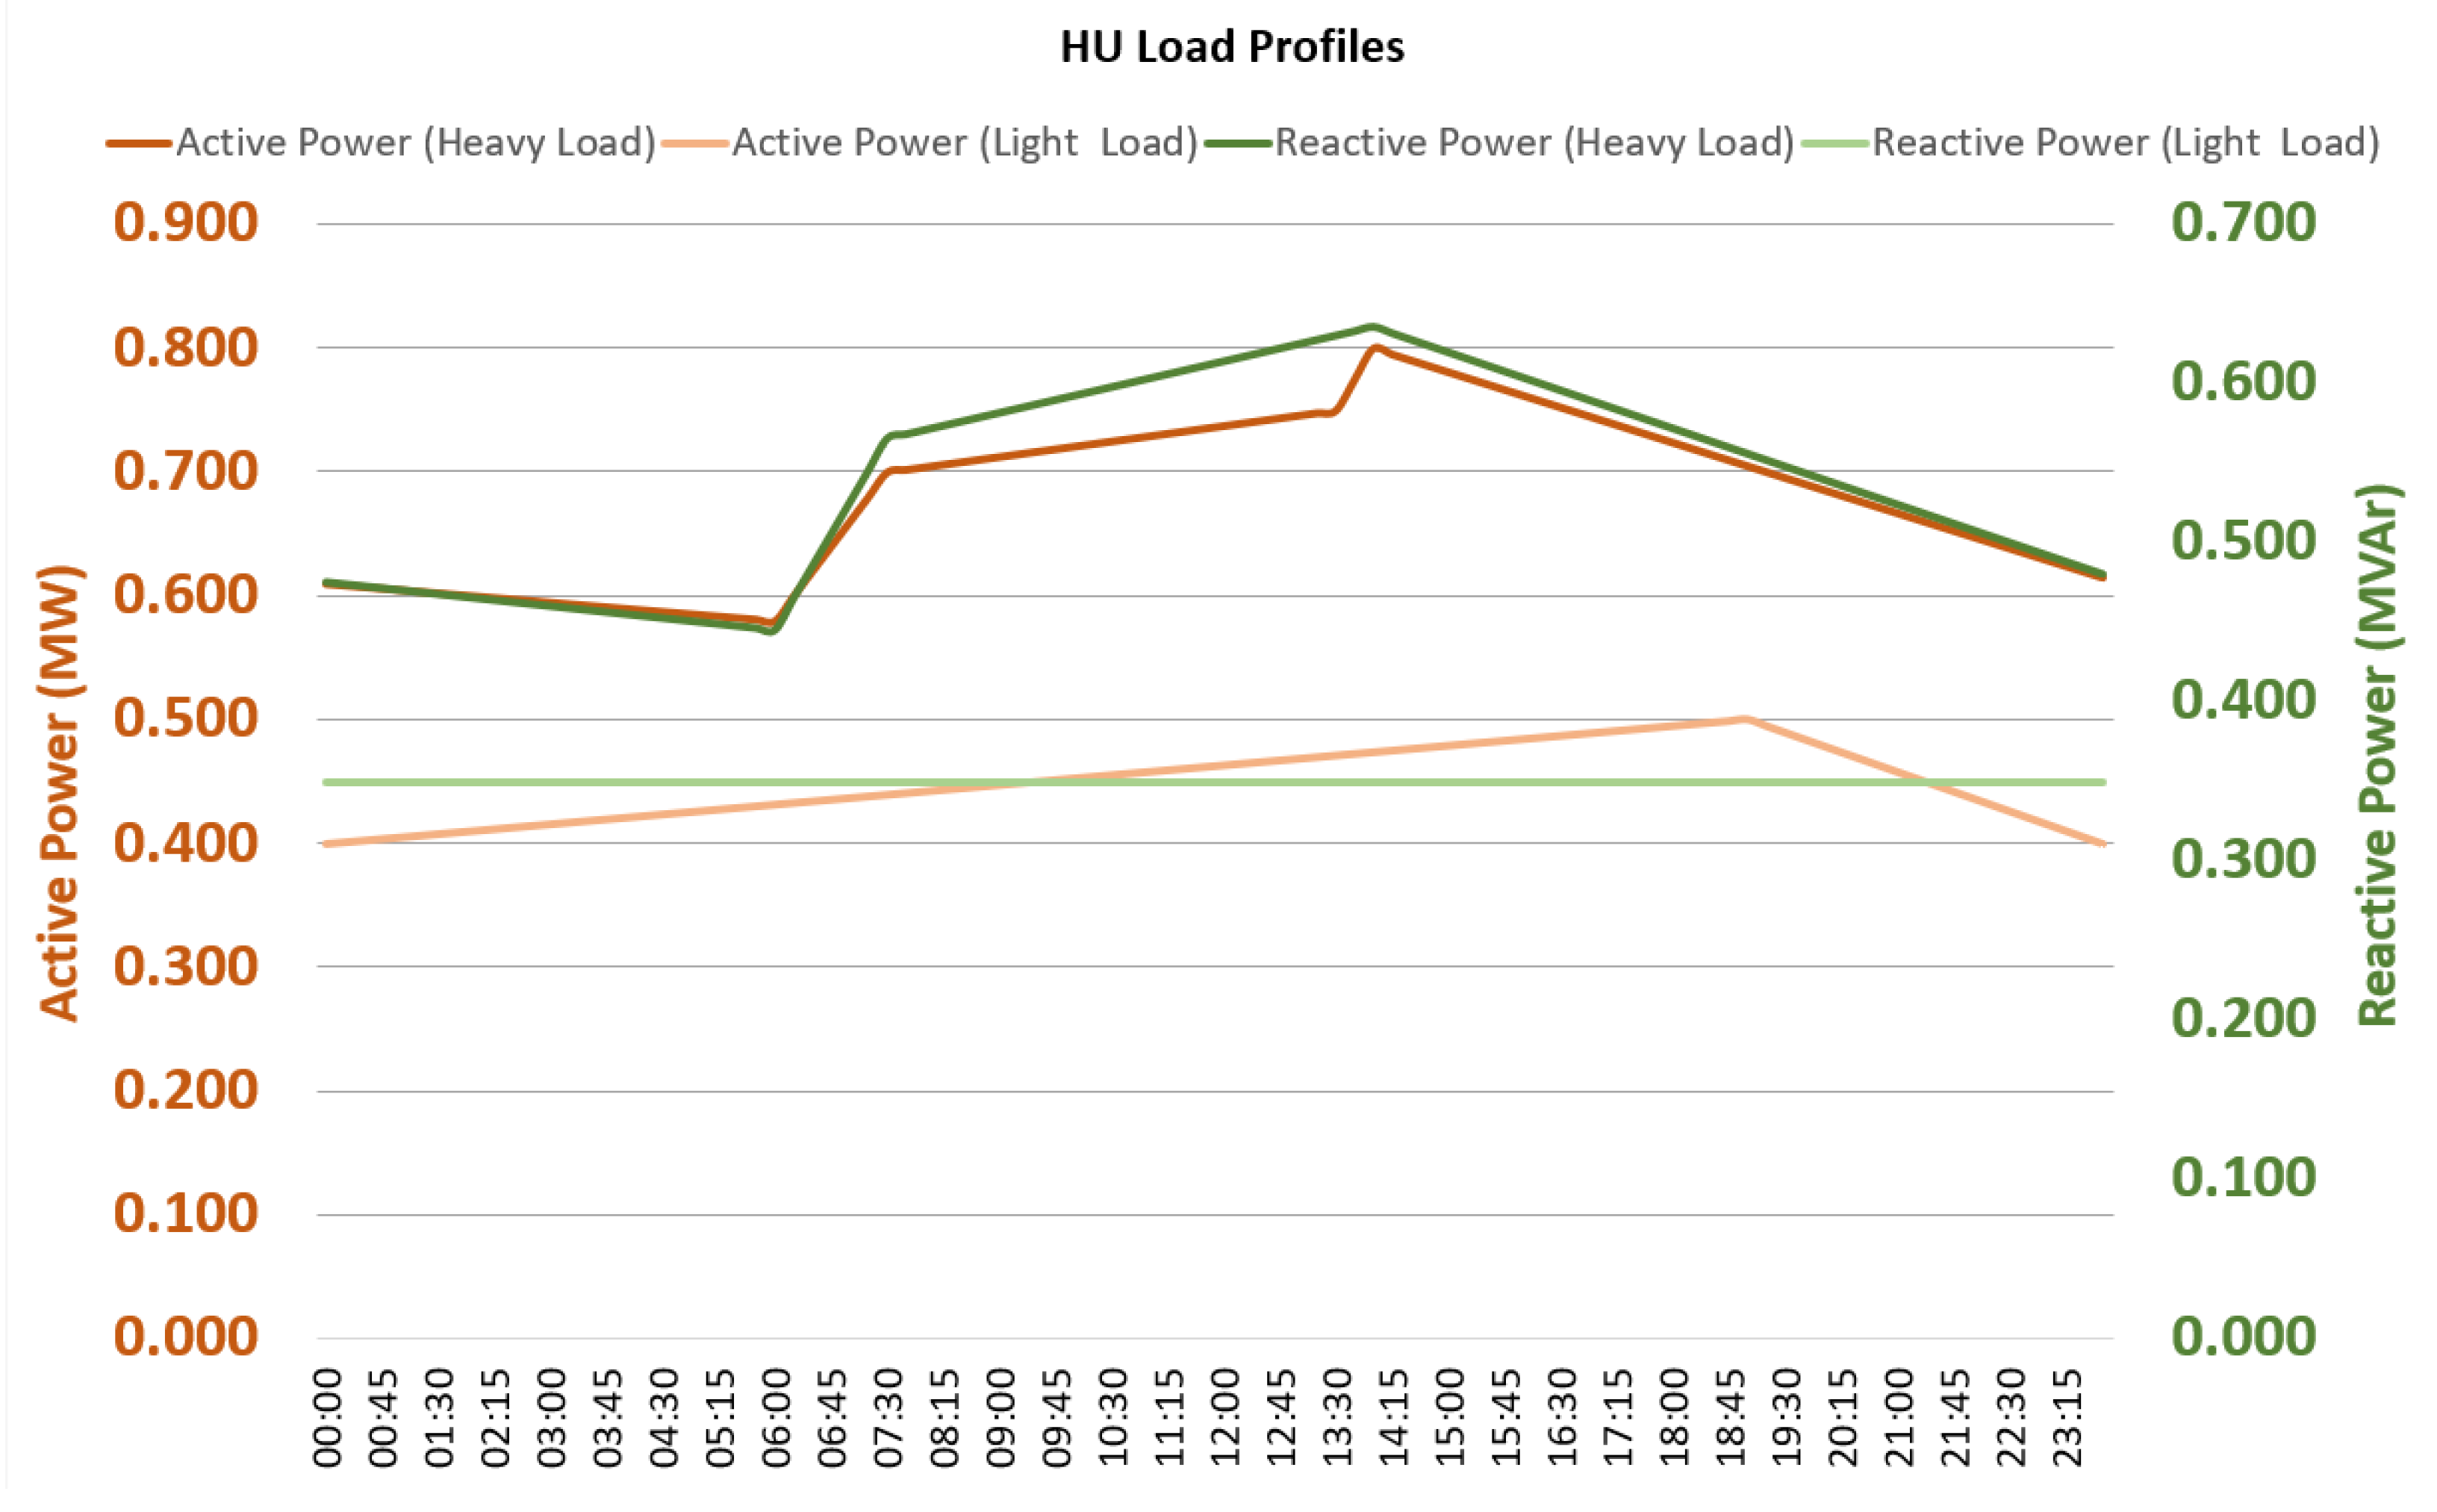
2.1.2. Load Modelling

The twelve loads positioned along the lines were modelled using their active and reactive profile curves, sampled every 15 min across a 24 h day. These profiles were obtained for high load and light load conditions. The high load condition refers to weekdays in the summer when the campus experiences peak energy and power consumption. Conversely, the light load condition refers to weekend days in the winter when energy demand is lower.
The electric distribution system operation was performed by the University of São Paulo at the CUASO. Load measurement data were acquired through its supervisory system from March 2020 to August 2021. The heavy and light load months were identified as March (summer, during classes) and July (winter, no-classes period), respectively. The load profiles employed in the power-flow simulations were derived from linearizing the averaged curves obtained from each set of active and reactive power measurements, considering heavy or light load conditions. Figure 3 illustrates the modelling process outcomes for two distinct sets of load profiles derived from the acquired curves: the high load active power of the HU consumer and the light load reactive power of the IB consumer.
The 15 min hourly modelled curves for all the loads are presented in the dataset. These curves are used in the power-flow simulations and can be identified by the following file names:
  • Light Load Active Power Table 24 h.csv;
  • Light Load Reactive Power Table 24 h.csv;
  • Heavy Load Active Power Table 24 h.csv;
  • Heavy Load Reactive Power Table 24 h.csv.
During the PowerWorldTM simulations, the load profiles were replicated using the time step simulation tool, specifying the active and reactive powers at 15 min intervals throughout the 24 h of the day. The loads’ variations were incorporated in the time step simulation files named in the dataset, as follows:
  • USP-105-Light Load-Flow-NO-DG.tsb;
  • USP-105-Light Load-Flow-ALL-DG.tsb;
  • USP-105-Heavy Load-Flow-NO-DG.tsb;
  • USP-105-Light Load-Flow-ALL-DG.tsb.
Figure 4 shows examples of the modelled active and reactive power profiles for the HU consumer under both heavy and light load conditions.

2.1.3. DG Sources and Generator Modelling

The distribution system was supplied by the public power network at the connection substation and named ETD-USP at the 88 kV level, which was modelled as a slack bus/generator used as a reference bus 13.8 kV/1 p.u.
Fifteen-minute hourly power profiles were modelled for ten existing and planned DG sources (G1 to G10 in Figure 2). These profiles, illustrated in Figure 5, consider three distinct types of generation sources:
  • Biogas Moto-Generators: G1, existing generator, rated power 75 kW and G2, planned generator, rated power 250 kW;
  • Photovoltaic Generators: Existing plants G3, 150 kWp and G5, 84 kWp and planned plants G6, G7, G8, G9, and G10, all rated 75 kWp;
  • Small Wind Generator, G4: existing generator, 1.8 kW [17,18].
The 15 min hourly modelled DG profiles for all the sources are in the dataset placed within the file named “DG Table 24 h.csv”.
Similar to the load modelling, the DG generation curves were simulated using the time step simulation tool in PowerWorldTM, in which the active powers were specified at 15 min intervals throughout the 24 h of the day. The generation profiles were incorporated in the same time step simulation files described in Section 2.1.2, whose file names in the dataset are as follows:
  • USP-105-Light Load-Flow-NO-DG.tsb;
  • USP-105-Light Load-Flow-ALL-DG.tsb;
  • USP-105-Heavy Load-Flow-NO-DG.tsb;
  • USP-105-Light Load-Flow-ALL-DG.tsb.

2.2. Results

Figure 6 provides, for illustrative purposes, screen captures from PowerWorldTM demonstrating the power-flow balance under two distinct conditions.
Since one can use power-flow simulations for countless purposes, the current dataset offers a collection of organized results, which can be found in the following dataset files:
  • Results Light Load.csv;
  • Results Heavy Load.csv.
Figure 7 illustrates some of the analyses derived from the simulation results stored in the aforementioned files, including the voltage profile along the feeder, the calculation of the power losses, and the determination of the maximum loading of the feeder.

3. Materials and Methods

The dataset contains proprietary files from the power system simulation software PowerWorldTM, version 23. The extension of these files are: .pwb, .pwd and .tsb.
The modelling process for representing the electrical loads along the medium-voltage distribution system relied on measurements of active and reactive powers obtained from a SCADA system implemented by the University of São Paulo at CUASO.
The supervisory system was built upon the ElipseTM SCADA platform [19], a widely used process management tool that allows the integration of energy meters or other measurement equipment that uses standardized communication protocols.
The preferred means of communication used for the traffic of information in CUASO are the Internet, through the MODBUS TCP/IP communication protocol, and a private fiber-optical network using the MODBUS RTU serial protocol.
Figure 8 showcases a few screens of the supervisory system in operation.
The information was acquired using energy meters and/or protection relays installed within the power supply cabinets and was transmitted to the system’s server. Physical measurements could be recorded in the supervisory system at a maximum rate of 1 register per second. However, for this study, the measurements were evaluated and modelled on a 15 min interval basis.
The CSV files provided in the dataset employ a semicolon symbol (;) as the column separator, while a dot symbol (.) is used as the decimal separator. The first row of each CSV file corresponds to the header row, helping in the identification of the data.

Author Contributions

Conceptualization, W.B.; methodology, W.B. and I.L.S.; validation, W.B., I.C. and I.L.S.; formal analysis, W.B., I.C. and I.L.S.; investigation, W.B. and I.C.; resources, I.L.S.; data curation, W.B. and I.C.; writing—original draft preparation, W.B.; writing—review and editing, W.B., I.C. and I.L.S.; visualization, W.B., I.C. and I.L.S.; supervision, W.B. and I.L.S.; project administration, W.B. and I.L.S.; funding acquisition, I.L.S. All authors have read and agreed to the published version of the manuscript.

Funding

The authors acknowledge the financial support received from the Institute of Energy and Environment of the University of São Paulo (IEE-USP), Center for Analysis, Planning and Energy Resources Development (CPLEN), FUSP project number 3827, and from Enel Distribuição São Paulo in partnership with the Brazilian Electricity Regulatory Agency (ANEEL) through the Priority Energy and Strategic R&D entitled “Energy Efficiency and Minigeneration in Public University Institutions”, grant number 00390-1086/2018.

Data Availability Statement

Data can be freely downloaded at: https://doi.org/10.5281/zenodo.8292395 (accessed on 15 August 2023) under Creative Commons Attribution 4.0 International License.

Conflicts of Interest

The authors declare no conflict of interest.

References

  1. Gil, H.A.; Joos, G. On the Quantification of the Network Capacity Deferral Value of Distributed Generation. IEEE Trans. Power Syst. 2006, 21, 1592–1599. [Google Scholar] [CrossRef]
  2. Gaunt, C.T.; Namanya, E.; Herman, R. Voltage Modelling of LV Feeders with Dispersed Generation: Limits of penetration of randomly connected photovoltaic generation. Electr. Power Syst. Res. 2017, 143, 1–6. [Google Scholar] [CrossRef]
  3. Kumar, A.; Panda, R.K.; Swain, K.; Puvvada, N.Y.; Mohapatra, A. Simulation tools for power systems applications. In Encyclopedia of Electrical and Electronic Power Engineering; García, J., Ed.; Elsevier: Amsterdam, The Netherlands, 2023; pp. 517–532. [Google Scholar] [CrossRef]
  4. Gao, D.W.; Muljadi, E.; Tian, T.; Miller, M. Software Comparison for Renewable Energy Deployment in a Distribution Network; Technical Report NREL/TP-5D00-64228; National Renewable Energy Lab. (NREL): Golden, CO, USA, 2017. [Google Scholar] [CrossRef]
  5. Jin, S.; Chen, Y.; Diao, R.; Huang, Z.H.; Perkins, W.; Palmer, B. Power Grid Simulation Applications Developed Using the GridPACK™ High Performance Computing Framework. Electr. Power Syst. Res. 2016, 141, 22–30. [Google Scholar] [CrossRef]
  6. Hansen, T.M.; Suryanarayanan, S.; Maciejewski, A.A.; Siegel, H.J.; Modali, A.V. A Visualization Aid for Demand Response Studies in the Smart Grid. Electr. J. 2015, 28, 100–111. [Google Scholar] [CrossRef]
  7. Penkey, P.; Gaul, N.; Johnson, B.K.; Hess, H.L. Sizing and location identification for an electrical energy storage system in a renewable microgrid. In Proceedings of the 2016 IEEE Conference on Technologies for Sustainability (SusTech), Phoenix, AZ, USA, 9–11 October 2016; pp. 83–88. [Google Scholar] [CrossRef]
  8. Mashayekh, S.; Butler-Purry, K.L. Security Constrained Power Management System for the NG IPS ships. In Proceedings of the 2010 North American Power Symposium, Arlington, TX, USA, 26–28 September 2010; pp. 1–8. [Google Scholar] [CrossRef]
  9. Panyam, V.; Huang, H.; Davis, K.; Layton, A. Bio-inspired design for robust power grid networks. Appl. Energy 2019, 251, 113349. [Google Scholar] [CrossRef]
  10. Cordeiro, I.; Bassi, W.; Sauer, I.L. Hosting Capacity Estimate Based on Photovoltaic Distributed Generation Deployment: A Case Study in a Campus of the University of São Paulo. Energies 2023, 16, 3934. [Google Scholar] [CrossRef]
  11. PowerWorld Simulator. Available online: https://www.powerworld.com/products/simulator/overview (accessed on 1 August 2023).
  12. Overbye, T.J.; Wert, J.; Shetye, K.S.; Safdarian, F.; Birchfield, A.B. Delaunay triangulation based wide-area visualization of electric transmission grids. In Proceedings of the 2021 IEEE Kansas Power and Energy Conference (KPEC), Manhattan, KS, USA, 19–20 April 2021; pp. 1–6. [Google Scholar] [CrossRef]
  13. Ventura, C.; Tina, G.M.; Castillo, G.J. Performance estimation of voltage control with distributed Generation. In Proceedings of the 2023 International Conference on Clean Electrical Power (ICCEP), Terrasini, Italy, 27–29 June 2023; pp. 498–503. [Google Scholar] [CrossRef]
  14. Cicilio, P.; Cotilla-Sanchez, E.; Vaagensmith, B.; Gentle, J. Transmission Hosting Capacity of Distributed Energy Resources. IEEE Trans. Sustain. Energy. 2021, 12, 794–801. [Google Scholar] [CrossRef]
  15. Fekete, K.; Klaic, Z.; Sljivac, D. Influence of load management in distribution network on voltages and active power losses: Case study. In Proceedings of the 2016 IEEE 16th International Conference on Environment and Electrical Engineering (EEEIC), Florence, Italy, 7–10 June 2016; pp. 1–6. [Google Scholar] [CrossRef]
  16. IEC 60502-2; Power Cables with Extruded Insulation and Their Accessories for Rated Voltages from 1 kV (Um = 1.2 kV) up to 30 kV (Um = 36 kV)—Part 2: Cables for Rated Voltages from 6 kV (Um = 7.2 kV) up to 30 kV (Um = 36 kV). International Electrotechnical Commission: Geneva, Switzerland, 2014.
  17. Bassi, W.; Rodrigues, A.L.; Sauer, I.L. Implantation, Operation Data and Performance Assessment of an Urban Area Grid-Connected Small Wind Turbine. Wind 2022, 2, 711–732. [Google Scholar] [CrossRef]
  18. Bassi, W.; Rodrigues, A.L.; Sauer, I.L. Dataset on SCADA Data of an Urban Small Wind Turbine Operation in São Paulo, Brazil. Data 2023, 8, 52. [Google Scholar] [CrossRef]
  19. Elipse Software. Available online: https://www.elipse.com.br/en (accessed on 2 August 2023).
Figure 1. USP-105 feeder along CUASO. Main feeder (red line) and its laterals (blue and green lines).
Data 08 00150 g001
Figure 2. USP-105 single-line diagram.
Data 08 00150 g002
Figure 3. Examples of modelled load curves from measured data.
Data 08 00150 g003
Figure 4. Example of 15 min modelled hourly load profiles (consumer HU).
Data 08 00150 g004
Figure 5. Hourly GD power profiles.
Data 08 00150 g005
Figure 6. Screen captures of the power-flow calculation software PowerWorldTM. (a) Light load condition, no DG sources. (b) Heavy load condition, all DG sources interconnected.
Data 08 00150 g006
Figure 7. Simulation results examples.
Data 08 00150 g007
Figure 8. Screen captures of the SCADA implemented for CUASO distribution system operation and supervision.
Data 08 00150 g008
Table 1. Cable parameters.
Parameter240 mm270 mm235 mm2
Resistance R (Ω/km)0.09920.34240.6684
Reactance X (Ω/km)0.11140.13500.1500
Ampacity (A)245154108
Power capacity (MVA)5.93.72.6
Table 2. Modelled impedances of the medium-voltage sections.
SectionResistance (p.u.)Reactance (p.u.)
ETD-D10.0004500.000505
D1-IEE0.0000980.000022
D1-D20.0002420.000272
D2-PUSP0.0000350.000008
D2-D30.0002190.000246
D3-NUCEL0.0003320.000074
D3-D40.0001400.000158
D4-HU0.0002810.000063
D4-D50.0000560.000063
D5-D60.0002000.000079
D6-ICB III0.0001200.000047
D6-FOFITO0.0003370.000133
D5-D70.0000960.000108
D7-FO0.0002350.000053
D7-D80.0001990.000223
D8-FMVZ0.0012410.000489
D8-ICB IV0.0004980.000112
D8-D90.0001630.000183
D9-ICB I0.0006040.000136
D9-ICB II0.0005920.000133
D9-D100.0001670.000187
D10-IB0.0003950.000089
Table 3. Distribution transformers parameters.
Rated Power (kVA)/
Impedance (%)
Resistance (p.u.)Reactance (p.u.)
150/3.5%0.06700.2230
300/4.5%0.04400.1430
750/5.0%0.01900.0640
1000/5.0%0.01400.0480
Disclaimer/Publisher’s Note: The statements, opinions and data contained in all publications are solely those of the individual author(s) and contributor(s) and not of MDPI and/or the editor(s). MDPI and/or the editor(s) disclaim responsibility for any injury to people or property resulting from any ideas, methods, instructions or products referred to in the content.

