
Factory-Based Vibration Data for Bearing-Fault Detection


1
Department of Computer and Electrical Engineering, Mid Sweden University, 85170 Sundsvall, Sweden
2
Svenska Cellulosa Aktiebolaget, SCA, 85188 Sundsvall, Sweden
*
Author to whom correspondence should be addressed.
Data 2023, 8(7), 115; https://doi.org/10.3390/data8070115
Submission received: 1 June 2023
/
Revised: 22 June 2023
/
Accepted: 26 June 2023
/
Published: 28 June 2023
Abstract
:The importance of preventing failures in bearings has led to a large amount of research being conducted to find methods for fault diagnostics and prognostics. Many of these solutions, such as deep learning methods, require a significant amount of data to perform well. This is a reason why publicly available data are important, and there currently exist several open datasets that contain different conditions and faults. However, one challenge is that almost all of these data come from a laboratory setting, where conditions might differ from those found in an industrial environment where the methods are intended to be used. This also means that there may be characteristics of the industrial data that are important to take into account. Therefore, this study describes a completely new dataset for bearing faults from a pulp mill. The analysis of the data shows that the faults vary significantly in terms of fault development, rotation speed, and the amplitude of the vibration signal. It also suggests that methods built for this environment need to consider that no historical examples of faults in the target domain exist and that external events can occur that are not related to any condition of the bearing.
1. Introduction
The prevalence of bearings in different industrial applications and the anticipation of eventual failure [1] has led to a substantial amount of research being conducted that focuses on diagnostic and prognostic methods for bearing faults. These range from physics-based methods [2] to machine learning solutions. Recently, deep learning has become a valuable tool that can learn complex features in data from sources such as vibrations [3,4,5]. The latter includes methods based on manually extracted features [6] and raw vibration data [7]. In addition, for scenarios where labels are lacking, few-shot [8] and transfer learning methods are currently being studied [5,9,10]. Yet, these methods are highly dependent on data for training and testing. Currently, there exist different datasets that include high-quality data with a number of different fault scenarios, both artificially induced and naturally occurring. Despite this, the most significant issue with the currently available data is that few datasets contain data from a real industrial context. Given the lack of available data, it is unclear to what extent methods built in a laboratory environment work in an industrial environment [4,5]. In addition, there may be characteristics of the data in the industrial environment that are important to consider when building methods for bearing faults, which are currently unknown. Therefore, this study aims to describe a completely new bearing-fault dataset from an industrial environment.
To achieve this, this study presents 10 different cases of different bearing faults, including ball, inner, and outer faults, as well as 1 case where an external event affects the vibration signal.
2. Extended Background
Several datasets have been published containing bearing faults. This includes the IMS dataset [11], the Paderborn University (PU) dataset [12,13], the Case Western Reserve University (CWRU) dataset [14], the Pronostia dataset [15], the Society for Machinery Failure Prevention Technology (MFPT) dataset [16], the Southeast University (SEU) dataset [17,18], the HUST dataset [19,20], and the time-varying dataset from Ottawa University [21]. As can be seen in Table 1, these datasets contain faults that have either been artificially induced, such as the CWRU and HUST datasets, or are naturally occurring such as the PU dataset. In addition, there are differences in how the datasets have been constructed. The IMS and Paderborn datasets have a run-to-failure setup, where the dataset for a single bearing contains all the data for its lifespan, starting from normal behaviour to failure. This differs from, for example, the CWRU and HUST datasets, which only contain data on faults and normal behaviour. Furthermore, these datasets contain data on bearings with different sizes, loads, and speeds. Overall, they cover a variety of different scenarios for different types of applications.
As all of the above-mentioned datasets were created in a controlled laboratory environment, high-quality data can be obtained that are also easily verifiable and arguable, making them suitable for benchmark applications. This means, for example, that they provide data with a high sampling rate and also that the faults have been clearly documented. However, the major issue with only using laboratory-based data is that the data found in an industrial environment may be different [4,5]. In this scenario, methods that perform well on the currently available data may not perform well in reality. It is, therefore, of great importance to make industrial data available not only to characterise the data but also to enable the use of data from the environment in which the methods are intended to be used. To achieve this, this paper will describe a new dataset for bearing faults from an industrial environment.
3. Experiment
3.1. Setup
To identify different cases and describe key traits of real industrial data, historical cases of bearing faults at a pulp mill factory were evaluated. The evaluation was based on data between 2019 and the end of 2022, and cases including bearings that showed clear signs of faults were selected. This was verified by both (when available) analyses of the faulty bearing when changed and by manually analysing the data prior to the bearing being changed.
Ultimately, 11 different cases were identified, which are summarised in Table 2. For each case, we provide two datasets: one with a period of four months of normal data, called the training dataset, and one with a period of four months prior to the bearing being changed because of a defect, called the test dataset. An exception was made when data from less than four months were available before the change; in such cases, all available data were used. In addition, the last bearing (bearing 11) contained a fault that was not related to a bearing but was included as an example of external events being present, as described in Section 4.3. The period prior to the change of the bearing either contained both normal and faulty data or only faulty data, depending on the fault development. The normal data were collected after the change of the bearing to ensure that no fault was present in the bearing. For all datasets, when available, both the drive-side and free-side measurements were collected.
3.2. Data Acquisition
The raw vibration was collected using a CMSS 2200 accelerometer, and the rotation speed of the shaft was collected using the inductive tachometer IFM IFS286. The data were logged using an IMx-8 unit.
3.3. Dataset Design
All datasets were in .mat format and structured consistently, as described in Table 3. Apart from the raw data, the datasets contained the fault frequencies of the bearing, the date of each measurement, the sampling rate for each measurement, the rotation speed of the shaft, and the label for each measurement. In some cases, such as for bearings 1 and 3, the sampling rate was low. However, in those scenarios, the measurement time was high and the defect frequencies of the bearing were low, meaning that a significant amount of rotations were still recorded in the measurements. Overall, the lowest number of multiples of the inner ring (the component with the highest defect frequency) considering each measurement and the sampling rate of all cases was around 38, and the average was 50. The labels were set based on manual analyses of the data. This was achieved by analysing the fault frequencies in relation to the enveloped frequency spectrum, which was created using the Hilbert transform and Fast Fourier Transform (FFT). The FFT is a simple method that has been used to detect faults in vibration data in previous studies such as [12,22]. For all measurements, when the machine was turned off or when no shaft speed was recorded, the label was set to −1. For normal conditions, it was set to 0, and for a fault condition, it was set to the specific fault type, which was 1 for an inner-ring fault, 2 for a ball fault, and 3 for an outer-ring fault. In cases where signs of multiple faults were observed, the most distinct fault class was selected. In scenarios where the shaft speed was missing, the value was set to 0.
3.4. Limitations
In contrast to publicly available datasets built in laboratories, there were inconsistencies in the sampling rate and sampling time. Unfortunately, this meant that in some cases, the sampling rate was significantly lower than what was recommended by previous research [22]. Furthermore, as it was impossible to know exactly when faults started showing in the bearing without visually examining it, some labels were likely incorrect in terms of the start and end dates. Setting labels based on manual analyses also introduced the possibility of errors, meaning that the labels may have slight inaccuracies. Despite these limitations, it was our ambition to publish the data as they are, with the motivation that similar challenges are expected in other industrial cases.
4. Analysis of Data
Regarding the observations related to the data collected from the industrial environment, some interesting aspects were identified. These included fault development, variations in operating conditions, external events, and the sparsity of faults.
4.1. Fault Development
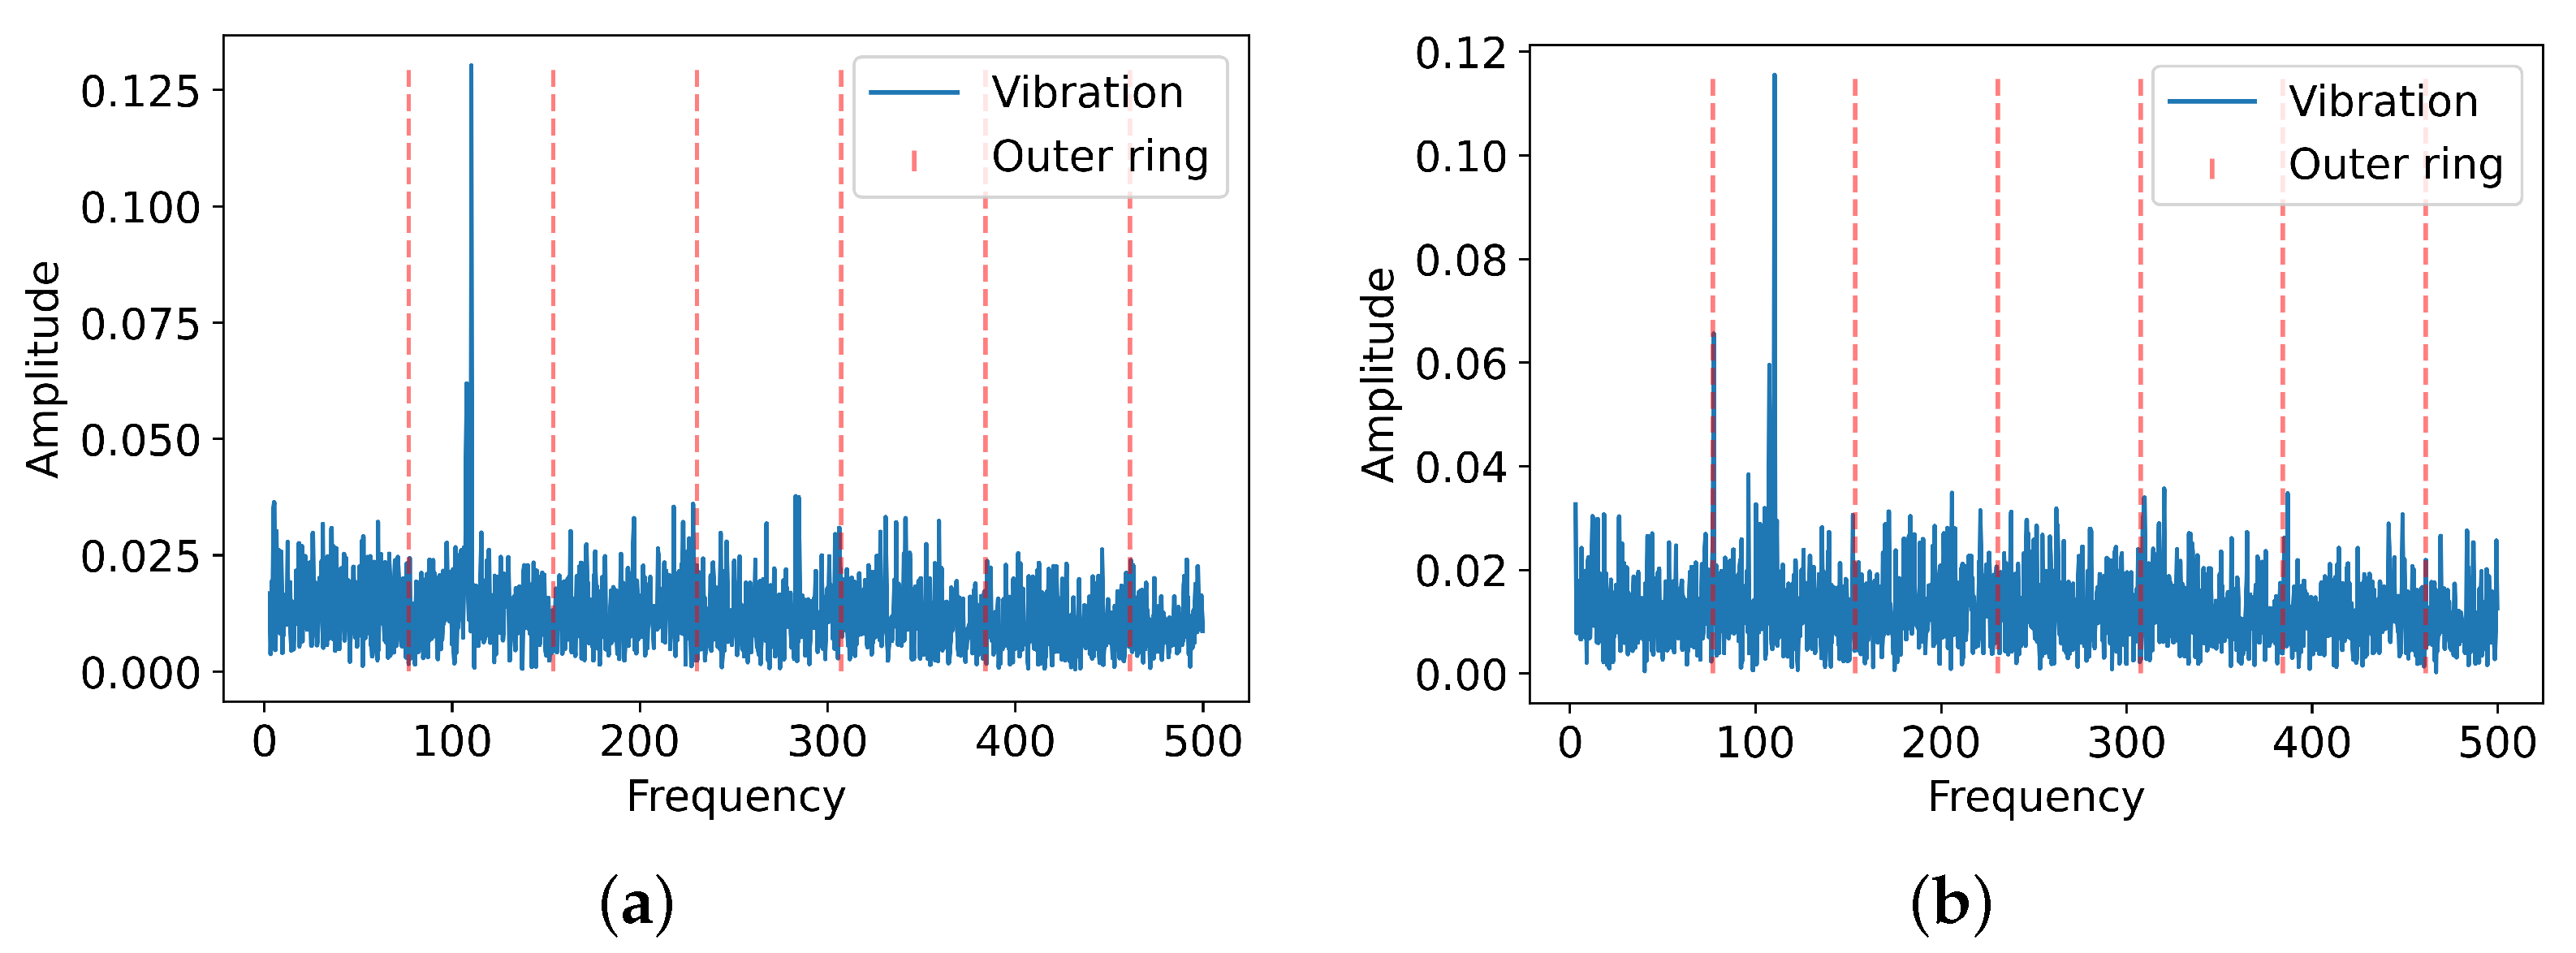
One aspect identified was the differences in the fault development time, as can be observed in Figure 1. This was analysed using the same method as the labelling procedure, that is, the enveloped frequency spectrum constructed by the Hilbert transform and FFT. In most cases, the development was slow, meaning that no apparent changes in the damage were seen during the last few months before the change of the bearing, such as the fault in bearing 1. Figure 2a shows the data from the first reading of the test dataset, and Figure 2b shows the last reading from the test dataset. As can be seen, there were no apparent differences in the data.
However, in other cases, such as bearing 8, the fault developed quickly and progressed from no damage to severe damage in a matter of days before it was changed. This can be observed in Figure 3. Figure 3a shows the measurements taken around 7 days before the bearing was changed. As can be seen, no clear fault can be seen in the data. Figure 3b illustrates the measurements taken around 6 days prior to the change, and the initial signs of an outer fault can be observed. Lastly, Figure 3c shows the last measurements taken before the change, and at that time, clear signs of an outer fault are visible. The significant differences in the fault development time among the different cases highlight the challenge of predicting the remaining useful life of bearings in an industrial environment.
4.2. Variations in Operating Conditions
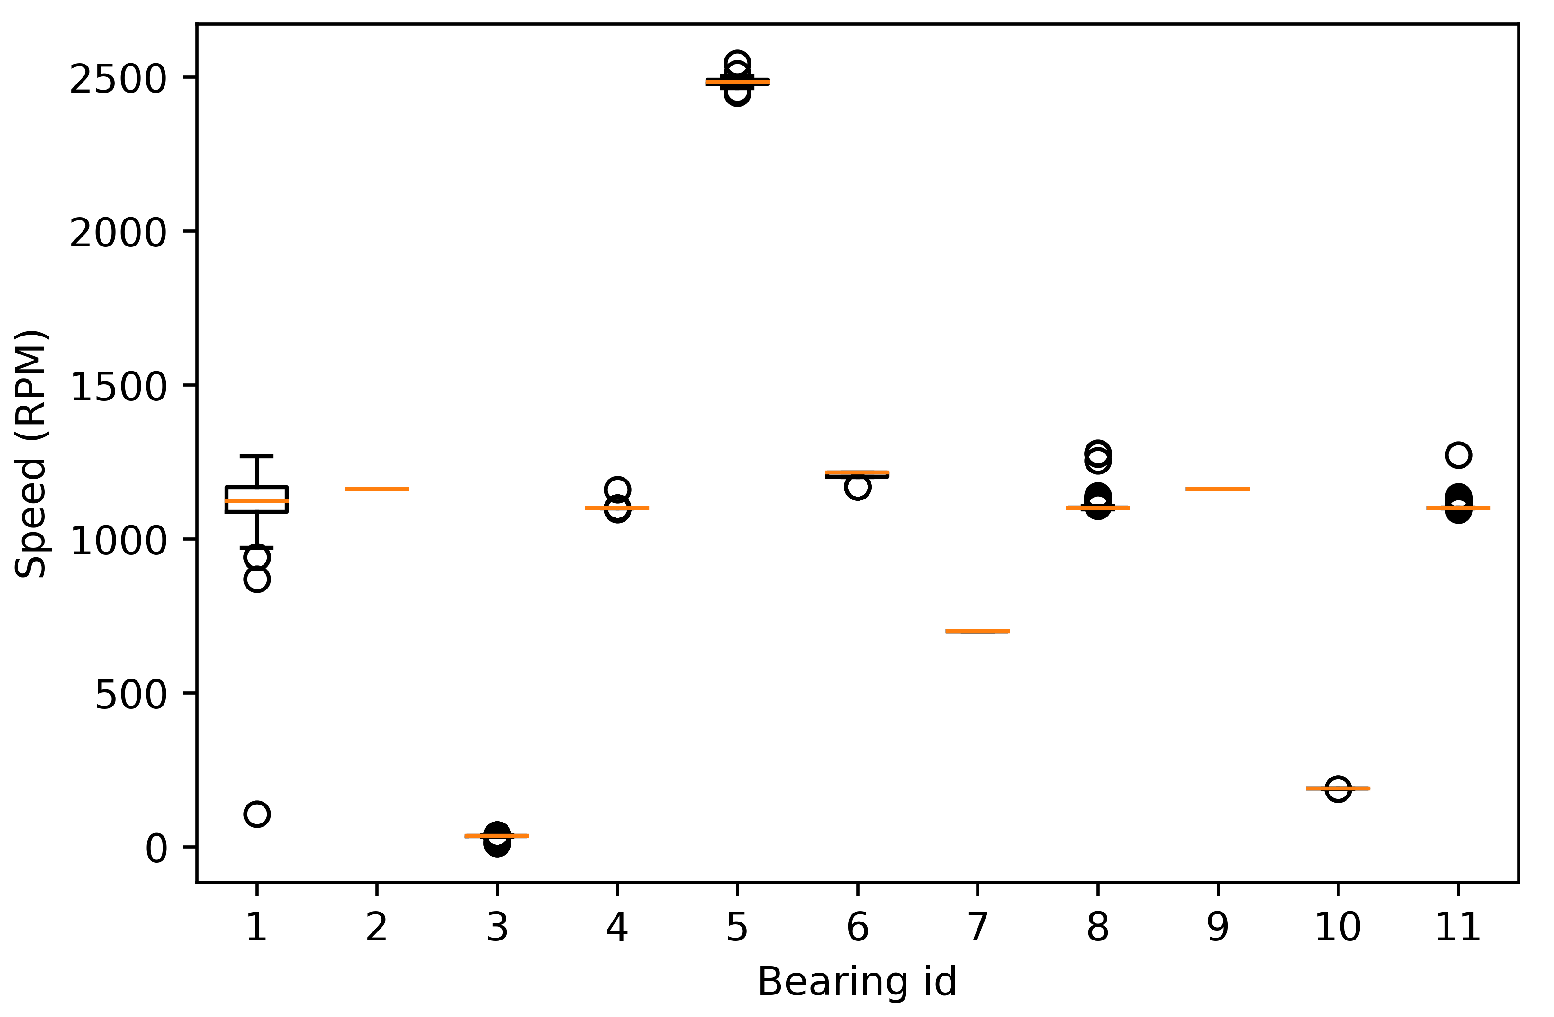
Another aspect identified by inspecting the different cases was the variations in operating conditions. These conditions encompass the differences in the load and rotating speed of the shaft, which have been considered in the currently available datasets [12,14,21], as well as noise. Firstly, the rotation speed ranged from slow rotation to fast rotation, and from fixed speed to varying speed, which can be seen in Figure 4. In terms of analysing the variations in the noise and load, since the actual levels were unknown, we used the root mean square (RMS) value of the normal data for the different cases as an indicator. We used this measurement because it can provide an overview of the amplitude of the vibration signal [23]. As shown in Figure 5, there were variations in the amplitude of the vibration signal among the bearings, which can be attributed in part to the different loads and noise levels.
4.3. External Events
External events were another parameter of interest identified in the data from the industrial environment. These were events that caused the signal to change from its normal appearance, without any bearing fault being present. This can, for example, be an event related to another type of fault such as a shaft imbalance or vibrations caused by changes made in the production process. An example is bearing 11, which is shown in Figure 6a, where an imbalance caused the signal to significantly shift from its normal behaviour, which is shown in Figure 6b. This is important because it means that methods built for bearing-fault detection need to be able to handle faults that are present in the data but not directly linked to a faulty bearing.
In addition, in several of the cases considered but not included in the published data, missing speed data readings, as well as missing vibration data, were observed, which could potentially affect the accuracy of the analysis and likely need to be managed in applications intended for industrial environments.
4.4. Sparsity of Faults
The last aspect identified was the sparsity of faults. In this study, we were able to access readings from a large number of bearings from the factory, and during the four-year period, only a few had been changed due to defects (we are not allowed to disclose the exact number). In all cases, there was an abundance of normal data but no historical data on faults for each bearing were available. This highlights the importance of finding generic solutions for bearing-fault detection and prognostics. These solutions should be capable of achieving high accuracy on completely new data, without relying on prior knowledge of fault scenarios from the target domain. Additionally, it means that evaluation methods should be formulated so that they heavily penalise false positives in the normal data.
5. Comparison to Currently Available Datasets
The analysis of the described dataset confirms the findings of previous studies that industrial data are heterogeneous [4,5]. In contrast to the current publicly available datasets from the laboratory environment, where the same bearing position is used and only the controlled parameters vary across setups, all cases in the described dataset originate from different equipment in the factory, each with a different setup. This suggests that few, if any, assumptions can be made about the data obtained from the industrial environment. Because of the lack of previously published bearing datasets under these circumstances, it is still unclear to what extent the variations in the conditions in an industrial environment can be replicated in a laboratory environment. Considering this, as has been highlighted by, for example [4,5], it is of great interest for future research to evaluate the extent to which methods can be developed to generalise knowledge from the laboratory environment, where it is easy to obtain high-quality data, and use it in the industrial environment. It is our hope that the described dataset can contribute to a better understanding of this possibility and support advancements in this field.
6. Conclusions
The purpose of this study was to describe a new dataset obtained from an industrial environment. To achieve this, 10 different bearings with faults and 1 scenario, where an external event significantly altered the vibration signal from its normal state, were described. This study found that the data from the industrial environment varied significantly in terms of fault development, rotation speed, and the normal level of the amplitude of the vibration signal. Furthermore, the analysis of the data showed that external events can occur in an industrial environment, which makes the vibration signal differ from its normal state, without being related to any bearing fault. Lastly, this study found that faults in this environment were rare and that historical examples of faults in the target domain cannot be expected when building fault-detection and prognostic methods.
Author Contributions
Conceptualisation, A.L. and M.O.; methodology, A.L.; software, A.L.; validation, A.L.; formal analysis, A.L.; investigation, A.L.; resources, A.L.; data curation, A.L.; writing—original draft preparation, A.L.; writing—review and editing, A.L. and M.O.; visualisation, A.L.; supervision, M.O.; project administration, M.O.; funding acquisition, M.O. All authors have read and agreed to the published version of the manuscript.
Funding
This work was supported in part by The Knowledge Foundation (kks.se) within the industrial graduate school Smart Industry Sweden.
Institutional Review Board Statement
Not applicable.
Informed Consent Statement
Not applicable.
Data Availability Statement
The data presented in this study are available at doi:10.17632/tdn96mkkpt.1 (accessed on 1 June 2023).
Acknowledgments
The authors would like to thank SCA for providing the data.
Conflicts of Interest
The authors declare no conflict of interest.
References
- Bonnett, A.H.; Yung, C. Increased Efficiency Versus Increased Reliability. IEEE Ind. Appl. Mag. 2008, 14, 29–36. [Google Scholar] [CrossRef]
- El-Thalji, I.; Jantunen, E. A summary of fault modelling and predictive health monitoring of rolling element bearings. Mech. Syst. Signal Process. 2015, 60–61, 252–272. [Google Scholar] [CrossRef]
- Neupane, D.; Seok, J. Bearing Fault Detection and Diagnosis Using Case Western Reserve University Dataset with Deep Learning Approaches: A Review. IEEE Access 2020, 8, 93155–93178. [Google Scholar] [CrossRef]
- Hakim, M.; Omran, A.A.B.; Ahmed, A.N.; Al-Waily, M.; Abdellatif, A. A systematic review of rolling bearing fault diagnoses based on deep learning and transfer learning: Taxonomy, overview, application, open challenges, weaknesses and recommendations. Ain Shams Eng. J. 2022, 14, 101945. [Google Scholar] [CrossRef]
- Zhang, S.; Zhang, S.; Wang, B.; Habetler, T.G. Deep Learning Algorithms for Bearing Fault Diagnostics—A Comprehensive Review. IEEE Access 2020, 8, 29857–29881. [Google Scholar] [CrossRef]
- Cui, B.; Weng, Y.; Zhang, N. A feature extraction and machine learning framework for bearing fault diagnosis. Renew. Energy 2022, 191, 987–997. [Google Scholar] [CrossRef]
- Han, T.; Zhang, L.; Yin, Z.; Tan, A.C.C. Rolling bearing fault diagnosis with combined convolutional neural networks and support vector machine. Measurement 2021, 177, 109022. [Google Scholar] [CrossRef]
- Zhang, A.; Li, S.; Cui, Y.; Yang, W.; Dong, R.; Hu, J. Limited Data Rolling Bearing Fault Diagnosis with Few-Shot Learning. IEEE Access 2019, 7, 110895–110904. [Google Scholar] [CrossRef]
- Zhao, Z.; Zhang, Q.; Yu, X.; Sun, C.; Wang, S.; Yan, R.; Chen, X. Applications of Unsupervised Deep Transfer Learning to Intelligent Fault Diagnosis: A Survey and Comparative Study. IEEE Trans. Instrum. Meas. 2021, 70, 1–28. [Google Scholar] [CrossRef]
- Zheng, H.; Yang, Y.; Yin, J.; Li, Y.; Wang, R.; Xu, M. Deep Domain Generalization Combining A Priori Diagnosis Knowledge Toward Cross-Domain Fault Diagnosis of Rolling Bearing. IEEE Trans. Instrum. Meas. 2021, 70, 1–11. [Google Scholar] [CrossRef]
- Lee, J.; Qiu, H.; Lin, J.; Technical Services. Bearing Data Set. 2007. Available online: https://www.nasa.gov/content/prognostics-center-of-excellence-data-set-repository (accessed on 1 January 2023).
- Lessmeier, C.; Kimotho, J.K.; Zimmer, D.; Sextro, W. Condition Monitoring of Bearing Damage in Electromechanical Drive Systems by Using Motor Current Signals of Electric Motors: A Benchmark Data Set for Data-Driven Classification. In Proceedings of the PHM Society European Conference, Bilbao, Spain, 5–8 July 2016; Volume 3, pp. 1–17. [Google Scholar] [CrossRef]
- Konstruktions- und Antriebstechnik (KAt)—Bearing DataCenter (Universität Paderborn). Available online: https://mb.uni-paderborn.de/kat/forschung/datacenter/bearing-datacenter/ (accessed on 14 March 2023).
- Case Western Reserve University (CWRU) Bearing Data Center. Available online: https://engineering.case.edu/bearingdatacenter/download-data-file (accessed on 14 March 2023).
- Nectoux, P.; Gouriveau, R.; Medjaher, K.; Ramasso, E.; Chebel-Morello, B.; Zerhouni, N.; Varnier, C. PRONOSTIA: An experimental platform for bearings accelerated degradation tests. In Proceedings of the IEEE International Conference on Prognostics and Health Management, Denver, CO, USA, 18–21 June 2012. [Google Scholar]
- Society for Machinery Failure Prevention Technology (MFPT). Fault Data Set. Available online: https://www.mfpt.org/fault-data-sets/ (accessed on 24 March 2023).
- Shao, S.; McAleer, S.; Yan, R.; Baldi, P. Highly Accurate Machine Fault Diagnosis Using Deep Transfer Learning. IEEE Trans. Ind. Inform. 2019, 15, 2446–2455. [Google Scholar] [CrossRef]
- Shao, S.; McAleer, S.; Yan, R.; Baldi, P. Mechanical Dataset. Available online: http://mlmechanics.ics.uci.edu./ (accessed on 14 March 2023).
- Thuan, N.D.; Hong, H.S. HUST bearing: A practical dataset for ball bearing fault diagnosis. arXiv 2023, arXiv:2302.12533. [Google Scholar]
- Hong, H.S.; Thuan, N. HUST Bearing. Available online: https://data.mendeley.com/datasets/cbv7jyx4p9 (accessed on 15 February 2023).
- Huang, H.; Baddour, N. Bearing vibration data collected under time-varying rotational speed conditions. Data Brief 2018, 21, 1745–1749. [Google Scholar] [CrossRef] [PubMed]
- Smith, W.A.; Randall, R.B. Rolling element bearing diagnostics using the Case Western Reserve University data: A benchmark study. Mech. Syst. Signal Process. 2015, 64–65, 100–131. [Google Scholar] [CrossRef]
- Mohd Ghazali, M.H.; Rahiman, W. Vibration Analysis for Machine Monitoring and Diagnosis: A Systematic Review. Shock Vib. 2021, 2021, e9469318. [Google Scholar] [CrossRef]
Figure 1.
The fault development time for each bearing in the test dataset.

Figure 2.
(a) Measurements four months prior to bearing change for bearing 1. Symptoms of the inner-ring fault are shown. (b) Last measurements before bearing change. The same symptoms of the inner-ring fault are shown.
Figure 2.
(a) Measurements four months prior to bearing change for bearing 1. Symptoms of the inner-ring fault are shown. (b) Last measurements before bearing change. The same symptoms of the inner-ring fault are shown.

Figure 3.
(a) Measurement around 6 days prior to bearing change for bearing 8. No symptoms are shown. (b) The first symptom of outer ring fault around 5 days before bearing change. (c) Last measurement before bearing change. Clear symptoms of an outer ring fault.
Figure 3.
(a) Measurement around 6 days prior to bearing change for bearing 8. No symptoms are shown. (b) The first symptom of outer ring fault around 5 days before bearing change. (c) Last measurement before bearing change. Clear symptoms of an outer ring fault.


Figure 4.
The speed of the rotating axle for each bearing in the training data.

Figure 5.
The root mean square (RMS) of the vibration measurements for each bearing in the training data.
Figure 5.
The root mean square (RMS) of the vibration measurements for each bearing in the training data.

Figure 6.
(a) Example for bearing 11, where the signal significantly shifted from its normal behaviour but is not related to the bearing. The upper figure shows the time signal and the lower figure shows the envelope spectrum. (b) The normal behaviour of bearing 11. The upper figure shows the time signal and the lower figure shows the envelope spectrum.


Table 1.
Overview of public datasets.
| Dataset | Environment | Fault Type |
|---|---|---|
| IMS [11] | Laboratory | Natural |
| CWRU [14] | Laboratory | Artificial |
| Pronostia [15] | Laboratory | Natural |
| PU [12,13] | Laboratory | Artificial and natural |
| HUST [19,20] | Laboratory | Artificial |
| MPFT [16] | Laboratory and three cases with industrial data | Artificial and natural |
| SEU [17,18] | Laboratory | - |
| Ottawa [21] | Laboratory | Artificial |
Table 2.
Overview of the different cases.
| ID | Bearing | Sampling Rate (Hz) | Placement | Placement Side | Fixed Speed | Average Rotation Speed (RPM) | Fault Type |
|---|---|---|---|---|---|---|---|
| 1 | SKF 22320 E | 640 | Wire roller | DS | No | 1120.6 | Inner ring |
| 2 | SKF 6310 | 5120 | Engine | DS | Yes | 1162.0 | Outer ring |
| 3 | SKF 6310 | 512 | Wire roller | FS | No | 34.6 | Inner ring |
| 4 | SKF NU328 E | 8192 | Pump | FS | No | 1100.3 | Inner ring |
| 5 | SKF 7312 BEAP | 12,800 | Pump | DS | No | 2483.5 | Ball |
| 6 | SKF NU328 E | 6400 | Pump | FS | No | 1208.2 | Inner ring |
| 7 | SKF 7221 BECBY | 4096 | Strainer | Upper | Yes | 700 | Inner ring |
| 8 | SKF 6228 | 5120 | Engine | DS | No | 1105.9 | Outer ring |
| 9 | SKF 6310 | 5120 | Engine | DS | Yes | 1162.0 | Outer ring |
| 10 | SKF NU316 ECP | 5120 | Engine | DS | No | 189.3 | Outer ring |
| 11 | SKF 6228 | 5120, 12,800 | Engine | FS | No | 189.3 | Not bearing related |
Table 3.
Data structure.
| Field | Data Type | Description |
|---|---|---|
| id | Integer | The identification of the bearing. |
| assetDescription | String | Description of the asset that the bearing is part of. |
| faultOrigin | String | The placement of the fault, for example, DS. |
| faultType | Integer | Fault type for the dataset: 0 for no fault, 1 for an inner-ring fault, 2 for a ball fault, and 3 for an outer-ring fault. |
| fromDate | String | Start date of the dataset. |
| toDate | String | End date of the dataset. |
| fixedSpeed | Integer | 1 if fixed speed and 0 if not fixed speed. |
| <placement> | Object | Contains data for a certain placement of a bearing. A dataset can have one or two bearing placements. Values can be “DS”, “FS”, “upper”, “lower”. |
| <placement>.assetName | String | Bearing type, for example, SKFNU322E. |
| <placement>.faultFrequencies | Array | The shaft speed (in Hz) multiples for the fault frequencies FTF, BPF, BPFI, and BPFO. |
| <placement>.unit | String | The unit for the vibration signal. |
| <placement>.rawData | Array | The raw vibration measurements. |
| <placement>.samplingRate | Array | The sampling rate for each measurement. |
| <placement>.RPM | Array | The shaft speed in RPM for each measurement. |
| <placement>.time | Array | The time for each measurement. |
| <placement>.label | Array | Label for each measurement: −1 for when the machine was turned off, 0 for normal, 1 for inner fault, 2 for ball fault, and 3 for outer fault. |
Disclaimer/Publisher’s Note: The statements, opinions and data contained in all publications are solely those of the individual author(s) and contributor(s) and not of MDPI and/or the editor(s). MDPI and/or the editor(s) disclaim responsibility for any injury to people or property resulting from any ideas, methods, instructions or products referred to in the content. |
© 2023 by the authors. Licensee MDPI, Basel, Switzerland. This article is an open access article distributed under the terms and conditions of the Creative Commons Attribution (CC BY) license (https://creativecommons.org/licenses/by/4.0/).
Share and Cite
MDPI and ACS Style
Lundström, A.; O’Nils, M. Factory-Based Vibration Data for Bearing-Fault Detection. Data 2023, 8, 115. https://doi.org/10.3390/data8070115
AMA Style
Lundström A, O’Nils M. Factory-Based Vibration Data for Bearing-Fault Detection. Data. 2023; 8(7):115. https://doi.org/10.3390/data8070115
Chicago/Turabian StyleLundström, Adam, and Mattias O’Nils. 2023. "Factory-Based Vibration Data for Bearing-Fault Detection" Data 8, no. 7: 115. https://doi.org/10.3390/data8070115