Data Descriptor

VEPL Dataset: A Vegetation Encroachment in Power Line Corridors Dataset for Semantic Segmentation of Drone Aerial Orthomosaics

by
Mateo Cano-Solis
*,
John R. Ballesteros
and
John W. Branch-Bedoya
Facultad de Minas, Universidad Nacional de Colombia, Medellín 050041, Colombia
*
Author to whom correspondence should be addressed.
Data 2023, 8(8), 128; https://doi.org/10.3390/data8080128
Submission received: 5 April 2023 / Revised: 10 June 2023 / Accepted: 27 June 2023 / Published: 4 August 2023
(This article belongs to the Section Spatial Data Science and Digital Earth)

Abstract

:
Vegetation encroachment in power line corridors has multiple problems for modern energy-dependent societies. Failures due to the contact between power lines and vegetation can result in power outages and millions of dollars in losses. To address this problem, UAVs have emerged as a promising solution due to their ability to quickly and affordably monitor long corridors through autonomous flights or being remotely piloted. However, the extensive and manual task that requires analyzing every image acquired by the UAVs when searching for the existence of vegetation encroachment has led many authors to propose the use of Deep Learning to automate the detection process. Despite the advantages of using a combination of UAV imagery and Deep Learning, there is currently a lack of datasets that help to train Deep Learning models for this specific problem. This paper presents a dataset for the semantic segmentation of vegetation encroachment in power line corridors. RGB orthomosaics were obtained for a rural road area using a commercial UAV. The dataset is composed of pairs of tessellated RGB images, coming from the orthomosaic and corresponding multi-color masks representing three different classes: vegetation, power lines, and the background. A detailed description of the image acquisition process is provided, as well as the labeling task and the data augmentation techniques, among other relevant details to produce the dataset. Researchers would benefit from using the proposed dataset by developing and improving strategies for vegetation encroachment monitoring using UAVs and Deep Learning.
Dataset License: Licensed under Creative Commons Attribution 4.0 International.

1. Summary

Vegetation encroachment in power line corridors is a relatively new field of research. In 2012, [1] carried out a study where interruptions to the transmission and distribution of electric power from vegetation encroachment were documented as one of the most common cases of interruption, generating problems mainly in plants and industries. Some of the statistics presented in this study that was carried out in Malaysia are as follows: About 18% of the power cuts that had been generated in the country were related to vegetation that had come into contact with the transmission lines, becoming the third cause of power cuts in the country. In 2003, the United States and Canada, with nearly 50 million users, representing 11% of the population of both countries, suffered power cuts due to invasion by vegetation onto power lines. In the same year, in Italy and Switzerland, about 60 million users were left without a power supply. In more recent studies, such as [2], the authors identified the costs generated by 30 min of disconnection in a medium–large company to be USD 16,500, which equates to approximately USD 94,000 for an 8 h suspension.
The authors in [2] mentioned the techniques that are available to review invasions on transmission lines. These techniques are field trips through visual inspection, aerial surveillance, aerial multispectral imaging, and LiDAR scanning. They present different disadvantages, such as high costs, inaccuracy, operation complexity, and time consumption. In particular, for field trips, there is the difficulty of making long journeys and problems related to terrain conditions. For this reason, the same authors encourage Deep Learning to be applied for transmission line inspection tasks, where a combination of these techniques with drones can fulfill multiple tasks, all of which are necessary for transmission networks, ensuring low costs, efficiency, and the ability to obtain images with higher resolutions. Optical images obtained by drones are the best option for the collection of information, due to their ease of collection and analysis and the value they generate by detecting a wide range of common and component failures. They show that the invasion by vegetation is one of the most challenging areas and, where there is less research, recommend the use of automatic flows that combine the tasks of line detection and treatment of the “background” of the image.
Despite all the advantages of using UAV imagery and Deep Learning, there is a lack of datasets that allows neural networks for semantic segmentation to be trained. Deep Learning models applied in this field need to solve multiple challenges, such as the following:
  • The power line corridor class has a very low pixel percentage versus the vegetation and the background classes, and also, due to the embedding vector similarity of objects in neural networks, and the difference in geometry between the vegetation class (polygon) and power line corridors (lines), it becomes a challenge to train [3];
  • The vegetation class is only one, but an extensive variety exists, with different colors, shapes, and heights;
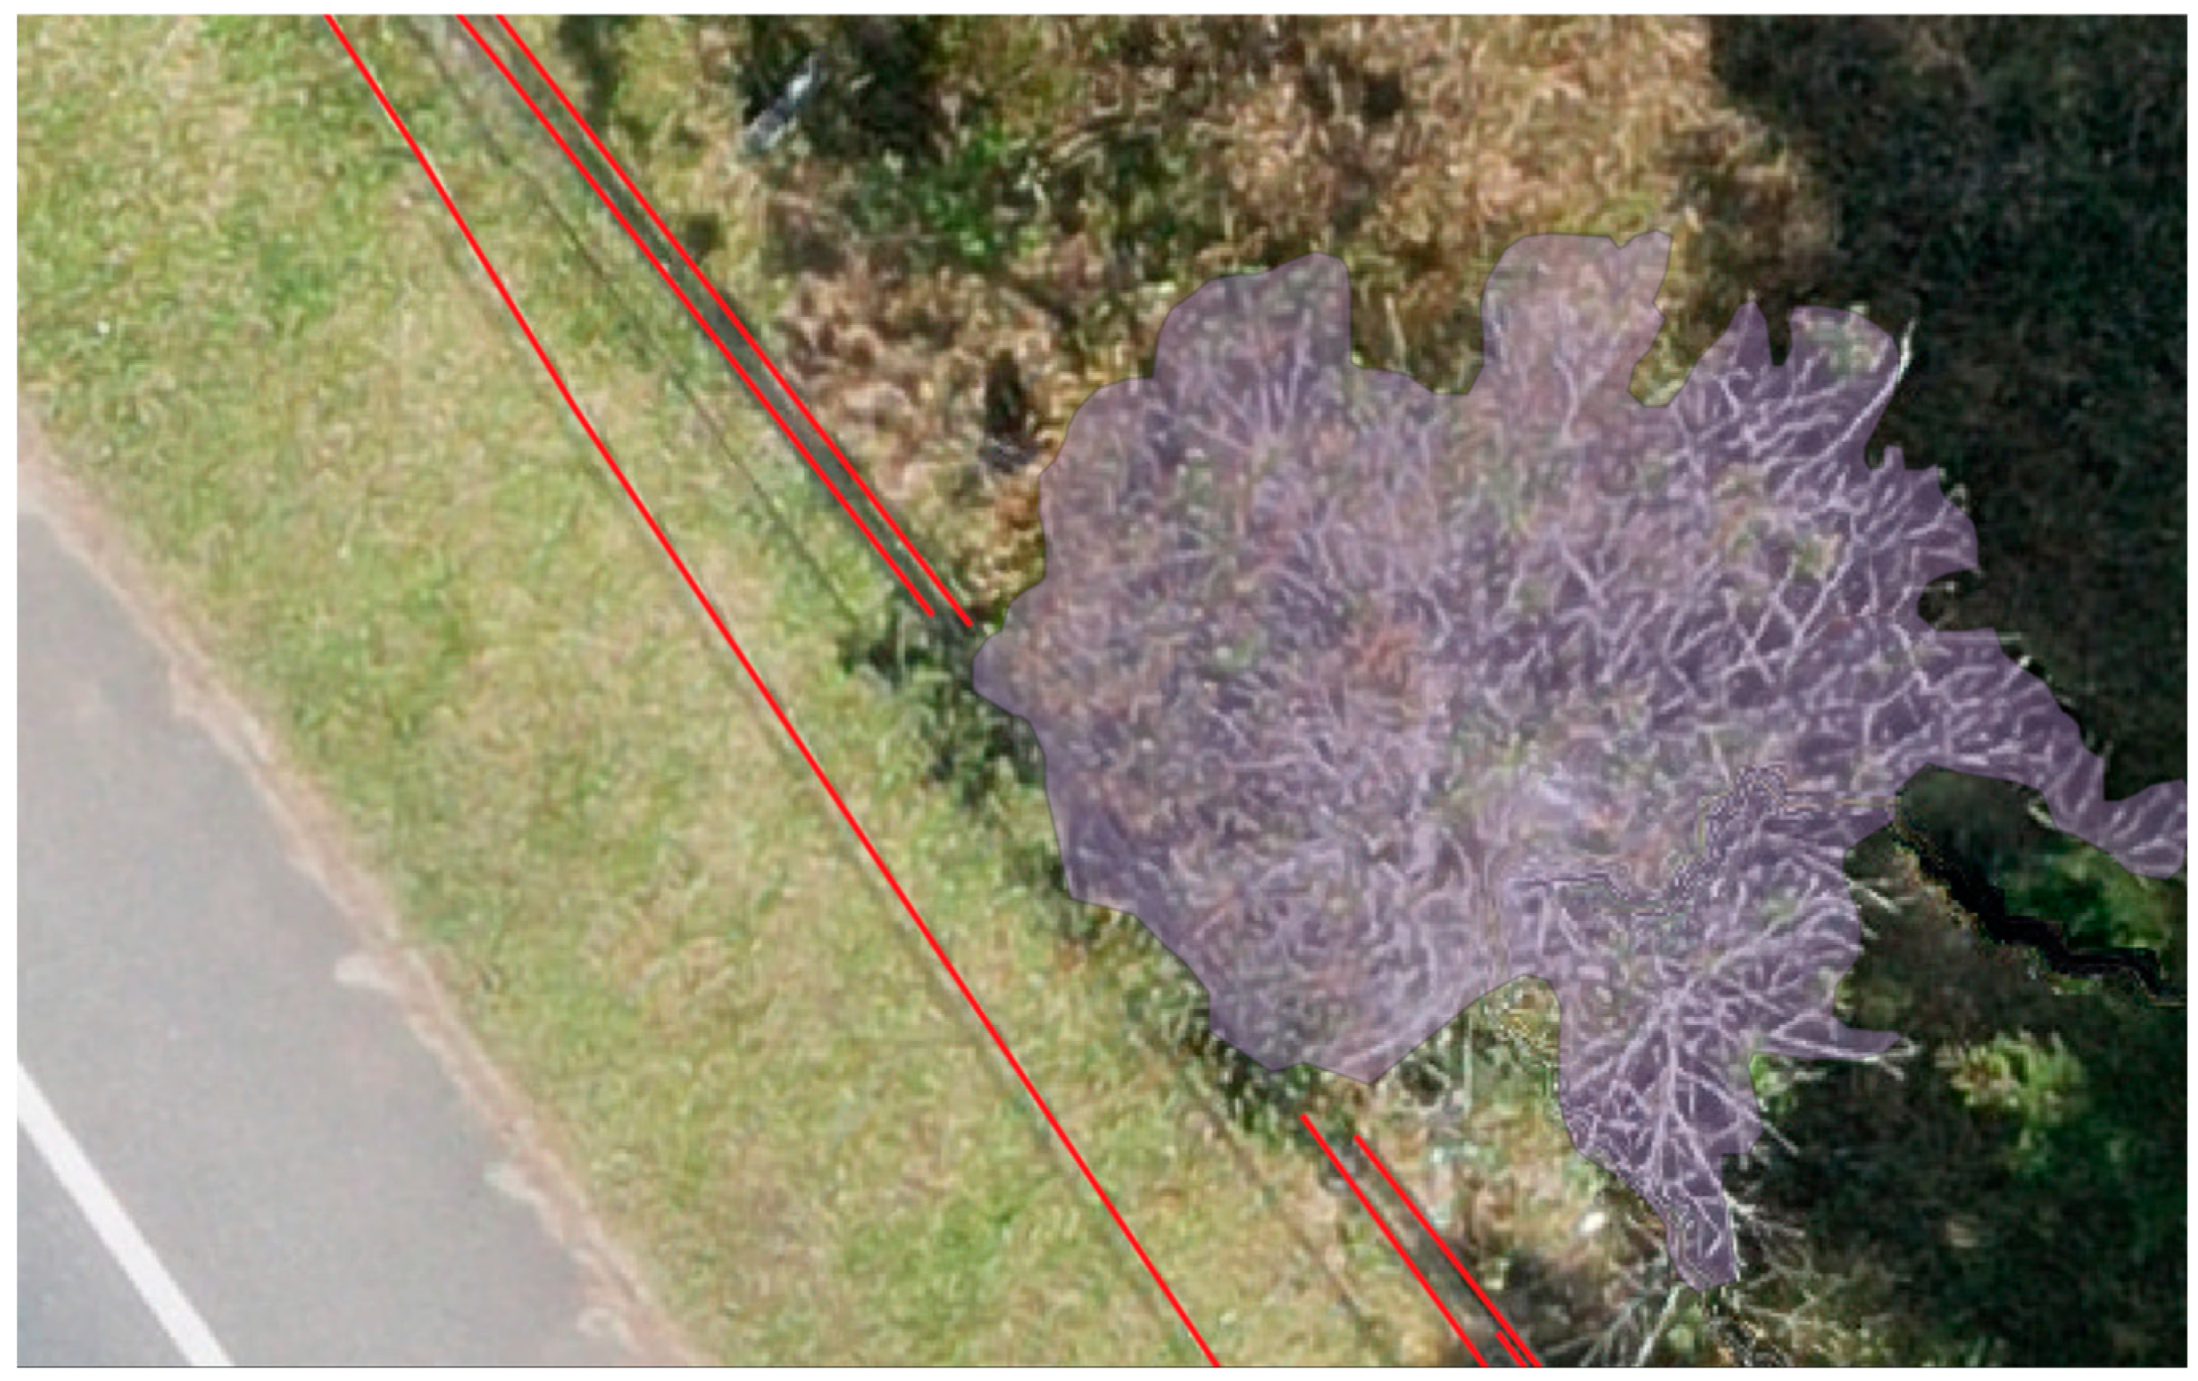
  • There are many cases where power lines overlap vegetation, making semantic segmentation more complicated.
Research studies have developed and used power lines datasets produced with other techniques; for instance, [4] used a LiDAR sensor mounted in a UAV to perform a mapping survey in the Malaposta quarry. With the resultant LiDAR cloud, they created an algorithm able to segment an input 3D point cloud into power line polylines. In [5], the authors developed a dataset of ground images using a conventional camera, simulated a vegetation encroachment onto a power line, and varied the distance and range of the camera vision. The authors in [6] used a real-word industry dataset composed of power tower images and associated condition ratings; this dataset was taken by helicopter inspection surveys of electricity lines. The authors in [7] proposed a dataset using high-resolution satellite images, where the labels show whether each pixel is part of a tree or not; this dataset was used for mapping vegetation risk along the power lines. In [8], the authors worked with satellite images from three sources; namely: Google Maps, Google Earth, and ESRI Imagery, and with different resolutions and scales, they collated images with high-density and low-density vegetation regions along a power line corridor. The authors in [9] constructed a dataset for transmission lines with four categories: insulators, fault insulators, hammers, and fault hammers. Due to the unavailability of power line datasets, [10] rendered synthetic images of power lines using the Physically Based Rendering (PBR) approach and performed a series of data augmentation techniques to generate more training data. In [11], the authors used an unmanned helicopter LiDAR system and created two datasets; primary objects in both datasets included transmission lines, high forest trees, and a few low-rise buildings. Power companies possess datasets for component fault detection, and for the recognition of insulators, towers, and conductors, all of which are summarized in [12]. The authors in [7] produced a dataset using high-resolution satellite imagery, where the labels show whether or not every pixel is part of a tree; this dataset was used for mapping vegetation encroachment along the power lines. In [8], the authors worked with satellite images of different spatial resolutions and sources like Google Maps, Google Earth, and ESRI. They collected images containing high-density and low-density vegetation regions along power line corridors. Also, in [7], the costs of using drones, airplanes, and helicopters to inspect power lines were compared, and calculated from EUR 60 to 1300 per linear kilometer of power line. The authors also mentioned the disadvantages of using satellite imagery, such as the low resolution, which hinders providing the details needed to detect vegetation encroachment, and the imagery’s unavailability in certain zones and dates. The proposed dataset in this paper accounts for those inefficiencies and opens the possibility of having up-to-date data of a specific region of interest at a low price, compared with other methods. Figure 1 shows some of the mentioned datasets found in the scientific literature.
Semantic segmentation is a computer vision task, in which every pixel of an image is labeled with a class it belongs to [13]. When an image is parsed, its objects are delineated and tagged [14]. Since it is a classification task, the classes on which the semantic segmentation algorithm is trained are key decisions [15]. In the semantic segmentation datasets, every image is labeled at pixel level into classes, resulting in an image-mask paired set, which is why these types of datasets are also called paired datasets [16].
This paper proposes the VEPL dataset, the Vegetation Encroachment in Power Line Corridors dataset, which consists of images and corresponding masks for three classes: the vegetation, the power lines, and the background. Images were obtained from UAV-generated orthomosaics. The main contributions of this paper are:
  • Providing a dataset of optic images. This was acquired with a consumer-grade UAV, which is an accessible and low-price tool for companies and governments, making it simple to replicate and use Deep Learning techniques [17];
  • Showing a way to obtain a multi-label orthorectified paired dataset, in which image-masks pairs allow the training of Deep Learning models for the semantic segmentation of vegetation encroachment phenomena.
The VEPL dataset is described in the next section.

2. Data Description

The VEPL dataset was obtained through a series of autonomous drone flights, performed at around 30 m height from the ground. The chosen area of interest is located on a secondary road in Envigado, Colombia, South America. The elevation above the sea level of the area is 2500 m, and the predominant vegetation is tropical rainforest, also known as the tropical moist forest [18]. This type of vegetation is characterized by being dense and lush, with tall trees and many plant species.
Similarly to [19], where the authors described a methodology for obtaining a UAV-paired dataset that included multiple steps, we began with UAV imagery acquisition, digitization of objects into layers to produce masks, rasterization of the layers, and finally, tessellation of all rasters. Finally, data augmentation occurs, and an imbalance or empty mask check is executed to obtain the resulting dataset.
The VEPL images were taken along a road, ensuring the inclusion of power lines, which are commonly situated alongside this type of infrastructure. A total distance of 2.4 km was covered along the road. An orthomosaic of the covered area was obtained using commercial photogrammetric software. This orthomosaic was semi-automatically labeled on the screen by digitizing three classes: class 1 (or vegetation), composed of trees and high shrubbery, with an RGB value of (0, 255, 0); class 2 (or power lines), composed of all visible power lines, which means that they are not inferred when hidden under vegetation, with an RGB value of (110, 110, 110); and class 0 (or background), with an RGB value of (0, 0, 0).
The image tessellation into the image mask pairs, with a size of 256 × 256, produced 65,852 examples. However, due to the high presence of the background class alone, it was important to make an imbalance check and remove those image masks with more than 90% of background [19]. After this process, the resultant number of image mask pairs was 3566, where a final check was developed to guarantee the presence of the power line class in all the images, so those pairs that do not have any pixel of this class were deleted. The remaining size of the dataset was 532 image mask pairs. Finally, geometric and spectral augmentation were carried out using the 532 examples, with the aim of improving the generalization ability of deep learning models [20]. The total pairs obtained after geometric augmentation were 3724, while 3192 pairs were the resultant amount for the spectral augmentation. Section 3 describes this process in more detail. Table 1 summarizes the orthomosaics characteristics and the total number of examples per class and orthomosaic. Figure 2 shows examples of images and corresponding multi-class masks of the VEPL dataset.
The dataset is comprised of four folders, one for the original image mask pairs, a second one for the image mask pairs with geometric augmentation, a third one for the image mask pairs with spectral augmentation, and the remaining folder for the original orthomosaics and their corresponding raster masks, in case readers want to create a new or modify the dataset, using for instance, a different tessellation size or data augmentation procedure. Notice that all the image masks are numbered in ascending order. Table 2 summarizes the dataset specifications.

3. Methods

The prevalence of drone orthomosaics is on the rise, owing to their effortless functionality, affordable pricing for both consumer and professional drones, as well as comprehensive methodologies that empower researchers to generate valuable datasets and yield meaningful insights [16,19]. All the processes used to produce the VEPL dataset are presented next.

3.1. Data Acquisition and Processing

The UAV imagery was acquired using a DJI Mavic 2 Pro drone. Autonomous drone flights were conducted with a frontal overlap of 85% and a lateral overlap of 75% to ensure the production of high-quality orthomosaics. Individual images, taken by the drone, were processed in Agisoft Metashape photogrammetric commercial software [21], obtaining the orthomosaics and the digital surface model (DSM). The workflow is based on [19] and summarized in Figure 3, which illustrates the acquisition and processing of images to obtain the orthomosaics and the DSM.
The pixel size of the obtained orthomosaics is between 0.9 and 1.3 cm, this measure is called the Ground Sample Distance (GSD), and it represents the physical pixel size of an image. A GSD of 10 cm is equal to say that a pixel has a spatial extent of 10 cm [16]. Figure 4 zooms in on an orthomosaic and its corresponding DSM.

3.2. Data Labelling

The data labeling process was conducted, making use of the ArcGIS software tools. A polygon GIS layer, in shapefile format (*.shp), was created by manually digitizing every vegetation object. This task was performed at a scale between 1:20 and 1:50 for all the obtained orthomosaics, trying to delineate most of the object’s details and creating an integer field called “Class” with an assigned value of 1. The power line corridors were obtained by applying the buffer GIS tool, with a buffer distance of 3 cm, to the initial lines digitized by hand, generating polygons with a 6 cm width per line. Note that the labeled power lines correspond to only those lines that are visually perceivable by the human eye. This is because power lines hidden under the vegetation were deliberately excluded. The decision not to label power lines occluded by the vegetation was made to avoid misleading Deep Learning models. Including such inferred data could introduce ambiguity and potentially compromise the model’s ability to accurately distinguish between the power lines and the vegetation. Class value 2 was assigned to power line polygons. Figure 5 shows a labeled image, class 1 (the vegetation), and class 2 (the power lines).
The background class (class 0) comprises areas that do not correspond to vegetation, or the power line corridors. The following steps are performed automatically using GIS tools to obtain a raster mask with the same extension of input orthomosaics; this process is repetitive for every available orthomosaic:
  • To create a union between polygons of the vegetation class and the power line corridor class;
  • To use an Identity GIS tool between the previous result and the area of interest. The output is a polygon layer that contains all the 3 classes. Rasterize the previous layer using the “Class” field;
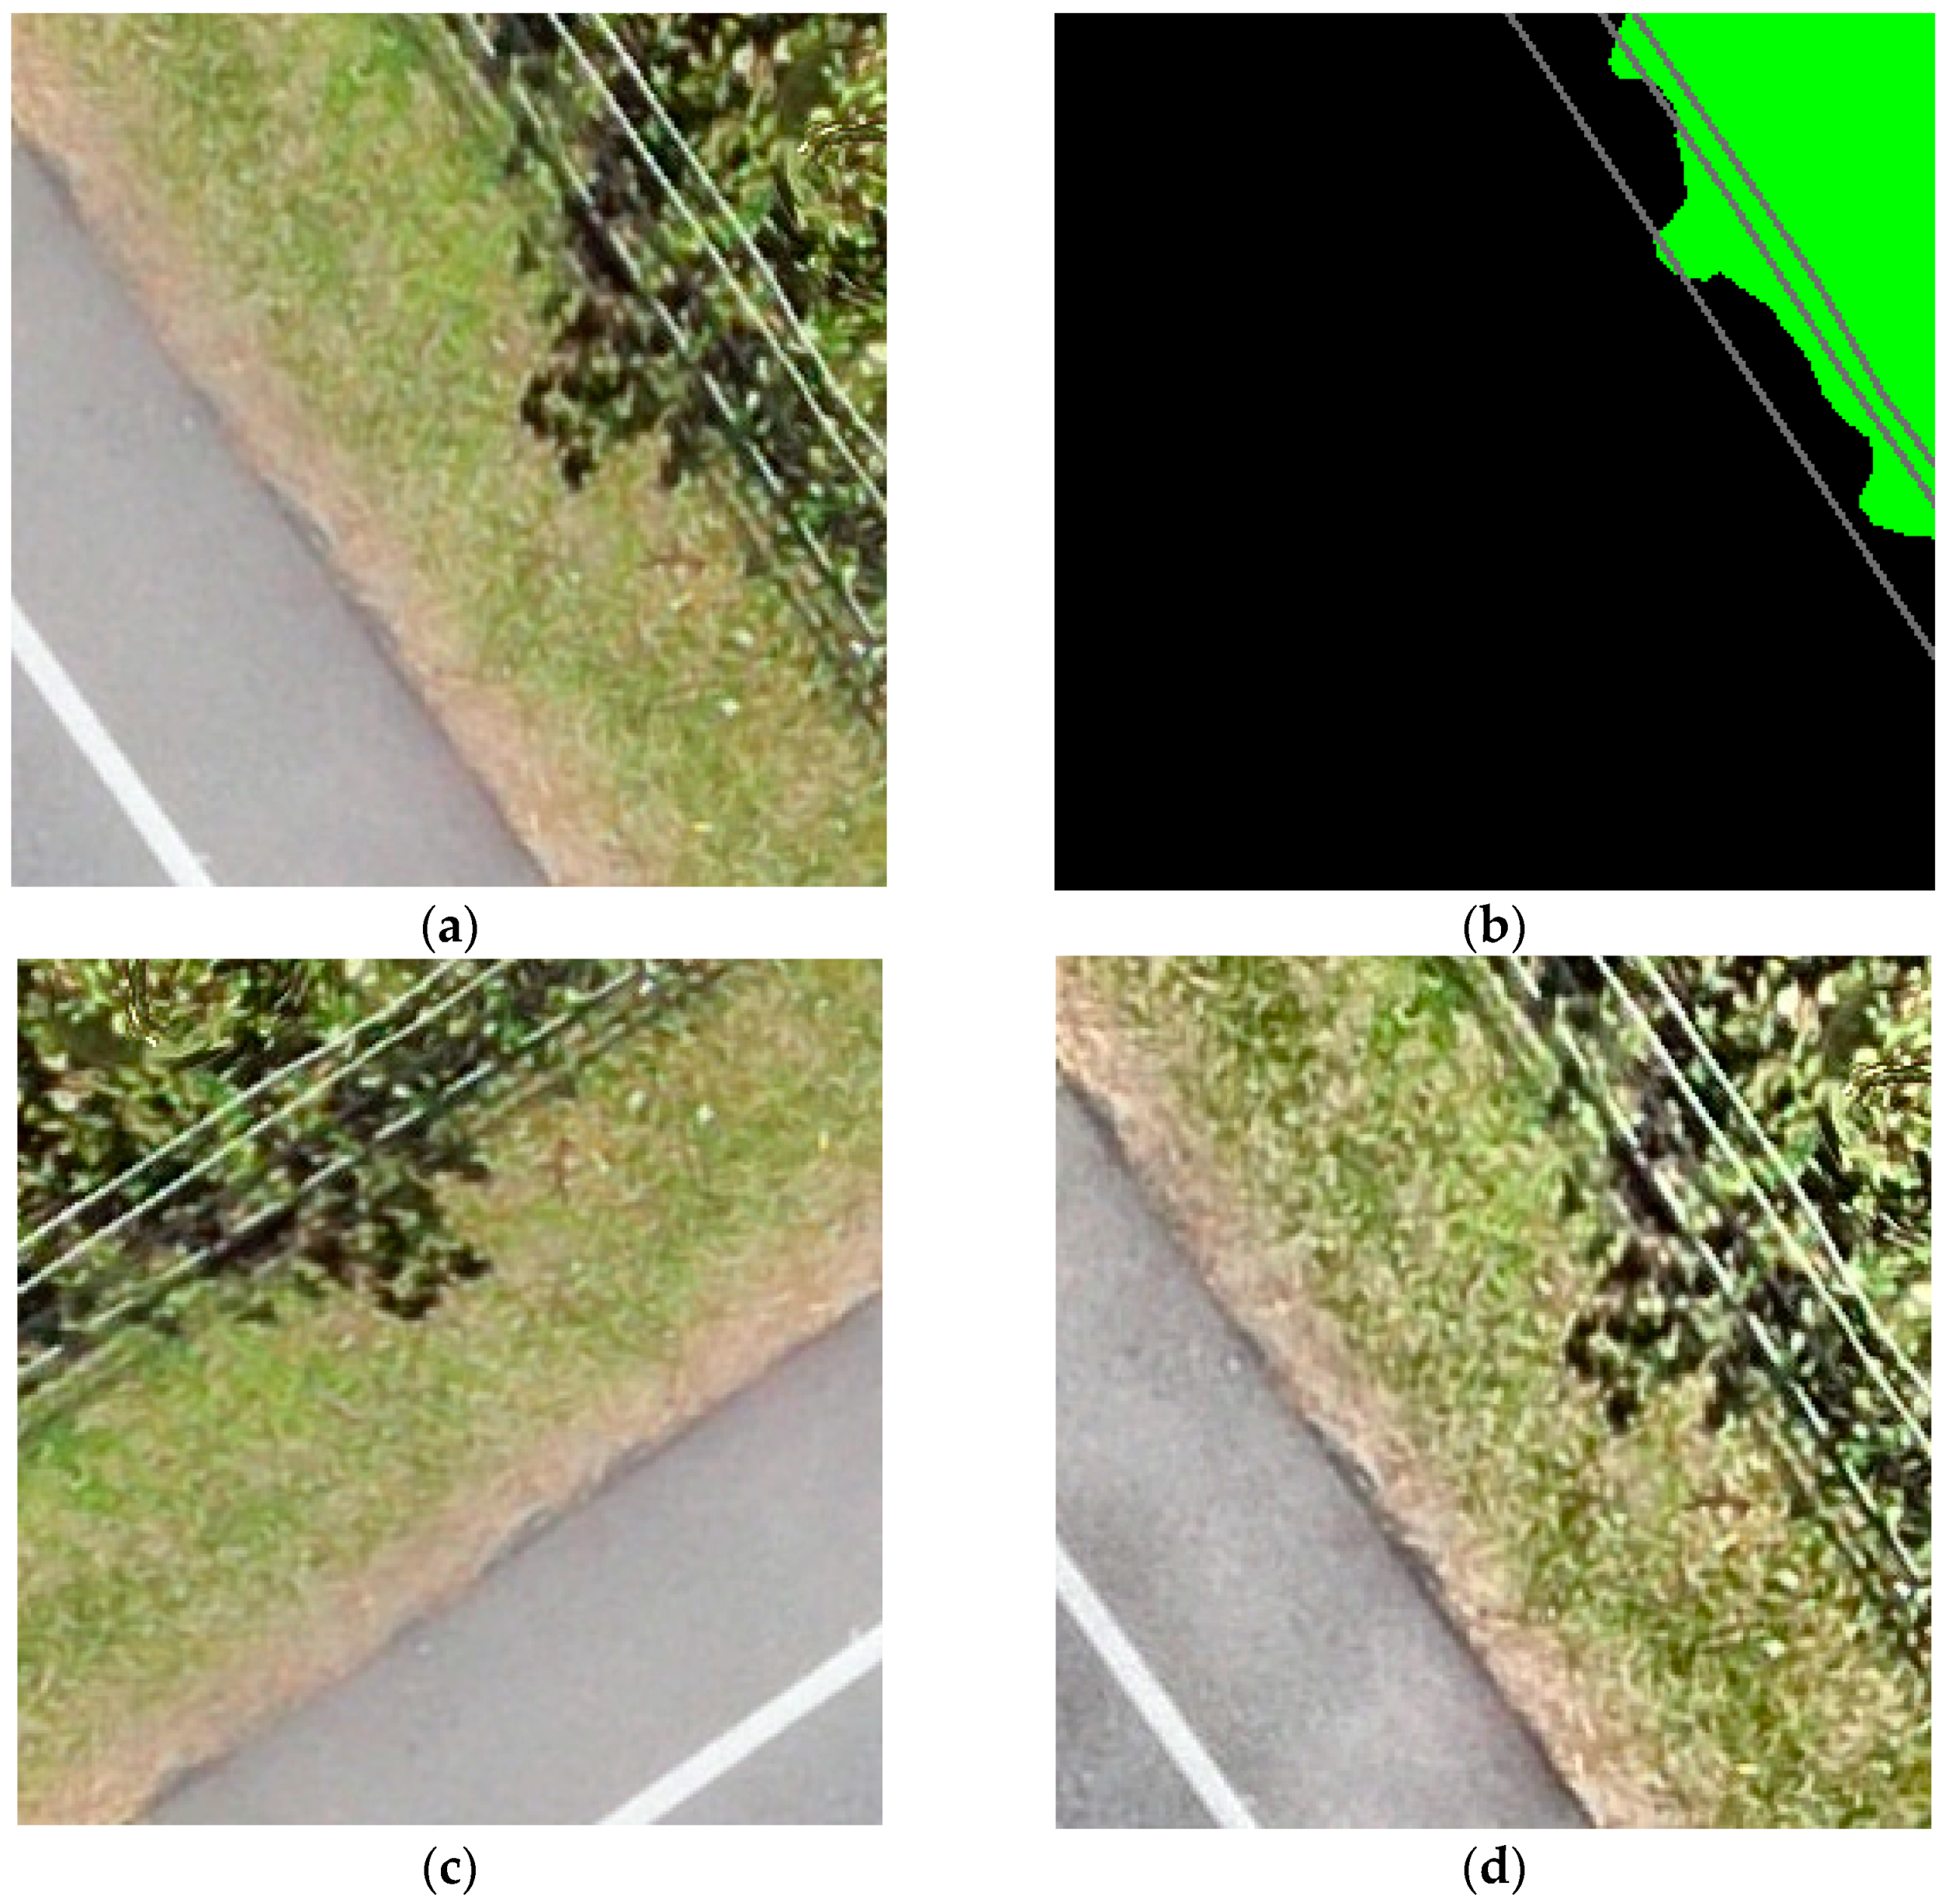
  • To export the previous rater to a .tiff format with 8-bit radiometric resolution. The whole process should guarantee the use of the same spatial reference system. Figure 6 shows the labeling steps and the final raster output.

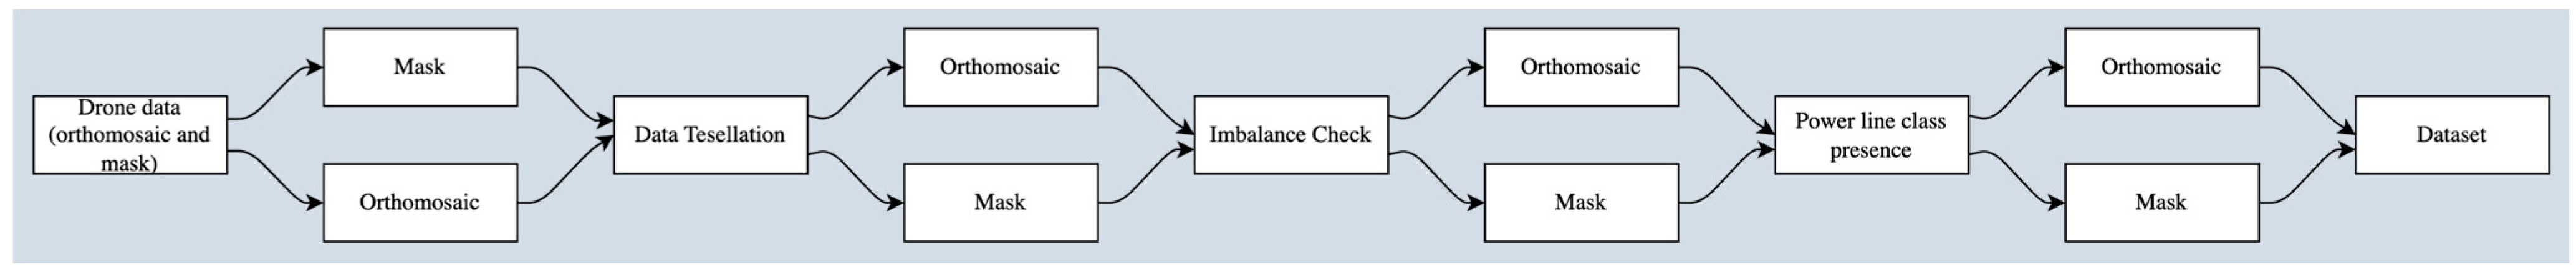
3.3. Data Tessellation and Imbalance Check

The data tessellation process and the code used are also based on the workflow proposed in [19]. Every orthomosaic and corresponding mask raster layer are tessellated together into 256 × 256 pixels image mask pairs, and saved to two separate folders, RGB and Mask, in png format. All the images are named with integer numbers in ascending order; initially, 65.852 image mask pairs were obtained after the tessellation of the four orthomosaics available.
Datasets for semantic segmentation define a visual phenomenon; however, large datasets are not always available for sufficient Deep Learning model training in the real world. Furthermore, the number of examples of a dataset is important, but so are the acquisition process, the devices and lighting conditions used, and the labeling steps, among many other factors. All of those may cause a dataset to be biased [22]. Training a model on a biased dataset tends to perform well on the training dataset, but fails to generalize in real-case scenarios [23,24].
Compared to the ones belonging to the negative class, having enough positive pixel examples within an image is always a challenge. When one of the classes in the dataset is dominant against the other, it is called data imbalance [16]. In the VEPL dataset, an imbalance check is conducted; it does not only care about the positive instances, when the vegetation encroachment exists, but also when the negative class is dominant. To conduct the imbalance check, images and corresponding masks with more than 90% of background class were deleted. This avoids the unbalanced presence of pixels of that class. This step is important to allow neural networks to generalize better in the vegetation and the power line corridor classes. Since the power lines are a minor class, all the images that do not have any pixel of that class were deleted; this step ensures that all images contain the power line corridor class and the deletion of images where only background or vegetation was present. The remaining number of images in the dataset after the deletion was 532.
Scripts for the imbalance check and deletion can be downloaded from the GitHub directory of this paper https://github.com/macanoso/GeoAI/blob/master/Tesellation_Code.ipynb (accessed on 5 April 2023). Figure 7 shows the workflow used for the tessellation and the imbalance check of the dataset.

3.4. Dataset Bias

Data Augmentation

Data augmentation is a technique developed to increase the diversity and number of dataset examples. The principal difference with other techniques to avoid over fittings, like dropout, batch normalization, and transfer learning, is that data augmentation approaches overfitting from the root of the problem, the data itself [20,23,25]. Data augmentation is divided into two general categories:
  • Traditional: Images are transformed using a combination of affine transformations (rotation, reflection, scaling, and shearing) and color or spectral modification;
  • Synthetic: Based on Deep Learning models like Generative Adversarial Networks (GANs), where an unsupervised generation of images is performed. One of the networks generates images (the generator) which tries to fool another network (the discriminator) that is trained to distinguish fake from real images. Other strategies are CNN-based methods, like random erasing [26].
In the VEPL dataset, although there is no big difference in the number of examples per class (Table 1), an imbalance exists at the pixel level in the total number of pixels for every target class. This is due to the fact that power line corridors are straight and narrow polygons versus the wide-area polygons that represent the vegetation or the background. To increase the number of examples available in the dataset and its diversity, mitigate class imbalance, and improve generalization, geometric and spectral augmentation were performed over the original VEPL dataset [16,20,26].
  • Geometric augmentation: alters the image’s geometry to make neural networks agnostic to object changes in position and orientation [27]. It may perform random rotations, grid distortion, horizontal flips, shift scale, and elastic deformation. We implemented the Albumentations library for the geometric augmentation of the images and corresponding masks of the dataset [23]. The total pairs obtained through this process were 3724;
  • Spectral augmentation: pursues to make models robust to image changes in lighting and color [27]. The spectral augmentation techniques used in the original VEPL dataset were Random Brightness and Contrast, Hue Saturation Changes, Gaussian Blur Filter, Gamma Correction, and CLAHE (Contrast Limited Adaptive Histogram Equalization) [23]. The total image pairs obtained through spectral augmentation were 3192.
Figure 8 shows some examples of both augmentation procedures.

4. Conclusions

This work presents the VEPL dataset, which was developed to allow the training of Deep Learning models for the semantic segmentation of vegetation encroachment in power line corridors using high-resolution aerial drone orthomosaics. It consists of 3192 image mask pairs after spectral augmentation, and 3724 image mask pairs after geometric augmentation. Masks are multi-class, where the vegetation class, the power line corridor class, and the background class are represented by a different color. An imbalance check at the pixel level was carried out to aim for model regularization. Although vegetation object masks were produced by manual digitization, power line masks were produced semi-automatically using a buffer GIS tool, speeding up the labeling process. The background class was obtained automatically by an identity operation in ArcGIS Software. Scripts in Python were used and provided for the tessellation, and for the pairing and the removal of image masks that contain no power line objects.
The proposed dataset instanced the workflow presented in [19] for a dataset production, in this case for vegetation encroachment in power line corridors, which may become a benchmark to compare the common approaches based on satellite imagery and LiDAR data [4,7]. Compared to those two default techniques, UAV optical images have a higher spatial resolution, are easy to acquire, are cheaper, and are up to date, versus satellite images, where the availability of specific areas of interest, and the temporal and spatial resolution may be a problem. LiDAR data is more expensive to acquire, but also, LiDAR 3D points require high computational power and software-specific tools, which makes it more difficult to analyze. In summary, the use of orthomosaics obtained by consumer-grade UAVs and Deep Learning models could allow users to perform vegetation encroachment at a lower cost, with more detail, in less time, and, most importantly, in near real-time, as compared to satellite images and LiDAR approaches. The main challenges when producing this dataset were labeling the three classes, the high resolution of drone imagery, and the large number of kilometers involved in the area of interest. Nonetheless, this dataset pays off the effort by helping the AI community to create models that automatically segment vegetation encroachment in power lines using drone imagery. It may bring a solution for monitoring several kilometers in less time and more economically. The use of semantic segmentation in vegetation encroachment may help to accurately identify, delineate, and measure the extent of vegetation encroachment, facilitating in this way the effective maintenance and the development of mitigation strategies.

5. Future Work

Following is the proposed future work:
  • To add other classes to the dataset, like power poles and conductors, among others. Also, to increase the dataset size in terms of a larger number of orthomosaics, including other types of vegetation;
  • To include DSM information for making inferences about height and obtain a more precise segmentation. Differences in height between the vegetation and the power lines can be determined, creating, in this way, an alert of possible contact in a 3D space;
  • To use other techniques of data augmentation, such as synthetic augmentation;
  • To implement different Deep Learning models on the proposed dataset and evaluate their performance.

Author Contributions

Conceptualization, J.R.B., M.C.-S. and J.W.B.-B.; methodology, J.R.B., M.C.-S. and J.W.B.-B.; software, J.R.B. and M.C.-S.; validation, J.R.B., M.C.-S. and J.W.B.-B.; investigation, J.R.B. and M.C.-S.; resources, J.W.B.-B.; data curation, J.R.B. and M.C.-S.; writing—original draft preparation, M.C.-S.; writing—review and editing, J.R.B. and M.C.-S.; visualization, J.R.B. and M.C.-S.; supervision, J.W.B.-B. and J.R.B. All authors have read and agreed to the published version of the manuscript.

Funding

This research received no external funding.

Institutional Review Board Statement

Not applicable.

Informed Consent Statement

Not applicable.

Data Availability Statement

The data presented in this study are openly available in Zenodo at https://doi.org/10.5281/zenodo.7800234.

Acknowledgments

We would like to thank GIDIA (Research group in Artificial Intelligence of the Universidad Nacional de Colombia) for providing guidelines, reviews of the work, and use of facilities.

Conflicts of Interest

The authors declare no conflict of interest.

References

  1. Ahmad, J.; Malik, A.S.; Xia, L.; Ashikin, N. Vegetation encroachment monitoring for transmission lines right-of-ways: A survey. Electr. Power Syst. Res. 2013, 95, 339–352. [Google Scholar] [CrossRef]
  2. Nguyen, V.N.; Jenssen, R.; Roverso, D. Automatic autonomous vision-based power line inspection: A review of current status and the potential role of deep learning. Int. J. Electr. Power Energy Syst. 2018, 99, 107–120. [Google Scholar] [CrossRef] [Green Version]
  3. Wang, J.; Yang, Y.; Mao, J.; Huang, Z.; Huang, C.; Xu, W. CNN-RNN: A unified framework for multi-label image classification. In Proceedings of the 2016 IEEE Conference on Computer Vision and Pattern Recognition, Las Vegas, NV, USA, 27–30 June 2016; pp. 2285–2294. [Google Scholar]
  4. Azevedo, F.; Dias, A.; Almeida, J.; Oliveira, A.; Ferreira, A.; Santos, T.; Martins, A.; Silva, E. Real-Time LiDAR-based Power Lines Detection for Unmanned Aerial Vehicles. In Proceedings of the 2019 IEEE International Conference on Autonomous Robot Systems and Competitions (ICARSC), Porto, Portugal, 24–26 April 2019; pp. 1–8. [Google Scholar] [CrossRef] [Green Version]
  5. Ahmad, J.; Malik, A.S.; Abdullah, M.F.; Kamel, N.; Xia, L. A novel method for vegetation encroachment monitoring of transmission lines using a single 2D camera. Pattern Anal. Appl. 2015, 18, 419–440. [Google Scholar] [CrossRef]
  6. Odo, A.; McKenna, S.; Flynn, D.; Vorstius, J.B. Aerial Image Analysis Using Deep Learning for Electrical Overhead Line Network Asset Management. IEEE Access 2021, 9, 146281–146295. [Google Scholar] [CrossRef]
  7. Gazzea, M.; Pacevicius, M.; Dammann, D.O.; Sapronova, A.; Lunde, T.M.; Arghandeh, R. Automated Power Lines Vegetation Monitoring Using High-Resolution Satellite Imagery. IEEE Trans. Power Deliv. 2022, 37, 308–316. [Google Scholar] [CrossRef]
  8. Haroun, F.M.E.; Deros, S.N.M.; Bin Baharuddin, M.Z.; Din, N.M. Detection of Vegetation Encroachment in Power Transmission Line Corridor from Satellite Imagery Using Support Vector Machine: A Features Analysis Approach. Energies 2021, 14, 3393. [Google Scholar] [CrossRef]
  9. Han, Y.; Han, J.; Ni, Z.; Wang, W.; Jiang, H. Instance Segmentation of Transmission Line Images Based on an Improved D-SOLO Network. In Proceedings of the 2021 IEEE 3rd International Conference on Power Data Science (ICPDS), Harbin, China, 26 December 2021; pp. 40–46. [Google Scholar] [CrossRef]
  10. Nguyen, V.N.; Jenssen, R.; Roverso, D. LS-Net: Fast single-shot line-segment detector. Mach. Vis. Appl. 2020, 32, 12. [Google Scholar] [CrossRef]
  11. Zhang, R.; Yang, B.; Xiao, W.; Liang, F.; Liu, Y.; Wang, Z. Automatic Extraction of High-Voltage Power Transmission Objects from UAV Lidar Point Clouds. Remote Sens. 2019, 11, 2600. [Google Scholar] [CrossRef] [Green Version]
  12. Liu, X.; Miao, X.; Jiang, H.; Chen, J. Data analysis in visual power line inspection: An in-depth review of deep learning for component detection and fault diagnosis. Annu. Rev. Control 2020, 50, 253–277. [Google Scholar] [CrossRef]
  13. Shelhamer, E.; Long, J.; Darrell, T. Fully convolutional networks for semantic segmentation. IEEE Trans. Pattern Anal. Mach. Intell. 2017, 39, 640–651. [Google Scholar] [CrossRef]
  14. Farabet, C.; Couprie, C.; Najman, L.; LeCun, Y. Learning Hierarchical Features for Scene Labeling. IEEE Trans. Pattern Anal. Mach. Intell. 2012, 35, 1915–1929. [Google Scholar] [CrossRef] [PubMed] [Green Version]
  15. Thoma, M. A Survey of Semantic Segmentation. arXiv 2016, arXiv:1602.06541. [Google Scholar]
  16. Ballesteros, J.R.; Sanchez-Torres, G.; Branch-Bedoya, J.W. HAGDAVS: Height-Augmented Geo-Located Dataset for Detection and Semantic Segmentation of Vehicles in Drone Aerial Orthomosaics. Data 2022, 7, 50. [Google Scholar] [CrossRef]
  17. Ballesteros, J.R.; Sanchez-Torres, G.; Branch, J.W. Automatic road extraction in small urban areas of developing countries using drone imagery and Image Translation. In Proceedings of the 2021 2nd Sustainable Cities Latin America Conference (SCLA), Medellin, Colombia, 25–27 August 2021; pp. 1–6. [Google Scholar] [CrossRef]
  18. Restrepo, Z.; Botero, S.; González-Caro, S.; Ortiz-Yusty, C.; Alvarez-Davila, E. Guía de Flora y Fauna del Sistema Local de Área Protegidas de Envigado (Colombia); Editorial Jardín Botánico de Medellín: Medellín, Colombia, 2018. [Google Scholar]
  19. Ballesteros, J.R.; Sanchez-Torres, G.; Branch-Bedoya, J.W. A GIS Pipeline to Produce GeoAI Datasets from Drone Overhead Imagery. ISPRS Int. J. Geo-Inf. 2022, 11, 508. [Google Scholar] [CrossRef]
  20. Shorten, C.; Khoshgoftaar, T.M. A survey on Image Data Augmentation for Deep Learning. J. Big Data 2019, 6, 60. [Google Scholar] [CrossRef] [Green Version]
  21. Agisoft Metashape Professional (Version 1.6.3) (Software). Available online: https://www.agisoft.com (accessed on 2 April 2023).
  22. Torralba, A.; Efros, A.A. Unbiased Look at Dataset Bias. In Proceedings of the IEEE Computer Society Conference on Computer Vision and Pattern Recognition, Colorado Springs, CO, USA, 20–25 June 2011; pp. 1521–1528. [Google Scholar]
  23. Buslaev, A.; Iglovikov, V.I.; Khvedchenya, E.; Parinov, A.; Druzhinin, M.; Kalinin, A.A. Albumentations: Fast and Flexible Image Augmentations. Information 2020, 11, 125. [Google Scholar] [CrossRef] [Green Version]
  24. Selvaraju, R.R.; Cogswell, M.; Das, A.; Vedantam, R.; Parikh, D.; Batra, D. Grad-CAM: Visual Explanations from Deep Networks via Gradient-Based Localization. In Proceedings of the 2017 IEEE International Conference on Computer Vision (ICCV), Venice, Italy, 22–29 October 2017; pp. 618–626. [Google Scholar] [CrossRef] [Green Version]
  25. Cubuk, E.D.; Zoph, B.; Mane, D.; Vasudevan, V.; Le, Q.V. AutoAugment: Learning Augmentation Strategies From Data. In Proceedings of the IEEE Computer Society Conference on Computer Vision and Pattern Recognition, Long Beach, CA, USA, 15–20 June 2019; pp. 113–123. [Google Scholar] [CrossRef]
  26. Mikołajczyk, A.; Grochowski, M. Data augmentation for improving deep learning in image classification problem. In Proceedings of the International Interdisciplinary PhD Workshop (IIPhDW), Swinoujscie, Poland, 9–12 May 2018; pp. 117–122. [Google Scholar] [CrossRef]
  27. Taylor, L.; Nitschke, G. Improving Deep Learning with Generic Data Augmentation. In Proceedings of the 2018 IEEE Symposium Series on Computational Intelligence (SSCI), Bangalore, India, 18–21 November 2018; pp. 1542–1547. [Google Scholar] [CrossRef]
Figure 1. Multiple existing datasets. (a) Simulated vegetation encroachment and mask [5]. (b) An oblique insulator image and bounding box with a mixture of porcelain and glass insulators [6]. (c) RGB image and ground truth mask for vegetation [7]. (d) Vegetation density classification results along a power line corridor [8]. (e) The prediction result of object detection and semantic segmentation in transmission lines components [9]. (f) An image of a power line and pixel-level annotation mask [10], adapted and modified from [5,6,7,8,9,10].
Data 08 00128 g001
Figure 2. VEPL image—mask example of the dataset. (a) RGB image, with a size of 256 × 256. (b) Corresponding multi-label mask with vegetation class (green), power line class (gray), and background class (black). (c) RGB image with geometric data augmentation applied (RandomRotate90). (d) RGB image with spectral data augmentation applied (CLAHE, Apply Contrast Limited Adaptive Histogram Equalization).
Data 08 00128 g002
Figure 3. Drone data acquisition and processing workflow; images are processed in AgiSoft software to obtain drone orthomosaics and DSM. Adapted and modified from [19].
Data 08 00128 g003
Figure 4. (a) Drone orthomosaic zoom in. (b) DSM zoom in. Only orthomosaics are used to produce the VEPL dataset; corresponding DSMs are provided for future work. This orthomosaic has a GSD of 1.26 cm/px.
Data 08 00128 g004
Figure 5. Data labeling in ArcGIS. Power line corridors are labeled with red lines and the vegetation class is labeled with gray polygons. After labeling, the colors mentioned for the classes are assigned.
Data 08 00128 g005
Figure 6. Labeling process. (a) The initial portion of the orthomosaic is to be labeled. (b) Union of vegetation and buffer of power line corridors. (c) Final raster. The mask has the same size, coordinate system, and properties as the input orthomosaic.
Data 08 00128 g006
Figure 7. Workflow for dataset tessellation and imbalance check. Adapted from [19].
Data 08 00128 g007
Figure 8. Data augmentation. (a) Geometric augmentation. (b) Spectral augmentation.
Data 08 00128 g008aData 08 00128 g008b
Table 1. Orthomosaics characteristics and the number of examples per class and orthomosaic (this does not contain data augmentation).
OrthomosaicsClass 0 (Background)Class 1 (Vegetation)Class 2 (Power Lines)Total
Cols, Rows: 26,898; 35,093
GSD 1.26, Size: 2.70 GB
Format: TIFF, Bands: 3
Pixel Depth: 8 Bit
Spatial Reference:
GCS_WGS1984
103 examples115 examples115 examples333 examples
Cols, Rows: 42,591; 20,637
GSD 1.06, Size: 2.46 GB
Format: TIFF, Bands: 3
Pixel Depth: 8 Bit
Spatial Reference:
GCS_WGS19842
155 examples166 examples166 examples487 examples
Cols, Rows: 27,885; 16,436
GSD 0.91, Size: 1.28 GB
Format: TIFF, Bands: 3
Pixel Depth: 8 Bit
Spatial Reference:
GCS_WGS19842
82 examples94 examples94 examples270 examples
Cols, Rows: 47,780; 41,390
GSD 1.35, Size: 5.53 GB
Format: TIFF, Bands: 3
Pixel Depth: 8 Bit
Spatial Reference:
GCS_WGS19842
149 examples157 examples157 examples463 examples
Table 2. The VEPL dataset specifications.
ItemDescription
Field of applicationVegetation encroachment in power lines corridors
Collected dataAerial images
Method for data acquisitionDrone flights
Used droneDJI Mavic 2 Pro
Camera resolution and sensor size20 Mpx, 1 inch CMOS
Software for processing collected data and productsAgisoft Metashape
GSD of obtained orthomosaics and DSM0.9 to 1.35 cm/px
Method of annotationSemi-automatically in GIS
Dataset productionScripts in Jupyter Notebook
Language for scriptsPython 3.8
Used GIS softwareArcGIS 10.8
Number of classes and objectsThree: vegetation, power lines, background
Number of orthomosaicsFour
Data collected byAuthors of this paper
Year of collection2023
Segmentation datasetMulti-class color
Additional informationRGB
Dataset size3.88 Gb compressed
Image format.jpg
Image quantityThe dataset is divided into 12 TIF images (4 orthomosaics, DSM, and mask), 532 images (after tessellation), 3192 images (with spectral augmentation), and 3724 (with geometric augmentation)
Image-mask size256 × 256 px
RGB Image average memory size16 Mb
RGB, Mask, Image spectral resolution3 bands
RGB, Mask Image radiometric resolution8 bits
RGB, RG-DSM, Mask Image Coordinate SystemWGS1984
Disclaimer/Publisher’s Note: The statements, opinions and data contained in all publications are solely those of the individual author(s) and contributor(s) and not of MDPI and/or the editor(s). MDPI and/or the editor(s) disclaim responsibility for any injury to people or property resulting from any ideas, methods, instructions or products referred to in the content.

