1. Summary
Data collection in real-world settings, such as urban roadways, is a laborious and highly costly task, primarily due to the substantial investment of money and time required to initiate data acquisition and compile a comprehensive dataset. As an alternative to this, there are various simulators that significantly reduce the investment required, thereby expediting the initial stages of a training process. In addition to this, after obtaining the dataset, with all of the inherent complexity, it becomes necessary to process the data to make them suitable for training purposes.
The objective of the dataset described in this manuscript is to be instrumental in the analysis of traffic violations. Below, the authors list the systems aimed at data collection for training purposes, whether through real-world data acquisition or simulated environments. It also provides insights into the CARLA simulator and its integration with a robot operating system (ROS), designed to streamline the interaction.
1.1. Data Collection Strategies
1.1.1. Data Collection in Real-World Environments
There are numerous projects, such as the one developed at the Universidad Europea de Madrid [
1], which introduce an advanced driver assistance system capable of detecting and notifying drivers about violations committed during their journey. This system is integrated into the vehicle to gather data and train the assistant, enabling the detection of road elements and violations and the generation of data and images for future use. However, it is noted that the data collection and setup process is time- and resource-intensive, especially when simulation is not employed [
2]. Additionally, it focuses on the driver’s own violations and not all violations occurring on the road. In addition to this, there are other similar systems, such as [
3,
4,
5], Mapillary Vistas [
6], and BDD100K [
7], which concentrate on generating data in urban environments through sensor-equipped vehicles that collect various environmental information, including images (among many others). These systems offer data under various licenses and are valuable for acquiring information from a vehicle’s perspective. However, the primary challenge in all cases is the high economic and time costs associated with implementing sensor-equipped vehicles for data collection.
1.1.2. Data Collection in Simulated Environments
This group stands out for its ability to reduce costs and expedite the data acquisition process. Two projects excel in the utilization of the CARLA simulator [
8] for generating datasets. The first one is the “AD PerDevKit” [
9], a development kit focused on generating driving and vehicular environment data in the CARLA simulation system, with the support of ROS. Its primary goal is to increase the quantity of available data to enhance the training of computer vision models in autonomous vehicles. The second initiative, named “CarFree” [
10], focuses on generating datasets for object detection in autonomous vehicles using CARLA. A noteworthy aspect of this project is its consideration of factors such as weather conditions and the time of day, contributing to the creation of more realistic data for future training. Both projects demonstrate the effectiveness of simulation with CARLA as a fundamental tool for acquiring high-quality data in the field of autonomous driving. Furthermore, the inclusion of weather and temporal data as a future line of development suggests an innovative approach to the training of computer vision models, which could have a significant impact on the advancement of more advanced and secure autonomous vehicles.
In addition to the previously mentioned advantages, such as the agility to conduct tests and the ease of generating specific environments like low-visibility situations and retentions, the most significant advantage, which is indeed challenging to replicate in real-world settings, lies in traffic infractions and hazardous situations. Examples include driving in the wrong direction or pedestrians crossing roads at improper locations [
11]. Reproducing these situations in real-life scenarios requires highly controlled and restricted environments, involving numerous individuals (security personnel, actors, fake drivers, etc.) to simulate realistic circumstances. In virtual environments, all of these features are simulation parameters that can be easily adapted without any human risks.
1.2. CARLA Simulator and ROS—Robot Operating System
1.2.1. CARLA Simulator
CARLA is a simulation environment created with the purpose of aiding in the development, training, and validation of autonomous driving systems [
12,
13]. It provides users with the necessary tools for full simulation control through flexible application programming interfaces (APIs) that enable actions such as traffic generation, pedestrians, map events, sensor control, and more [
14]. When launching the simulation, CARLA loads a map of an urban environment where all of the events will take place.
Figure 1 was captured from the perspective of a unique entity within the simulation, the “Spectator”, a mobile camera used to observe the simulation. This entity belongs to a group known as “Actors”, which interact within the simulation. Within these actors, there are also sensors, traffic signs, traffic lights, vehicles, and pedestrians. All these actors have a position within the map and share certain basic functionalities, such as being generated in the map or having their positions redefined during the simulation time, all through the API.
1.2.2. ROS—Robot Operating System
ROS is a set of libraries and tools for robot development [
15]. What makes ROS interesting is its ability to reuse code and its scalability [
16]. It achieves this through its approach of generating interconnected, interchangeable, and independent nodes that communicate via a publisher–subscriber system. For this work, ROS (version 1) was used. The choice of this version is due to its compatibility with previous systems that require this version of ROS. However, the installation process is very similar for both ROS and ROS2. In fact, the CARLA community has an extensive collection of manuals and code developed in ROS, allowing for straightforward integration, as demonstrated in various previous works [
17,
18].
CARLA essentially functions as a service upon which a graphical environment runs, enabling the visualization of simulation data. ROS can connect to this service through its public API [
19,
20]. In this study, it was only necessary to connect to sensors (RGB and segmentation cameras) that become topics to which one could subscribe and obtain their information. For all of this, programming is not required, as the CARLA–ROS communications bridge is already developed, and it is just a matter of configuring it appropriately (IP, ports, nodes, etc.). This clarification has been added in
Section 1.2.2 “ROS Operating System”.
2. Data Description
Our dataset is composed of 4347 frames of a single scene. The scene is an urban crossroads with a large crosswalk along four lanes. There are several buildings, as well as parking, streetlights, vertical signage, and even a sports field. Each frame is composed of an RGB (red–green–blue) in .png images and its semantic segmentation in .tiff format, which makes a total of 8754 images. The dataset directory structure is as follows:
classes.txt: A file that references the entities to be considered for the training phase.
images: A directory where RGB images are stored. These images are extracted from the CARLA simulator in “.png” format. All of these images have a naming format: frRGBxxxxx.png.
segmentation: A directory where segmented images are stored. The segmented images are extracted from the CARLA simulator in “.tiff” format. All of these images have a naming format: frSEGxxxxx.tiff.
labels: A directory where labeling files are stored. There is one file per RGB image. This labeling is custom-generated and saved in plain text “.txt” format. All of these files have a naming format: frRGBxxxxx.txt.
- ○
classes.txt: A file that specifies the classes for labeling.
Figure 2 and
Figure 3 show examples of images of the same scene in its RGB and segmented variants. The scenes are accompanied by as many files with a .txt extension with the description of the elements identified in each of the images. In total, there are 13,042 files between the images (4347 .png), segmentations (4347 .tiff), and descriptions (4347 .txt for each pair of .png and .tiff images and one for classes.txt). In these images, 77,144 targets were labeled, including cars, motorcycles, pedestrians, and pedestrian crossings (crosswalks). These labels refer to elements present in the visible and segmented images. These data can be seen in
Table 1.
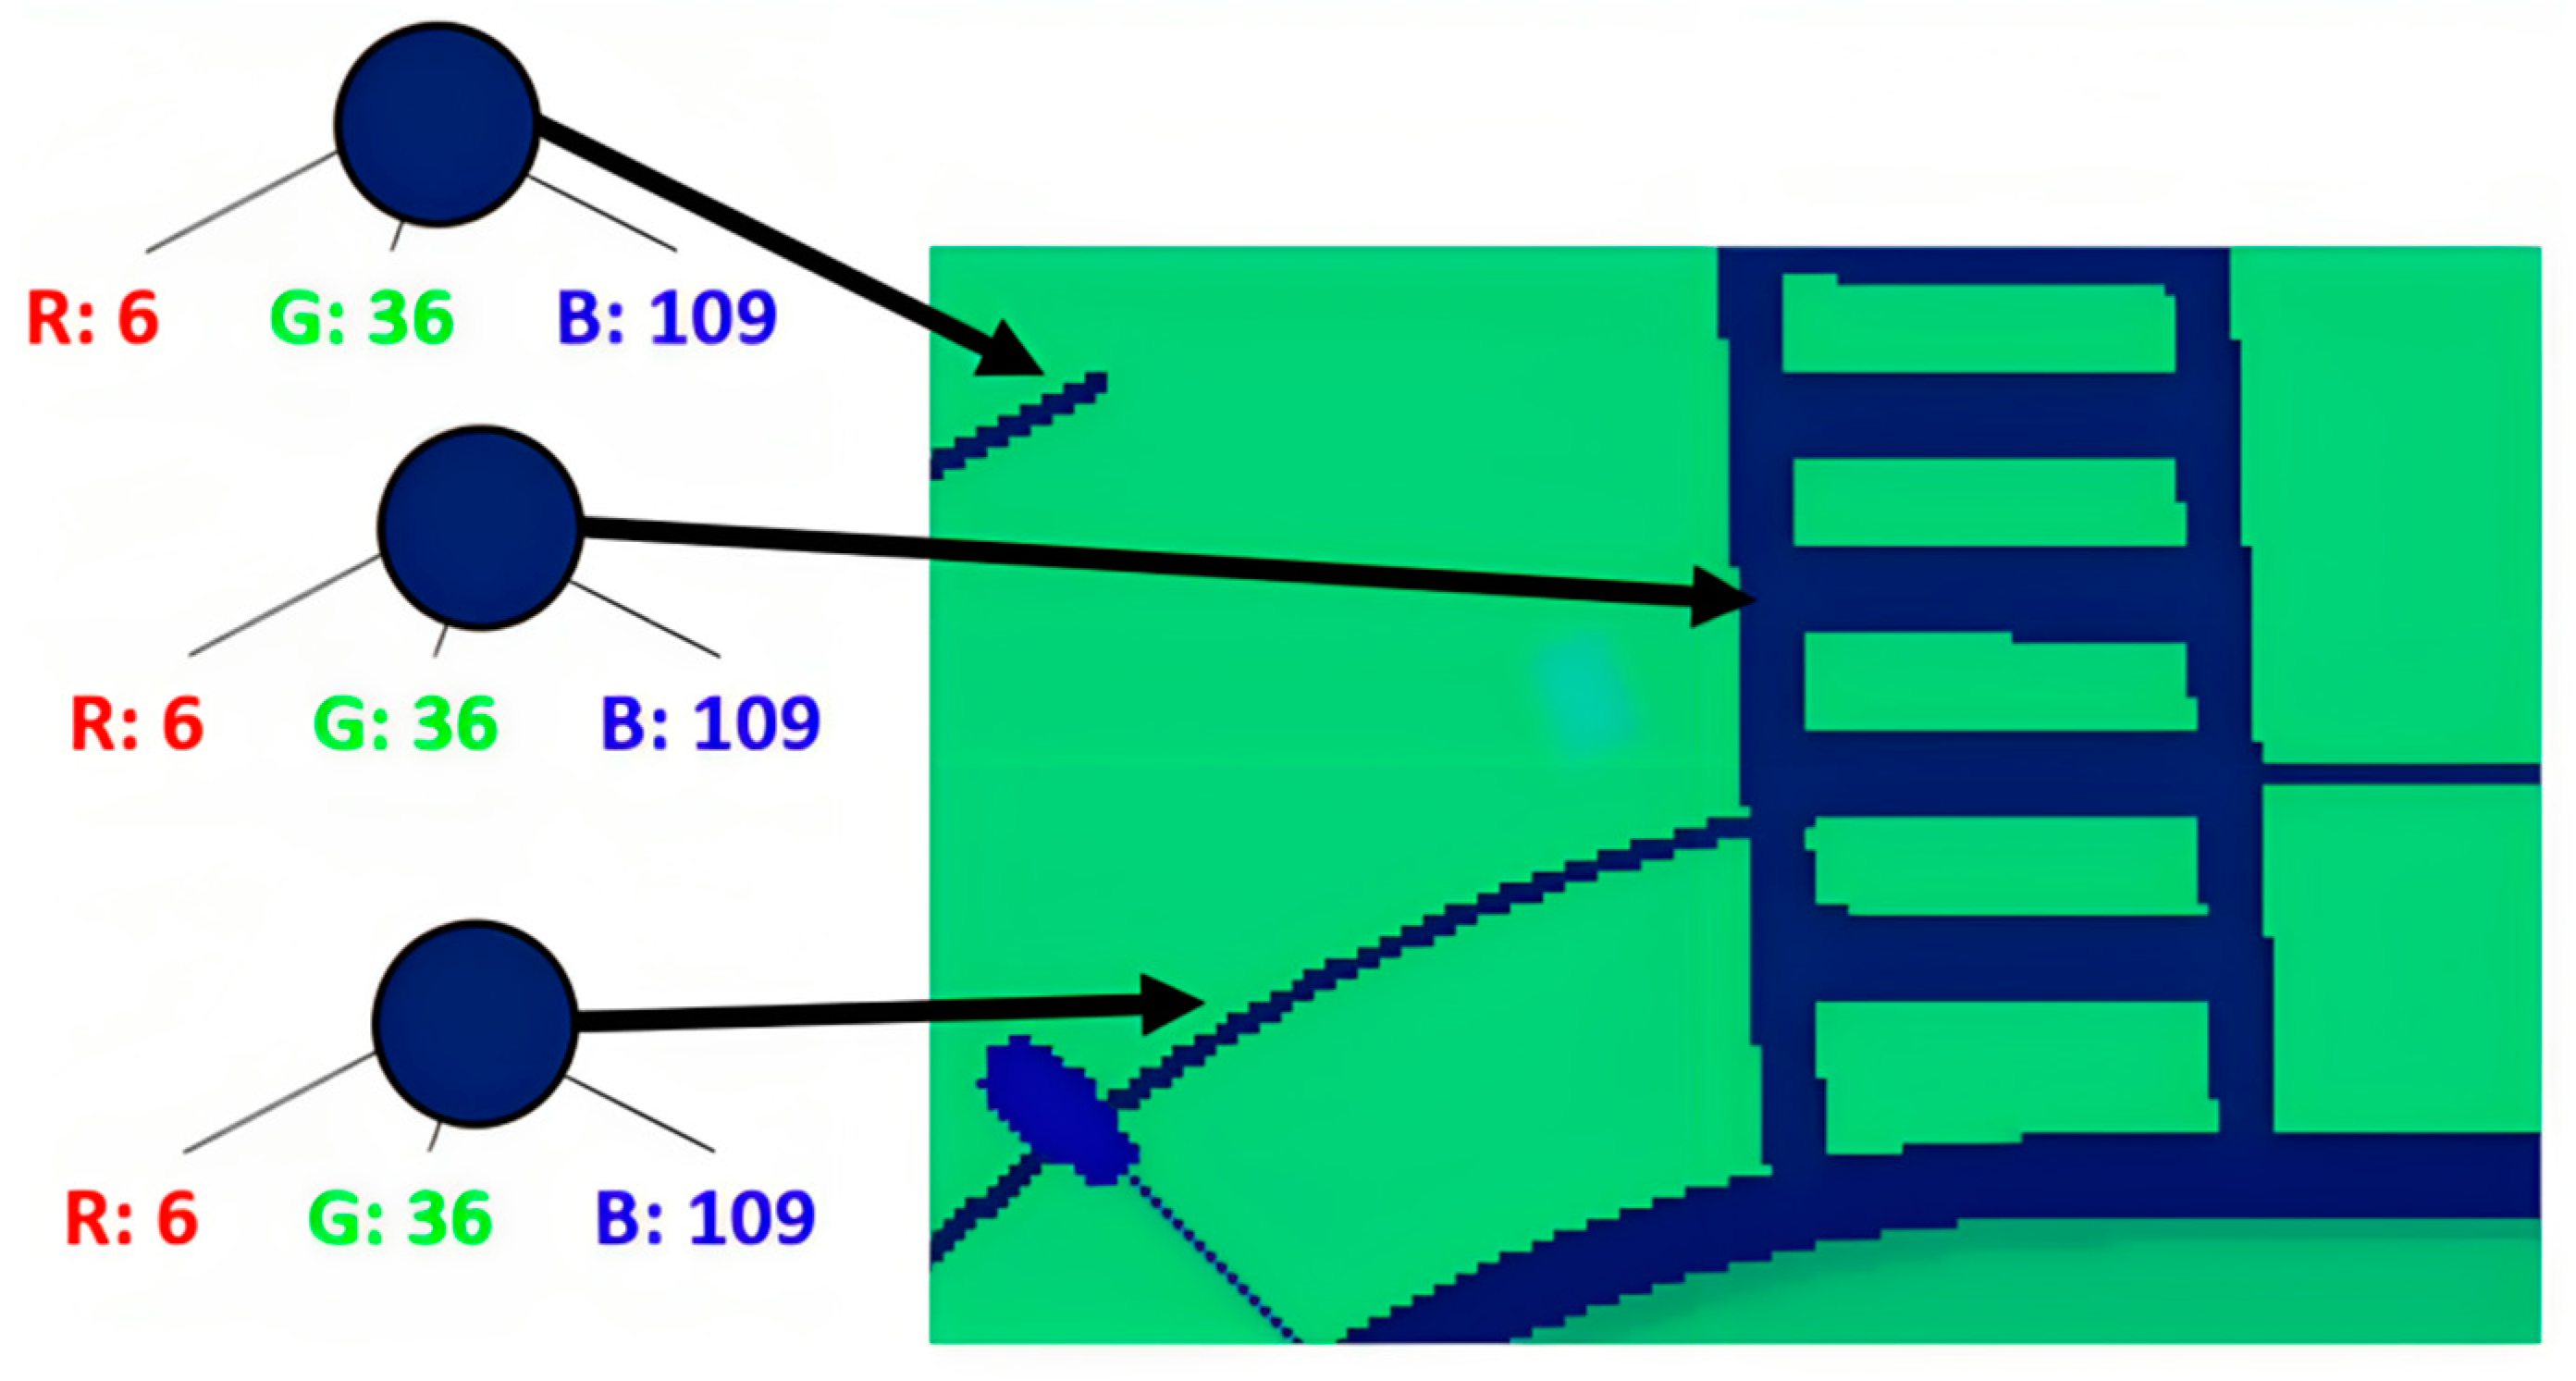
As can be observed, each element corresponding to the RGB image (
Figure 2) is represented by a different color in the segmented image (
Figure 3). The color mapping used in the segmented image works in such a way that each entity is represented by a specific color in the RGB spectrum. This color representation consists of the bytes of information, one representing the color red (R), another representing green (G), and the last one representing blue (B). By combining the three colors, whose values range from 0 to 255, the color to be represented is generated. Within the RGB scheme, the red (R) component represents the type of entity. For example, all entities with a value of 10 in this color are identified in the simulation as vehicles, as can be seen in
Figure 4. The values assigned to green (G) and blue (B) are used to differentiate each entity from those that share the same type. In
Table 2, you can observe some examples of the relationship between the segmented entity type and its value for the R component of the RGB code.
The dataset was created in You Only Look Once (YOLO) format [
21] due to its widespread popularity, as well as the ease with which it can be easily adapted or converted to other formats due to its characteristics. In this format, the images and their annotations are called in the same way (consecutive integer values, starting at 0) using the extension .png/.tiff for the images and .txt for the annotations associated with that image. In the .txt files, this notation is used to define five fields:
<object-class> <x> <y> <width> <height>
Specifically, each of the fields contains the following:
object-class: Integer number varying between 0 and N-Classes-1. The four classes that were incorporated into the model are as follows: 0. Cars, 1. Motorcycles, 2. Pedestrians, and 3. Crosswalk.
x, y: Decimal values relative to the center of the rectangle containing the labeled object. They vary in the range [0.0 to 1.0].
width, height: Decimal values relative to the width and height of the rectangle containing the labeled object. They vary in the range [0.0 to 1.0].
3. Methods
For the construction of the dataset, aerial images were captured from a CARLA simulation. Since these are overhead images, the recommendations from [
22,
23] regarding the requirements for collecting trajectory datasets were considered. These requirements were extrapolated to the specific goal of object recognition in images taken by UAVs (unmanned aerial vehicles) like drones or from elevated cameras [
24,
25]. The dataset should include many images as well as many labeled objects within these images. Furthermore, it should encompass all types of objects. When labeling images, objects related to the objects that we wanted to predict should not be excluded; for example, trucks should not be excluded from the dataset when labeling all cars. All objects can be included in a category like “vehicles” or a separate category can be created for each of these objects. Taking these requirements into account, let us move on to describe each of the tasks performed for dataset construction.
3.1. Obtaining the Dataset
The images in the dataset were taken by the authors using the CARLA simulator, assisted by ROS for the interaction with the simulator as well as for the management and capture of the RGB and segmented images. One application scenario involves creating static sensors and placing them at a certain height above the road. In CARLA, users can generate actors and move them wherever desired, as described in
Section 1.2.1, for the purpose of gathering information.
Specifically, two types of sensors were defined: an RGB camera and an instance segmentation camera. The RGB camera captures images in the “.png” format of the roadway, while the instance segmentation camera displays a color representation of all entities on the road, with each entity clearly distinguishable. To avoid image quality loss, the instance segmentation images are stored in “.tiff” format. By combining both sensors with identical specifications (focal length, sensor size, etc.) and positioning them at the same angle and location, the images captured by both sensors can be related, making them representations of the same scene at a specific moment in the simulation. However, there is a challenge in this process because the image capture between both sensors is not coordinated by CARLA. This means that the image pairing process must be performed manually, which is why the integration of ROS with CARLA was utilized to address this difficulty. To address this issue, post-processing on the dataset was carried out. Initially, the simulation timestamp (the timestamp generated by CARLA) was saved for each image captured by the cameras. Subsequently, the images were filtered by their timestamp, with RGB and segmented images whose timestamps differed by less than 50 ms being paired. Such pairs were considered synchronized and associated with each other.
The location was defined considering its interest in the crossroads it contains. This crossing has a large crosswalk that spans it. In addition, there are parking areas, traffic lights, and pedestrian roads and sidewalks. The images were taken from a zenithal view, with the upper part of the image oriented to the north.
3.2. Dataset Processing and Labeling
This phase focuses on transforming the dataset’s data into information that can be used to train a model capable of identifying entities in images. The target format for this data transformation is the format used by YOLOv8. The data transformation to be carried out is as follows: the segmented images are taken, and the positions of relevant entities, represented as rectangles, known as boxes, are extracted. After this, these positions are stored in a text file, along with a numeric identifier representing the type of entity. The process’s workflow can be observed in
Figure 5.
There were some challenges in entity detection that required manual review after the automatic labeling based on semantic segmentation:
Pedestrian Crosswalk Detection: Pedestrian crosswalks and other longitudinal road lines were identified using the same R (red) value, making it difficult to differentiate between them. In some cases, they even shared the same RGB color, as can be seen in
Figure 6. Labeling of this class was performed through the use of classical computer vision techniques, such as morphological filters (erosion/dilation), and by analyzing the shape of the figure (height-to-width ratio).
Vehicle Detection for 2-Wheelers: One point to consider when labeling vehicles is how CARLA’s segmentation identifies 2-wheeled vehicles. CARLA treats them as a vehicle with a pedestrian on top. Therefore, by employing classic computer vision techniques, it is relatively straightforward to separate motorcycles from cars, remove the “pedestrian” from the vehicle, and label it all as a motorcycle.
Labeling of Invisible Pedestrians: During the initial labeling process, an anomalous behavior was observed in the labeling, where pedestrians were occasionally labeled under obstacles like trees. Upon investigating the cause, a segmentation issue with entities captured in CARLA images was discovered. Many trees that appeared in RGB images were not represented in the segmented images, leading to pedestrians under the trees being labeled even though they did not appear in the RGB image, as depicted in
Figure 7.
To address this issue, a system was implemented to mark those entities not represented in the segmentation, with them being treated as obstacles. This allowed for the subsequent removal of pedestrians located beneath these entities. This tool generates a window using OpenCV (Open Computer Vision), which enables marking of the entities by clicking on two points, creating a rectangle that identifies the area.
3.3. Dataset Validation
The purpose of the training was not to determine how well convolutional neural networks perform but rather to demonstrate that the dataset is well-constructed and labeled. Therefore, the outcome of the training was not a critical factor for this data descriptor. The training parameters were chosen based on our own experience with this type of dataset, particularly to verify that it can effectively recognize small objects such as motorcycles and pedestrians in aerial images.
Specifically, the dataset was utilized to create a baseline model to assess its utility, with an 80% distribution of images for training and 20% for validation. The cluster at the Universidad Europea de Madrid (UEM) was employed for machine learning model training. This cluster comprises 10 network-connected nodes, each configured with 32 cores, 256 GB of RAM, and NVIDIA RTX 3080 Ti GPUs with 12 GB of RAM.
The chosen model is yolov8n, a 365-layer PyTorch neural network. In this work other architectures were not tested. But this does not mean that they have not been tested on other networks like TensorFlow (Keras), ResNet, DETR, EfficientDetLite, etc., with similar datasets, as can be seen in [
26]. The characteristics of these images (large images, small objects to recognize, objects grouped in an area of the image, low-density areas of targets against other very saturated areas, etc.) make the selected YOLOv8n network the one through which we obtained the best results, as discussed in [
27].
Thus, the training results after 30 epochs are as follows:
Normalized Confusion Matrix: Analyzing the resulting confusion matrix (
Figure 8), it can be observed that the “car” class performs very well, as it is the most common and diverse object in the dataset. Similarly, the “pedestrian crossing” class also achieves excellent results. However, this is because there is limited variation; the training and validation images feature this object in a very similar manner. Next, it can be seen that the “motorcycle” class also performs well, although not perfectly. This is due to the underrepresentation of this class in the dataset, and the objects are relatively small, making them easily confused with other road elements. On the contrary, the “pedestrian” class is the most challenging to recognize, primarily due to its low occurrence in the images and its small size, making it very challenging to detect.
Mean average precision (mAP): The mean average precision (mAP) at a 0.5 intersection over union (IoU) reaches a final value of 0.7 after 30 training epochs, while at a 0.95 IoU, it concludes with a value of 0.57 (see
Figure 9). This graph represents the average across all classes, as there is a significant difference in this graph when analyzed separately for each class.
Figure 10 graphically presents the training results for other relevant metrics, such as “loss (train set)” and “val_loss (test set)”.
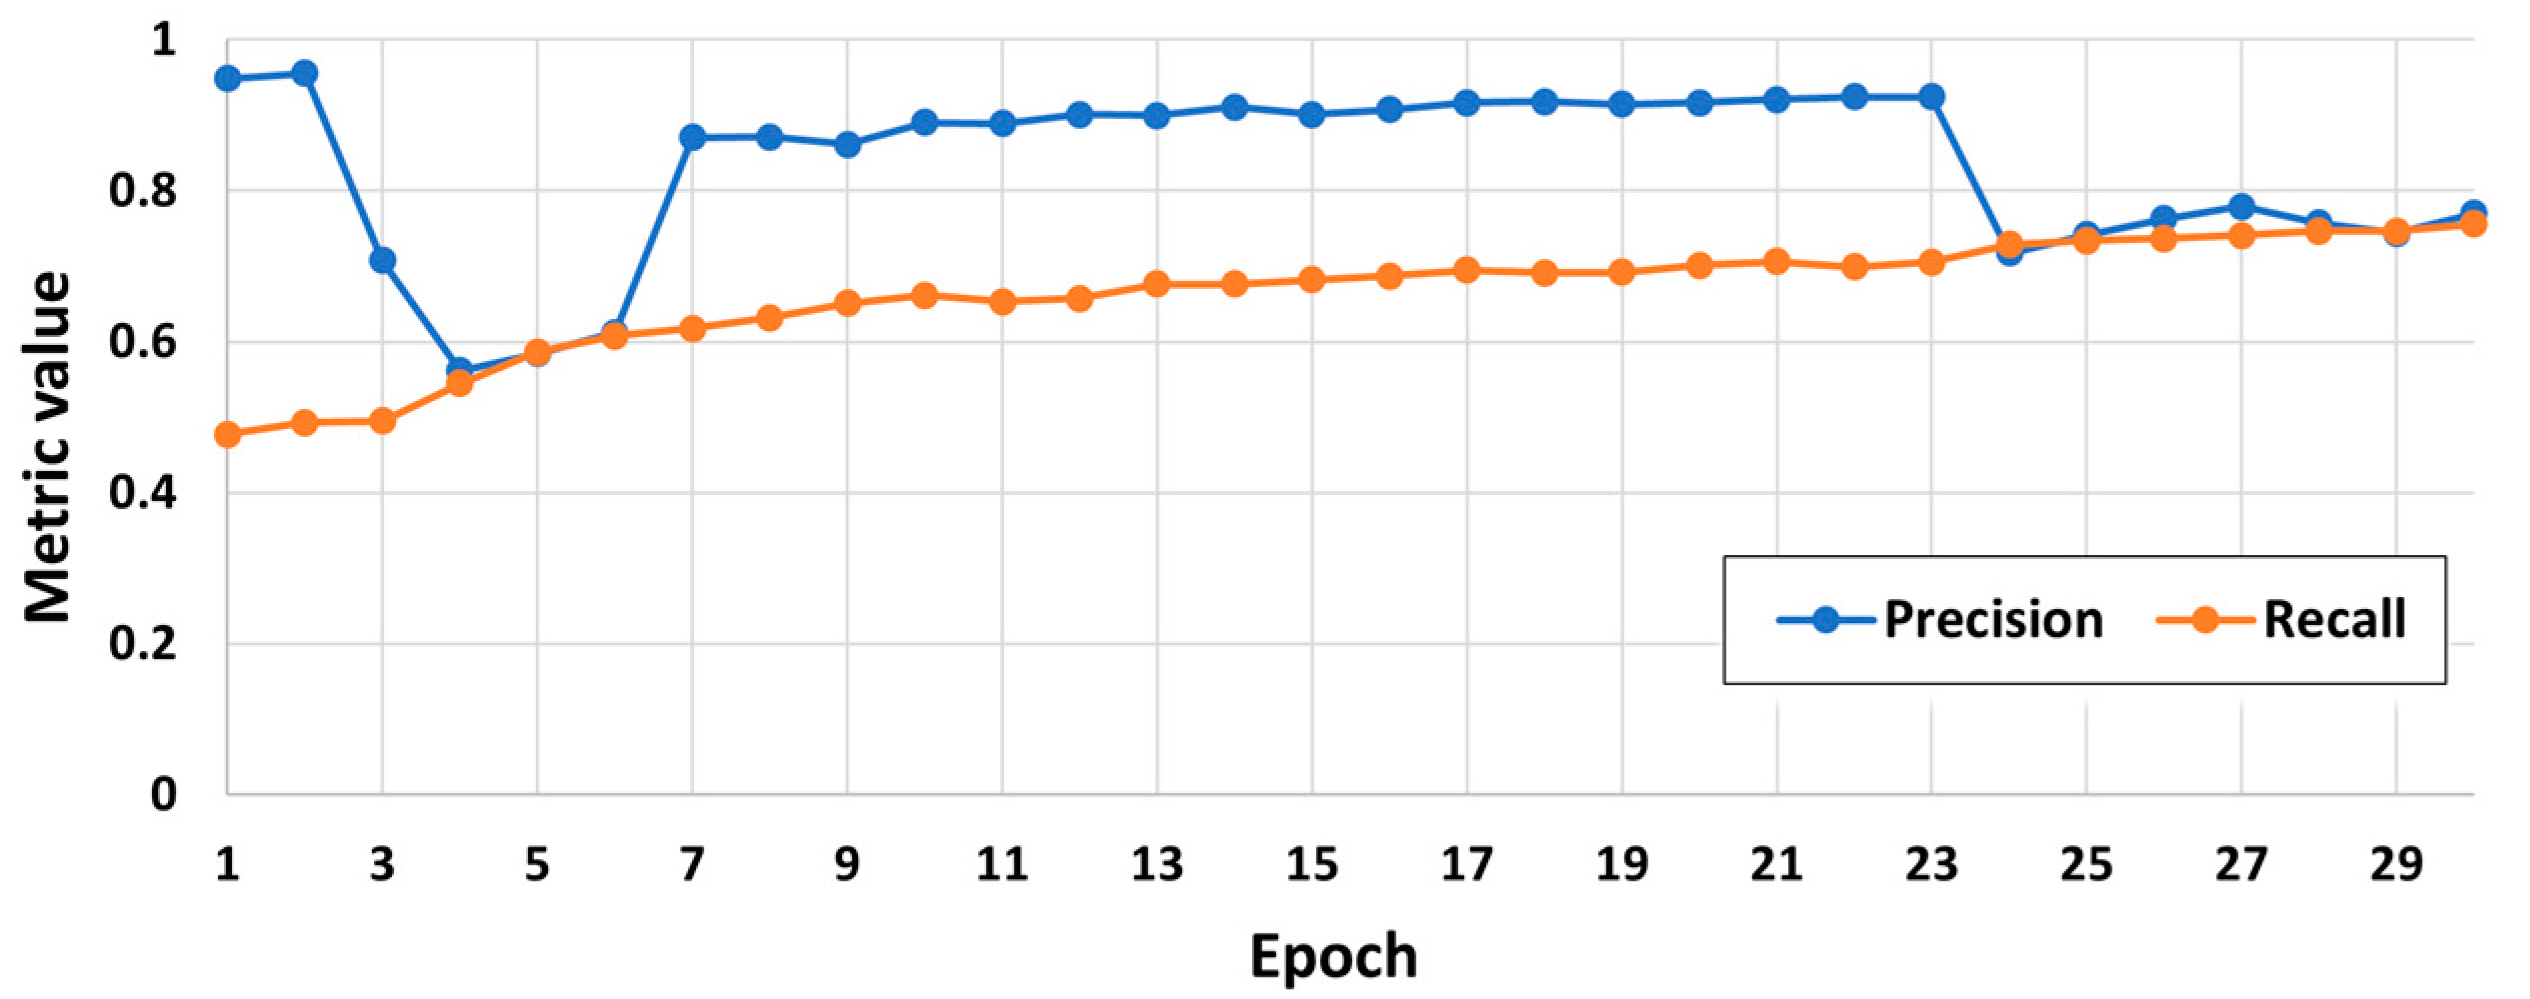
Precision and Recall: In this metric graph (see
Figure 11), the evolution of precision and recall can be observed. Precision refers to the proportion of correctly classified positive instances relative to the total instances classified as positive (true positives and false positives). Recall, also known as the true positive rate, pertains to the proportion of correctly classified positive instances relative to the total instances that are positive (true positives and false negatives) and the evolution of the precision and recall metrics over the 30 training epochs.
4. User Notes
The approach used to build the dataset shown in this work seeks to provide resources to train neural networks for artificial intelligence systems to be used in the identification of incorrect traffic maneuvers. The possible potential uses of the dataset in traffic management would be to identify dangerous or incorrect maneuvers such as oncoming traffic, speeding, pedestrians crossing outside the designated areas, and vehicles jumping traffic lights, among others.
The main features and strengths of the dataset are the 4347 visible images with just as many others corresponding to its semantic segmentation. These images show an intersection with a multitude of situations in which pedestrians and two- and four-wheeled vehicles coexist. For all of these reasons, they make the described dataset a useful contribution to traffic analysis research.
The authors will work on an update to include more urban scenes. It will also be enhanced to include a variety of lighting and weather conditions. This will be carried out to increase the diversity and breadth of the datasets and consequently improve the model performance.
Author Contributions
Conceptualization, S.B.R., D.S.J.G. and J.S.-S.; methodology, S.B.R. and J.S.-S.; software, D.S.J.G.; validation, D.S.J.G., S.B.R. and J.S.-S.; formal analysis, S.B.R. and J.S.-S.; investigation, D.S.J.G., S.B.R. and J.S.-S.; resources, D.S.J.G. and S.B.R.; data curation, D.S.J.G.; writing—original draft preparation, D.S.J.G., J.S.-S. and S.B.R.; writing—review and editing, J.S.-S., S.B.R., D.S.J.G. and J.F.-A.; visualization, D.S.J.G. and S.B.R.; supervision, J.S.-S.; project administration, S.B.R.; funding acquisition, J.F.-A. All authors have read and agreed to the published version of the manuscript.
Funding
This work is part of the I + D + i projects, with references PID2019-104793RB-C32, PDC2021-121517-C33, and PDC2022-133684-C33, and funded by MCIN/AEI/10.13039/501100011033.
Institutional Review Board Statement
Not applicable.
Informed Consent Statement
Not applicable.
Data Availability Statement
Acknowledgments
The authors would like to thank the Universidad Francisco de Vitoria and the Universidad Europea de Madrid for their support. In addition, special thanks are due to the Universidad Europea de Madrid for allowing us to use their high-capacity cluster for the training of the machine learning models.
Conflicts of Interest
The authors declare no conflicts of interest.
Abbreviations
The following abbreviations are used in this manuscript:
| DETR | DEtection TRansformer |
| ROS | Robot Operating System |
| API | Application Programming Interfaces |
| RGB | Red–Green–Blue |
| PNG | Portable Network Graphics |
| TIFF | Tagged Image File Format |
| YOLO | You Only Look Once |
| OpenCV | Open Computer Vision |
| IoU | Intersection over Union |
| mAP | Mean Average Precision |
| UAV | Unmanned Aerial Vehicle |
References
- Aliane, N.; Fernandez, J.; Mata, M.; Bemposta, S. A system for Traffic Violation Detection. Sensors 2014, 14, 22113–22127. [Google Scholar] [CrossRef] [PubMed]
- Santhosh, K.K.; Dogra, D.P.; Roy, P.P. Anomaly Detection in Road Traffic Using Visual Surveillance: A Survey. ACM Comput. Surv. 2020, 53, 119. [Google Scholar] [CrossRef]
- Franklin, R.J. Traffic Signal Violation Detection using Artificial Intelligence and Deep Learning. In Proceedings of the 2020 5th International Conference on Communication and Electronics Systems (ICCES), Coimbatore, India, 10–12 June 2020; pp. 839–844. [Google Scholar] [CrossRef]
- Cordts, M.; Omran, M.; Ramos, S.; Rehfeld, T.; Enzweiler, M.; Benenson, R.; Franke, U.; Roth, S.; Schiele, B. The Cityscapes Dataset for Semantic Urban Scene Understanding. In Proceedings of the IEEE Conference on Computer Vision and Pattern Recognition (CVPR), Las Vegas, NV, USA, 27–30 June 2016; Available online: https://openaccess.thecvf.com/content_cvpr_2016/papers/Cordts_The_Cityscapes_Dataset_CVPR_2016_paper.pdf (accessed on 12 October 2023).
- He, X.; Zheng, Z. A Driving Warning Method based on YOLOV3 and Neural Network. In Proceedings of the 2019 IEEE International Conference on Service Operations and Logistics, and Informatics (SOLI), Zhengzhou, China, 6–8 November 2019; pp. 116–121. [Google Scholar] [CrossRef]
- Neuhold, G.; Ollmann, T.; Rota Bulo, S.; Kontschieder, P. The Mapillary Vistas Dataset for Semantic Understanding of Street Scenes. In Proceedings of the IEEE International Conference on Computer Vision (ICCV), Venice, Italy, 22–29 October 2017; Available online: https://openaccess.thecvf.com/content_ICCV_2017/papers/Neuhold_The_Mapillary_Vistas_ICCV_2017_paper.pdf (accessed on 4 September 2023).
- Yu, F.; Chen, H.; Wang, X.; Xian, W.; Chen, Y.; Liu, F.; Madhavan, V.; Darrell, T. BDD100K: A Diverse Driving Dataset for Heterogeneous Multitask Learning. In Proceedings of the IEEE/CVF Conference on Computer Vision and Pattern Recognition (CVPR), Seattle, WA, USA, 13–19 June 2020; Available online: https://openaccess.thecvf.com/content_CVPR_2020/papers/Yu_BDD100K_A_Diverse_Driving_Dataset_for_Heterogeneous_Multitask_Learning_CVPR_2020_paper.pdf (accessed on 12 October 2023).
- CARLA Team. (s.f.). CARLA Simulator. Actors and Blueprints. Types of Actors. Traffic Signs and Traffic Lights. Available online: https://carla.readthedocs.io/en/0.9.14/core_actors/#traffic-signs-and-traffic-lights (accessed on 6 September 2023).
- de la Peña, J.; Bergasa, L.M.; Antunes, M.; Arango, F.; Gómez-Huélamo, C.; López-Guillén, E. AD PerDevKit: An Autonomous Driving Perception Development Kit using CARLA simulator and ROS. In Proceedings of the 2022 IEEE 25th International Conference on Intelligent Transportation Systems (ITSC), Macau, China, 8–12 October 2022; pp. 4095–4100. [Google Scholar] [CrossRef]
- Jang, J.; Lee, H.; Kim, J.-C. CarFree: Hassle-Free Object Detection Dataset Generation Using Carla Autonomous Driving Simulator. Appl. Sci. 2021, 12, 281. [Google Scholar] [CrossRef]
- Shirazi, M.S.; Morris, B.T. Looking at Intersections: A Survey of Intersection Monitoring, Behavior and Safety Analysis of Recent Studies. In IEEE Transactions on Intelligent Transportation Systems; IEEE: Piscataway, NJ, USA, 2017; Volume 18, pp. 4–24. [Google Scholar] [CrossRef]
- Gao, S.; Paulissen, S.; Coletti, M.; Patton, R. Quantitative Evaluation of Autonomous Driving in CARLA. In Proceedings of the 2021 IEEE Intelligent Vehicles Symposium Workshops (IV Workshops), Nagoya, Japan, 11–17 July 2021; pp. 257–263. [Google Scholar] [CrossRef]
- Zapridou, E.; Bartocci, E.; Katsaros, P. Runtime Verification of Autonomous Driving Systems in CARLA. In Runtime Verification. RV 2020. Lecture Notes in Computer Science; Deshmukh, J., Ničković, D., Eds.; Springer: Cham, Switzerland, 2020; Volume 12399. [Google Scholar] [CrossRef]
- Dosovitskiy, A.; Ros, G.; Codevilla, F.; Lopez, A.; Koltun, V. CARLA: An Open Urban Driving Simulator. In Proceedings of the 1st Annual Conference on Robot Learning, Mountain View, CA, USA, 13–15 November 2017; pp. 1–16. Available online: http://proceedings.mlr.press/v78/dosovitskiy17a/dosovitskiy17a.pdf (accessed on 12 October 2023).
- Open Robotics. ROS—Robot Operating System. 2021. Available online: https://www.ros.org/ (accessed on 12 October 2023).
- Zofka, M.R.; Tottel, L.; Zipfl, M.; Heinrich, M.; Fleck, T.; Schulz, P.; Zollner, J.M. Pushing ROS towards the Dark Side: A ROS-based Co-Simulation Architecture for Mixed-Reality Test Systems for Autonomous Vehicles. In Proceedings of the 2020 IEEE International Conference on Multisensor Fusion and Integration for Intelligent Systems (MFI), Karlsruhe, Germany, 14–16 September 2020; pp. 204–211. [Google Scholar] [CrossRef]
- Stevic, S.; Krunic, M.; Dragojevic, M.; Kaprocki, N. Development and Validation of ADAS Perception Application in ROS Environment Integrated with CARLA Simulator. In Proceedings of the 2019 27th Telecommunications Forum (TELFOR), Belgrade, Serbia, 26–27 November 2019; pp. 1–4. [Google Scholar] [CrossRef]
- Perez-Gill, O.; Barea, R.; Lopez-Guillen, E.; Bergasa, L.M.; Gomez-Huelamo, C.; Gutierrez, R.; Diaz, A. Deep Reinforcement Learning based control algorithms: Training and validation using the ROS Framework in CARLA Simulator for Self-Driving applications. In Proceedings of the 2021 IEEE Intelligent Vehicles Symposium (IV), Nagoya, Japan, 11–17 July 2021; pp. 1268–1273. [Google Scholar] [CrossRef]
- CARLA Simulator. The ROS Bridge Package. Available online: https://carla.readthedocs.io/projects/ros-bridge/en/latest/run_ros/ (accessed on 12 November 2023).
- GitHub. The ROS Bridge Package. Available online: https://github.com/carla-simulator/ros-bridge/blob/master/docs/run_ros.md (accessed on 12 November 2023).
- Redmon, J.; Divvala, S.K.; Girshick, R.B.; Farhadi, A. You Only Look Once: Unified, Real-Time Object Detection. In Proceedings of the 2016 IEEE Conference on Computer Vision and Pattern Recognition (CVPR), Las Vegas, NV, USA, 27–30 June 2016; pp. 779–788. [Google Scholar]
- Milić, A.; Randjelovic, A.; Radovanović, M. Use of Drones in Operations in the Urban Environment. 2019. Available online: https://www.researchgate.net/profile/Marko-Radovanovic-2/publication/336589680_Use_of_drones_in_operations_in_the_urban_environment/links/60d2751845851566d5839b29/Use-of-drones-in-operations-in-the-urban-environment.pdf (accessed on 3 September 2023).
- Krajewski, R.; Bock, J.; Kloeker, L.; Eckstein, L. The highD Dataset: A Drone Dataset of Naturalistic Vehicle Trajectories on German Highways for Validation of Highly Automated Driving Systems. In Proceedings of the 2018 21st International Conference on Intelligent Transportation Systems (ITSC), Maui, HI, USA, 4–7 November 2018; pp. 2118–2125. [Google Scholar] [CrossRef]
- Breuer, A.; Termöhlen, J.A.; Homoceanu, S.; Fingscheidt, T. openDD: A large-scale roundabout drone dataset. In Proceedings of the 2020 IEEE 23rd International Conference on Intelligent Transportation Systems (ITSC), Rhodes, Greece, 20–23 September 2020; pp. 1–6. [Google Scholar]
- Sánchez-Soriano, J.; De-Las-Heras, G.; Puertas, E.; Fernández-Andrés, J. Sistema Avanzado de Ayuda a la Conducción (ADAS) en rotondas/glorietas usando imágenes aéreas y técnicas de Inteligencia Artificial para la mejora de la seguridad vial. Logos Guard. Civ. Rev. Científica Cent. Univ. Guard. Civ. 2023, 1, 241–270. Available online: https://revistacugc.es/article/view/5708 (accessed on 5 December 2023).
- Rosende, S.B.; Fernández-Andrés, J.; Sánchez-Soriano, J. Optimization Algorithm to Reduce Training Time for Deep Learning Computer Vision Algorithms Using Large Image Datasets with Tiny Objects. IEEE Access 2023, 11, 104593–104605. [Google Scholar] [CrossRef]
- Bemposta Rosende, S.; Ghisler, S.; Fernández-Andrés, J.; Sánchez-Soriano, J. Implementation of an Edge-Computing Vision System on Reduced-Board Computers Embedded in UAVs for Intelligent Traffic Management. Drones 2023, 7, 682. [Google Scholar] [CrossRef]
| Disclaimer/Publisher’s Note: The statements, opinions and data contained in all publications are solely those of the individual author(s) and contributor(s) and not of MDPI and/or the editor(s). MDPI and/or the editor(s) disclaim responsibility for any injury to people or property resulting from any ideas, methods, instructions or products referred to in the content. |
© 2023 by the authors. Licensee MDPI, Basel, Switzerland. This article is an open access article distributed under the terms and conditions of the Creative Commons Attribution (CC BY) license (https://creativecommons.org/licenses/by/4.0/).


 and
and 


