1. Introduction
Bluetooth is one of the most used and recognized communication protocols due to its facile connectivity and integration solutions. An increasing number of devices implement and use it in different applicability contexts, such as audio streaming, healthcare tracking, smart homes, etc. The current work analyzes the utilization of Bluetooth devices in an academic examination setting where students participate simultaneously in taking exams. The current work assumes that the more people are present in a location, the higher the Bluetooth traffic volume will be. Specialized hardware was used to collect information about the Bluetooth traffic and consequently, an in-depth analysis of the collected data was performed.
The current work is new and significant because it provides both a method for collecting Bluetooth data, and also performs an analysis of the encountered Bluetooth traffic in a setting rarely presented in the research literature. Interconnected personal devices are accessible for everyone in the current society and they are mostly used to improve the quality of life and experience of their users. However, given the topic of this article, it is also plausible to assume that Bluetooth device utilization may involve some ill intent (cheating) to increase the chances of passing the exams [
1,
2,
3]. The analysis that is carried out in the current work is characterized by postprocessing the data and finding traffic patterns that are pinpointed in certain locations in the examination room but also identifies devices that generated more traffic than others. The work carried out in the current article is a critical first step in implementing a more sophisticated traffic detection mechanism that can be used in future research involving Bluetooth captures.
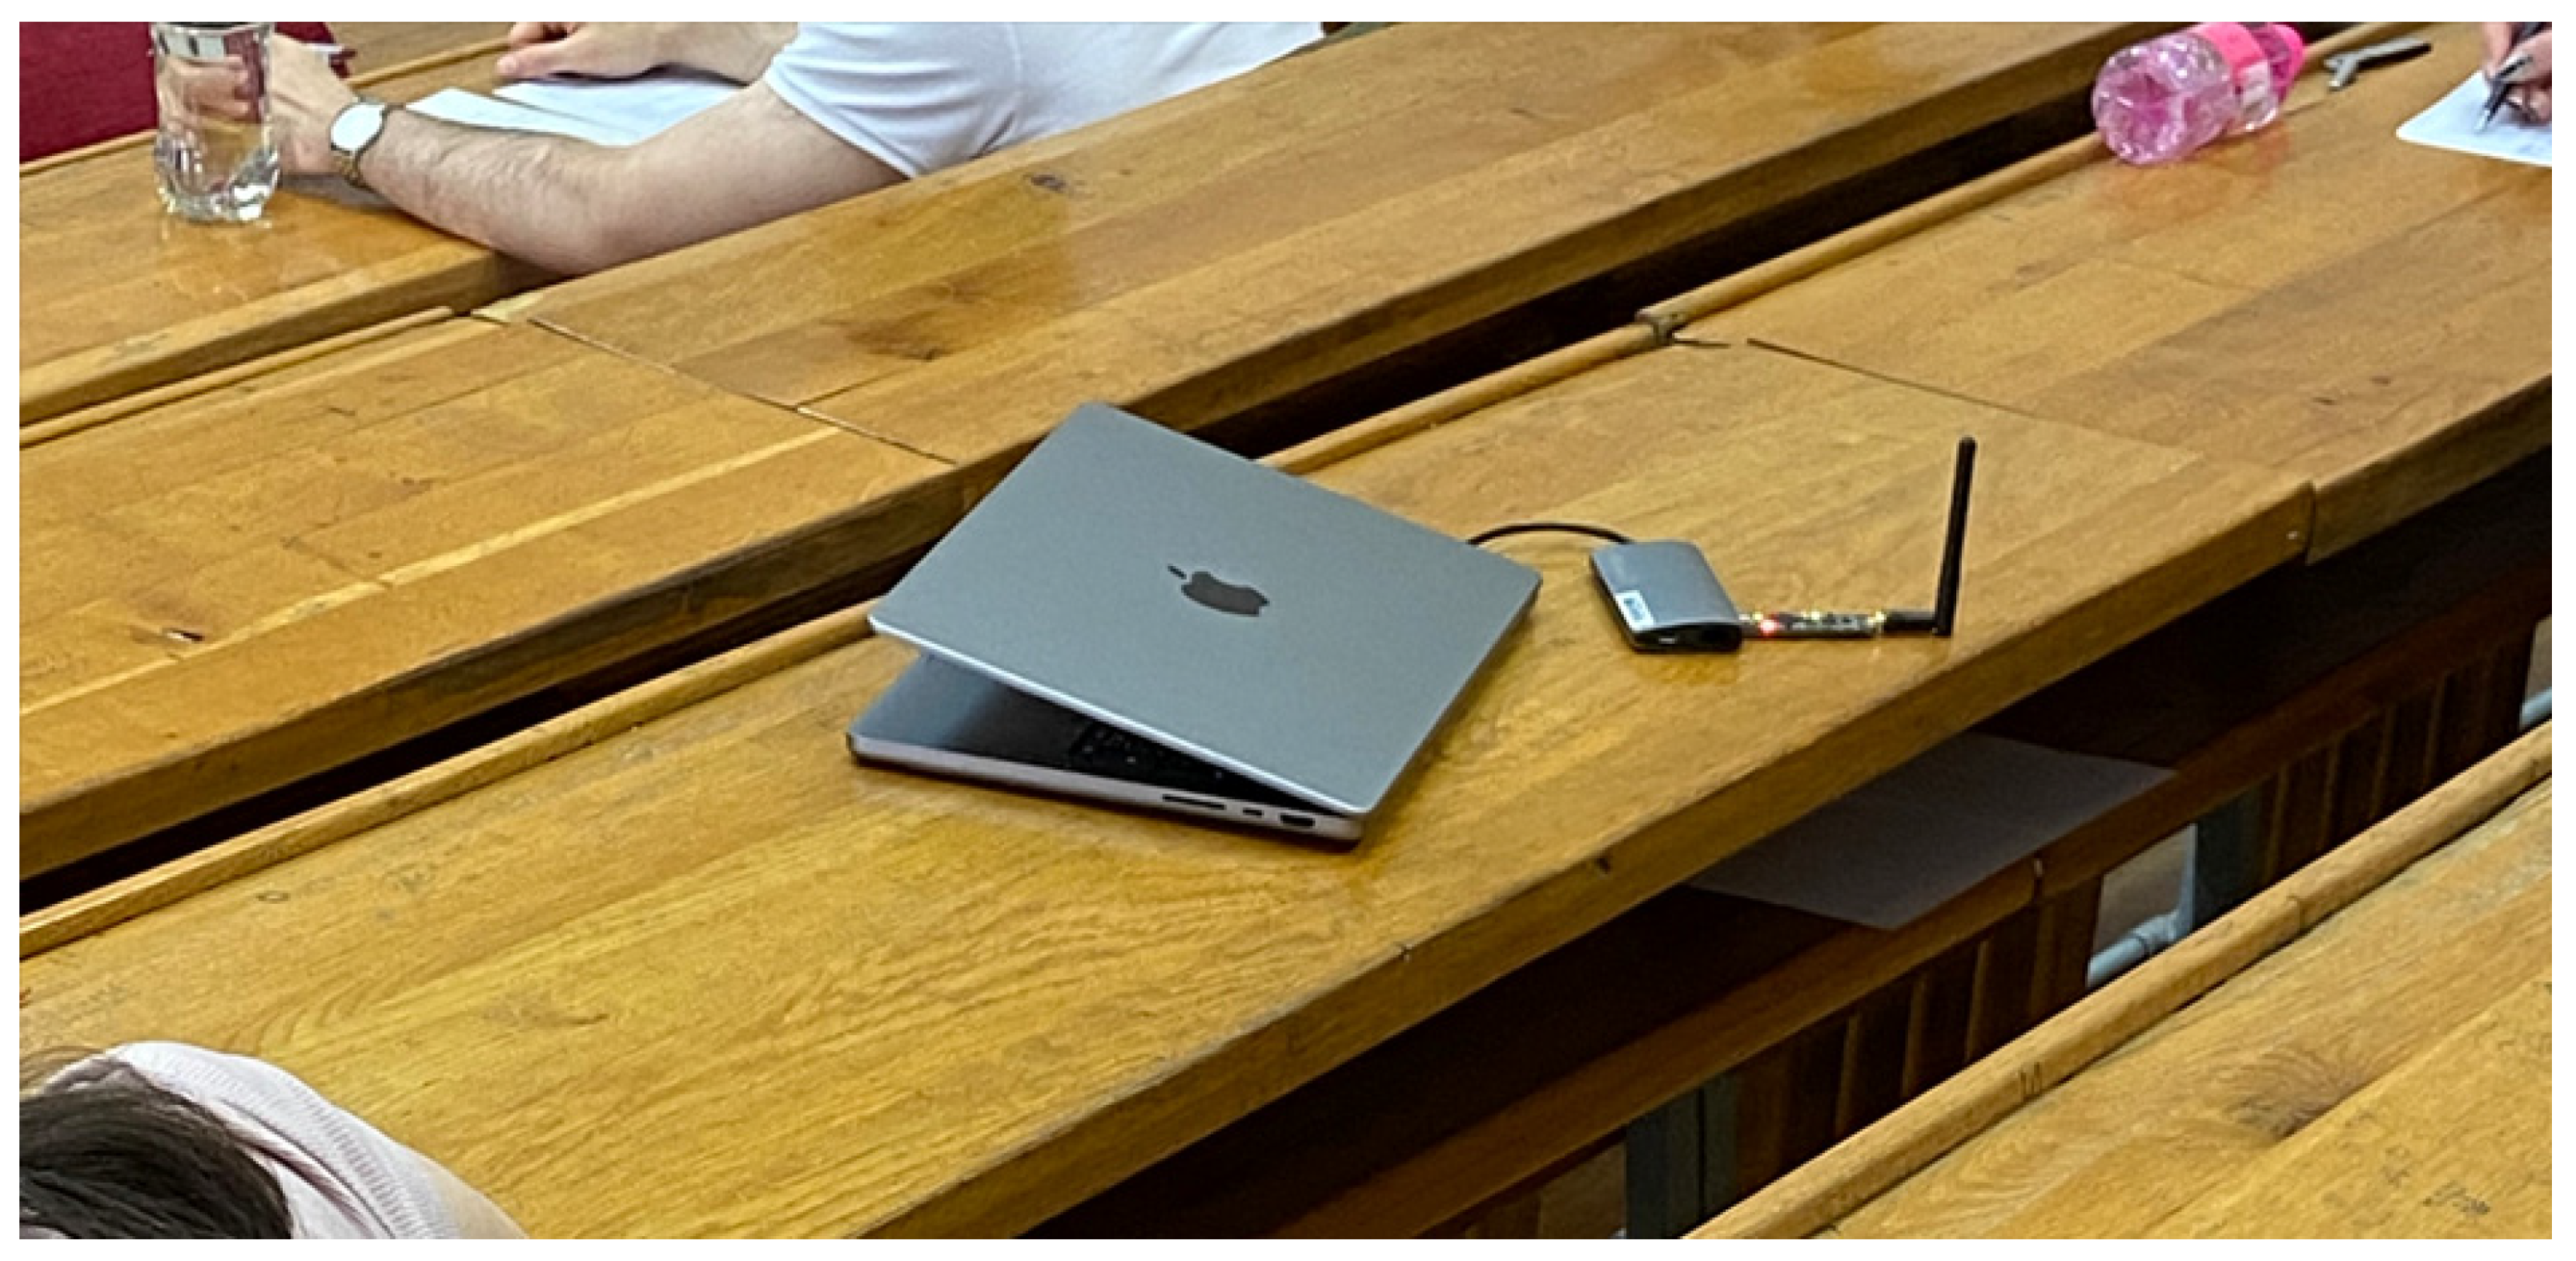
The current work is complex, given its utilization of specialized hardware to record the needed data in situations that very rarely occur (examination settings only take place a few times a year). Hence, meticulous planning is imperative in the data recording procedure, leaving no margin for error. Consequently, the obtained dataset after such a session is unique. To inspect the Bluetooth traffic, a dataset was gathered during several examination sessions with the help of an Ubertooth One device. It is a USB development platform that can monitor and intercept nearby Bluetooth traffic, hence acting as a passive eavesdropper. The analysis and interpretation are based on five data sets, each being captured under a number of conditions that vary throughout the actual sessions: different numbers of students, three different exam room layouts, and several intercepting places around these rooms. The Ubertooth One device was connected to a laptop which was moved at a certain time interval around the room to extend the detection area and acquire more data. It is important to mention that only partial information about the recorded devices was captured. Any Bluetooth MAC address comprises three parts: the lower address part (LAP -> 24 bits), which is assigned by the chip vendor, the upper address part (UAP -> 8 bits), which is specific to a certain chip vendor, and the non-significant address part (NAP -> 16 bits). In the scanning method, the Ubertooth One device collects only the LAPs from any device in its proximity. It is not enough to uniquely identify a particular device—no personal information about the students was recorded.
The main contributions of the current work are the following:
Provided a method to obtain a Bluetooth traffic dataset from an academic examination setting;
Provided technical methods to analyze the dataset;
Extracted traffic information and interpreted the information from the previously obtained dataset;
Contributed to the scientific community with a unique type of Bluetooth traffic dataset.
The remainder of this article is structured as follows:
Section 2 describes the data collection procedure and presents the obtained dataset;
Section 3 performs an in-depth analysis of the captured dataset;
Section 4 concludes the paper with additional ideas for further research.
2. Data Collection Procedure and Dataset Description
The data set was organized into five smaller Bluetooth captures. The Ubertooth One device was connected to a MacBook set up with the required libraries to run different chipset commands. Requiring only a simple survey capture each time (recording all the LAPs found in a particular area of interest), the current work relied on the following command: ubertooth-rx -z [
4].
Figure 1 shows the hardware setup for collecting the data during the student examination sessions.
The sets were captured during the summative laboratory tests and final exams taken by the students and consist of the following:
The method of collecting the packets followed the same pattern during every recording session and consisted of launching the capture in front of the examination room. After a certain amount of time, which varied between the sessions, the laptop was moved to other positions around the room. This ensured maximal capture coverage, as the antenna has a range of 9 m (30 ft). Every location was pinpointed in the schematic layout of the room. Moreover, along with the data packets, the length and the width of each room were measured. Having this additional information, zones of Bluetooth activity could be precisely pinpointed.
As mentioned previously, the data were organized into five files:
Data_research_2023_05_31_12–13 h.txt—consists of 68 unique Bluetooth MAC addresses and the data were collected in room A. There were 48 students present in this session;
Data_research_2023_05_31_13–14 h.txt—consists of 64 unique Bluetooth MAC addresses and the data were collected in room A. There were 52 students present in this session;
Data_research_2023_05_31_20–21 h.txt—consists of 48 unique Bluetooth MAC addresses and the data were collected in room B. There were 122 students present in this session;
Data_research_2023_06_06_starting_at_17 h_and_lasted_80_min.txt—consists of 62 unique Bluetooth MAC addresses and the data were collected in room C. There were 70 students present in this session;
Data_research_2023_06_14_starting_at_11_and_lasted_90_min.txt—It consists of 72 unique Bluetooth MAC addresses and the data were collected in room A. There were 52 students present in this session.
All the data files share the same format, as shown in
Figure 2:
The relevant fields are the system time when a packet was captured (first field in
Figure 2), the LAP (third field), and the second to last field, denoted as s. This is the signal strength, measured in dB, represents a physical transmission parameter—it is directly related to the distance between the detected sender device and the Ubertooth One receiver and is dependent on the transmission power at the source.
It is important to note that these captures may contain, excluding the false positives resulting from the signal processing, the Bluetooth MAC addresses of the supervisors. Other addresses that should be excluded from the captures are the Bluetooth inquiry packets, which have a LAP of 0x9e8b33. These are transmitted either by the Ubertooth One dongle or by any other device that scans its proximity for any device ready to set a connection.
Along with the captured data, the layout of the examination rooms was also constructed, and each recording location was designated a number that represents the order in which the sniffing ensemble was moved around the room, as shown in
Figure 3.
3. Dataset Analysis
Setting up the interpretation of the captures, several lines of code were written in bash. The starting point in the analysis was the number of detected Bluetooth devices in each examination session. In total, there were 263 Bluetooth MAC addresses intercepted. A primary classification, as shown in
Figure 4, was created in four categories (varying from a low confidence factor to a very high confidence factor, which indicated that valid traffic was detected):
178 LAPs with one packet transfer -> low confidence => 68% total;
42 LAPs between two and 16 transfers -> medium confidence => 16% total;
20 LAPs between 23 and 98 transfers -> high confidence => 8% total;
23 LAPs between 106 and 3376 transfers -> very high confidence => 9% total.
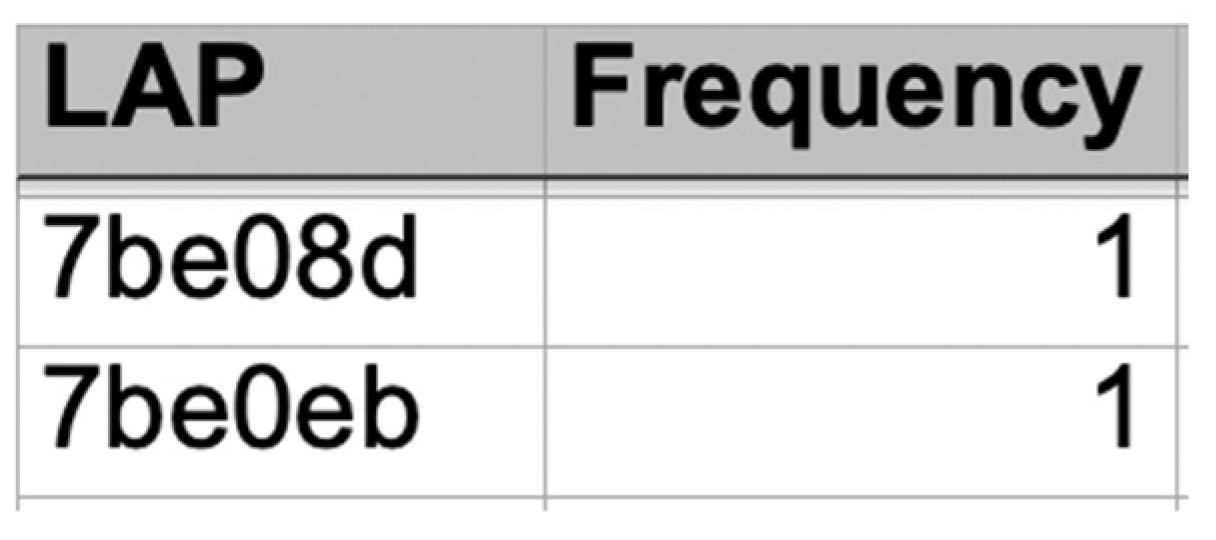
It is important to note that most of the LAPs were detected only once, a sample of which is shown in
Figure 5. This means that there might have been a certain percentage of false positives among these captures. According to the official Ubertooth One documentation, whenever a LAP is detected more than once, the Ubertooth One device has successfully detected a Bluetooth transmission.
When manually checking the MAC address pool, an assumption can be made that several packets might be transmitted from the same device but are recorded as different devices due to several factors: inconsistencies in the transmission decryption, lack of actual packages being sent, or moving the laptop to another spot when the piconet address is first detected. According to [
5], a simple Ubertooth One collection system is prone to 25–50% packet loss, which denotes that there was likely more traffic data around the rooms that were not recorded or were mislabeled.
The signal strength (S) or RSSI (Received Signal Strength Indicator) is a parameter that describes the physical transmission and is defined as the ratio between the power of the transmitter and the power of the receiver. This factor is directly proportional to the distance—the higher the RSSI becomes, the closer the distance [
6]. Each packet captured by the Ubertooth One device encapsulates the RSSI, measured in dBm. In general, it is expressed in the form of an exponential decay (in its simplest form) in Equation (1):
where:
n is the signal propagation constant: depends on the transmission environment; for free space, without any obstacles, it is set at a fixed value of 2 [
7];
A is the reference RSSI value, computed when the sender is at a distance of 1 m; this parameter is dependent on the sender device, as each Bluetooth chip has a different transmission power; this parameter is found as the TxPower information of a particular device;
d is the distance (in meters) from the targeted device.
Adding the information about the signal strength to the bins above offers a more precise way to eliminate outliers. First, determining the interval of all the RSSI in the data set provides insight into how Ubertooth collects its data. Then, corroborating the lowest established values in this range with the information collected about the received packet frequencies, a reduction of plausible MAC addresses from the low confidence interval can be deduced. In the current datasets, the spectrum of incident signals varied from –81 dBm to 0 dBm. Every value from –81 dBm to –70 dBm was programmatically checked against the recurrence of the LAPs, consequently determining that 131 out of the total of 178 LAPs in the first bin were candidates for being false positives. The removal threshold for this dataset was–73 dBm. This was a drop of 73% in packets that did not hold valuable information for distance detection. However, they should not be phased out, as these packets can be used as algorithm verification data.
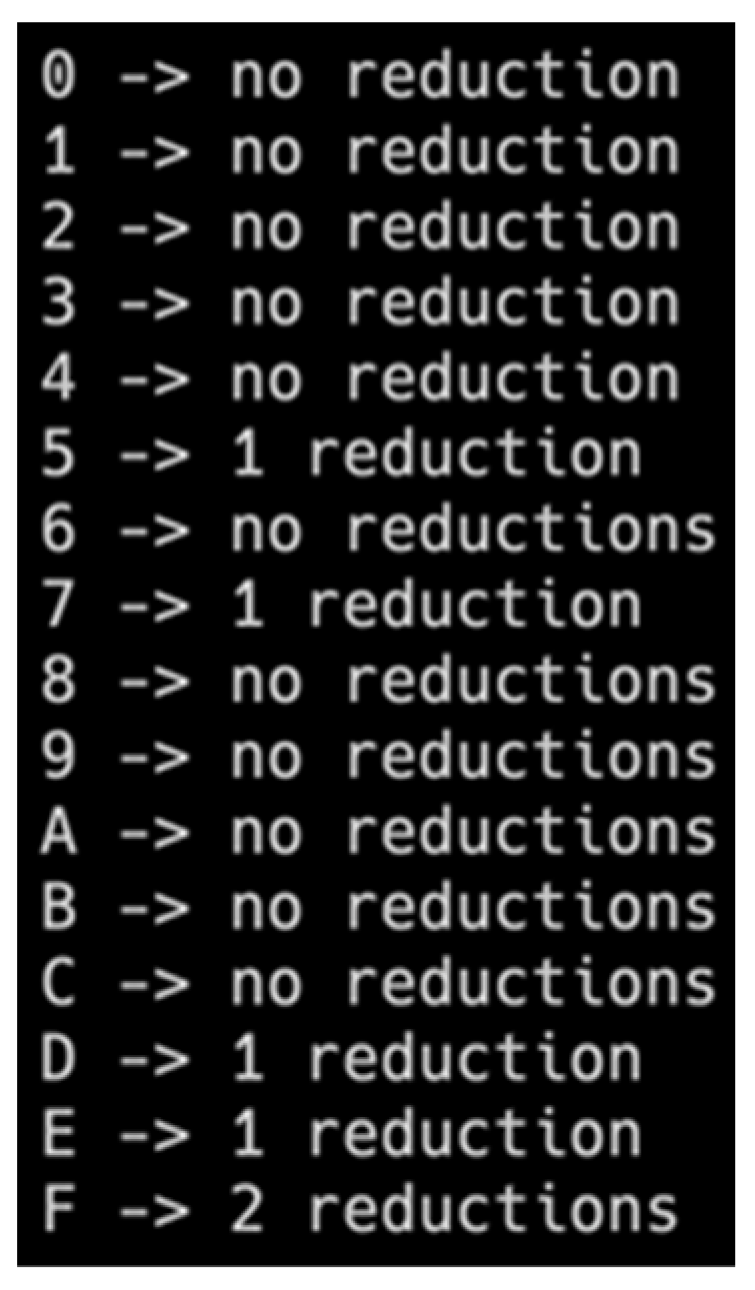
Considering a fine-tuning of the result above, the next algorithmic approach proposes a reduction of Ubertooth LAP decoding errors that might appear when a packet is received. As shown previously, a human agent could recognize that some of the LAPs that are recorded as different derive from the same LAP. To fix this programmatically, a metric was introduced that provides the number of bits that must be flipped to proceed from one address to another. A threshold value was implemented to dictate if the substitution was considered valid or not. Using this method, the number of correctly interpreted addresses further decreased. To ease the calculations, this filtration was applied on every subset of LAPs beginning with a hex letter from 0 to F.
Figure 6 shows the result of executing this algorithm on every remaining address.
For this example, the threshold was set to 4, meaning that a maximum of 4 bits could be changed to consider the LAP as being the same. In total, 6 reductions could still be applied to retrieve the true positives. This brought the total down to 41 addresses (from the 47 remaining from the previous filtration) that were considered valid.
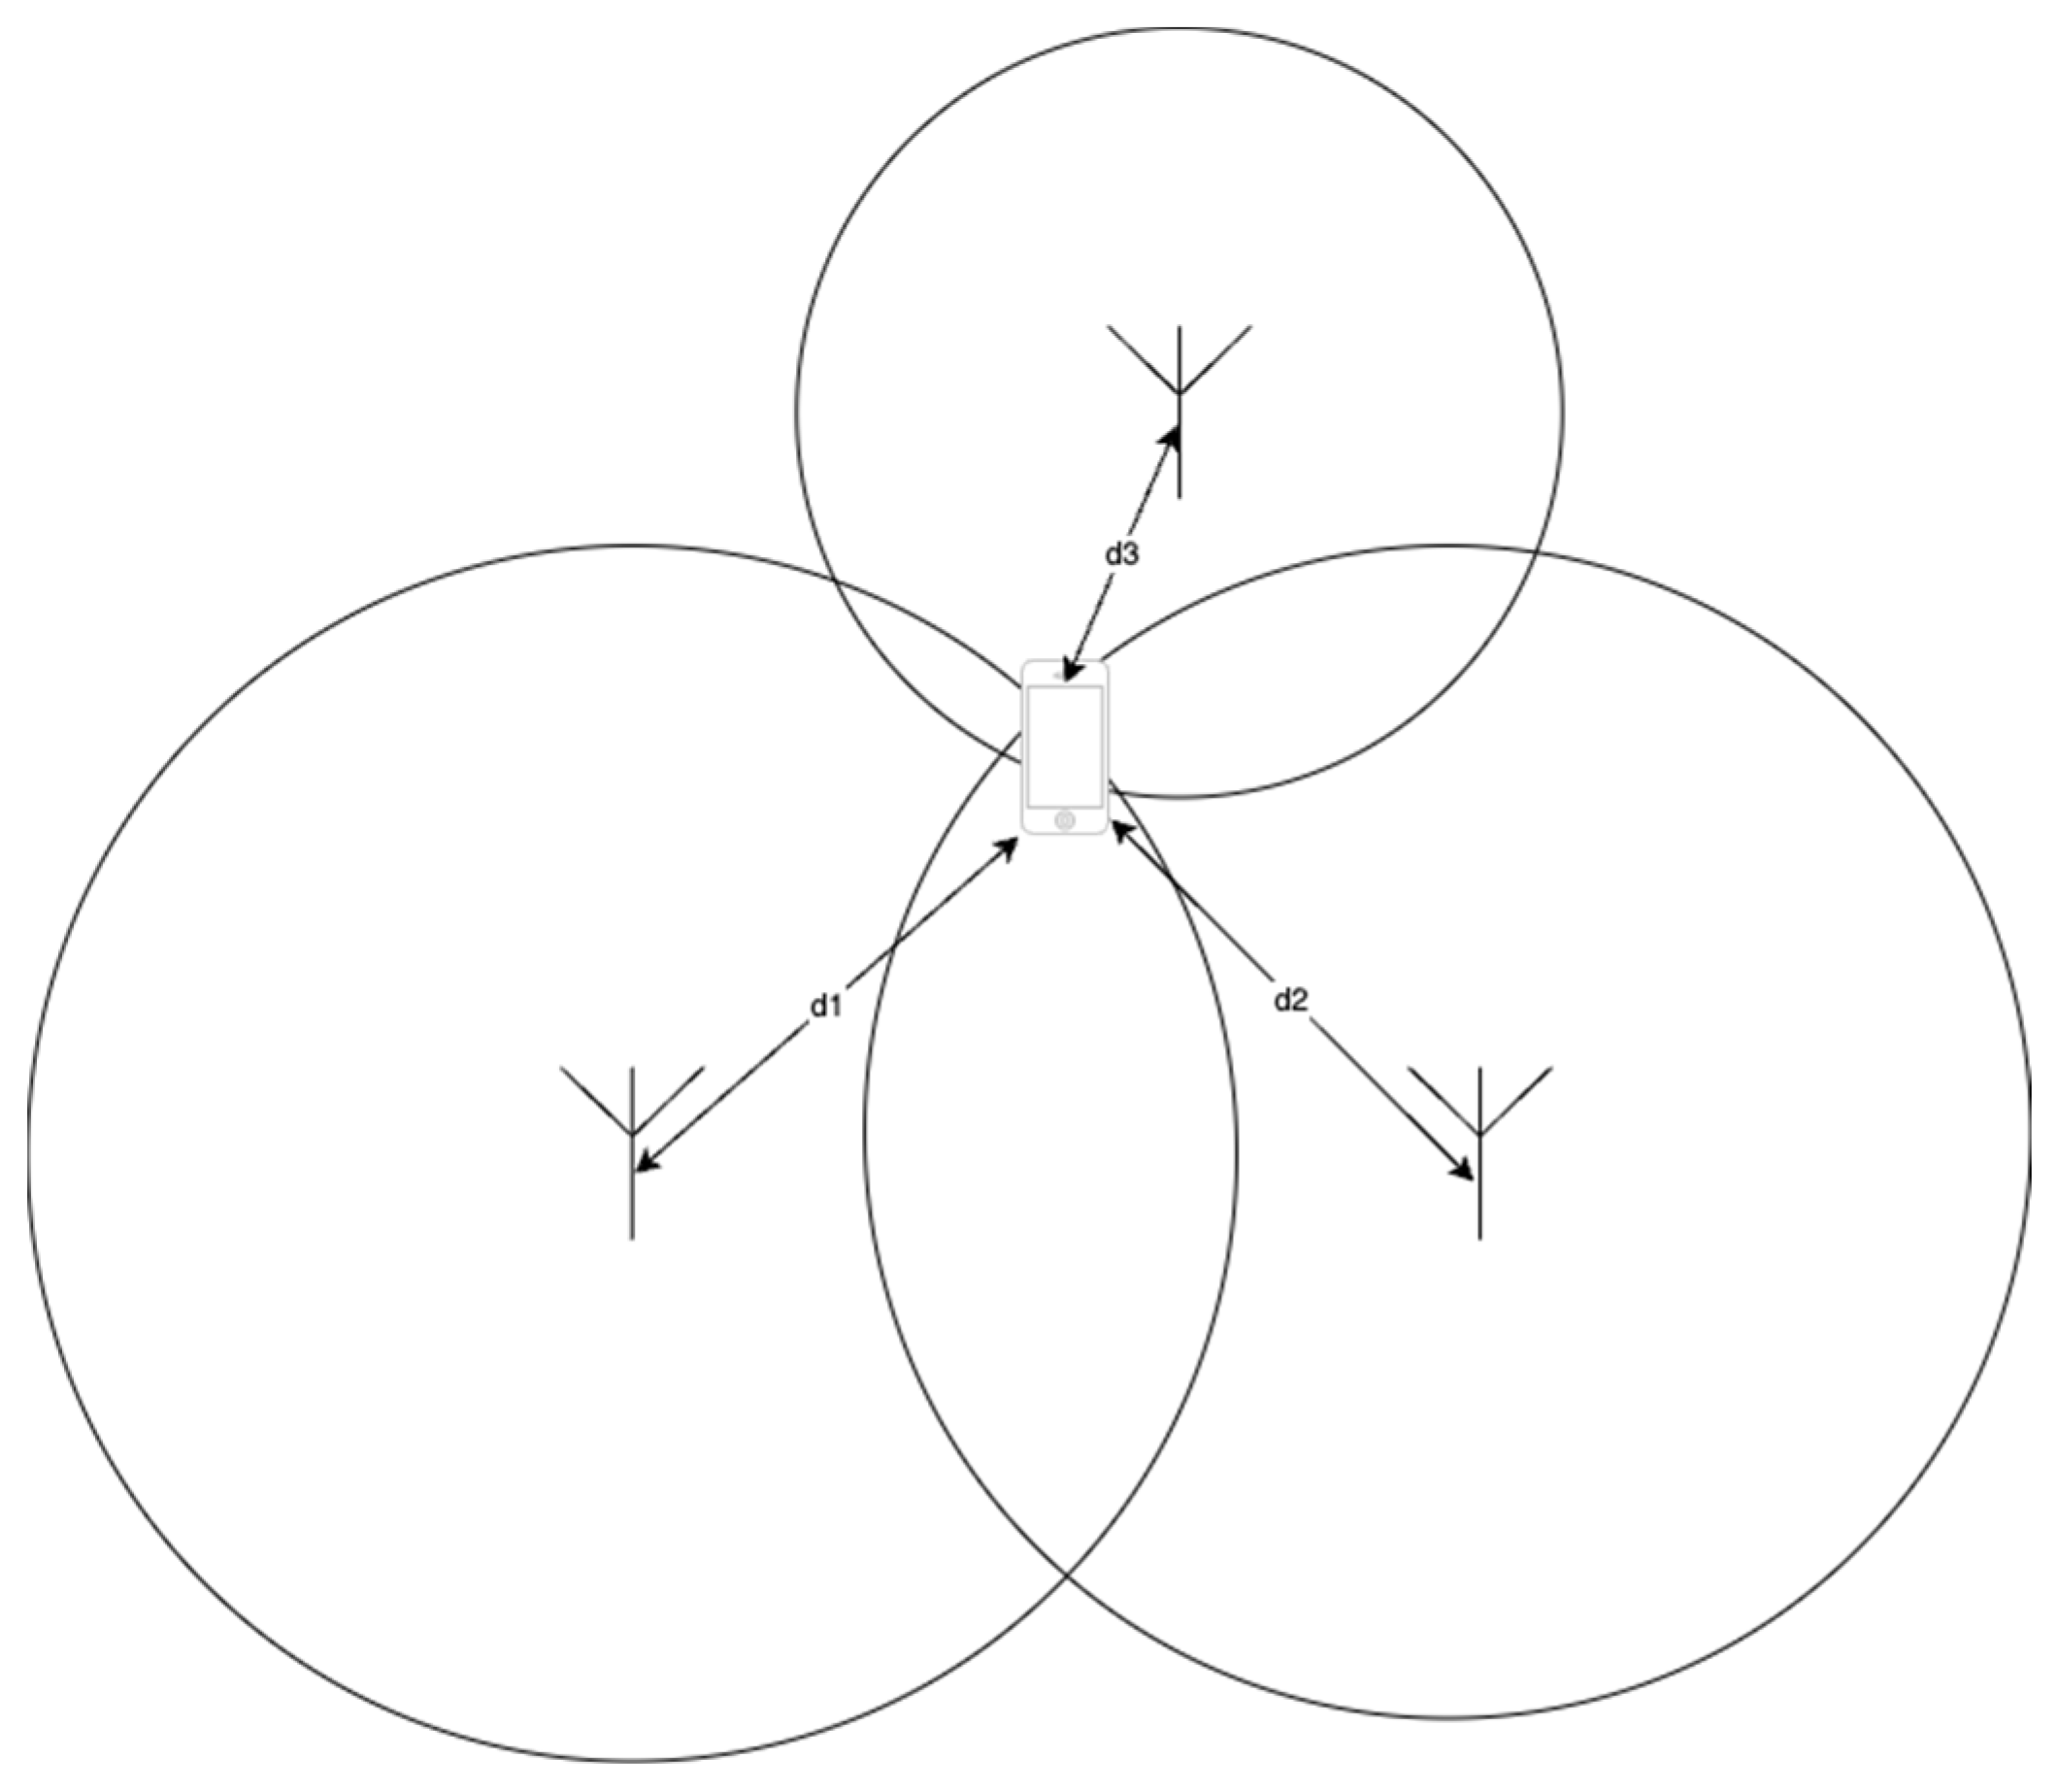
The mathematical technique used to accurately determine the position of an object, based on several fixed and known recording locations, is called multilateration [
8]. In the case when the signal is received in three different locations, the process is called trilateration, which is presented in
Figure 7. The procedure solves a system of non-linear equations described by the format shown in Equation (2), where n is the number of points where the sniffing device was positioned:
The position of the Ubertooth One device was changed at almost equal intervals of time around the examination rooms. These intervals were proportional to the number of recording spots.
Focusing on the 80-minute capture, there were eight locations where the laptop was placed. At each point, the incoming traffic was sniffed for a variable time interval, as the students started leaving the examination room after they submitted the exam. The Ubertooth One device was kept closer to the largest crowd. Splitting the data capture file into eight even fragments and checking the LAP-signal strength relation for the packets in each fragment, we was expected to notice a certain median difference in signal strength for a device. For example, taking the LAP value of 5f744e (as this address was in the very high confidence range set up above with 153 packets captured) and looking for it at each point of capture, an estimated distance to the transmitting device can be computed. Averaging the signal strength values in each sniffing location, the value fluctuated by almost 20 dBm from the first position to the last one.
Based on this information, a heatmap distribution can be established to visualize the distribution of the signal. It is built upon a mathematical model of a Kernel Density Estimation—a sum of Gaussian Distributions. At the coordinates where the signal was stronger, the distribution peak was higher and, subsequently, the marker on the physical room layout had a brighter color, as shown in
Figure 8.
Reference transmission power levels were required discern the precision of the coordinates that were computed. Therefore, a previous recording from an empty exam room was used to compare the results extracted from the real measurements. In the baseline capture, a known number of four devices were in the proximity of the Ubertooth One device. The signal strength of the device with LAP 5f744e was used as the reference value.
Table 1 shows the accuracy of the measurements for each bucket.
The differences between the capture sessions against the buckets are shown in
Figure 9. The main observation is that the signal strength in the baseline was higher, on average, than the signal strength in the exam session recording. Due to a greater number of devices present in the room at the same time, it was expected that the interference generated from all these devices would have had an impact on the overall detected signal strength. It became degraded not only from the Bluetooth protocol traffic but also from any other 802.11.x (WiFi) or 802.15.4 (ZigBee) protocol traffic that was sending data in the proximity of the Ubertooth One device.
Analyzing the data sheets of the most frequently used smartphones (taking into consideration both iOS- and AndroidOS-powered devices), the average transmission power of a device was computed at around −61.75 dBm, with a rate of tolerance of 10%. It is important to mention that there is no difference between the collected advertisement data of iOS and Android devices, as the same communication protocol is used to send the Bluetooth data frames, regardless of how it is implemented in the proprietary firmware of the devices. Two sets of distances were estimated, from the lower bound of −55 dBm to the higher bound of −65 dBm of the transmission power. Having this information, the distance to the device with LAP 5f744e could be estimated at every capture location.
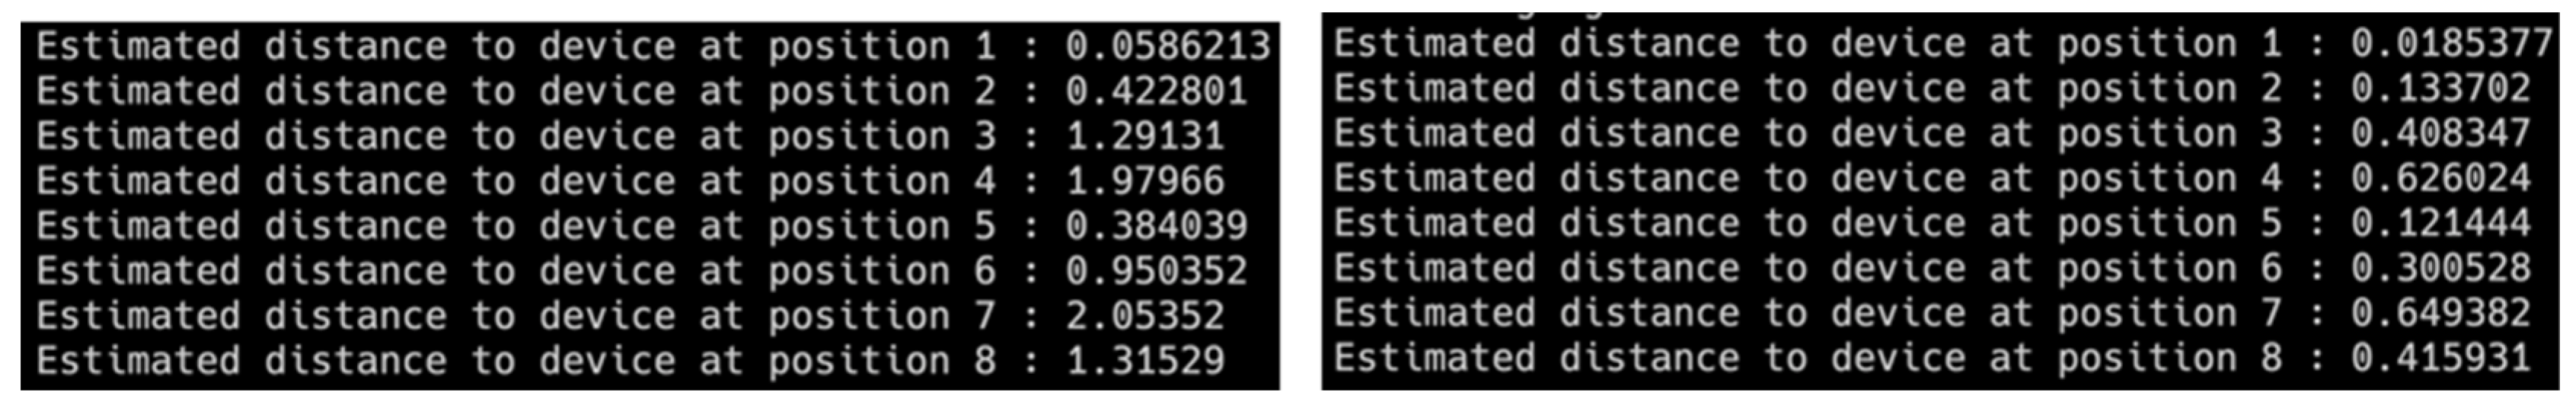
Figure 10 shows the recorded distances to the device with the LAP value 5f744e.
This address was chosen in particular because it represents one of the exam supervisor’s smartphones. As the device moved around the room, the Ubertooth One device detected it as closer or farther away. This information was inscribed in the specific heat map.
Algorithm 1, as shown below, can be applied to every LAP in the recorded address pool to calculate the distance and the transmission heat map generated by every device in the examination room.
| Algorithm 1. Algorithm that computes the distance and the transmission heat map generated by the devices. |
INPUT: Recorded capture, LAP address, room layout, recording positions
STEP 1: Load data
STEP 2: Calculate the number of bins
STEP 3: Split the capture into buckets which contain only the packets with the specific input LAP
FOREACH dataRow IN capture DO
IF dataRow.contains(LAP) THEN
save data row in each specific bin
END IF
END FOREACH
STEP 4: Calculate the average RSSI for each bin
STEP 5: Calculate the distance using the logarithmic model, using an average for the transmission power
STEP 6: Get the coordination of each location in the room layout as pixels
STEP 7: Calculate how much each bin contributes to the heat map based on the average RSSI value of each bin
IF RSSI.isLow() THEN
Add the data point fewer times to the coordinates array
END IF
STEP 8: Build the kernel distribution estimation
STEP 9: Plot the kernel distribution estimation against the room layout |
This algorithm can be applied to every LAP in the recorded address pool to calculate the distance and the transmission heat map generated by every device in the examination room.
4. Conclusions
This paper presents a method for collecting and analyzing Bluetooth traffic in an academic examination classroom. The analyzed data set consists of five captures taken on different days. Three captures were taken on the first day, one on the second day, and one on the third day (each taking place 7 days apart). In every session recorded on a separate day, each capture contained less Bluetooth data. This means that the students were less inclined to use an external device or to have their smartphones powered on during the exam when the Ubertooth One collection ensemble was positioned in their proximity. The students were not provided with specific instructions, such as switching off their Bluetooth devices, to ensure their behavior closely mirrored that of a standard examination session. However, it can be concluded that some concerns regarding data access were present among the student cohort, thus causing a dataset degradation as the days passed. More concisely, this means that the dataset obtained in the last examination session might not be as relevant as the one encountered in the first examination session. In the same configuration of 52 students, there were 2648 packets captured in the first session, compared to only 685 in the last session, resulting in a 74.5% drop. With the hardware used in the current setup, it is possible to capture the packet metadata for all sniffed traffic. Decoding this metadata provides information if the packet contains a data payload or is simply an advertisement frame.
The measurements of the signal strength for every Bluetooth MAC address present a method of detecting the approximate location of the transmitting device. The traffic analysis method is enhanced by taking into consideration the frequency of the packets and by filtering out the packets originating from the supervisors’ devices. Adding more sniffing devices in different corners of the classroom (without having to move the currently used Ubertooth One device) increases the rate of detecting true positives. This also helps to better trilaterate any MAC address. The heat maps provide a way to visualize the intensity of the signal strength and show where the signal emerges. It has been shown how a device can be tracked (with a particular error rate) to its location in the room. Superimposing heat maps for each detected LAP, a general zone of Bluetooth activity can be determined.
Future research of the work presented in this article can be extended to a real-time detection method using more sniffing devices to create a distributed system where the entire classroom can be monitored without changing the Ubertooth One device location every few minutes. The current method of using only a single Ubertooth One device has limitations. The accuracy of the Bluetooth signals’ multilateralism can be drastically increased by having a capturing ensemble in each position across the room, with at least three devices placed. This also facilitates the real-time visualization and computation of the coordinates. Having a distributed system that uses multiple Ubertooth One devices to send each captured packet to a centralized processing unit creates a basis for reducing the kernel density estimation to a more precise localization. Furthermore, this would offer the possibility to draw the heatmap in real-time over a live screen capture of an examination room from a video recording device. This would result in more signal strength data, and therefore more algorithms could be applied to pre-process the values to obtain more precise information [
9]. Gaining more data provides a great opportunity for artificial intelligence models to further analyze and extract more precise results. Subsequently, having multiple Ubertooth One devices also reduces the rate of false positives, as all the data captures could be corroborated between each device and therefore eliminate the outliers. This could be even further increased by adding other sniffing devices besides the Ubertooth One device, e.g., an Adafruit Bluefruit device. There are also more specialized capturing devices that could offer results with a much higher confidence rate, such as the Ellisys BEX400. Their use case is rather specific and exceeds the current work needs. A downside to the professional systems is the high price; the Ubertooth One device is currently in an affordable range of 100–200 USD.
In conclusion, the current research created a framework for capturing and analyzing Bluetooth traffic in an academic examination setting. Further research could improve the system by using multiple monitoring devices and processing data in real time. The
Supplementary Materials in this article contain a unique dataset of Bluetooth traffic captures from the examination sessions that can be used by other researchers. This type of data is difficult to generate, as examination sessions only take place a few times a year, and increasing the number of capture sessions causes participants to turn off their devices due to data access concerns, making this a critically important step in this research field.


