
Longitudinal Patterns of Online Activity and Social Feedback Are Associated with Current and Perceived Changes in Quality of Life in Adult Facebook Users

Department of Psychology, University of Turin, 10124 Turin, Italy
*
Author to whom correspondence should be addressed.
Data 2024, 9(4), 51; https://doi.org/10.3390/data9040051
Submission received: 31 January 2024
/
Revised: 28 March 2024
/
Accepted: 29 March 2024
/
Published: 31 March 2024
Abstract
:The present study explored how sharing verbal status updates on Facebook and receiving Likes, as a form of positive social feedback, correlate with current and perceived changes in Quality of Life (QoL). Utilizing the Facebook Graph API, we collected a longitudinal dataset comprising status updates and Likes received by 1577 adult Facebook users over a 12-month period. Two monthly indicators were calculated: the percentage of verbal status updates and the average number of Likes per post. Participants were administered a survey to assess current and perceived changes in QoL. Confirmatory Factor Analysis (CFA) and the Auto-Regressive Latent Trajectory Model with Structured Residuals (ALT-SRs) were used to model longitudinal patterns emerging from the objective recordings of Facebook activity and explore their correlation with QoL measures. Findings indicated a positive correlation between the percentage of verbal status updated on Facebook and current QoL. Online positive social feedback, measured through received Likes, was associated with both current QoL and perceived improvements in QoL. Of note, perceived improvements in QoL correlated with an increase in received Likes over time. Results highlight the relevance of collecting and modeling longitudinal Facebook data for the investigation of the association between activity on social media and individual well-being.
1. Summary
The advent and widespread consumption of social media have radically transformed the way individuals interact and perceive their social environment. Social media platforms have become integral to maintaining connections with friends, family, and colleagues, thereby reshaping interpersonal communication and relationships and, eventually, their quality [1,2]. In this context, research has underscored the significance of communication affordances available on social media platforms, including Likes, favorites, and upvotes, noting that these elements may act as digital indicators of social support and solidarity within online interactions, providing tangible markers of engagement and approval [3,4] but also foster problematic social media usage [5] and social comparison tendencies [6].
The association between social media use and an individual has been a subject of continuous interest. Studies have highlighted the presence of significant connections between posting activity use on social media in relation with symptoms of psychological distress, such as depression, anxiety, and stress, e.g., [7,8,9,10,11] and for a recent review see [12], and subjective well-being, including quality of life (QoL), e.g., [13,14,15,16,17]. Using a longitudinal framework, Kross and colleagues [18] found that increased Facebook usage was associated with declines in users’ moment-to-moment happiness and overall satisfaction with life. Conversely, online social support, particularly positive social feedback on platforms like Facebook, is believed to be a significant factor in influencing users’ satisfaction with life. A study by Nabi, Prestin, and So ref. [19] indicated that receiving social support online can positively impact emotional well-being. This is further supported by findings that experiencing social support via Facebook is positively associated with users’ general well-being [19,20] and users tend to report increased perceived social support and life satisfaction when they believe they had a larger group reading their status updates [21].
Studies focusing on QoL are relatively scarce. For example, Marengo and colleagues [15] conducted a study using data mining techniques to evaluate QoL based on multiple indicators of active Facebook usage. This study applied the Random Forest algorithm to evaluate how well language features extracted from verbal posts predicted QoL dimensions, showing a moderate predictive performance on general QoL. In a similar way, Renner et and colleagues [17] proposed a novel method to infer health-related QoL from traces of social discourse in online forums using multiple machine-learning methods, including Support Vector Machine, Multi-Layer Perceptron, and Random Forest algorithms. The tested predictive models found good accuracy in detecting posts suggesting problematic QoL in at least one of the investigated QoL components (i.e., physical, psychic, activity-related, relational, and financial QoL). A more recent study by Marengo and colleagues [16], although not focusing strictly on QoL, employed objective data from Facebook to analyze how active use and received Likes correlated with self-report self-esteem and happiness. Using path analysis methods, the authors found that receiving Likes on Facebook was related to an increase in perceived happiness, self-esteem mediated this association, and sharing personal content moderated these associations. An important aspect of these studies is that by leveraging objective recordings of social media use (as opposed to self-report indicators), they provide a more direct measurement of social media interactions and their impact. A common limitation of these studies is their reliance on cross-sectional designs, which hampers the ability to draw causal conclusions. In contrast, longitudinal research, like that conducted by Shakya and Christakis [22] using data from the Gallup Panel Social Network Study, offers insights into the dynamic nature of social media interactions and their long-term effects on well-being. Using multivariate regression analyses, this study linked increased Facebook usage with adverse outcomes for physical and mental health, life satisfaction, and BMI, noting that greater engagement in the platform (e.g., expressed Likes, link clicks, status updates) correlated with declines in well-being metrics. However, it did not explore the potentially positive impacts of receiving Likes and comments. Moreover, its reliance on self-reported measures of Facebook use introduces bias risks, such as recall and social desirability biases, thereby limiting the findings’ reliability [23].
In view of these findings, the present study aims to extend the current body of research on social media by examining longitudinal patterns of both active Facebook use and online positive social feedback (i.e., received Likes) and their association with current and perceived changes in QoL among adult users.
To address the noted limitations and build upon the existing literature, our research proposes a more comprehensive approach that combines the use of objective recordings of traces of longitudinal social media activity, namely status updates and received Likes, with self-report indicators QoL. When these objective metrics are analyzed longitudinally, we gain insights into the evolving nature of these interactions and their long-term association with QoL. The Autoregressive Latent Trajectory Model with Structured Residuals (ALT-SRs) [24] emerges as a particularly apt analytical framework for this endeavor. This model uniquely integrates autoregressive (AR) processes, capturing the stability and change in observed variables over time, with a latent growth curve that models the underlying trajectory of these changes. By doing so, the ALT-SR allows for the examination of both static and dynamic effects of social media use on QoL. Furthermore, the incorporation of structured residuals in this model addresses the potential autocorrelation of residuals over time, providing a more accurate estimation of the true association between indicators of social media activity and QoL. Employing the ALT-SR model in analyzing longitudinal and objective social media data addresses the critical gaps in previous research. In this way, the present study seeks to contribute to a nuanced understanding of how virtual social interactions on platforms like Facebook can influence an individual’s perception of their overall well-being. Note that as of January 2024, Facebook, the flagship of Meta, remains the most widely used platform worldwide, with its user base exceeding three billion monthly active users [25]. As such, it is paramount to investigate its potential role as a factor in users’ well-being.
2. Materials and Methods
2.1. Procedure and Participants
Participants were recruited by disseminating the link to a web app running via a web browser online. The web app included a landing page which was used to provide participants with information about the research and collect informed consent. Inclusion criteria for participation in the research were fluency in the Italian language, legal age, and a Facebook account. The landing page included a Facebook login button which was used to obtain authorization to collect participants’ Facebook passive data (see below). After entering the app using the login button, participants were administered questionnaires assessing demographic characteristics and study measures. The university institutional review board (n° 88721) approved the research.
The application was disseminated using snowball sampling, starting with 10 university students. Data collection took place from March to June 2018. Eventually, the study survey was accessed by Facebook’s 2998 users. For the present study, analyses were performed on a subsample of 1577 participants which provided researchers with both self-report information about QoL, and Facebook data covering at least 9 months over the considered 12-month period (i.e., participants with missing data for more than 3 months were not included in the sample). The final sample considered consists of 1204 females (76.3%) and 373 males (23.7%), of which 1039 aged 18–24 (65.9%), 345 aged 25–30 (21.9%), and 193 participants aged > 30 years old (12.3%). Of these, 828 participants had a university degree or higher education (52.5%), while 725 had a high-school diploma (46%), and 24 had a middle-school certificate (1.5%).
Note that while composing and revising this document, the author(s) employed AI tools for assistance with grammar and spelling checks, and to improve clarity and readability of the text. These tools include OpenAI’s ChatGPT 4 and Google’s Gemini Advanced.
2.2. Instruments
Facebook Data
Facebook data were collected through the Graph application-programming interface (API). This process involved retrieving users’ online status update activities for the 12 months prior to the survey. Obtained data included all status updates and their corresponding Likes. Retrieved status updates included text posts; visual posts such as images or videos; link sharing to external websites; check-ins (sharing of physical location by “checking in” to a geographical location or venue); and event creation and sharing. Note that in our study, all status updates accompanied by a textual caption written by the user were considered verbal status updates. Thus, verbal status updates may consist of standalone text posts, text accompanying shared visual content, or links to external content on Facebook (e.g., news articles, blog posts, or posts on other social platforms). In short, verbal status updates refer to all textual entries posted by users on Facebook. Examples encompass sharing personal experiences, expressing opinions, or providing updates on daily activities.
The data were organized into 12 monthly segments, each covering 30 days, starting from the day participants filled in the survey. For each monthly segment, we calculated the following metrics:
- Percentage of Verbal Status Updates = (Number of Verbal Status Updates in Month/Total Number of Posts in Month) × 100.
- Average Received Likes = Total Likes in Month/Total Number of Posts in Month.
The choice to focus on verbal status updates as a percentage to the total posts relates to evidence that self-generated verbal content may be more strongly related to well-being and positive social feedback than more impersonal posts [7]. Additionally, using percentages standardizes the analysis across Facebook users with different activity levels. This approach avoids bias from highly active users’ raw status updates, focusing instead on the verbal interaction’s proportion. This method emphasizes the qualitative aspect of social media engagement, which is relevant to our study.
Table 1 presents descriptive statistics for the two metrics at every monthly time point. Please note that in the table, time point 12 coincides with the time of self-report QoL assessments. Conversely, timepoint 1 represents the time point furthest from when these self-reports were collected.
- 3.
- Quality of Life Measures
We administered a specifically devised 8-question survey to assess participants’ current state and perceived change in general QoL during the previous year. The survey assessed participants’ perception of their own general QoL, and three specific components of QoL, namely psychological, physical, and social QOL; these components have been identified as key by the World Health Organization when performing surveys assessing QoL [26]. Participants’ current QoL state was measured using four questions: (1) “How would you rate your physical health?” (Physical QOL); (2) “How would you rate your mental health?” (Psychological QOL); (3) “How satisfied are you with your personal relationships?” (Social QOL), (4) “How would you rate your quality of life?” (General QOL). Participants answered each question using a 5-point Likert scale (1—Very poor, 2—Poor, 3—Acceptable, 4—Good, 5—Very good). Then, we assessed participants’ perceived change in QoL during the last 12 months. Again, we administered four questions: (1) “Compared with a year ago, how would you rate your physical health?” (Physical QOL); (2) “Compared with a year ago, how would you rate your mental health?” (Psychological QOL); (3) “Compared with a year ago, how satisfied are you with your personal relationships?” (Social QOL), (4) “Compared with a year ago, how would you rate your quality of life?” (General QOL). Participants answered each question using a 5-point Likert scale (1—Much worse, 2—Worse, 3—About the same, 4—Better, 5—Much better).
- 4.
- Data Analysis
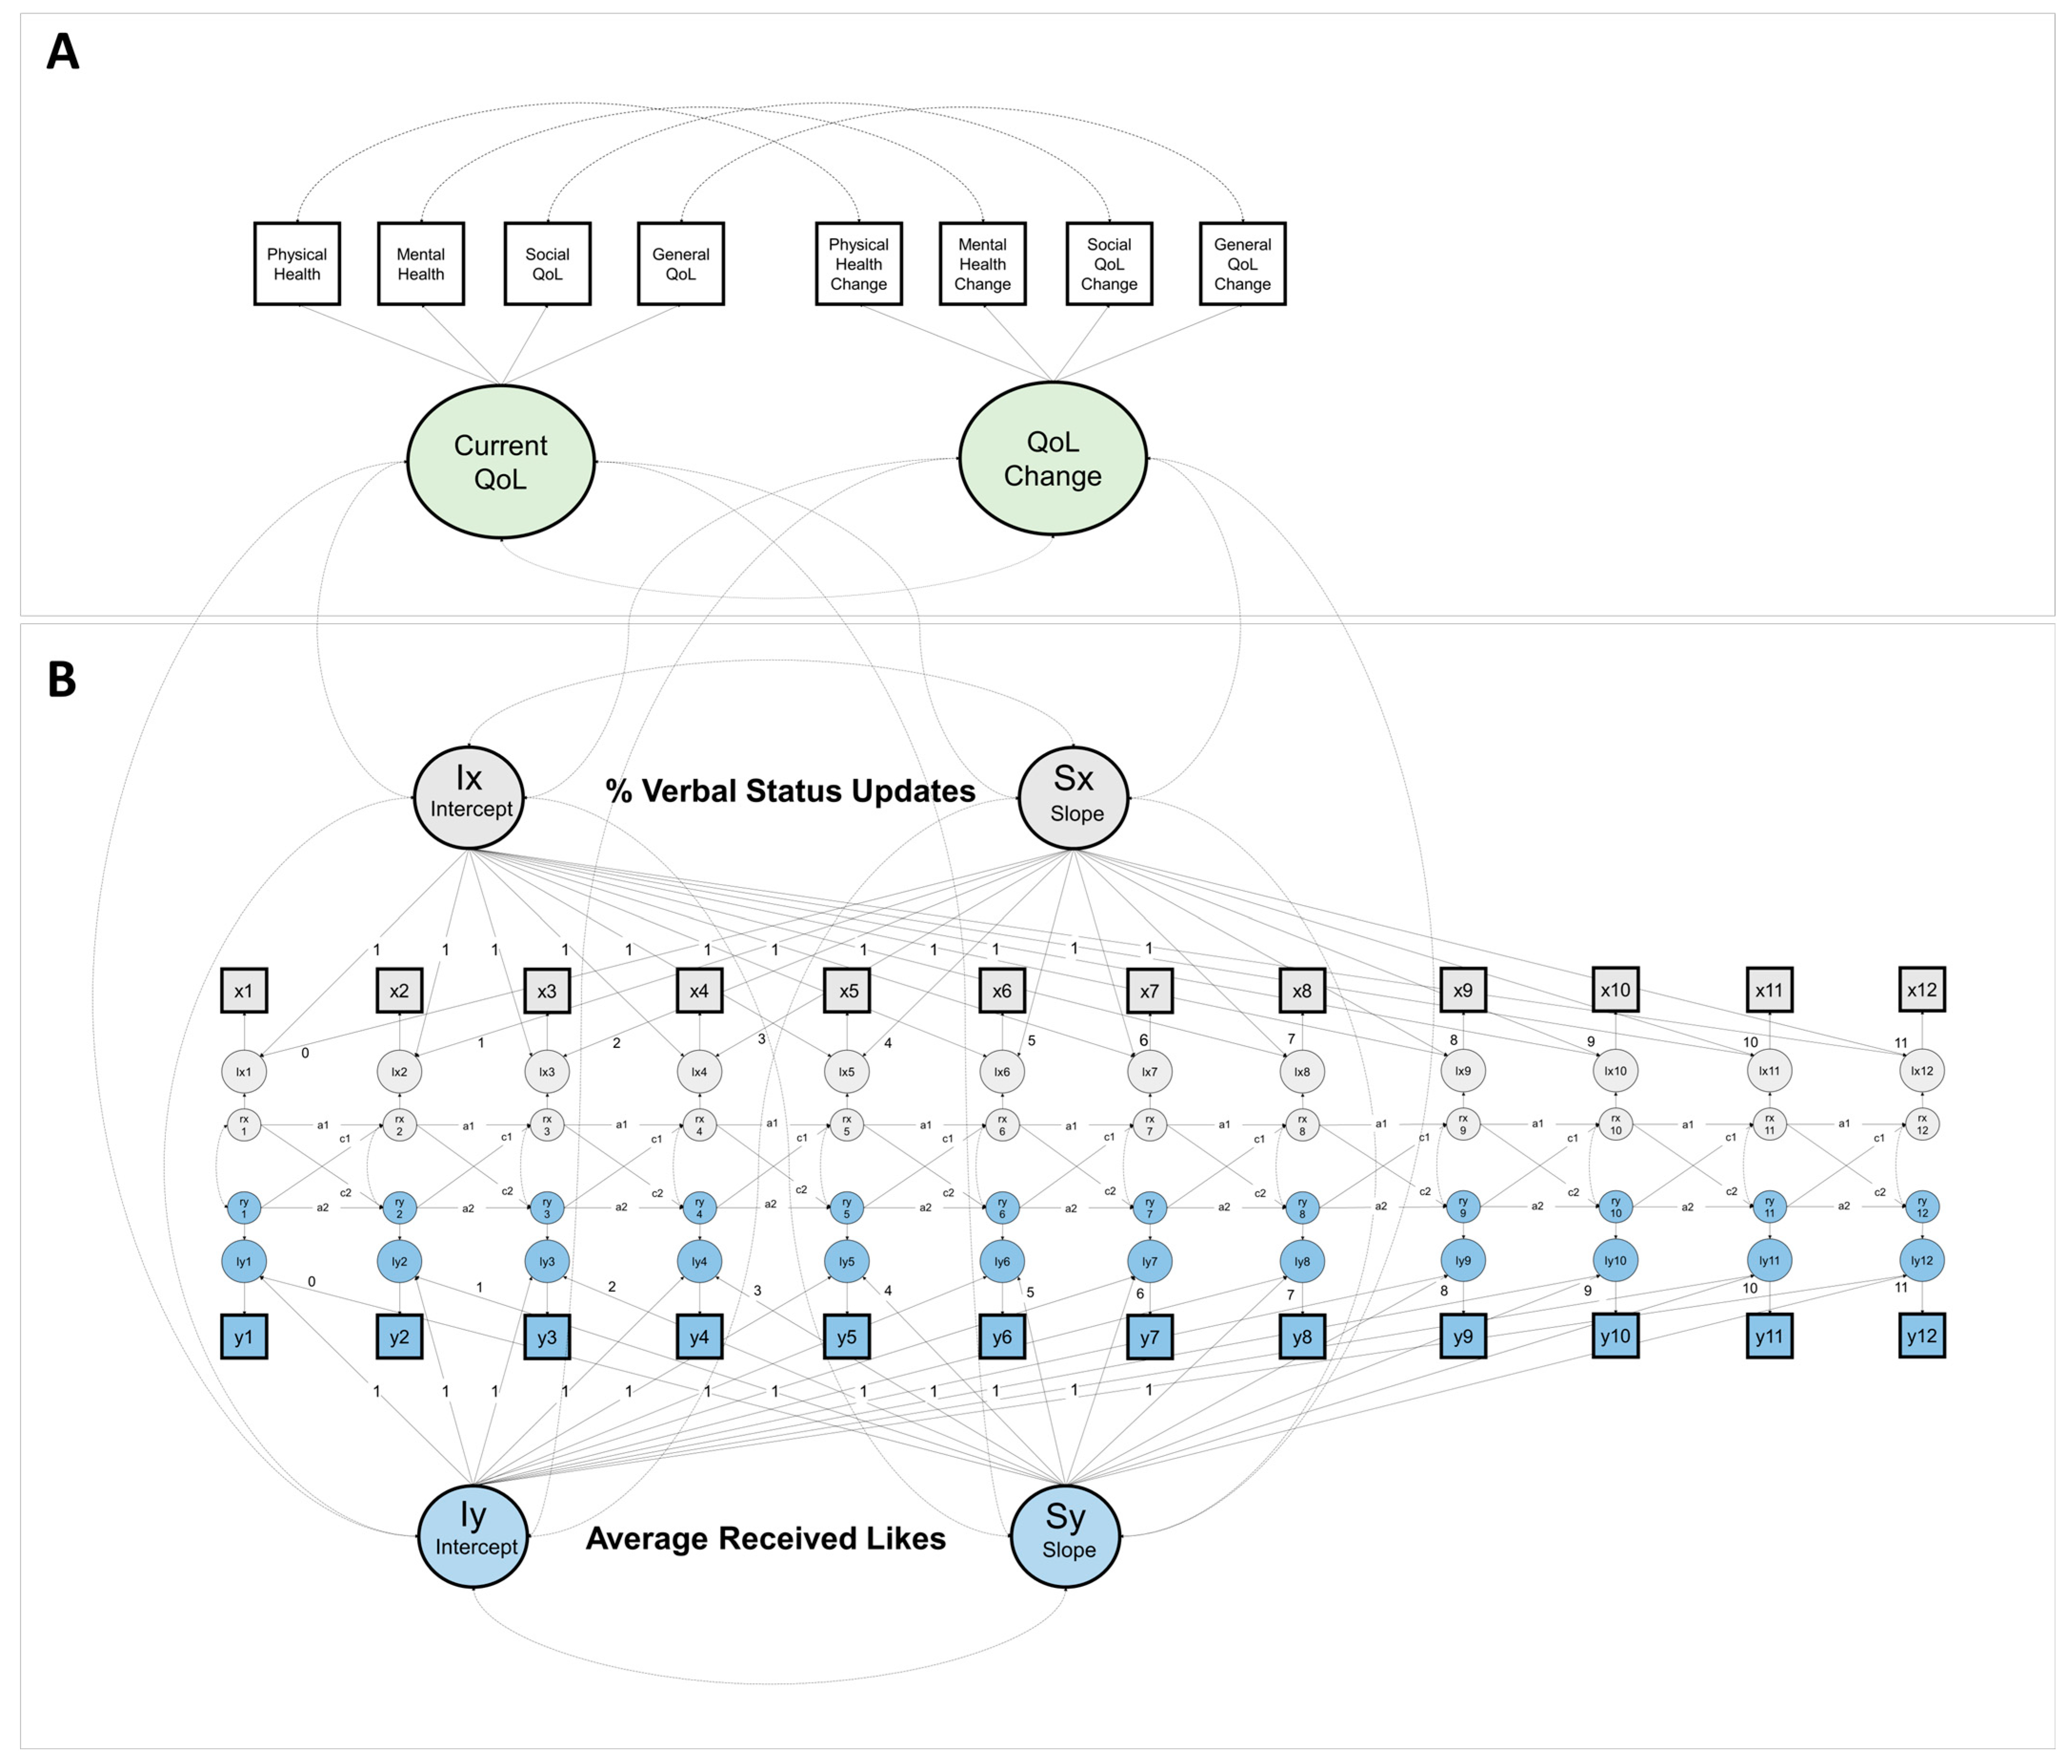
First, a Confirmatory Factor Analysis (CFA) model was estimated, including two latent constructs: current perceived QoL and perceived change in QoL. QoL was indicated by observed responses to questions measuring current states of physical health, mental health, social QoL, and general QoL (QoL). Correspondingly, perceived change in QoL was indicated by variables assessing perceived changes over the past year in these same domains. Note that in this case, change in QoL is not calculated over time, but instead is assessed based on the participants’ subjective evaluations of improvement, deterioration, or stability in their quality of life across the specified dimensions. Given the expected local dependency among variables assessing similar aspects of QoL; to account for this effect, correlations between error components of questions assessing the same component were allowed within the model. A conceptual diagram for the CFA model is represented in Figure 1A. In the figure, dashed lines indicate covariance between latent factors.
To model the longitudinal association between verbal status updates and received Likes, we used an auto-regressive latent trajectory model with structure residuals (ALT-SRs) [24]. A conceptual diagram for the model is represented in Figure 1B. In the context of Facebook data, the ALT-SR model allowed us to model between-person associations among more stable components of the user’s activity and received Likes (e.g., mean levels, growth rates), while also modeling reciprocal associations between these variables as they manifest within individuals over time. In the figure, x1–x12 and y1–y12 represent objective metrics of posting activity (i.e., percentage of verbal status updates) and positive feedback (i.e., the average received Likes) for the 12 consecutive time points (i.e., 12 months). Note that in the figure, variables at time point 12 reflect participants’ Facebook activity during the month prior to the self-report QoL assessments. Conversely, time point 1 represents the time point furthest from when these self-reports were collected (i.e., 12 months earlier).
One advantage of the ALT-SR over traditional auto-regressive cross-lag models is that we can capture variance that does not change (i.e., the intercept parameters, Ix, and Iy), the variance that changes over the course of the considered period (i.e., the slope parameters, Sx and Sy). Additionally, the model includes within-person autoregression paths (a1–a2) and cross-lagged paths (c1–c2) between residuals allowing us to determine the time-varying links between propensity to verbal posting activity on Facebook and receiving Likes across consecutive time points. Note that in our study, these cross-lagged paths were constrained to be the same across time points to capture an overall tendency over the considered 12-month period.
Finally, the models were combined in a single model to explore correlations between the latent variables representing current perceived QoL and perceived change in QoL and both intercept and slope indicators of user’s verbal posting activity and received Likes. In Figure 1, these latent correlations are represented by dashed lines linking the two models in Figure 1A,B.
To establish the model fit of the tested models, we compute the following available model fit statistics: the comparative fit index (CFI) [27] and the Tucker–Lewis Index (TLI) [28] measures of incremental model fit, the root mean square of approximation (RMSEA). Based on commonly used thresholds for model fit statistics in structural equation modeling [29,30] we consider values of CFI > 0.95, TLI > 0.95, and RMSEA < 0.05 as an indication of good model fit, while CFI and TLI > 0.90, and RMSEA < 0.08, as indication of acceptable fit.
Note that in the analyses, gaps in Facebook activity were considered missing by design, and thus plausibly compatible with the missing-at-random data assumption (see Table 1 for information about the amount of data available at each wave). In the context of the Facebook post data analyzed in the present study, missing by design occurs when data are absent because it was never generated by the user. For instance, if a user chooses not to post any status updates during a month, there would be no data regarding the content of their posts, and the number of Likes they might have received during that time. This lack of data is by design, based on the user’s decision not to engage in posting behavior, rather than by an external factor preventing or intruding on the data collection (e.g., data collection failures, experimental stimuli). This type of missing data is structurally built into the design of the study because it stems from the nature of the behavior being studied—in this case, the voluntary action of posting on Facebook. To retain all available data in the analyses, model estimation was performed by using full information maximum likelihood (FIML) estimator in Mplus Version 8 [31]. Using FIML, each individual contributes with the data they have available at each time point to the likelihood function, and no individuals are removed from the analysis through listwise deletion. Following this approach, our estimates and SEs are unbiased by the missing data [32]. Note that to ensure the robustness of standard errors to non-normality, all analyses were performed using a bootstrap approach with 1000 samples to compute 95% confidence intervals of the parameters.
3. Results
3.1. Model Fit
The CFA model testing the two latent QoL factors—current state and perceived change in QoL—demonstrated an acceptable fit. The chi-square goodness-of-fit test was significant (χ2 (15) = 81.89, p < 0.001), an expected outcome in large samples. RMSEA was 0.053 with a 90% confidence interval ranging from 0.042 to 0.065, indicating an adequate but not excellent fit. The CFI and TLI values were 0.978 and 0.959, respectively, both surpassing the conventional threshold for acceptable fit, while the SRMR was 0.030, well below the 0.08 cut-off. The positive correlation between the two QoL factors was strong (r = 0.612), suggesting a notable relationship between current QoL and perceived changes over time. The diagram in Figure 2 provides a visualization of the tested model. Note that all parameters in the figure are significant at p < 0.01.
The ALT-SR model used to extract latent intercept and slope indicators for verbal status updates and average received Likes on Facebook showed excellent fit across all indices (χ2 (280) = 581.48, p < 0.001, with a particularly low RMSEA of 0.026 (90% CI [0.023, 0.029]), and high CFI and TLI both at 0.980 and 0.980, respectively, with an SRMR of 0.029.
Integrating the two models, the final model also showed excellent fit, indicating that our hypothesized model is consistent with the observed data (χ2 (475) = 857.86, p < 0.001; RMSEA = 0.023, 90% C.I. [0.020, 0.025]; CFI = 0.979; TLI = 0.978; SRMR = 0.029).
3.2. Longitudinal Patterns of Online Activity on Facebook and Links with QoL Dimensions
Mean values of intercept and slope scores for verbal status updates and average received Likes and latent correlations with both current QoL and perceived QoL change are shown in Table 2. Results of the final model indicate that in our data, the slopes for both verbal status updates and average received Likes had a decreasing trend over time. Specifically, the slope for verbal status updates indicates that the proportion of verbal status updates over the total gradually declines as time progresses (Sx = −0.186; 95% C.I. [−0.317, −0.061]). Similarly, the slope for average received Likes shows a reduction in the number of Likes received per post over the course of the observation period (Sy = −0.195; 95% C.I. [−0.248, −0.136]). This pattern suggests a changing dynamic in user behavior and interaction on the platform during the studied timeframe.
Looking at latent correlations between indicators of Facebook activity, a strong positive correlation between the overall tendency for verbal expression on Facebook and average received Likes (r = 0.489, 95% CI [0.431, 0.539]), suggests that more verbal users tend to receive more feedback. Furthermore, the slope of verbal status updates showed a positive relationship with the increase in received Likes over time (r = 0.301, 95% CI [0.024, 0.596]), indicating that users who increase their verbal posting activity may perceive an enhancement in their social feedback.
Current QoL was positively associated with the intercept parameter for both the average received Likes (r = 0.196, 95% CI [0.127, 0.269]) and verbal status updates (r = 0.093, 95% CI [0.024, 0.163]), although this latter association was quite weak. In turn, perceived QoL change was positive with the temporal increase in Likes across the 12-time points (r = 0.175, 95% CI [0.047, 0.319]), suggesting that users experiencing an improvement in QoL also showed an increase (or a lower decline) in received Likes compared to users that perceived a worsening or stability in QoL over the previous year.
Finally, we report on results emerging from autoregression paths (a1–a2) and cross-lagged paths (c1–c2) between residuals of the ALT-SR model. These autoregression and cross-lagged paths can provide insight into how time-specific changes in verbal status updates and average received Likes impact the same variables measured at the next time point. We only found a significant autoregression effect, indicating that time-specific increases in verbal status updates activity tend to carry on to the following time point (a1 = 0.036, 95% CI [0.011, 0.064]). Estimated parameters for the final model are reported in full in the Supplementary Materials.
4. Discussion
The present study aimed to expand the understanding of the association between online positive social feedback on Facebook and perceived changes in Quality of Life (QoL) among adult users. Consistent with prior research [15,16,18,19,20,22], our study emphasizes the interconnectedness of online social interaction and individuals’ subjective well-being. Notably, a positive correlation was observed between the frequency of verbal expression in Facebook status updates and the number of Likes received, indicating that more expressive users tend to receive more feedback. Additionally, an increase in verbal status updates over time was linked to a perceived enhancement in social feedback, highlighting the potential impact of increased engagement on received support.
Furthermore, the study revealed that users with a higher current quality of life also received more Likes on their posts, suggesting a connection between positive social feedback and well-being. Lastly, individuals who perceived a temporal increase in Likes also perceived an improvement in their quality of life, underscoring the dynamic relationship between online social interactions and subjective well-being. Thus, while earlier studies highlighted the potential adverse effects of increased Facebook use on subjective well-being, our findings suggest a more nuanced picture. The positive association between receiving Likes (a form of online social feedback) and enhanced perceived QoL aligns with the idea that not all that happens on social is necessarily detrimental. This supports findings indicating that certain forms of online support, like receiving Likes on social media, can influence an individual’s sense of well-being [16,20], echoing theories of social capital and belongingness which posit that quality social interactions, even in digital environments, can fulfill basic human needs for connection and validation [33,34]. Beyond this, the longitudinal design of our study allowed us to show that the relationship between Facebook Likes and perceived QoL is not only related to individual differences in overall social feedback but also to differences in how this social feedback changes (i.e., increases/decreases) over time. Indeed, we noted a small but significant association between a positive change in received Likes over the course of one year of online activity and perceived improvement in QoL during the same timeframe. This result is in part at odds with those emerging from previous longitudinal studies by Kross and colleagues [18], and Shakya and Christakis [22], which instead found a general negative association between Facebook activity and well-being. This discrepancy may be in part related to differences in the methodology between these studies and ours, including the use of objective social media data (as opposed to self-report measures of activity), and the focus on positive social feedback (i.e., received Likes received). Our results suggest that the quality of interactions—in this case, receiving positive social feedback—may be more significant for well-being than the amount of activity performed on the platform.
This study has strengths. Using a large sample size and the separation of the methods for data collection for Facebook interactions and self-reported QoL measures, we improved the robustness of our numerical results and reduced the risk of biases that could arise from using a common method for studied variables. The innovative use of objective social media data in our research methodology research methodology echoes recent trends in the field [15,16,17]. This approach offers a more direct and dynamic measurement of social media interactions, overcoming some limitations of self-reported data, which can be subject to recall bias and subjective interpretation. A note should be made, however, on our choice to focus on status updates and Likes, which is in part due to their availability via Facebook’s Graph API at the time of the data collection (early 2018). We acknowledge that including other data, including visual posts and other forms of social feedback (e.g., comments and emotional reactions by other users) could have enriched our understanding of how social media relates to QoL. We refrained from collecting visual posts and comments by other users because of ethical and privacy concerns, as they often contain personally identifiable information of other users who could not provide informed consent. In turn, emotional reactions could not be collected due to technical reasons. Future research may explore these elements provided technical and ethical considerations can be adequately addressed.
The sample selected in our study is also a source of limitation. One limitation of the study is the demographic composition of the sample, which may not fully represent the broader Facebook user population in Italy as of 2018. Our sample consisted of a high proportion of young adults aged between 18 and 24 and was predominantly female This contrasts with the demographic distribution of Facebook users in Italy, which displayed a more even gender split (48.7% women and 51.3% men) and a wider spread across age groups with the largest being 25–34 years at 22.3%, with most users being older than this age group [35]. Given the concentration of young adults in the sample, findings may be more indicative of the behaviors and (QoL) perceptions among this demographic on Facebook.
Another limitation of our study, as with many others in this field, is the reliance on self-reported measures of QoL. Despite our integration of objective Facebook data, the subjective nature of QoL assessment may still influence the results. Another notable limitation is the approach to assessing changes in QoL. Instead of measuring QoL longitudinally, our study relied on participants’ perceptions of change in their QoL. This method may not accurately capture the true trajectory of QoL changes over time, as it depends on individual subjective recall and interpretation. Perception-based measures can be influenced by various factors, including current mood, recent events, and individual biases, which might not accurately reflect actual changes in QoL. For instance, an individual’s current state of well-being could disproportionately influence their perception of past well-being, known as the current-state bias [36]. A more robust approach for future studies could be to assess QoL at multiple time points, as conducted in previous research of this kind [22] thus providing a more objective and temporal perspective of how QoL evolves in relation to social media use. This longitudinal method would allow for a clearer understanding of the directionality and causality of the relationship between Facebook activity and QoL. Furthermore, while our study leverages objective data from Facebook, complementing this with additional objective measures of well-being, such as physiological indicators, could provide a more comprehensive understanding of the impact of social media on QoL.
To conclude, our study presents evidence of a positive association between Facebook activities and QoLin adult users. It reveals that more frequent verbal expressions in Facebook updates and a higher number of Likes received correlate with better QoL. The study also observes that individuals who perceive an increase in Likes report an improvement in QoL. This contributes a new perspective to the understanding of social media’s impact on well-being, suggesting potential positive aspects contrary to previous research.
Supplementary Materials
The following supporting information can be downloaded at: https://www.mdpi.com/article/10.3390/data9040051/s1. PDF file including the description of the variables in the data (i.e., Codebook), Mplus syntax for the ALT-SR model in the present study, software output including model parameters’ estimates.
Author Contributions
D.M. and M.S. jointly conceptualized the study. Both authors were involved in data collection, curation, and development of the methodology. D.M. took the lead in analyzing the data, creating visual representations, and drafting the manuscript. M.S. provided critical revisions that significantly improved the manuscript. All authors have read and agreed to the published version of the manuscript.
Funding
This research received no external funding.
Institutional Review Board Statement
The study was conducted in accordance with the Declaration of Helsinki, and approved by the Ethics Committee of the University of Turin, Italy (protocol code (n° 88721).
Informed Consent Statement
Informed consent was obtained from all subjects involved in the study.
Data Availability Statement
Due to restrictions based on informed consent agreements, the raw data supporting the conclusions of this article will not be made publicly available. For inquiries about the data, please contact the corresponding author.
Acknowledgments
While composing this document, the author(s) employed OpenAI’s ChatGPT 4 (https://chat.openai.com/, accessed on 11 January 2024), Google’s Gemini Advanced (https://gemini.google.com, accessed on 11 January 2024) for assistance with grammar and spelling checks, as well as to enhance the clarity and readability of the text. After the utilization of these AI tools, the authors reviewed and modified the content where necessary. The authors assume full responsibility for the final content of this publication.
Conflicts of Interest
The authors declare no conflicts of interest.
References
- Davies, M.; Musango, J.K.; Brent, A.C. A systems approach to understanding the effect of Facebook use on the quality of interpersonal communication. Technol. Soc. 2016, 44, 55–65. [Google Scholar] [CrossRef]
- Raza, A.; Usman, M.; Ali, M. Examining how and when Facebook intensive use shapes users’ online pro-social behaviors. Telemat. Inform. 2022, 67, 101753. [Google Scholar] [CrossRef]
- Carr, C.T.; Wohn, D.Y.; Hayes, R.A. As social support: Relational closeness, automaticity, and interpreting social support from paralinguistic digital affordances in social media. Comput. Hum. Behav. 2016, 62, 385–393. [Google Scholar] [CrossRef]
- Wohn, D.Y.; Carr, C.T.; Hayes, R.A. How affective is a “Like”?: The effect of paralinguistic digital affordances on perceived social support. Cyberpsychol. Behav. Soc. Netw. 2016, 19, 562–566. [Google Scholar] [CrossRef] [PubMed]
- Marengo, D.; Poletti, I.; Settanni, M. The interplay between neuroticism, extraversion, and social media addiction in young adult Facebook users: Testing the mediating role of online activity using objective data. Addict. Behav. 2020, 102, 106150. [Google Scholar] [CrossRef] [PubMed]
- Tiggemann, M.; Hayden, S.; Brown, Z.; Veldhuis, J. The effect of Instagram “likes” on women’s social comparison and body dissatisfaction. Body Image 2018, 26, 90–97. [Google Scholar] [CrossRef] [PubMed]
- De Choudhury, M.; Gamon, M.; Counts, S.; Horvitz, E. Predicting Depression via Social Media. In Proceedings of the International AAAI Conference on Web and Social Media, Cambridge, MA, USA, 8–11 July 2013; Volume 7, pp. 128–137. [Google Scholar]
- Eichstaedt, J.C.; Smith, R.J.; Merchant, R.M.; Ungar, L.H.; Crutchley, P.; Preoţiuc-Pietro, D.; Schwartz, H.A. Facebook language predicts depression in medical records. Proc. Natl. Acad. Sci. USA 2018, 115, 11203–11208. [Google Scholar] [CrossRef] [PubMed]
- Schwartz, H.A.; Eichstaedt, J.; Kern, M.L.; Park, G.; Sap, M.; Stillwell, D.; Ungar, L. Towards Assessing Changes in Degree of Depression through Facebook. In Proceedings of the Workshop on Computational Linguistics and Clinical Psychology: From Linguistic Signal to Clinical Reality; Association for Computational Linguistics: Baltimore, MD, USA, 2014; pp. 118–125. [Google Scholar] [CrossRef]
- Tsugawa, S.; Kikuchi, Y.; Kishino, F.; Nakajima, K.; Itoh, Y.; Ohsaki, H. Recognizing Depression from Twitter Activity. In Proceedings of the 33rd Annual ACM Conference on Human Factors in Computing Systems, Seoul, Republic of Korea, 18–23 April 2015; pp. 3187–3196. [Google Scholar] [CrossRef]
- Wang, X.; Zhang, C.; Ji, Y.; Sun, L.; Wu, L.; Bao, Z. A Depression Detection Model Based on Sentiment Analysis in Micro-Blog Social Network. In Proceedings of the Pacific-Asia Conference on Knowledge Discovery and Data Mining, Gold Coast, Australia, 14–17 April 2013; Springer: Berlin, Germany, 2013; pp. 201–213. [Google Scholar] [CrossRef]
- Kim, J.; Uddin, Z.A.; Lee, Y.; Nasri, F.; Gill, H.; Subramanieapillai, M.; Lee, R.; Udovica, A.; Phan, L.; Lui, L.; et al. A systematic review of the validity of screening depression through Facebook, Twitter, Instagram, and Snapchat. J. Affect. Disord. 2021, 286, 360–369. [Google Scholar] [CrossRef] [PubMed]
- Liu, P.; Tov, W.; Kosinski, M.; Stillwell, D.J.; Qiu, L. Do Facebook Status Updates Reflect Subjective Well-Being? Cyberpsychol. Behav. Soc. Netw. 2015, 18, 373–379. [Google Scholar] [CrossRef]
- Schwartz, H.A.; Sap, M.; Kern, M.L.; Eichstaedt, J.C.; Kapelner, A.; Agrawal, M.; Ungar, L.H. Predicting in-dividual well-being through the language of social media. In Proceedings of the Biocomputing 2016: Proceedings of the Pacific Symposium, Kohala Coast, HI, USA, 4–8 January 2016; pp. 516–527. [Google Scholar] [CrossRef]
- Marengo, D.; Azucar, D.; Longobardi, C.; Settanni, M. Mining Facebook data for Quality of Life assessment. Behav. Inf. Technol. 2021, 40, 597–607. [Google Scholar] [CrossRef]
- Marengo, D.; Montag, C.; Sindermann, C.; Elhai, J.D.; Settanni, M. Examining the links between active Facebook use, received likes, self-esteem and happiness: A study using objective social media data. Telemat. Inform. 2021, 58, 101523. [Google Scholar] [CrossRef]
- Renner, S.; Marty, T.; Khadhar, M.; Foulquié, P.; Voillot, P.; Mebarki, A.; Schück, S. A new method to extract health-related quality of life data from social media testimonies: Algorithm development and validation. J. Med. Internet Res. 2022, 24, e31528. [Google Scholar] [CrossRef] [PubMed]
- Kross, E.; Verduyn, P.; Demiralp, E.; Park, J.; Lee, D.S.; Lin, N.; Ybarra, O. Facebook use predicts declines in subjective well-being in young adults. PLoS ONE 2013, 8, e69841. [Google Scholar] [CrossRef] [PubMed]
- Nabi, R.L.; Prestin, A.; So, J. Facebook friends with (health) benefits? Exploring social network site use and perceptions of social support, stress, and well-being. Cyberpsychol. Behav. Soc. Netw. 2013, 16, 721–727. [Google Scholar] [CrossRef] [PubMed]
- Liu, C.-Y.; Yu, C.-P. Can Facebook use induce well-being? Cyberpsychol. Behav. Soc. Netw. 2013, 16, 674–678. [Google Scholar] [CrossRef] [PubMed]
- Manago, A.M.; Taylor, T.; Greenfield, P.M. Me and my 400 friends: The anatomy of college students’ Facebook networks, their communication patterns, and well-being. Dev. Psychol. 2012, 48, 369–380. [Google Scholar] [CrossRef] [PubMed]
- Shakya, H.B.; Christakis, N.A. Association of Facebook use with compromised well-being: A longitudinal study. Am. J. Epidemiol. 2017, 185, 203–211. [Google Scholar] [CrossRef] [PubMed]
- Parry, D.A.; Davidson, B.I.; Sewall, C.J.; Fisher, J.T.; Mieczkowski, H.; Quintana, D.S. A systematic review and meta-analysis of discrepancies between logged and self-reported digital media use. Nat. Hum. Behav. 2021, 5, 1535–1547. [Google Scholar] [CrossRef] [PubMed]
- Curran, P.J.; Howard, A.L.; Bainter, S.A.; Lane, S.T.; McGinley, J.S. The separation of between-person and within-person components of individual change over time: A latent curve model with structured residuals. J. Consult. Clin. Psychol. 2014, 82, 879. [Google Scholar] [CrossRef]
- Dixon, S.J. Global Social Networks Ranked by Number of Users 2024. Statista. 2024. Available online: https://www.statista.com/statistics/272014/global-social-networks-ranked-by-number-of-users/ (accessed on 11 January 2024).
- World Health Organization. HRQoL Measuring Quality of Life. 2018. Available online: http://www.who.int/healthinfo/survey/whoqol-qualityoflife/en/ (accessed on 11 January 2024).
- Bentler, P.M. Comparative fit indexes in structural models. Psychol. Bull. 1990, 107, 238. [Google Scholar] [CrossRef]
- Tucker, L.R.; Lewis, C. A reliability coefficient for maximum likelihood factor analysis. Psychometrika 1973, 38, 1–10. [Google Scholar] [CrossRef]
- Hu, L.T.; Bentler, P.M. Cutoff criteria for fit indexes in covariance structure analysis: Conventional criteria versus new alternatives. Struct. Equ. Model. Multidiscip. J. 1999, 6, 1–55. [Google Scholar] [CrossRef]
- Marsh, H.W.; Hau, K.T.; Wen, Z. In search of golden rules: Comment on hypothesis-testing approaches to setting cutoff values for fit indexes and dangers in overgeneralizing Hu and Bentler’s (1999) findings. Struct. Equ. Model. 2004, 11, 320–341. [Google Scholar] [CrossRef]
- Muthén, B.; Muthén, L. Mplus: A General Latent Variable Modeling Program. 2019. Available online: https://www.statmodel.com/download/Mplus-A%20General%20Latent%20Variable%20Modeling%20Program.pdf (accessed on 11 January 2024).
- Enders, C.K. Missing not at random models for latent growth curve analyses. Psychol. Methods 2011, 16, 1–16. [Google Scholar] [CrossRef] [PubMed]
- Bandura, A. Social cognitive theory of mass communication. Media Psychol. 2001, 3, 265–299. [Google Scholar] [CrossRef]
- Valkenburg, P.M.; Peter, J. Social consequences of the internet for adolescents: A decade of research. Curr. Dir. Psychol. Sci. 2009, 18, 1–5. [Google Scholar] [CrossRef]
- NapoleonCat. Facebook Users in Italy—November 2018. 2018. Available online: https://napoleoncat.com/stats/facebook-users-in-italy/2018/11/ (accessed on 11 January 2024).
- Schwarz, N.; Strack, F. Reports of Subjective Well-Being: Judgmental Processes and Their Methodological Implications. 1999. Available online: https://psycnet.apa.org/record/1999-02842-004 (accessed on 11 January 2024).
Figure 1.
Conceptual Diagrams for the Tested Models: (A) Correlated-factor CFA model of Perceived Current QOL and QOL change; (B) Auto-Regressive Latent Trajectory Model with Structure Residuals for the association between Verbal Status Updates (%) and Average Received Likes over 12 months of Facebook Activity.

Figure 2.
CFA model of Perceived Current QOL and QOL change: Standardized factor loading estimates and latent correlations.
Figure 2.
CFA model of Perceived Current QOL and QOL change: Standardized factor loading estimates and latent correlations.


Table 1.
Descriptive statistics for the percentage of verbal status updates and average received Likes by timepoint.
Table 1.
Descriptive statistics for the percentage of verbal status updates and average received Likes by timepoint.
| Timepoint | Variable | Mean | SD | Min | Max | N |
|---|---|---|---|---|---|---|
| 1 | Percentage of Verbal Status updates | 54.61 | 33.72 | 0 | 100 | 1315 |
| 2 | Percentage of Verbal Status updates | 55.05 | 33.63 | 0 | 100 | 1391 |
| 3 | Percentage of Verbal Status updates | 54.96 | 33.71 | 0 | 100 | 1482 |
| 4 | Percentage of Verbal Status updates | 55.47 | 33.09 | 0 | 100 | 1522 |
| 5 | Percentage of Verbal Status updates | 54.44 | 33.66 | 0 | 100 | 1514 |
| 6 | Percentage of Verbal Status updates | 54.61 | 33.48 | 0 | 100 | 1491 |
| 7 | Percentage of Verbal Status updates | 54.88 | 34.28 | 0 | 100 | 1493 |
| 8 | Percentage of Verbal Status updates | 54.09 | 34.33 | 0 | 100 | 1485 |
| 9 | Percentage of Verbal Status updates | 53.63 | 34.52 | 0 | 100 | 1493 |
| 10 | Percentage of Verbal Status updates | 52.79 | 34.94 | 0 | 100 | 1482 |
| 11 | Percentage of Verbal Status updates | 52.85 | 34.43 | 0 | 100 | 1444 |
| 12 | Percentage of Verbal Status updates | 53.89 | 36.73 | 0 | 100 | 1279 |
| 1 | Average Received Likes | 12.22 | 14.01 | 0 | 84.50 | 1315 |
| 2 | Average Received Likes | 13.52 | 15.04 | 0 | 83.2 | 1391 |
| 3 | Average Received Likes | 13.48 | 14.84 | 0 | 81.00 | 1482 |
| 4 | Average Received Likes | 13.09 | 15.12 | 0 | 84.00 | 1522 |
| 5 | Average Received Likes | 13.22 | 15.39 | 0 | 83.50 | 1514 |
| 6 | Average Received Likes | 12.25 | 14.22 | 0 | 77.00 | 1491 |
| 7 | Average Received Likes | 11.93 | 13.93 | 0 | 73.00 | 1493 |
| 8 | Average Received Likes | 10.79 | 13.14 | 0 | 67.67 | 1485 |
| 9 | Average Received Likes | 10.43 | 11.67 | 0 | 64.00 | 1493 |
| 10 | Average Received Likes | 11.61 | 13.22 | 0 | 66.00 | 1482 |
| 11 | Average Received Likes | 11.31 | 13.03 | 0 | 72.00 | 1444 |
| 12 | Average Received Likes | 11.30 | 14.15 | 0 | 71.00 | 1279 |
Table 2.
Mean values of intercept and slope scores for Verbal Status Updates and Average Received Likes and latent correlations with current and perceived change in QoL.
Table 2.
Mean values of intercept and slope scores for Verbal Status Updates and Average Received Likes and latent correlations with current and perceived change in QoL.
| Latent Correlations | |||
|---|---|---|---|
| Latent Variables | Mean | Current QoL | QoL Change |
| % Verbal Status Updates—Intercept (Ix) | 55.321 [54.009, 56.761] | 0.093 [0.024, 0.163] | 0.067 [−0.003, 0.136] |
| % Verbal Status Updates—Slope (Sx) | −0.186 [−0.317, −0.061] | −0.027 [−0.150, 0.108] | 0.011 [−0.117, 0.139] |
| Avg. Received Likes—Intercept (Iy) | 13.150 [12.504, 13.779] | 0.196 [0.127, 0.269] | 0.054 [−0.023, 0.124] |
| Avg. Received Likes—Slope (Sy) | −0.195 [−0.248, −0.136] | −0.031 [−0.163, 0.084] | 0.175 [0.047, 0.319] |
The table reports the mean of the estimated baseline (Intercept) and the rate of change values over 12 months (Slope) for two variables: percentage (%) of verbal status updates, and average received Likes. Positive slope values indicate an increase over time, while negative values indicate a decrease. Additional columns show how intercept and slope estimates correlate with current and perceived changes in quality of life (QoL). Values in brackets are 95% confidence intervals (1000 bootstrap samples), accounting for uncertainty in the estimates due to sampling error.
Disclaimer/Publisher’s Note: The statements, opinions and data contained in all publications are solely those of the individual author(s) and contributor(s) and not of MDPI and/or the editor(s). MDPI and/or the editor(s) disclaim responsibility for any injury to people or property resulting from any ideas, methods, instructions or products referred to in the content. |
© 2024 by the authors. Licensee MDPI, Basel, Switzerland. This article is an open access article distributed under the terms and conditions of the Creative Commons Attribution (CC BY) license (https://creativecommons.org/licenses/by/4.0/).
Share and Cite
MDPI and ACS Style
Marengo, D.; Settanni, M. Longitudinal Patterns of Online Activity and Social Feedback Are Associated with Current and Perceived Changes in Quality of Life in Adult Facebook Users. Data 2024, 9, 51. https://doi.org/10.3390/data9040051
AMA Style
Marengo D, Settanni M. Longitudinal Patterns of Online Activity and Social Feedback Are Associated with Current and Perceived Changes in Quality of Life in Adult Facebook Users. Data. 2024; 9(4):51. https://doi.org/10.3390/data9040051
Chicago/Turabian StyleMarengo, Davide, and Michele Settanni. 2024. "Longitudinal Patterns of Online Activity and Social Feedback Are Associated with Current and Perceived Changes in Quality of Life in Adult Facebook Users" Data 9, no. 4: 51. https://doi.org/10.3390/data9040051