
The Importance of Age in the Prediction of Mortality by a Frailty Index: A Machine Learning Approach in the Irish Longitudinal Study on Ageing


 ,
,  , ,
, , 
Abstract
:1. Introduction
2. Materials and Methods
2.1. Design and Setting
2.2. Measures
2.2.1. Construction of the Frailty Index (FI)
2.2.2. Mortality Data
2.3. Descriptive Analyses
2.4. Machine Learning (ML) Analyses
2.5. Ethics
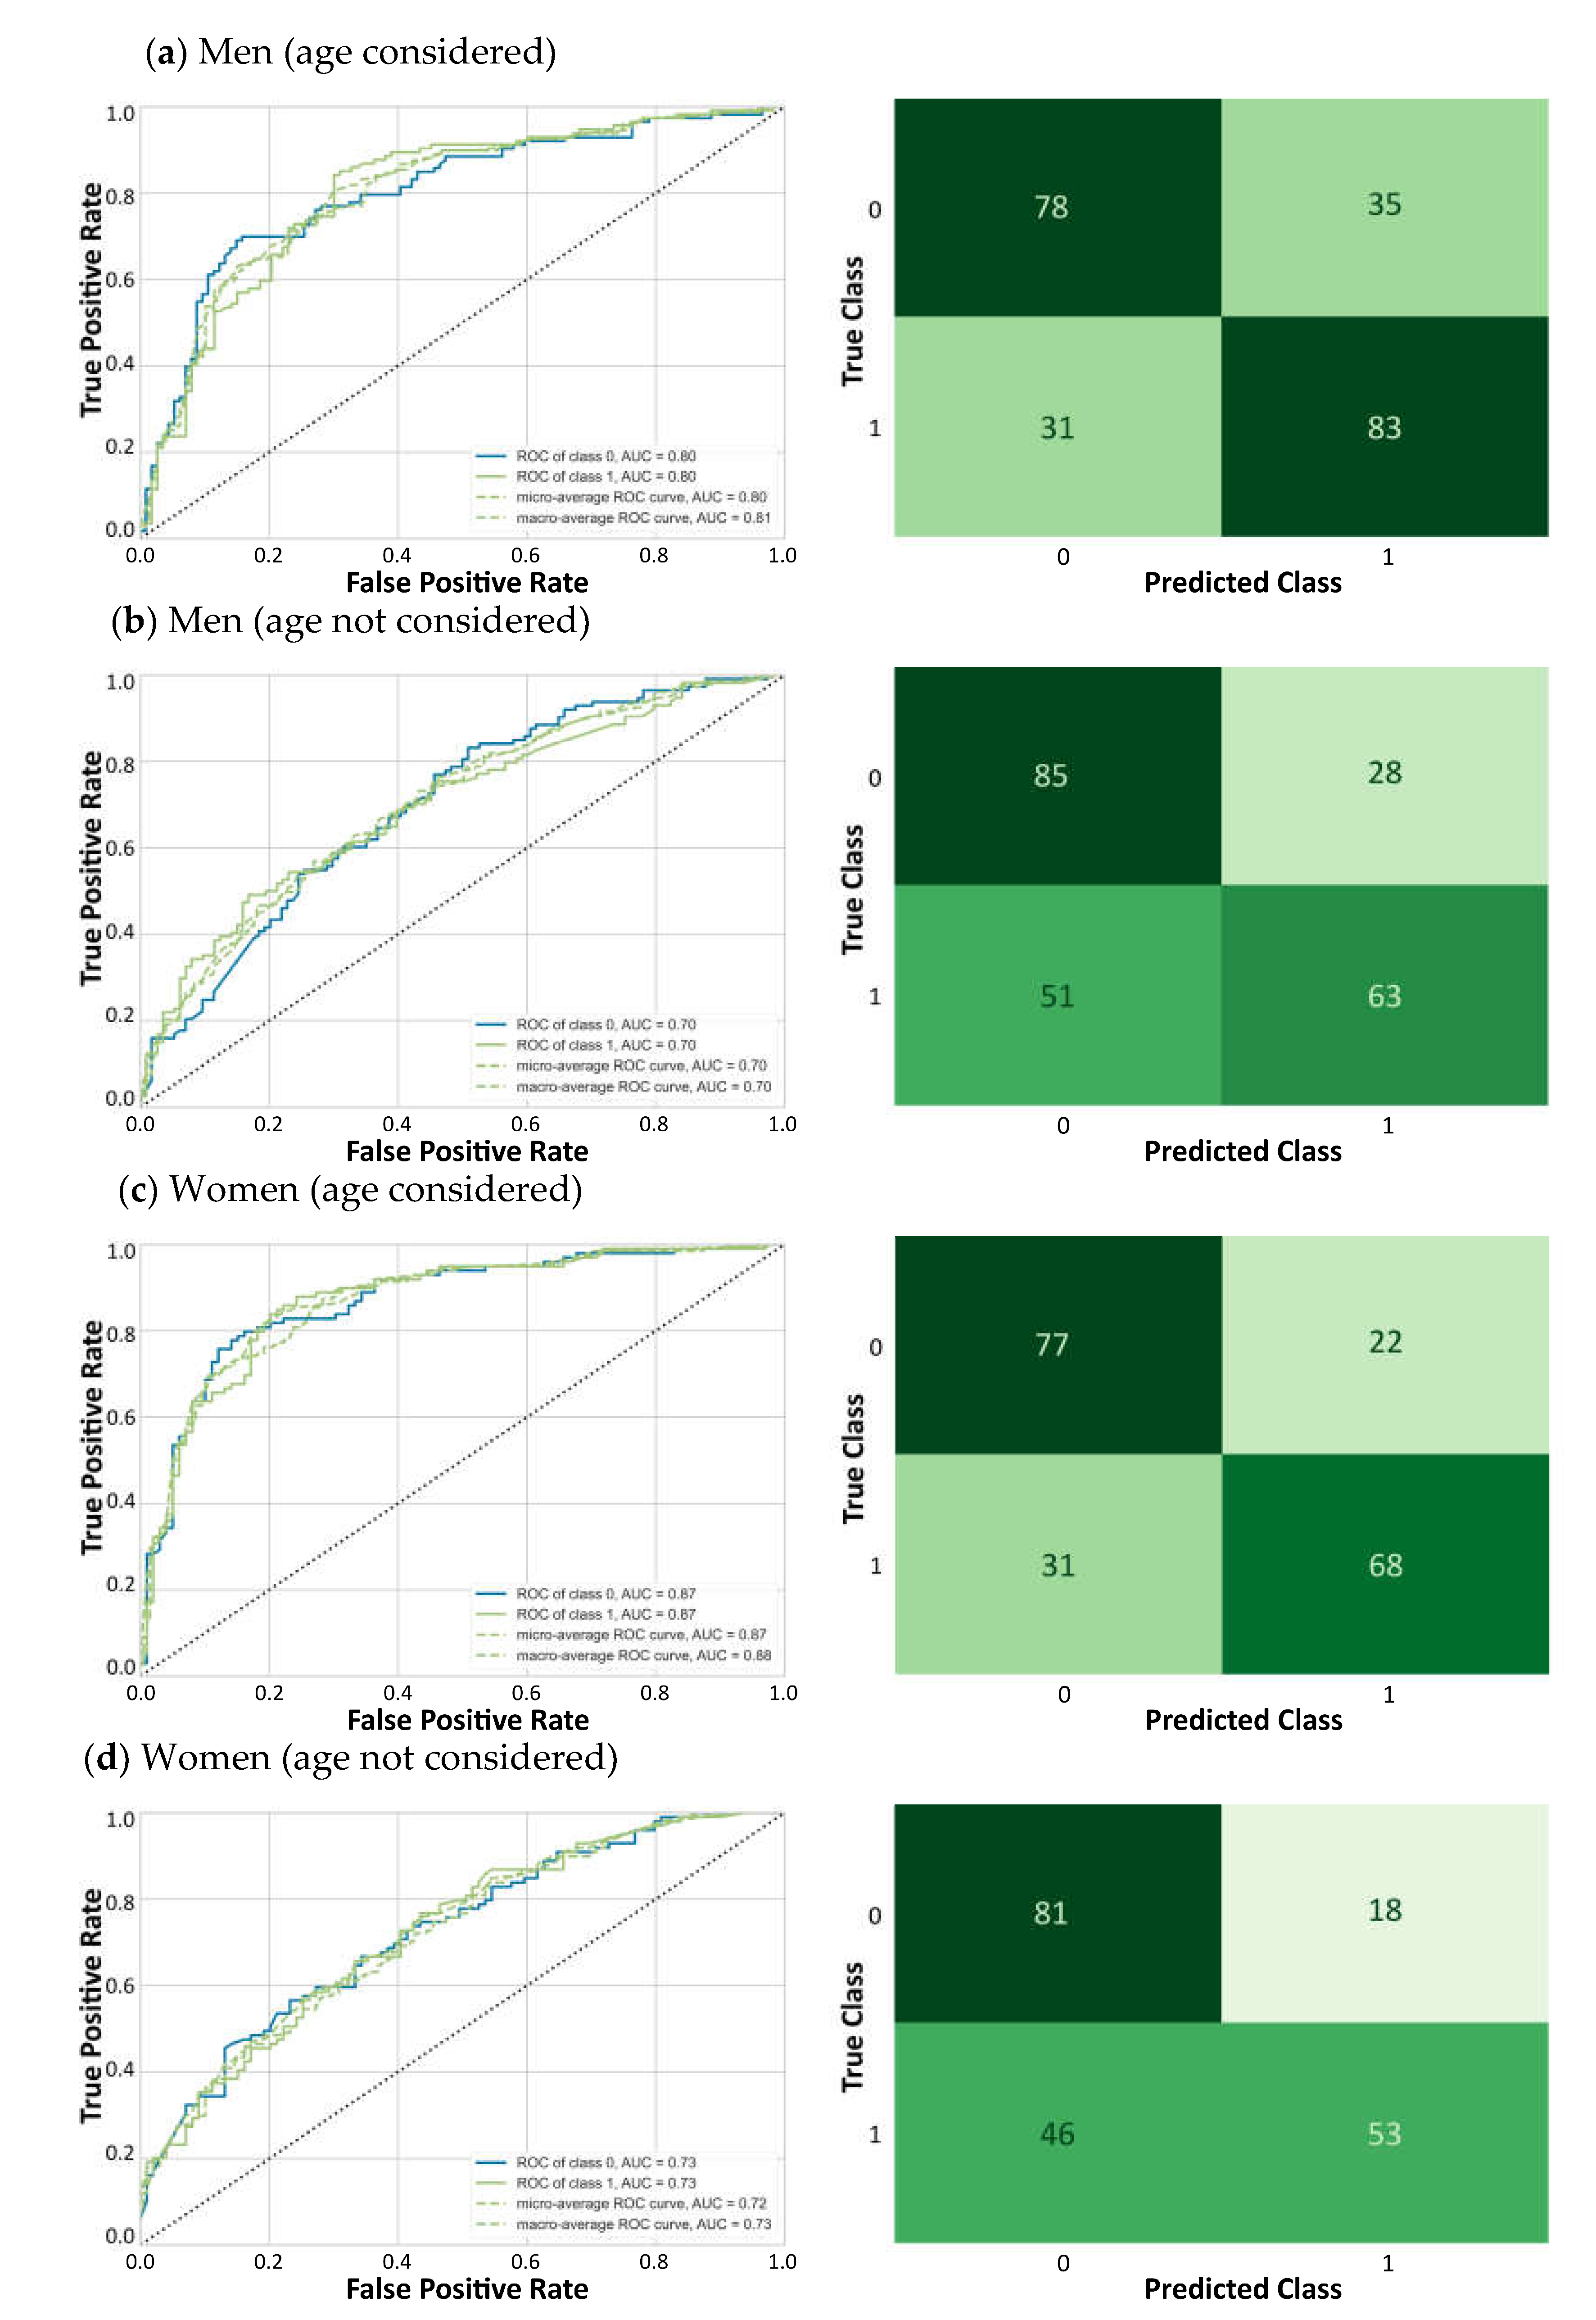
3. Results
4. Discussion
5. Conclusions
Author Contributions
Funding
Institutional Review Board Statement
Informed Consent Statement
Data Availability Statement
Acknowledgments
Conflicts of Interest
Appendix A

| Self-reported deficit | Scoring |
| Difficulty walking 100 m | 0 = No; 1 = Yes |
| Difficulty rising from a chair | 0 = No; 1 = Yes |
| Difficulty climbing one flight of stairs | 0 = No; 1 = Yes |
| Difficulty stooping, kneeling or crouching | 0 = No; 1 = Yes |
| Difficulty reaching above shoulder height | 0 = No; 1 = Yes |
| Difficulty pushing/pulling large objects | 0 = No; 1 = Yes |
| Difficulty lifting/carrying weights ≥ 10 pounds (4.5 Kg) | 0 = No; 1 = Yes |
| Difficulty picking up a coin from a table | 0 = No; 1 = Yes |
| Feeling lonely | 0 = None of the time, rarely; 0.5 = Some of the time; 1 = All the time |
| Self-rated physical health | 0 = Excellent, Very good, Good; 0.5 = Fair; 1 = Poor |
| Self-rated vision | 0 = Excellent, Very good, Good; 0.5 = Fair; 1 = Poor |
| Self-rated hearing | 0 = Excellent, Very good, Good; 0.5 = Fair; 1 = Poor |
| Self-rated day-to-day memory | 0 = Excellent, Very good, Good; 0.5 = Fair; 1 = Poor |
| Difficulty following a conversation with one person | 0 = None; 0.5 = Some; 1 = Much/Impossible |
| Daytime sleepiness | 0 = Never, slight chance; 0.5 = Moderate chance; 1 = High chance |
| Polypharmacy | 0 = No; 1 = Yes |
| Knee pain | 0 = No; 1 = Yes |
| Hypertension | 0 = No; 1 = Yes |
| Angina | 0 = No; 1 = Yes |
| Heart attack | 0 = No; 1 = Yes |
| Diabetes | 0 = No; 1 = Yes |
| Stroke or Transient ischemic attack | 0 = No; 1 = Yes |
| High cholesterol | 0 = No; 1 = Yes |
| Irregular heart rhythm | 0 = No; 1 = Yes |
| Other cardiovascular disease | 0 = No; 1 = Yes |
| Cataracts | 0 = No; 1 = Yes |
| Glaucoma or Age-related macular degeneration | 0 = No; 1 = Yes |
| Arthritis | 0 = No; 1 = Yes |
| Osteoporosis | 0 = No; 1 = Yes |
| Cancer | 0 = No; 1 = Yes |
| Varicose ulcer | 0 = No; 1 = Yes |
| Urinary incontinence | 0 = Never, slight chance; 0.5 = Moderate chance; 1 = High chance |
Appendix B
References
- Lowsky, D.; Olshansky, S.J.; Bhattacharya, J.; Goldman, D.P. Heterogeneity in Healthy Aging. J. Gerontol. Ser. A Boil. Sci. Med. Sci. 2014, 69, 640–649. [Google Scholar] [CrossRef] [Green Version]
- Ries, W.; Pöthig, D. Chronological and biological age. Exp. Gerontol. 1984, 19, 211–216. [Google Scholar] [CrossRef]
- Romero-Ortuno, R.; O’Shea, D. Fitness and frailty: Opposite ends of a challenging continuum! Will the end of age discrimination make frailty assessments an imperative? Age Ageing 2013, 42, 279–280. [Google Scholar] [CrossRef] [Green Version]
- Mitnitski, A.B.; Mogilner, A.J.; MacKnight, C.; Rockwood, K. The mortality rate as a function of accumulated deficits in a frailty index. Mech. Ageing Dev. 2002, 123, 1457–1460. [Google Scholar] [CrossRef]
- Rockwood, K.; Mitnitski, A. Frailty Defined by Deficit Accumulation and Geriatric Medicine Defined by Frailty. Clin. Geriatr. Med. 2011, 27, 17–26. [Google Scholar] [CrossRef]
- Pérez-Zepeda, M.U.; Godin, J.; Armstrong, J.J.; Andrew, M.K.; Mitnitski, A.; Kirkland, S.; Rockwood, K.; Theou, O. Frailty among middle-aged and older Canadians: Population norms for the frailty index using the Canadian Longitudinal Study on Aging. Age Ageing 2021, 50, 447–456. [Google Scholar] [CrossRef] [PubMed]
- Woo, J.; Goggins, W.; Sham, A.; Ho, S.C. Social Determinants of Frailty. Gerontology 2005, 51, 402–408. [Google Scholar] [CrossRef] [PubMed]
- Searle, S.D.; Mitnitski, A.; Gahbauer, E.A.; Gill, T.M.; Rockwood, K. A standard procedure for creating a frailty index. BMC Geriatr. 2008, 8, 24. [Google Scholar] [CrossRef] [Green Version]
- Rockwood, K.; Mogilner, A.; Mitnitski, A. Changes with age in the distribution of a frailty index. Mech. Ageing Dev. 2004, 125, 517–519. [Google Scholar] [CrossRef] [PubMed]
- Goggins, W.B.; Woo, J.; Sham, A.; Ho, S.C. Frailty Index as a Measure of Biological Age in a Chinese Population. J. Gerontol. Ser. A Boil. Sci. Med. Sci. 2005, 60, 1046–1051. [Google Scholar] [CrossRef] [PubMed] [Green Version]
- Kanters, D.M.; E Griffith, L.; Hogan, D.; Richardson, J.A.; Patterson, C.; Raina, P. Assessing the measurement properties of a Frailty Index across the age spectrum in the Canadian Longitudinal Study on Aging. J. Epidemiol. Community Health 2017, 71, 794–799. [Google Scholar] [CrossRef]
- Romero-Ortuno, R. An alternative method for Frailty Index cut-off points to define frailty categories. Eur. Geriatr. Med. 2013, 4, 299–303. [Google Scholar] [CrossRef] [Green Version]
- Gordon, E.; Peel, N.; Samanta, M.; Theou, O.; Howlett, S.; Hubbard, R. Sex differences in frailty: A systematic review and meta-analysis. Exp. Gerontol. 2017, 89, 30–40. [Google Scholar] [CrossRef]
- Kojima, G.; Iliffe, S.; Walters, K. Frailty index as a predictor of mortality: A systematic review and meta-analysis. Age Ageing 2018, 47, 193–200. [Google Scholar] [CrossRef] [Green Version]
- Rockwood, K.; Mitnitski, A. Limits to deficit accumulation in elderly people. Mech. Ageing Dev. 2006, 127, 494–496. [Google Scholar] [CrossRef]
- Msc, M.T.E.P.; Lips, P.; Deeg, D.J.H. Sex Differences in the Risk of Frailty for Mortality Independent of Disability and Chronic Diseases. J. Am. Geriatr. Soc. 2004, 53, 40–47. [Google Scholar] [CrossRef]
- Lachmann, R.; Stelmach-Mardas, M.; Bergmann, M.M.; Bernigau, W.; Weber, D.; Pischon, T.; Boeing, H. The accumulation of deficits approach to describe frailty. PLoS ONE 2019, 14, e0223449. [Google Scholar] [CrossRef] [PubMed] [Green Version]
- Rockwood, K.; Andrew, M.; Mitnitski, A. A Comparison of Two Approaches to Measuring Frailty in Elderly People. J. Gerontol. Ser. A Boil. Sci. Med. Sci. 2007, 62, 738–743. [Google Scholar] [CrossRef] [PubMed]
- Rockwood, K.; Mitnitski, A. Frailty in Relation to the Accumulation of Deficits. J. Gerontol. Ser. A Boil. Sci. Med. Sci. 2007, 62, 722–727. [Google Scholar] [CrossRef] [PubMed] [Green Version]
- Donoghue, O.A.; McGarrigle, C.A.; Foley, M.; Fagan, A.; Meaney, J.; Kenny, R.A. Cohort Profile Update: The Irish Longitudinal Study on Ageing (TILDA). Int. J. Epidemiol. 2018, 47, 1398. [Google Scholar] [CrossRef] [PubMed]
- Roe, L.; Normand, C.; Wren, M.-A.; Browne, J.; O’Halloran, A.M. The impact of frailty on healthcare utilisation in Ireland: Evidence from the Irish longitudinal study on ageing. BMC Geriatr. 2017, 17, 1–12. [Google Scholar] [CrossRef] [Green Version]
- Peña, F.G.; Theou, O.; Wallace, L.; Brothers, T.D.; Gill, T.M.; A Gahbauer, E.; Kirkland, S.; Mitnitski, A.; Rockwood, K. Comparison of alternate scoring of variables on the performance of the frailty index. BMC Geriatr. 2014, 14, 25. [Google Scholar] [CrossRef] [Green Version]
- Ward, M.; May, P.; Briggs, R.; McNicholas, T.; Normand, C.; Kenny, R.A.; Nolan, A. Linking death registration and survey data: Procedures and cohort profile for The Irish Longitudinal Study on Ageing (TILDA). HRB Open Res. 2020, 3, 43. [Google Scholar] [CrossRef] [PubMed]
- Baudat, G.; Anouar, F. Generalized Discriminant Analysis Using a Kernel Approach. Neural Comput. 2000, 12, 2385–2404. [Google Scholar] [CrossRef]
- Alvis, B.D.; Hughes, C.G. Physiology Considerations in Geriatric Patients. Anesthesiol. Clin. 2015, 33, 447–456. [Google Scholar] [CrossRef] [Green Version]
- Song, X.; Mitnitski, A.; Macknight, C.; Rockwood, K. Assessment of Individual Risk of Death Using Self-Report Data: An Artificial Neural Network Compared with a Frailty Index. J. Am. Geriatr. Soc. 2004, 52, 1180–1184. [Google Scholar] [CrossRef]
- Assari, S. Gender differences in the predictive role of self-rated health on short-term risk of mortality among older adults. SAGE Open Med. 2016, 4. [Google Scholar] [CrossRef] [PubMed] [Green Version]
- Leveille, S.G.; Zhang, Y.; McMullen, W.; Kelly-Hayes, M.; Felson, D. Sex Differences in musculoskeletal pain in older adults. Pain 2005, 116, 332–338. [Google Scholar] [CrossRef] [PubMed] [Green Version]
- Rico-Uribe, L.A.; Caballero, F.F.; Martín-María, N.; Cabello, M.; Ayuso-Mateos, J.L.; Miret, M. Association of loneliness with all-cause mortality: A meta-analysis. PLoS ONE 2018, 13, e0190033. [Google Scholar] [CrossRef]
- Jo, S.; Kim, H.J.; Kim, H.-W.; Koo, Y.S.; Lee, S.-A. Sex differences in factors associated with daytime sleepiness and insomnia symptoms in persons with epilepsy. Epilepsy Behav. 2020, 104, 106919. [Google Scholar] [CrossRef]
- Masnoon, N.; Ellett, L.K.; Shakib, S.; Caughey, G.E. Predictors of Mortality in the Older Population: The Role of Polypharmacy and Other Medication and Chronic Disease-Related Factors. Drugs Aging 2020, 37, 767–776. [Google Scholar] [CrossRef] [PubMed]
- Zhu, Z.; Wang, L.; Scheetz, J.; He, M. Age-related cataract and 10-year mortality: The Liwan Eye Study. Acta Ophthalmol. 2020, 98, e328–e332. [Google Scholar] [CrossRef] [PubMed]
- Reidy, A.; Minassian, D.C.; Desai, P.; Vafidis, G.; Joseph, J.; Farrow, S.; Connolly, A. Increased mortality in women with cataract: A population based follow up of the North London Eye Study. Br. J. Ophthalmol. 2002, 86, 424–428. [Google Scholar] [CrossRef] [PubMed] [Green Version]
- Maas, A.; Appelman, Y. Gender differences in coronary heart disease. Neth. Hear. J. 2010, 18, 598–603. [Google Scholar] [CrossRef] [PubMed]
- Madonna, R.; Balistreri, C.R.; De Rosa, S.; Muscoli, S.; Selvaggio, S.; Selvaggio, G.; Ferdinandy, P.; De Caterina, R. Impact of Sex Differences and Diabetes on Coronary Atherosclerosis and Ischemic Heart Disease. J. Clin. Med. 2019, 8, 98. [Google Scholar] [CrossRef] [PubMed] [Green Version]
- Lee, W.; Chang, Y.; Shin, H.; Ryu, S. Hearing Loss and Risk of Overall, Injury-Related, and Cardiovascular Mortality: The Kangbuk Samsung Health Study. J. Clin. Med. 2020, 9, 1415. [Google Scholar] [CrossRef] [PubMed]
- Lucicesare, A.; Hubbard, R.E.; Searle, S.D.; Rockwood, K. An index of self-rated health deficits in relation to frailty and adverse outcomes in older adults. Aging Clin. Exp. Res. 2010, 22, 255–260. [Google Scholar] [CrossRef] [PubMed]
- Arai, H.; Hsu, C.-C.; Lera, L.; Peng, L.-N.; Hsiao, F.-Y.; Lee, W.-J.; Huang, S.-T.; Chen, L.-K. Comparisons Between Hypothesis- and Data-Driven Approaches for Multimorbidity Frailty Index: A Machine Learning Approach. J. Med. Internet Res. 2020, 22, e16213. [Google Scholar] [CrossRef]
- Pilotto, A.; Cella, A.; Pilotto, A.; Daragjati, J.; Veronese, N.; Musacchio, C.; Mello, A.M.; Logroscino, G.; Padovani, A.; Prete, C.; et al. Three Decades of Comprehensive Geriatric Assessment: Evidence Coming From Different Healthcare Settings and Specific Clinical Conditions. J. Am. Med. Dir. Assoc. 2017, 18, 192.e1–192.e11. [Google Scholar] [CrossRef]

| Characteristic | Men Not Deceased N = 566 | Men Deceased N = 559 | Women Not Deceased N = 494 | Women Deceased N = 492 | Entire Cohort 45.8% Male N = 8174 |
|---|---|---|---|---|---|
| Age (years) | 62.7 (SD: 8.5 (50–89)) | 73.6 (SD: 9.6 (50–96)) | 63.4 (SD: 9.4 (50–90)) | 74.7 (SD: 10.8 (50–105)) | 63.8 (SD: 9.8 (50–105)) |
| Difficulty walking 100 m | 3.2% (N = 18) | 18.2% (N = 102) | 6.3% (N = 31) | 26.6% (N = 131) | 7.4% (N = 601) |
| Difficulty rising from a chair | 11.0% (N = 62) | 22.9% (N = 128) | 13.8% (N = 68) | 30.3% (N = 149) | 18.0% (N = 1470) |
| Difficulty climbing one flight of stairs | 4.2% (N = 24) | 18.4% (N = 103) | 5.7% (N = 28) | 25.6% (N = 126) | 7.7% (N = 633) |
| Difficulty stooping, kneeling, or crouching | 16.8% (N = 95) | 37.4% (N = 209) | 19.6% (N = 97) | 50.2% (N = 247) | 27.7% (N = 2262) |
| Difficulty reaching above shoulder height | 4.2% (N = 24) | 12.5% (N = 70) | 6.7% (N = 33) | 16.5% (N = 81) | 8.0% (N = 651) |
| Difficulty pushing/pulling large objects | 6.5% (N = 37) | 19.5% (N = 109) | 13.4% (N = 66) | 33.7% (N = 166) | 12.7% (N = 1041) |
| Difficulty lifting/carrying weights ≥ 10 pounds | 8.1% (N = 46) | 25.0% (N = 140) | 20.0% (N = 99) | 46.1% (N = 227) | 18.3% (N = 1496) |
| Difficulty picking up a coin from a table | 3.2% (N = 18) | 8.8% (N = 49) | 3.9% (N = 19) | 11.4% (N = 56) | 4.1% (N = 331) |
| Feeling lonely (0.5/1) | 2.8/0.9% (N = 16/5) | 5.7/3.4% (N = 32/19) | 5.3/1.6% (N = 26/8) | 9.6/4.7% (N = 47/23) | 5.2/2.1% (N = 425/174) |
| Poor self-rated physical health (0.5/1) | 19.4/3.4% (N = 110/19) | 29.3/12.0% (N = 164/67) | 16.6/4.7% (N = 82/23) | 30.7/13.0% (N = 151/64) | 18.2/5.1% (N= 1484/417) |
| Poor self-rated vision (0.5/1) | 9.7/1.4% (N = 55/8) | 11.4/3.2% (N = 64/18) | 9.7/1.4% (N = 48/7) | 14.4/5.7% (N = 71/28) | 8.1/1.6% (N = 663/131) |
| Poor self-rated hearing (0.5/1) | 13.6/3.4% (N = 77/19) | 22.4/3.9% (N = 125/22) | 11.3/1.4% (N = 56/7) | 14.8/4.5% (N = 73/22) | 11.8/2.4% (N = 962/194) |
| Self-rated day-to-day memory (0.5/1) | 14.7/3.7% (N = 83/21) | 20.0/6.3% (N = 112/35) | 17.2/1.8% (N = 85/9) | 18.7/6.5% (N = 92/32) | 13.5/2.9% (N = 1102/233) |
| Difficulty following conversation with 1 (0.5/1) | 7.6/0.7% (N = 43/4) | 14.1/2.1% (N = 79/12) | 3.4/0.8% (N = 17/4) | 10.6/2.0% (N = 52/10) | 5.7/0.8% (N = 469 /67) |
| Daytime sleepiness (0.5/1) | 16.6/18.7% (N = 94/106) | 20.9/23.1% (N = 117/129) | 9.5/13.0% (N = 47/64) | 13.2/22.8% (N = 65/112) | 15.1/14.9% (N = 1230/1216) |
| Polypharmacy | 14.8% (N = 84) | 40.6% (N = 227) | 18.8% (N = 93) | 40.2% (N = 198) | 20.8% (N = 1682) |
| Knee pain | 4.2% (N = 24) | 7.0% (N = 39) | 7.3% (N = 36) | 13.2% (N = 65) | 7.6% (N = 621) |
| Hypertension | 30.7% (N = 174) | 44.0% (N = 246) | 34.4% (N = 170) | 48.8% (N = 240) | 37.1% (N = 3031) |
| Angina | 5.0% (N = 28) | 13.4% (N = 75) | 1.8% (N = 9) | 10.6% (N = 52) | 5.5% (N = 449) |
| Heart attack | 8.1% (N = 46) | 14.7% (N = 82) | 1.0% (N = 5) | 7.5% (N = 37) | 4.6% (N = 378) |
| Diabetes | 9.0% (N = 51) | 13.1% (N = 73) | 5.5% (N = 27) | 12.0% (N = 59) | 7.8% (N = 634) |
| Stroke/Transient ischemic attack | 2.3% (N = 13) | 8.6% (N = 48) | 2.8% (N = 14) | 8.9% (N = 44) | 3.6% (N = 291) |
| High cholesterol | 33.6% (N = 190) | 30.1% (N = 168) | 35.2% (N = 174) | 35.8% (N = 176) | 38.1% (N = 3111) |
| Irregular heart rhythm | 5.3% (N = 30) | 12.9% (N = 72) | 5.3% (N = 26) | 11.6% (N = 57) | 7.2% (N = 588) |
| Other cardiovascular disease | 3.0% (N = 17) | 6.6% (N = 37) | 0.8% (N = 4) | 5.5% (N = 27) | 3.6% (N = 294) |
| Cataracts | 6.7% (N = 38) | 22.9% (N = 128) | 9.7% (N = 48) | 30.9% (N = 152) | 10.9% (N = 889) |
| Glaucoma/Age-related macular degeneration | 2.7% (N = 15) | 5.7% (N = 32) | 2.6% (N = 13) | 7.9% (N = 39) | 4.0% (N = 325) |
| Arthritis | 18.1% (N = 103) | 27.7% (N = 155) | 26.1% (N = 129) | 46.3% (N = 229) | 27.6% (N = 2255) |
| Osteoporosis | 1.6% (N = 9) | 2.7% (N = 15) | 12.8% (N = 63) | 20.1% (N = 99) | 9.6% (N = 786) |
| Cancer | 5.7% (N = 32) | 10.0% (N = 56) | 7.1% (N = 35) | 12.8% (N = 63) | 6.3% (N = 512) |
| Varicose ulcer | 1.6% (N = 9) | 3.9% (N = 22) | 2.4% (N = 12) | 8.1% (N = 40) | 3.3% (N = 271) |
| Urinary incontinence (0.5/1) | 1.9/2.5% (N = 11/14) | 3.2/10.0% (N = 18/56) | 5.9/14.2% (N = 29/70) | 5.5/17.7% (N = 27/87) | 3.2/9.4% (N = 259/765) |
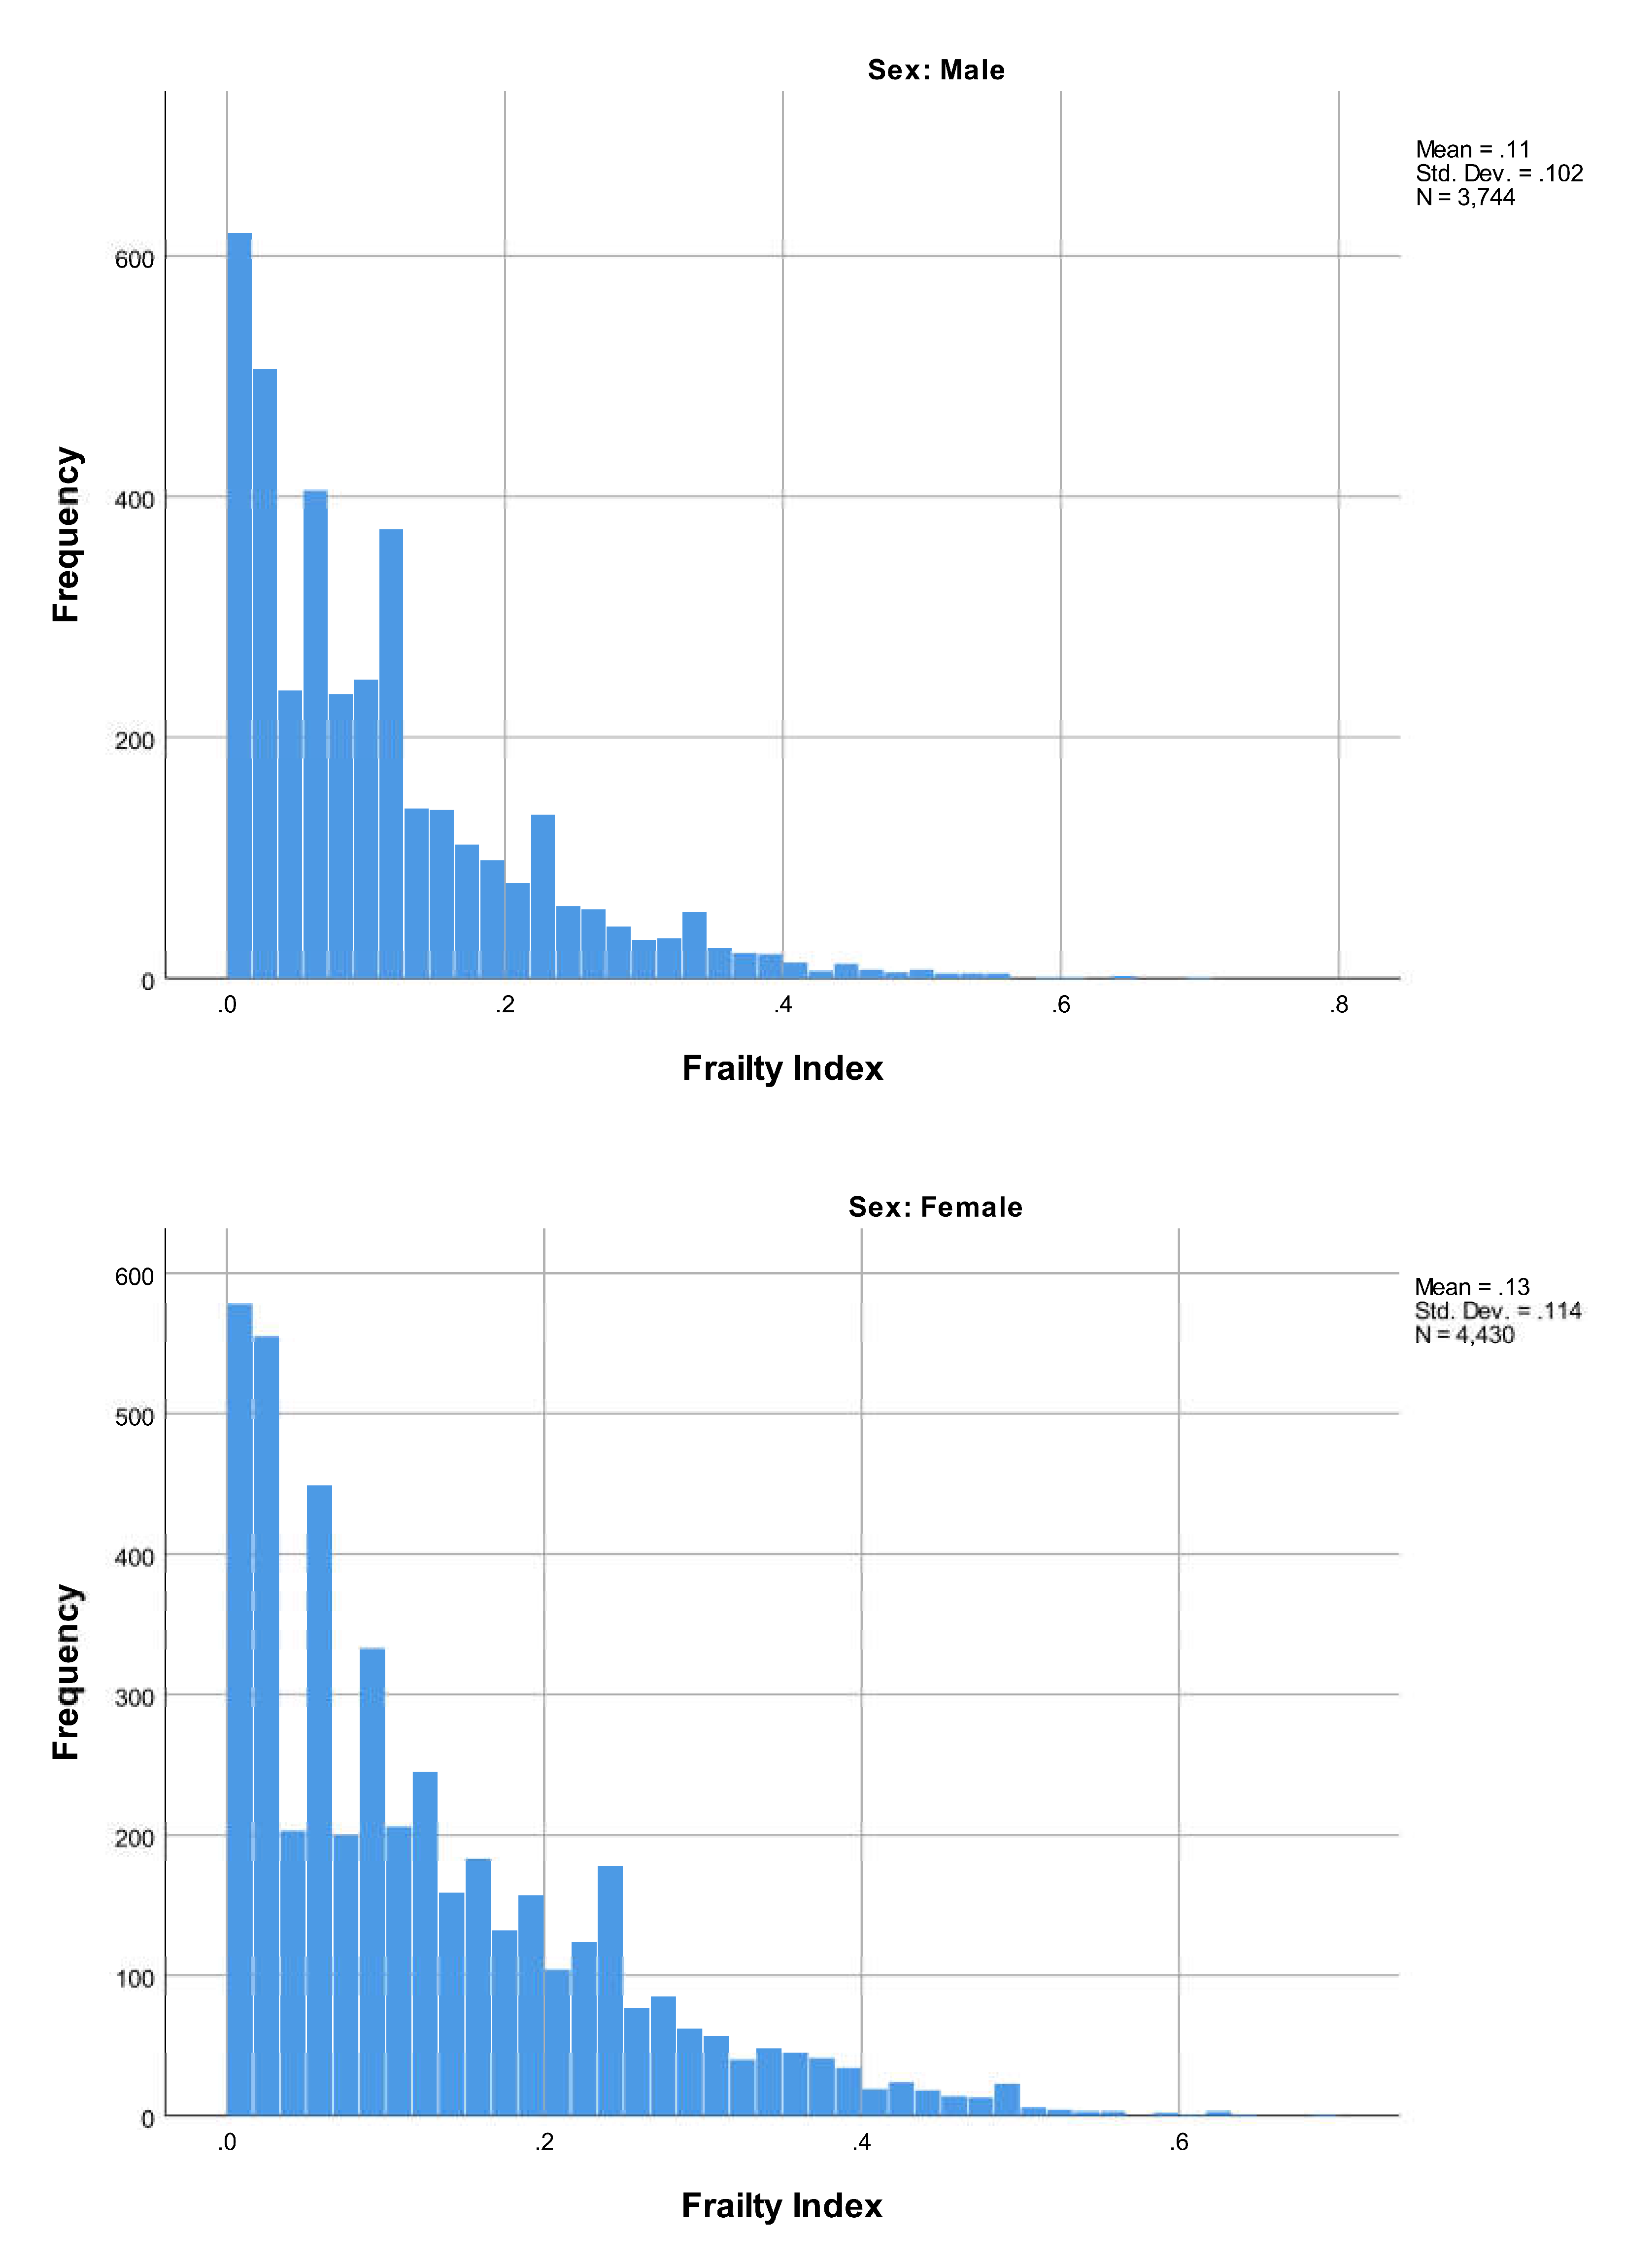
| TOTAL—Frailty Index Score | 0.09 (SD: 0.09 (0–0.55)) | 0.17 (SD: 0.13 (0–0.70)) | 0.11 (SD: 0.10 (0–0.52)) | 0.22 (SD: 0.14 (0–0.69)) | 0.12 (SD: 0.11 (0–0.70)) |
Publisher’s Note: MDPI stays neutral with regard to jurisdictional claims in published maps and institutional affiliations. |
© 2021 by the authors. Licensee MDPI, Basel, Switzerland. This article is an open access article distributed under the terms and conditions of the Creative Commons Attribution (CC BY) license (https://creativecommons.org/licenses/by/4.0/).
Share and Cite
Moguilner, S.; Knight, S.P.; Davis, J.R.C.; O’Halloran, A.M.; Kenny, R.A.; Romero-Ortuno, R. The Importance of Age in the Prediction of Mortality by a Frailty Index: A Machine Learning Approach in the Irish Longitudinal Study on Ageing. Geriatrics 2021, 6, 84. https://doi.org/10.3390/geriatrics6030084
Moguilner S, Knight SP, Davis JRC, O’Halloran AM, Kenny RA, Romero-Ortuno R. The Importance of Age in the Prediction of Mortality by a Frailty Index: A Machine Learning Approach in the Irish Longitudinal Study on Ageing. Geriatrics. 2021; 6(3):84. https://doi.org/10.3390/geriatrics6030084
Chicago/Turabian StyleMoguilner, Sebastian, Silvin P. Knight, James R. C. Davis, Aisling M. O’Halloran, Rose Anne Kenny, and Roman Romero-Ortuno. 2021. "The Importance of Age in the Prediction of Mortality by a Frailty Index: A Machine Learning Approach in the Irish Longitudinal Study on Ageing" Geriatrics 6, no. 3: 84. https://doi.org/10.3390/geriatrics6030084