
Glucose Serum Concentrations and Cardiovascular Disease in Patients on the End Stage of Renal Disease without Diabetes Mellitus


Abstract
:1. Introduction
2. Material and Methods
2.1. Subjects
2.2. Blood Collection
2.3. Laboratory Measurements
2.4. Hemodynamic Measurements
3. Approval and Consent
4. Data Analysis
5. Results

| Characteristic | Patients with Glucose Serum Concentrations Less than 114.5 mg/dL (n = 58, Mean ± SD or Mean Rank) | Patients with Glucose Serum Concentrations More than 114.5 mg/dL (n = 18, Mean ± SD or Mean Rank) |
|---|---|---|
| Age (years) | 60.8 ± 14.5 | 67.6 ± 15.5 |
| Dialysis duration (years) | 37.8 | 36.4 |
| BMI (Kg/m2) | 24.2 ± 2.9 | 25.3 ± 3.1 |
| Urine ( mL/day ) | 226.2 ± 150.6 | 166.6 ± 115.4 |
| KTVurea | 38.22 | 34.88 |
| nPCR (g/Kg/day) | 2.3 ± 0.4 | 2.5 ± 0.6 |
| Glucose (mg/dL) | 85.5 ± 13.7 | 132.7 ± 26.2 * |
| SBP (mmHg) | 130.0 ± 20.7 | 138.3 ± 19.7 |
| DBP (mmHg) | 80.8 ± 10.2 | 84.3 ± 7.7 |
| MBP (mmHg) | 97.2 ± 12.9 | 102.3 ± 11.3 |
| c-fPWV(m/s) | 11.1 ± 1.8 | 12.08 ± 1.7 |
| Augmentation index (AIx) | 24.1 ± 2.3 | 24.4 ± 1.7 |
| Pulse Pressure (PP, mmHg) | 55.4 ± 17.7 | 66.7 ± 20.8 * |
| ABPI | 1.12 ± 0.4 | 1.12 ± 0.5 |
| Hemoglobulin | 11.8 ± 1.3 | 12.01 ± 1.3 |
| Monocytes (K/μL) | 0.49 ± 0.2 | 0.50 ± 0.2 |
| insulin (μU/mL) | 32.7 | 54.7 * |
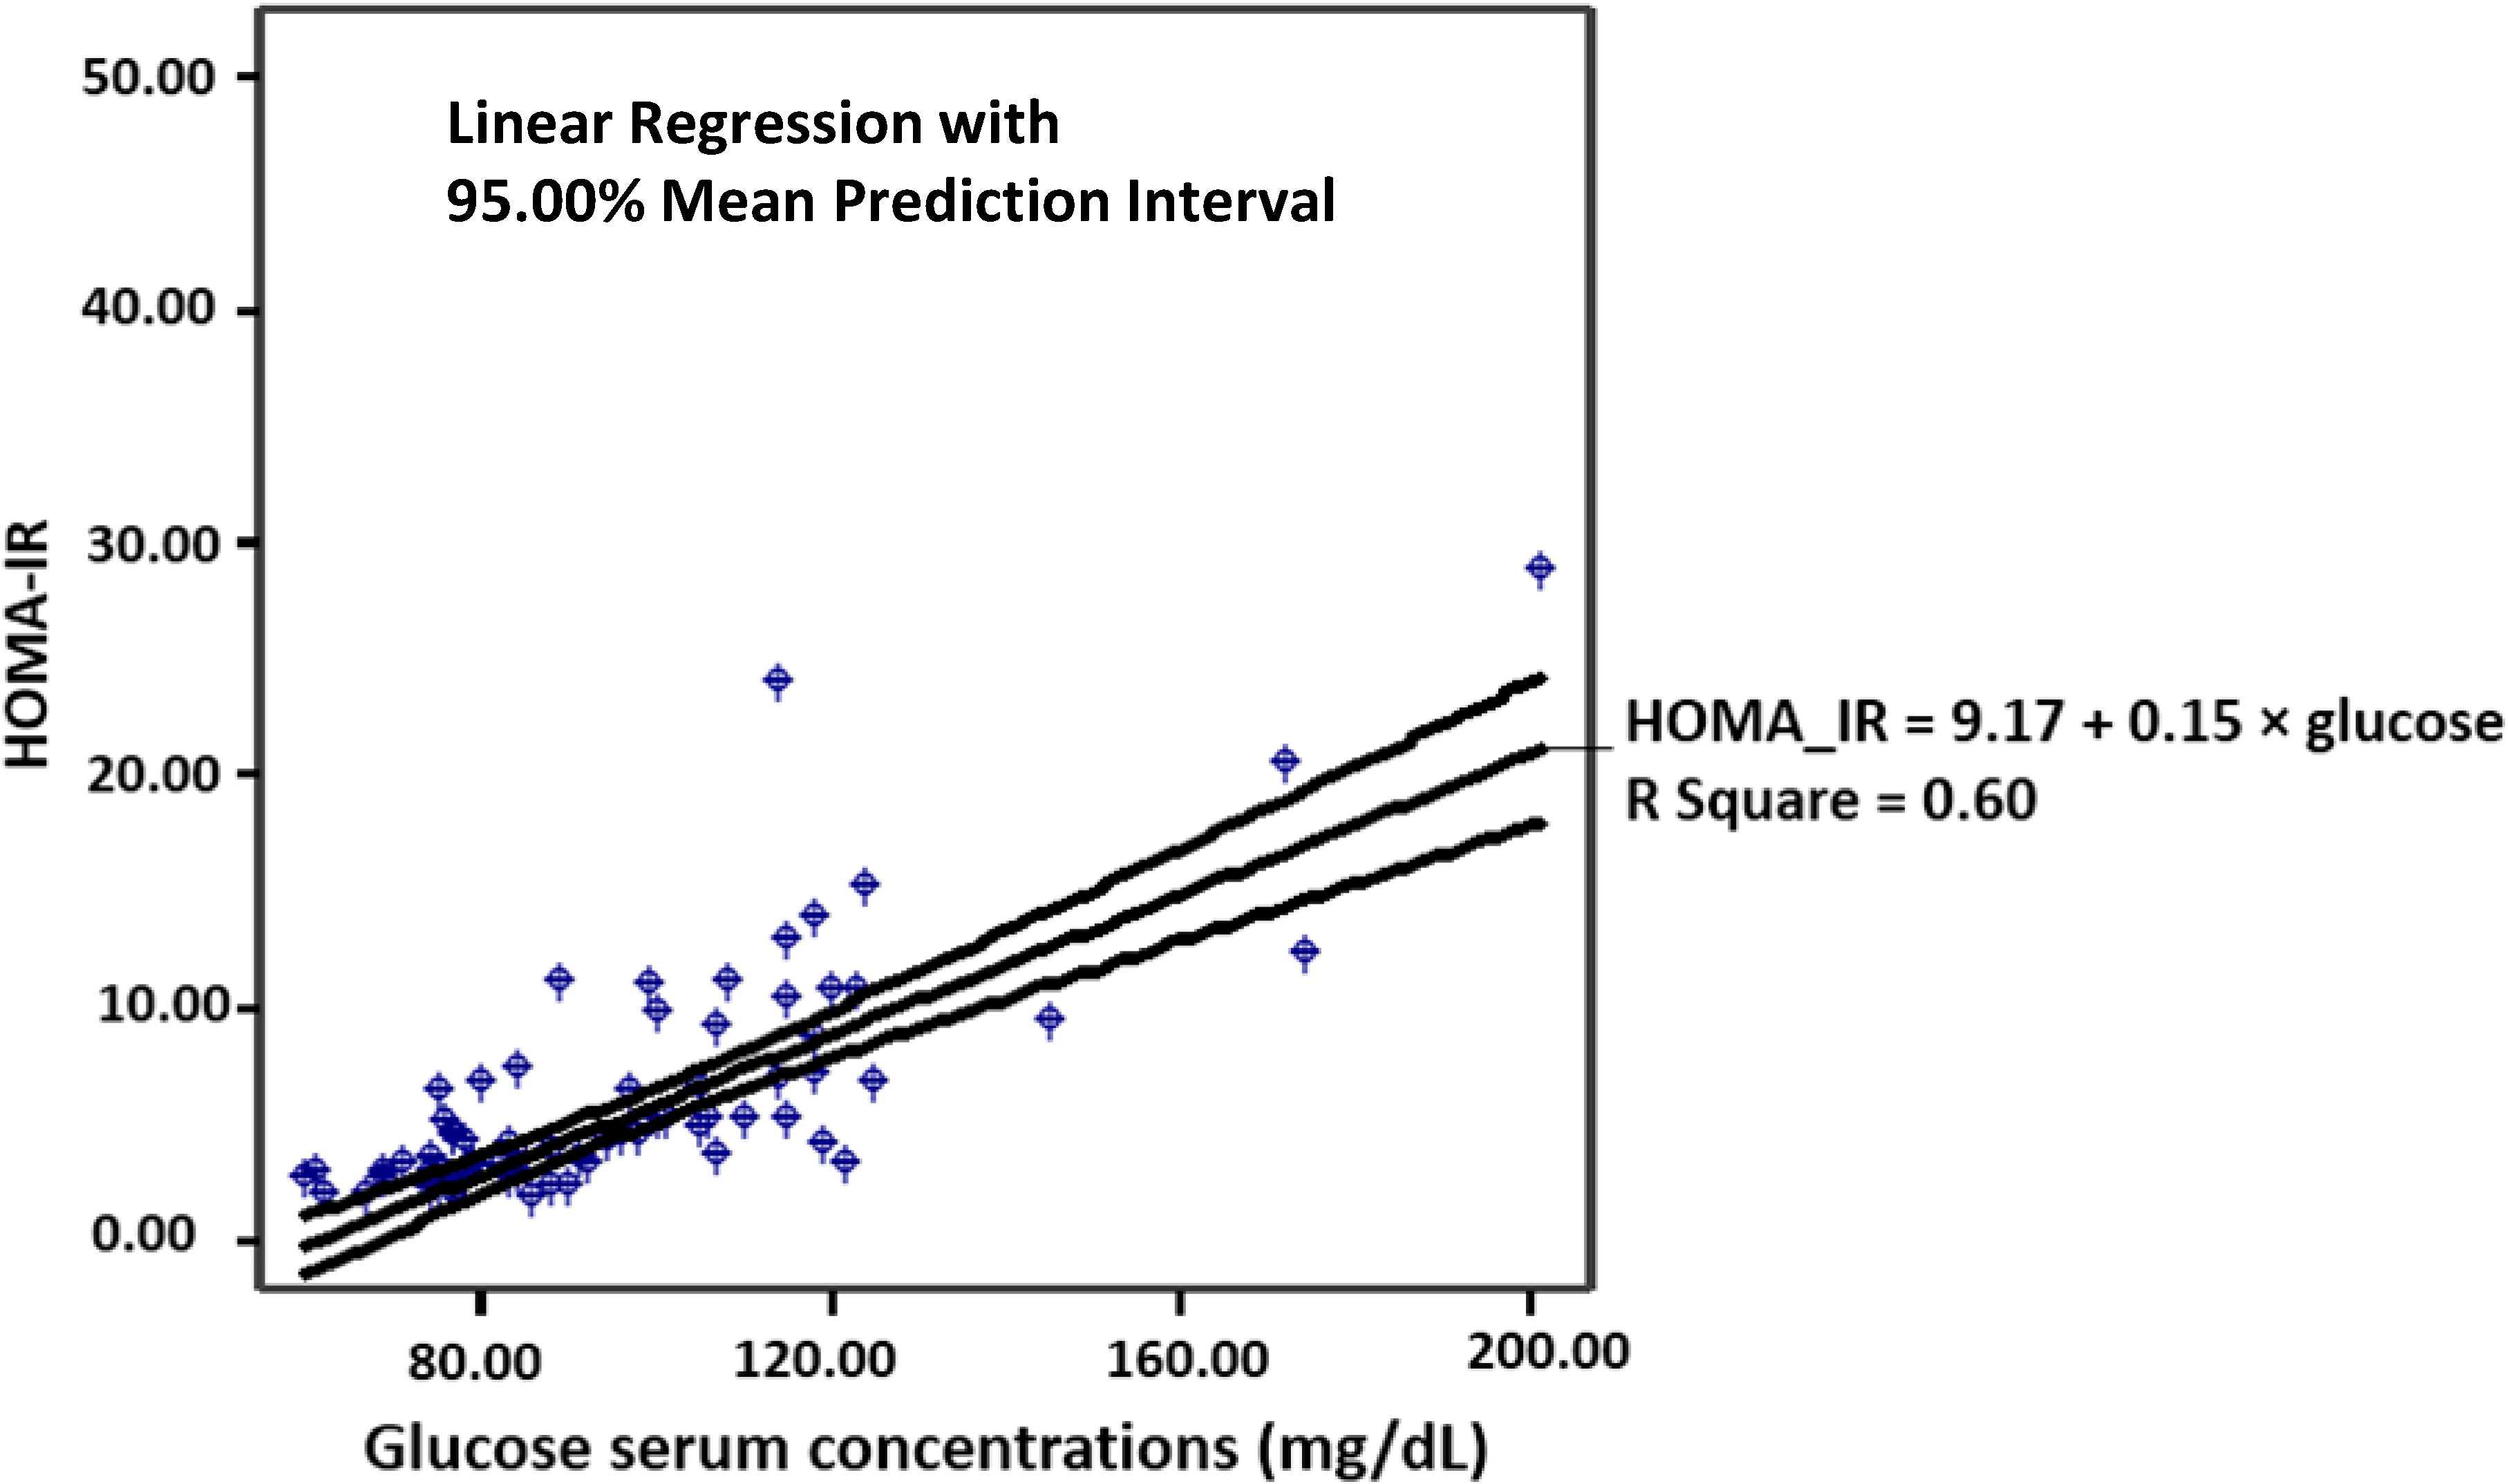
| ΗΟΜΑ-ΙR (mmol/L) | 31.4 | 59.4 * |
| hsCRP (mg/L) | 7.3 ± 6.03 | 10.6 ± 4.6 * |
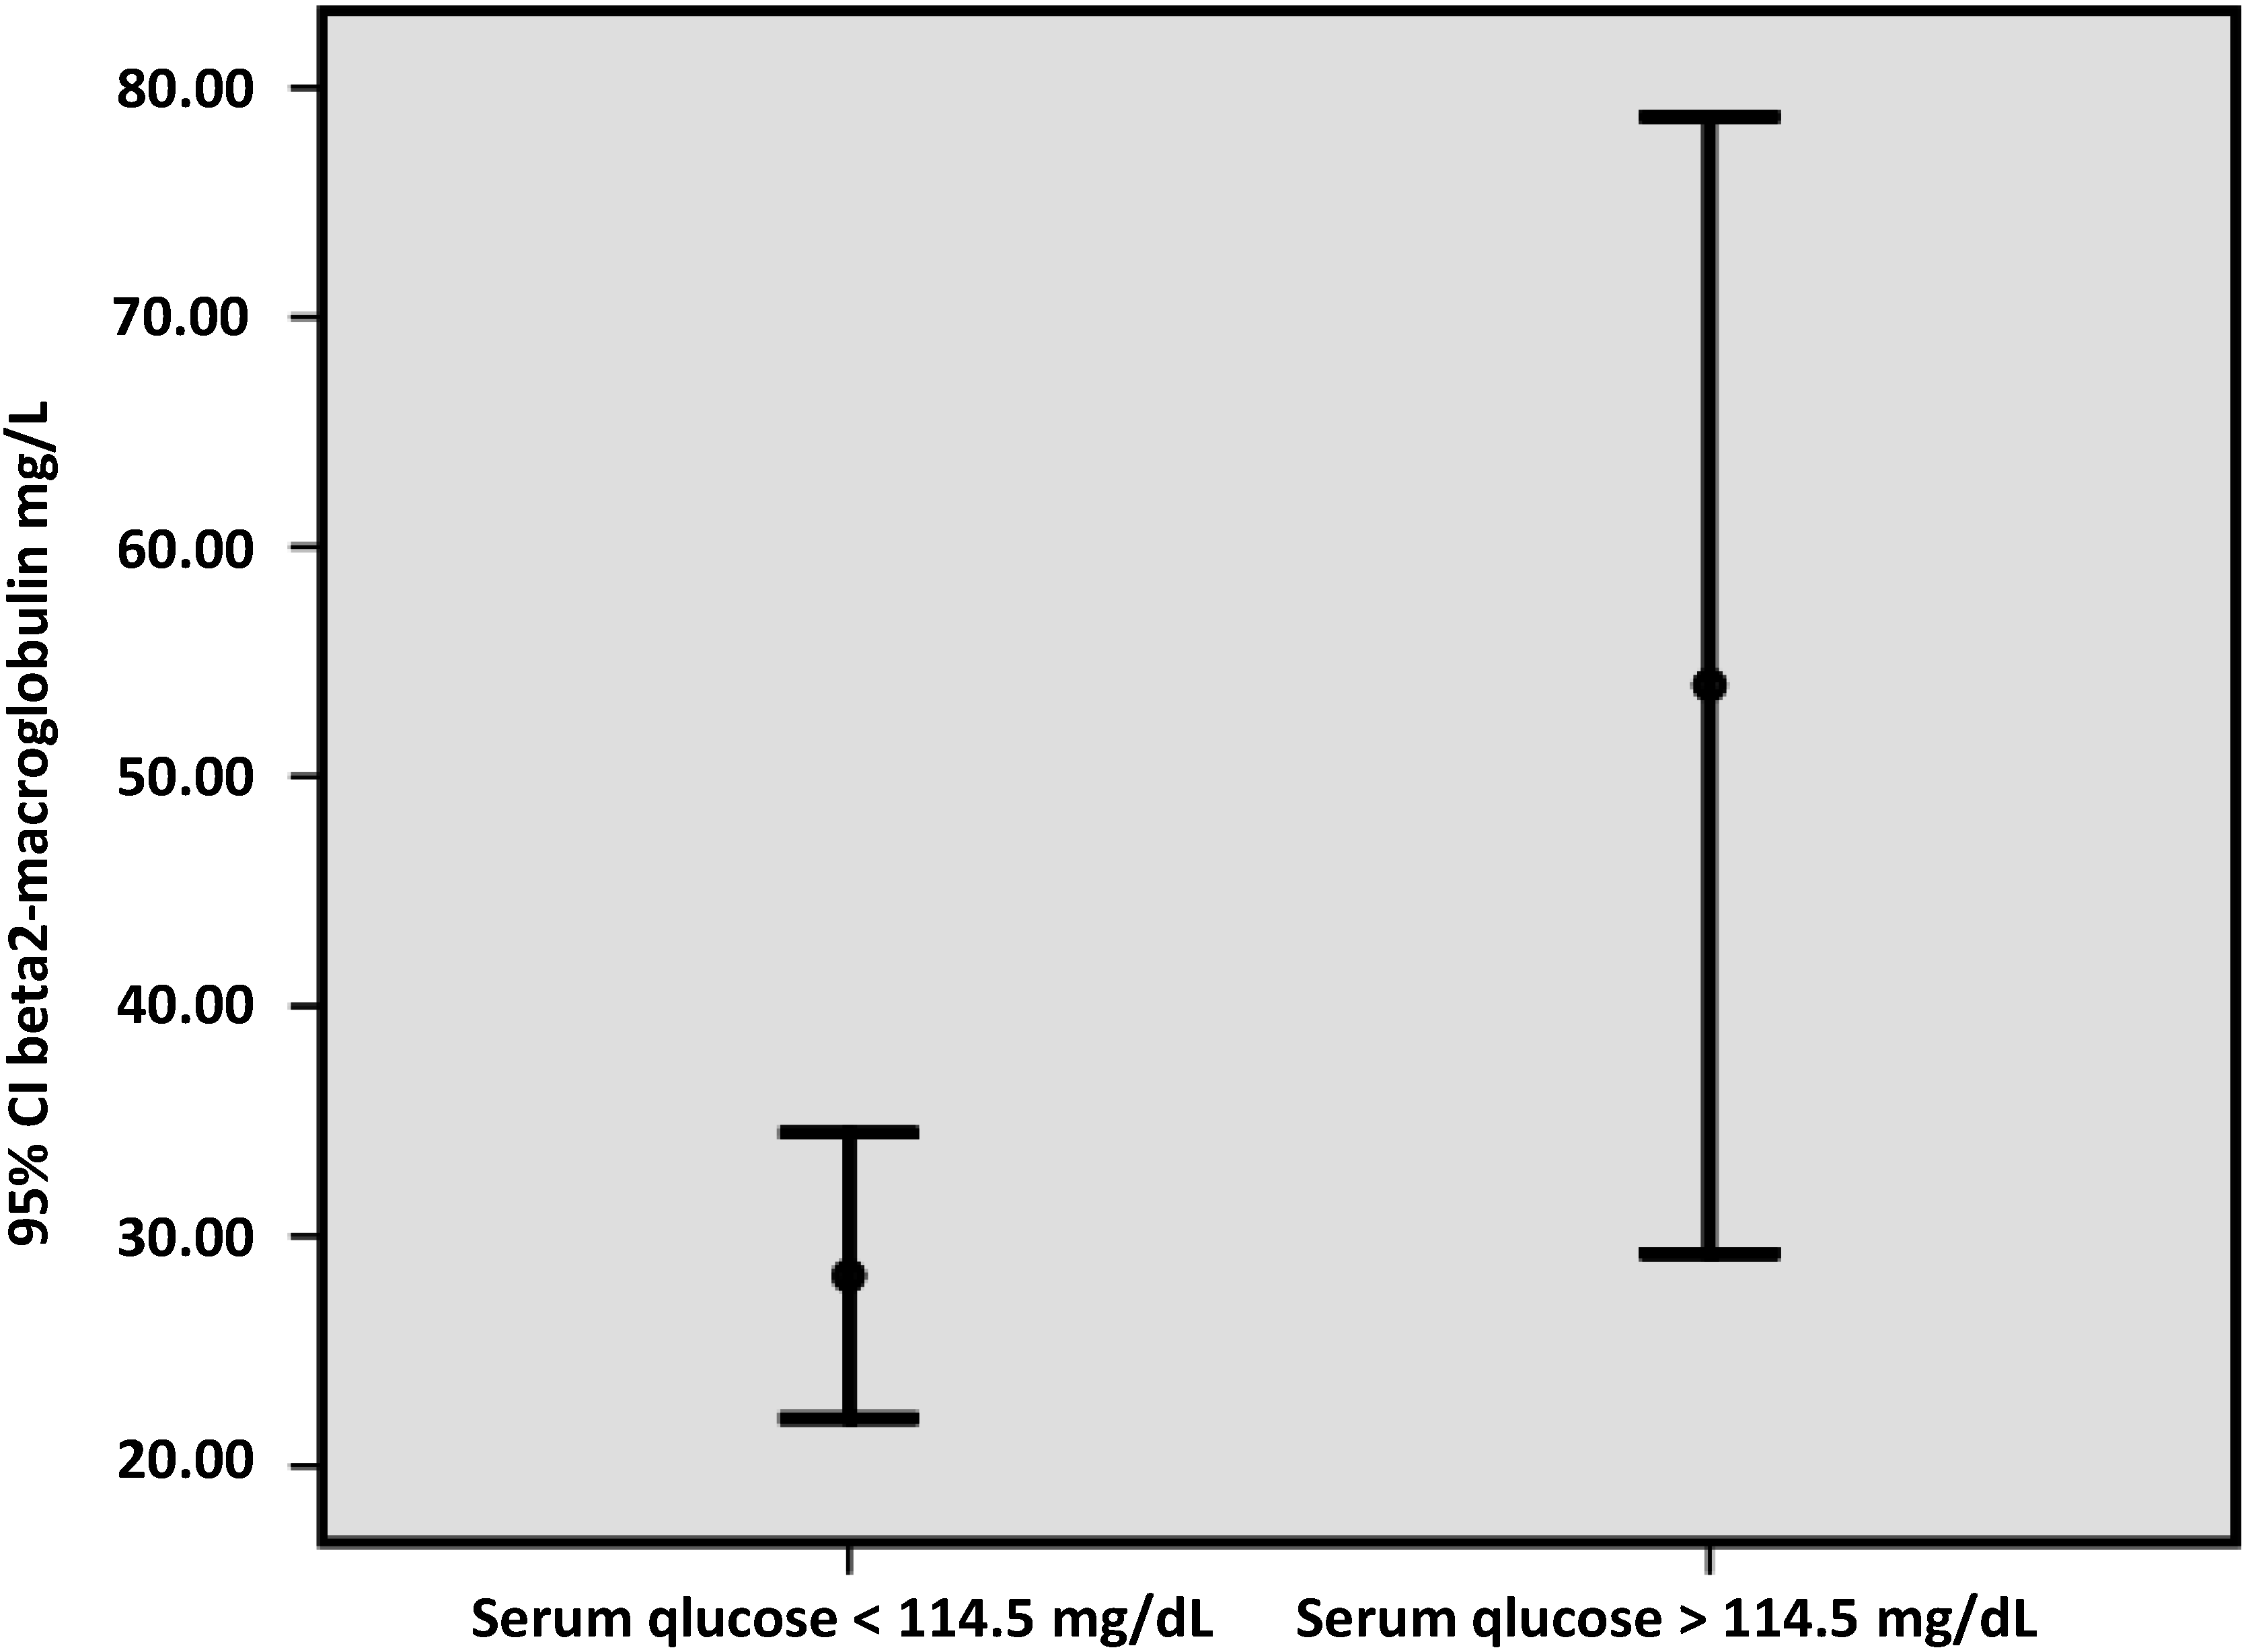
| beta2-microglobulin (mg/L) | 34.1 | 49.5 * |
| i-PTH (pg/mL) | 38.2 | 34.6 |
| Albumin (gr/dL) | 37.9 | 36.09 |
| LDL/HDL | 2.3 ± 0.9 | 2.2 ± 0.7 |
| ox-LDL (ng/mL) | 35.2 | 45.8 |

Correlations

| Factors | B | S.E. | Sig. | Exp (B) |
|---|---|---|---|---|
| Glucose | −0.001 | 0.013 | 0.937 | 0.999 |
| age | 0.064 | 0.03 | 0.042 | 1.066 |
| hypertension | 1.042 | 0.75 | 0.169 | 2.836 |
| BMI | −0.263 | 0.13 | 0.044 | 0.769 |
| LDL/HDL | −1.288 | 0.55 | 0.020 | 0.276 |
| Hb | 0.605 | 0.32 | 0.060 | 1.832 |
| hsCRP | 0.092 | 0.06 | 0.164 | 1.097 |
| oxLDL | 0.011 | 0.005 | 0.025 | 1.011 |
| i-PTH | 0.004 | 0.002 | 0.025 | 1.004 |
| Kt/Vurea | −5.816 | 2.9 | 0.044 | 0.003 |
| Family history | 0.099 | 0.824 | 0.905 | 1.104 |
6. Discussion
7. Conclusions
Acknowledgments
Author Contributions
Conflicts of Interest
References
- Gaede, P.; Vedel, P.; Larsen, N.; Jensen, G.V.; Parving, H.H.; Pedersen, O. Multifactorial intervention and cardiovascular disease in patients with type 2 diabetes. N. Engl. J. Med. 2003, 348, 383–393. [Google Scholar] [CrossRef] [PubMed]
- Fang, Z.Y.; Prins, J.B.; Marwick, T.H. Diabetic cardiomyopathy: Evidence, mechanisms, and therapeutic implications. Endocr. Rev. 2004, 25, 543–567. [Google Scholar] [CrossRef] [PubMed]
- Ritz, E.; Wanner, C. The challenge of sudden death in dialysis patients. Clin. J. Am. Soc. Nephrol. 2008, 3, 920–929. [Google Scholar] [CrossRef] [PubMed]
- Ansari, A.; Thomas, S.; Goldsmith, D. Assessing glycemic control in patients with diabetes and end-stage renal failure. Am. J. Kidney Dis. 2003, 41, 523–531. [Google Scholar] [CrossRef] [PubMed]
- Chauveau, P.; Nguyen, H.; Combe, C.; Chêne, G.; Azar, R.; Cano, N.; Canaud, B.; Fouque, D.; Laville, M.; Leverve, X.; et al. French Study Group for Nutrition in Dialysis. Dialyzer membrane permeability and survival in hemodialysis patients. Am. J. Kidney Dis. 2005, 45, 565–571. [Google Scholar] [CrossRef] [PubMed]
- Daugirdas, J.T. Second generation logarithmic estimates of single-pool variable volume Kt/V: An analysis of error. J. Am. Soc. Nephrol. 1993, 4, 1205–1213. [Google Scholar] [PubMed]
- Silva, E.A.; Flexa, F.; Zanella, M.T. Impact of abdominal fat and insulin resistance on arterial hypertension in non-obese women. Arq. Bras. Endocrinol. Metabol. 2009, 53, 340–343. [Google Scholar] [CrossRef] [PubMed] [Green Version]
- Daugirdas, J.T. Simplified equations for monitoring Kt/V, PCRn, eKt/V, and ePCRn. Adv. Ren. Replace Ther. 1995, 2, 295–304. [Google Scholar] [PubMed]
- Johansen, J.S.; Harris, A.K.; Rychly, D.J.; Ergul, A. Oxidative stress and the use of antioxidants in diabetes: Linking basic science to clinical practice. Cardiovasc. Diabetol. 2005, 4. [Google Scholar] [CrossRef] [Green Version]
- Ray, K.K.; Seshasai, S.R.; Wijesuriya, S.; Sivakumaran, R.; Nethercott, S.; Preiss, D.; Erqou, S.; Sattar, N. Effect of intensive control of glucose on cardiovascular outcomes and death in patients with diabetes mellitus: A metaanalysis of randomised controlled trials. Lancet 2009, 373, 1765–1772. [Google Scholar] [CrossRef] [PubMed]
- Drechsler, C.; Krane, V.; Ritz, E.; Marz, W.; Wanner, C. Glycemic control and cardiovascular events in diabetic hemodialysis patients. Circulation 2009, 120, 2421–2428. [Google Scholar] [CrossRef] [PubMed]
- Shima, K.; Komatsu, M.; Kawahara, K.; Minaguchi, J.; Kawashima, S. Stringent glycaemic control prolongs survival in diabetic patients with end-stage renal disease on haemodialysis. Nephrology (Carlton) 2010, 15, 632–638. [Google Scholar] [CrossRef]
- Shurraw, S.; Majumdar, S.R.; Thadhani, R.; Wiebe, N.; Tonelli, M. Alberta Kidney Disease Network. Glycemic control and the risk of death in 1484 patients receiving maintenance hemodialysis. Am. J. Kidney Dis. 2010, 55, 875–884. [Google Scholar] [CrossRef] [PubMed]
- Freedman, B.I.; Shenoy, R.N.; Planer, J.A.; Clay, K.D.; Shihabi, Z.K.; Burkart, J.M.; Cardona, C.Y.; Andries, L.; Peacock, T.P.; Sabio, H.; et al. Comparison of glycated albumin and hemoglobin A1c concentrations in diabetic subjects on peritoneal and hemodialysis. Perit Dial. Int. 2010, 30, 72–79. [Google Scholar] [CrossRef] [PubMed]
- Di Iorio, B.; Nazzaro, P.; Cucciniello, E.; Bellizzi, V. Influence of haemodialysis on variability of pulse wave velocity in chronic haemodialysis patients. Nephrol. Dial. Transplant. 2010, 25, 1579–1583. [Google Scholar] [CrossRef] [PubMed]
- Zheng, D.; Cheng, L.T.; Zhuang, Z.; Gu, Y.; Tang, L.J.; Wang, T. Correlation between pulse wave velocity and fluid distribution in hemodialysis patients. Blood Purif. 2009, 27, 248–252. [Google Scholar] [CrossRef] [PubMed]
- Ritz, E.; Wanner, C. Lipid abnormalities and cardiovascular risk in renal disease. J. Am. Soc. Nephrol. 2008, 19, 1065–1070. [Google Scholar] [CrossRef] [PubMed]
- Tzoulaki, I.; Murray, G.D.; Lee, A.J.; Rumley, A.; Lowe, G.D.; Fowkes, F.G. C-reactive protein, interleukin-6, and soluble adhesion molecules as predictors of progressive peripheral atherosclerosis in the general population: Edinburgh Artery Study. Circulation 2005, 112, 976–983. [Google Scholar] [CrossRef] [PubMed]
- Miyata, T.; Inagi, R.; Iida, Y.; Sato, M.; Yamada, N.; Oda, O.; Maeda, K.; Seo, H. Involvement of β2-microgbobulin modified with advanced glycation end products in the pathogenesis of hemodialysis-associated amyboidosis. J. Clin. Invest. 1994, 93, 521–528. [Google Scholar] [CrossRef] [PubMed]
- Kalantar-Zadeh, K.; Mehrotra, R.; Fouque, D.; Kopple, J.D. Metabolic acidosis and malnutrition-inflammation complex syndrome in chronic renal failure. Semin. Dial. 2004, 17, 455–465. [Google Scholar] [CrossRef] [PubMed]
- London, G.M.; Drueke, T.B. Atherosclerosis and arteriosclerosis in chronic renal failure. Kidney Int. 1997, 51, 1678–1695. [Google Scholar] [CrossRef] [PubMed]
- Sonikian, M.; Gogusev, J.; Zingraff, J.; Loric, S.; Quednau, B.; Bessou, G.; Siffert, W.; Drüeke, T.B.; Reusch, H.P.; Luft, F.C. Potential effect of metabolic acidosis on beta2-microglobulin generation: In vivo and in vitro studies. J. Am. Soc. Nephrol. 1996, 7, 350–356. [Google Scholar] [PubMed]
© 2015 by the authors; licensee MDPI, Basel, Switzerland. This article is an open access article distributed under the terms and conditions of the Creative Commons Attribution license (http://creativecommons.org/licenses/by/4.0/).
Share and Cite
Raikou, V.D.; Kyriaki, D. Glucose Serum Concentrations and Cardiovascular Disease in Patients on the End Stage of Renal Disease without Diabetes Mellitus. J. Cardiovasc. Dev. Dis. 2015, 2, 66-75. https://doi.org/10.3390/jcdd2020066
Raikou VD, Kyriaki D. Glucose Serum Concentrations and Cardiovascular Disease in Patients on the End Stage of Renal Disease without Diabetes Mellitus. Journal of Cardiovascular Development and Disease. 2015; 2(2):66-75. https://doi.org/10.3390/jcdd2020066
Chicago/Turabian StyleRaikou, Vaia D., and Despina Kyriaki. 2015. "Glucose Serum Concentrations and Cardiovascular Disease in Patients on the End Stage of Renal Disease without Diabetes Mellitus" Journal of Cardiovascular Development and Disease 2, no. 2: 66-75. https://doi.org/10.3390/jcdd2020066