
Advanced Electrocardiography Identifies Left Ventricular Systolic Dysfunction in Non-Ischemic Cardiomyopathy and Tracks Serial Change over Time

Abstract
:1. Introduction
2. Methods
2.1. Patient Selection
2.2. A-ECG Analysis
2.3. Human Reader Sub-Study
2.4. Echocardiography
2.5. Statistics
3. Results
3.1. Cases

| Cases (n = 41) | Controls (n = 38) | p-Value | |
|---|---|---|---|
| Age (mean/SD) | 57 (14) | 44(19) | 0.76 |
| Type 2 DM (%) | 9 (22) | 2 (5) | 0.06 |
| HTN (%) | 18 (44) | 9 (24) | 0.1 |
| Current Smoker (%) | 7 (2) | 6 (16) | 0.07 |
| Ex-smoker (%) | 15 (37) | 9 (24) | 0.3 |
| IHD (%) | 2 (5) | 2 (5) | 0.6 |
| Dyslipidaemia (%) | 12 (29) | 7 (18) | 0.37 |
| PVD (%) | 1 (2) | - | 0.81 |
| CVA/TIA (%) | 4 (10) | - | 0.14 |
| AF (%) | 12 (29) | 1 (3) | 0.005 |
| Alcohol excess (%) | 3(7) | - | 0.29 |
| Mental Health Dx (%) | 3 (7) | 3 (8) | 0.8 |
| Substance abuse (%) | 2 (5) | - | 0.49 |
| Gout (%) | 6 (15) | 3 (8) | 0.54 |
| CKD (%) | 2 (5) | 2 (5) | 0.6 |
| Obesity (%) | 21 (51) | 11 (29) | 0.08 |
| Ejection Fraction (mean/SD) | Echo 1 (n = 41) | Echo 2 (n = 41) | Echo 3 (n = 21) | Controls (n = 38) | ||||
|---|---|---|---|---|---|---|---|---|
| 25% (9) | 31% * (11) | 38% ¥ (13) | 55%–60% | |||||
| Drug Rx | Max dose | Drug Rx | Max dose | Drug Rx | Max dose | Drug Rx | Max dose | |
| Betablocker (%) | 15 (37) | 2 (5) | 39 (95) | 14 (34) | 17 (81) | 12 (57) | 8 (21) | 1 (3) |
| ACEI (%) | 17 (41) | 7 (7) | 30 (73) | 12 (29) | 13 (62) | 7 (33) | 6 (16) | 2 (5) |
| ARB (%) | 4 (10) | 2 (5) | 10 (24) | 2 (5) | 5 (24) | 3 (14) | 2 (5) | 2 (5) |
| CCHB (%) | 5 (12) | 1 (2) | 2 (5) | - | 3 (14) | - | 6 (16) | 2 (5) |
| Spironolactone (%) | 9 (22) | 7 (7) | 24 (59) | 19 (46) | 11 (52) | 7 (33) | - | - |
| Digoxin (%) | 2 (5) | - | 4 (10) | - | 4 (19) | - | - | - |
| Loop Diuretic (%) | 9 (22) | - | 27 (66) | - | 11 (52) | - | - | - |
| Thiazide diuretic (%) | 2 (5) | 2 (5) | 1 (2) | 1 (2) | - | - | 1 (3) | 1 (3) |
| Statin (%) | 10 (24) | 2 (5) | 18 (44) | 1 (2) | 6 (29) | 1 (5) | 9 (24) | 1 (3) |
| Aspirin (%) | 13 (32) | 12 (29) | 12 (29) | 12 (29) | 1 (5) | 1 (5) | 7 (18) | 7 (18) |
| Warfarin (%) | 3 (7) | - | 12 (29) | - | 7 (33) | - | - | - |
| Dabigatran (%) | - | - | 2 (5) | - | 1 (5) | - | - | - |
| Dipyridamole (%) | 1 (2) | 1 (2) | 1 (2) | 1 (2) | - | - | - | - |
| Amiodarone (%) | 1 (2) | - | 3 (7) | - | - | - | - | - |
| Clopidogrel (%) | - | - | 1 (2) | - | - | - | 1 (3) | - |
| ISMN (%) | - | - | - | - | - | - | 1 (3) | - |
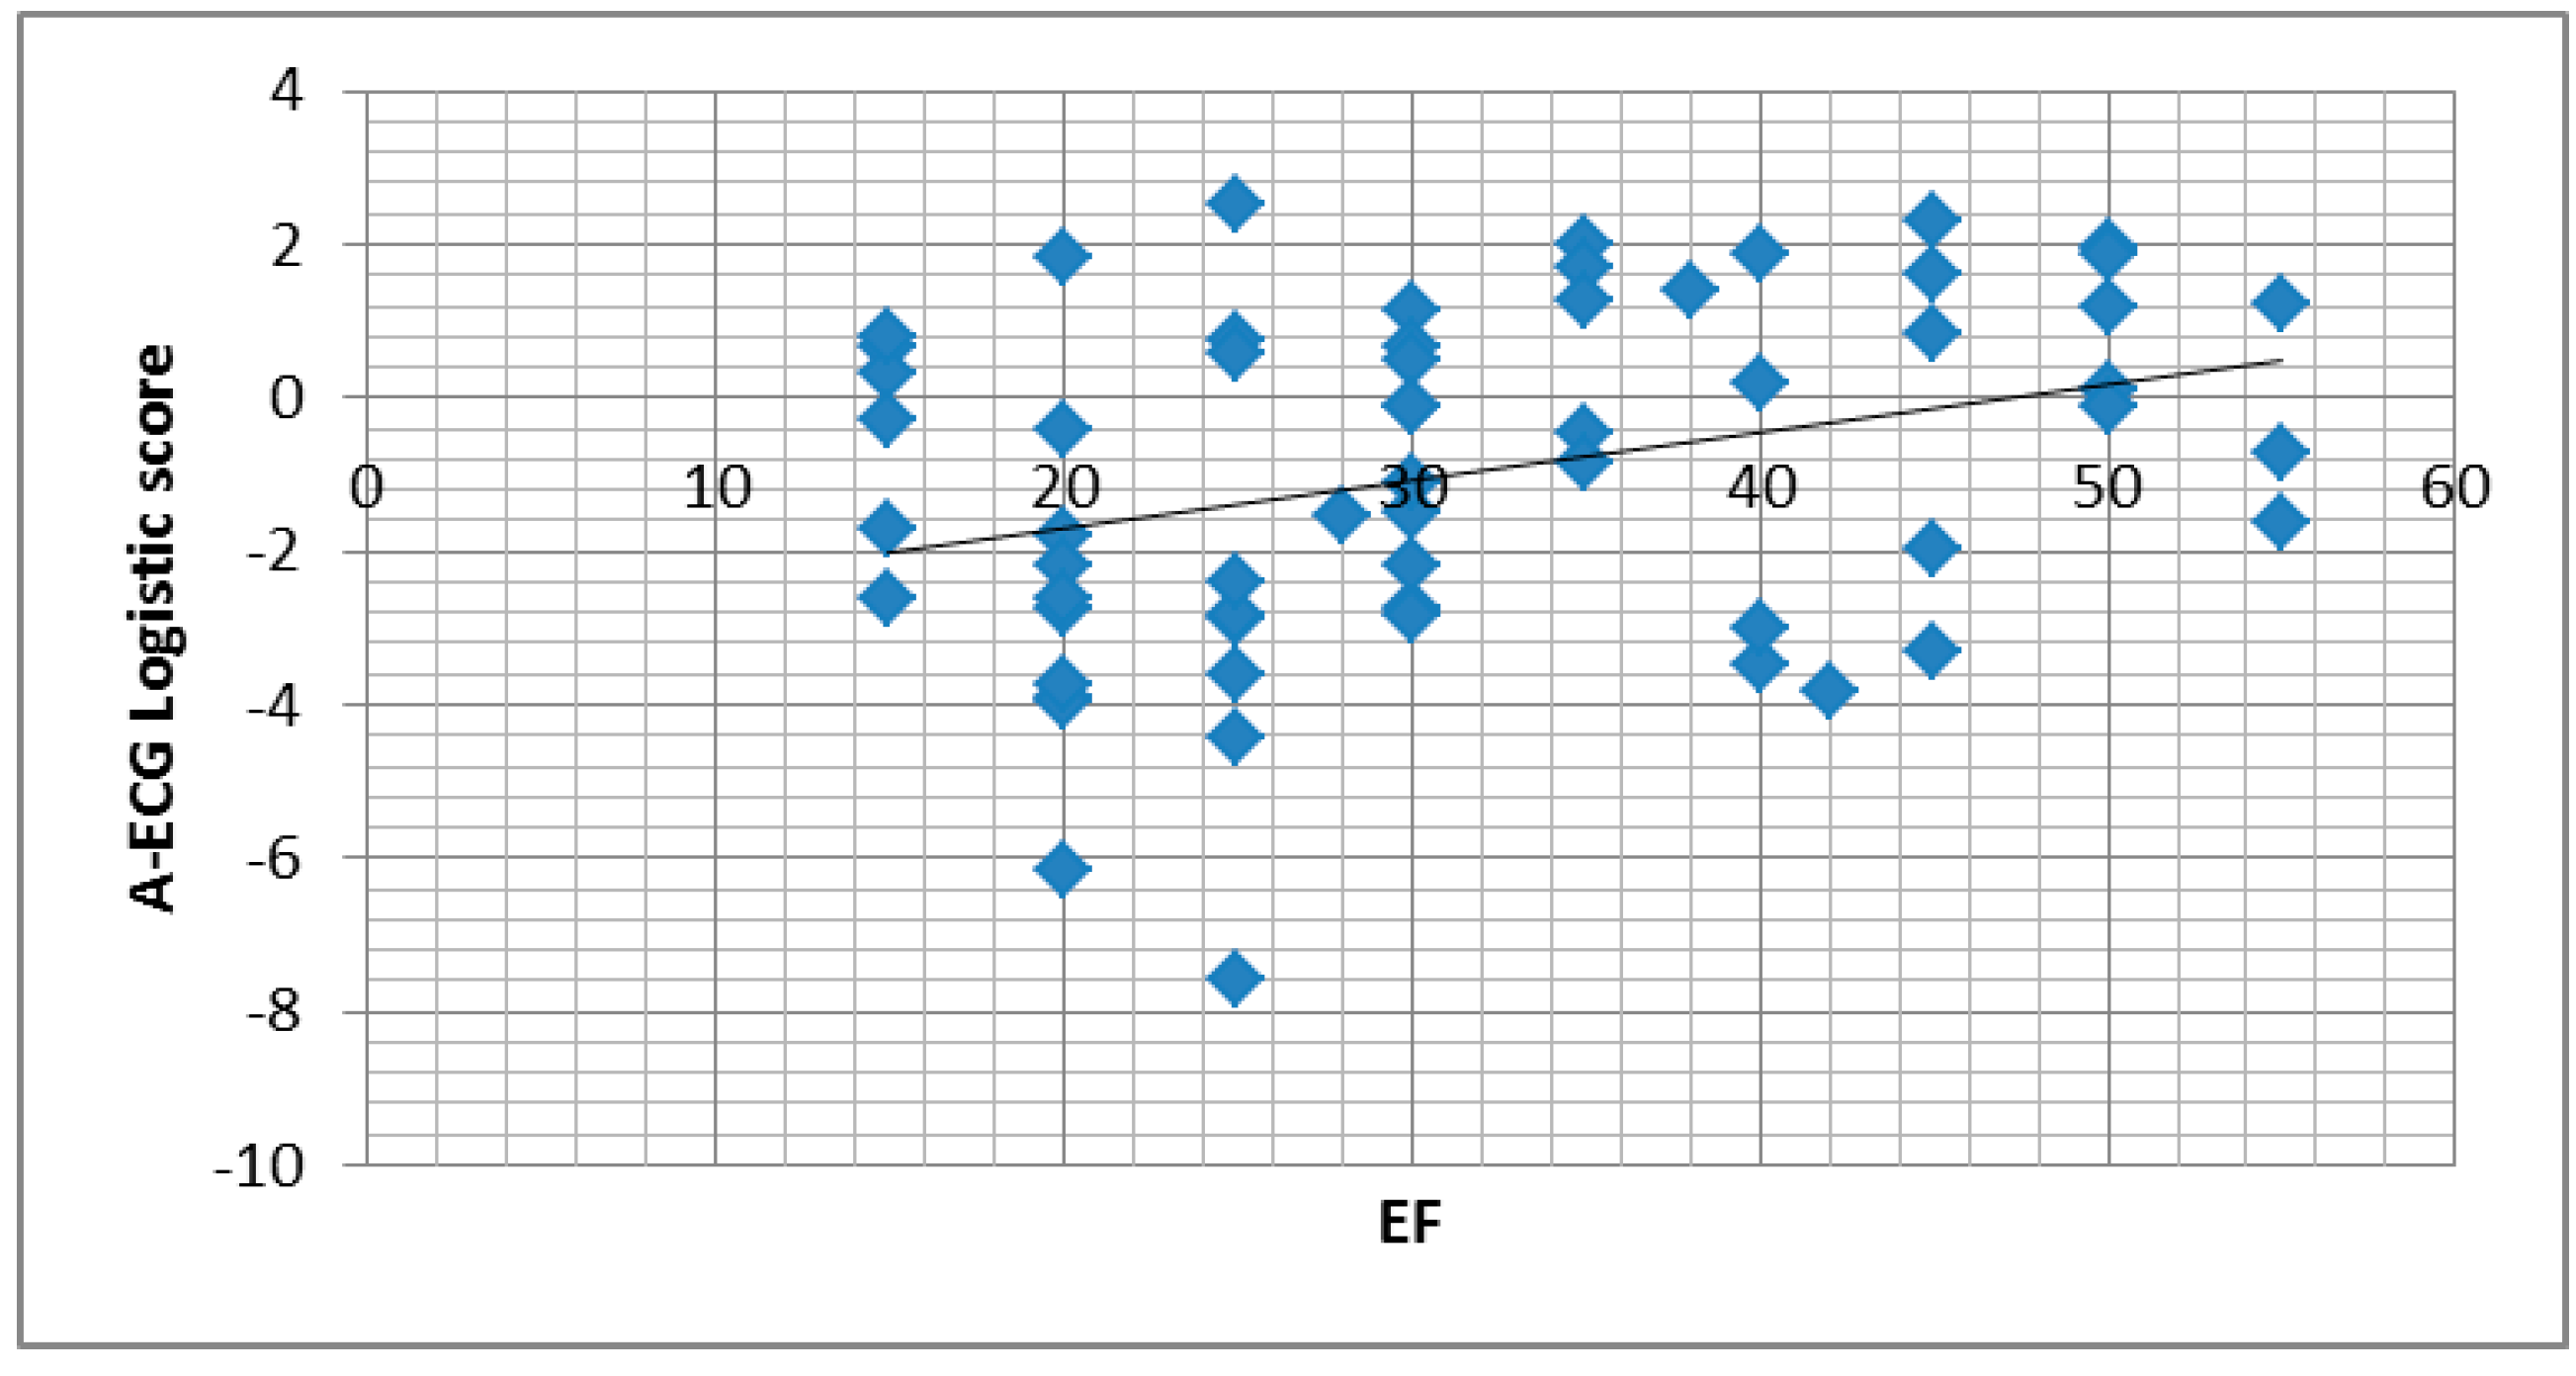
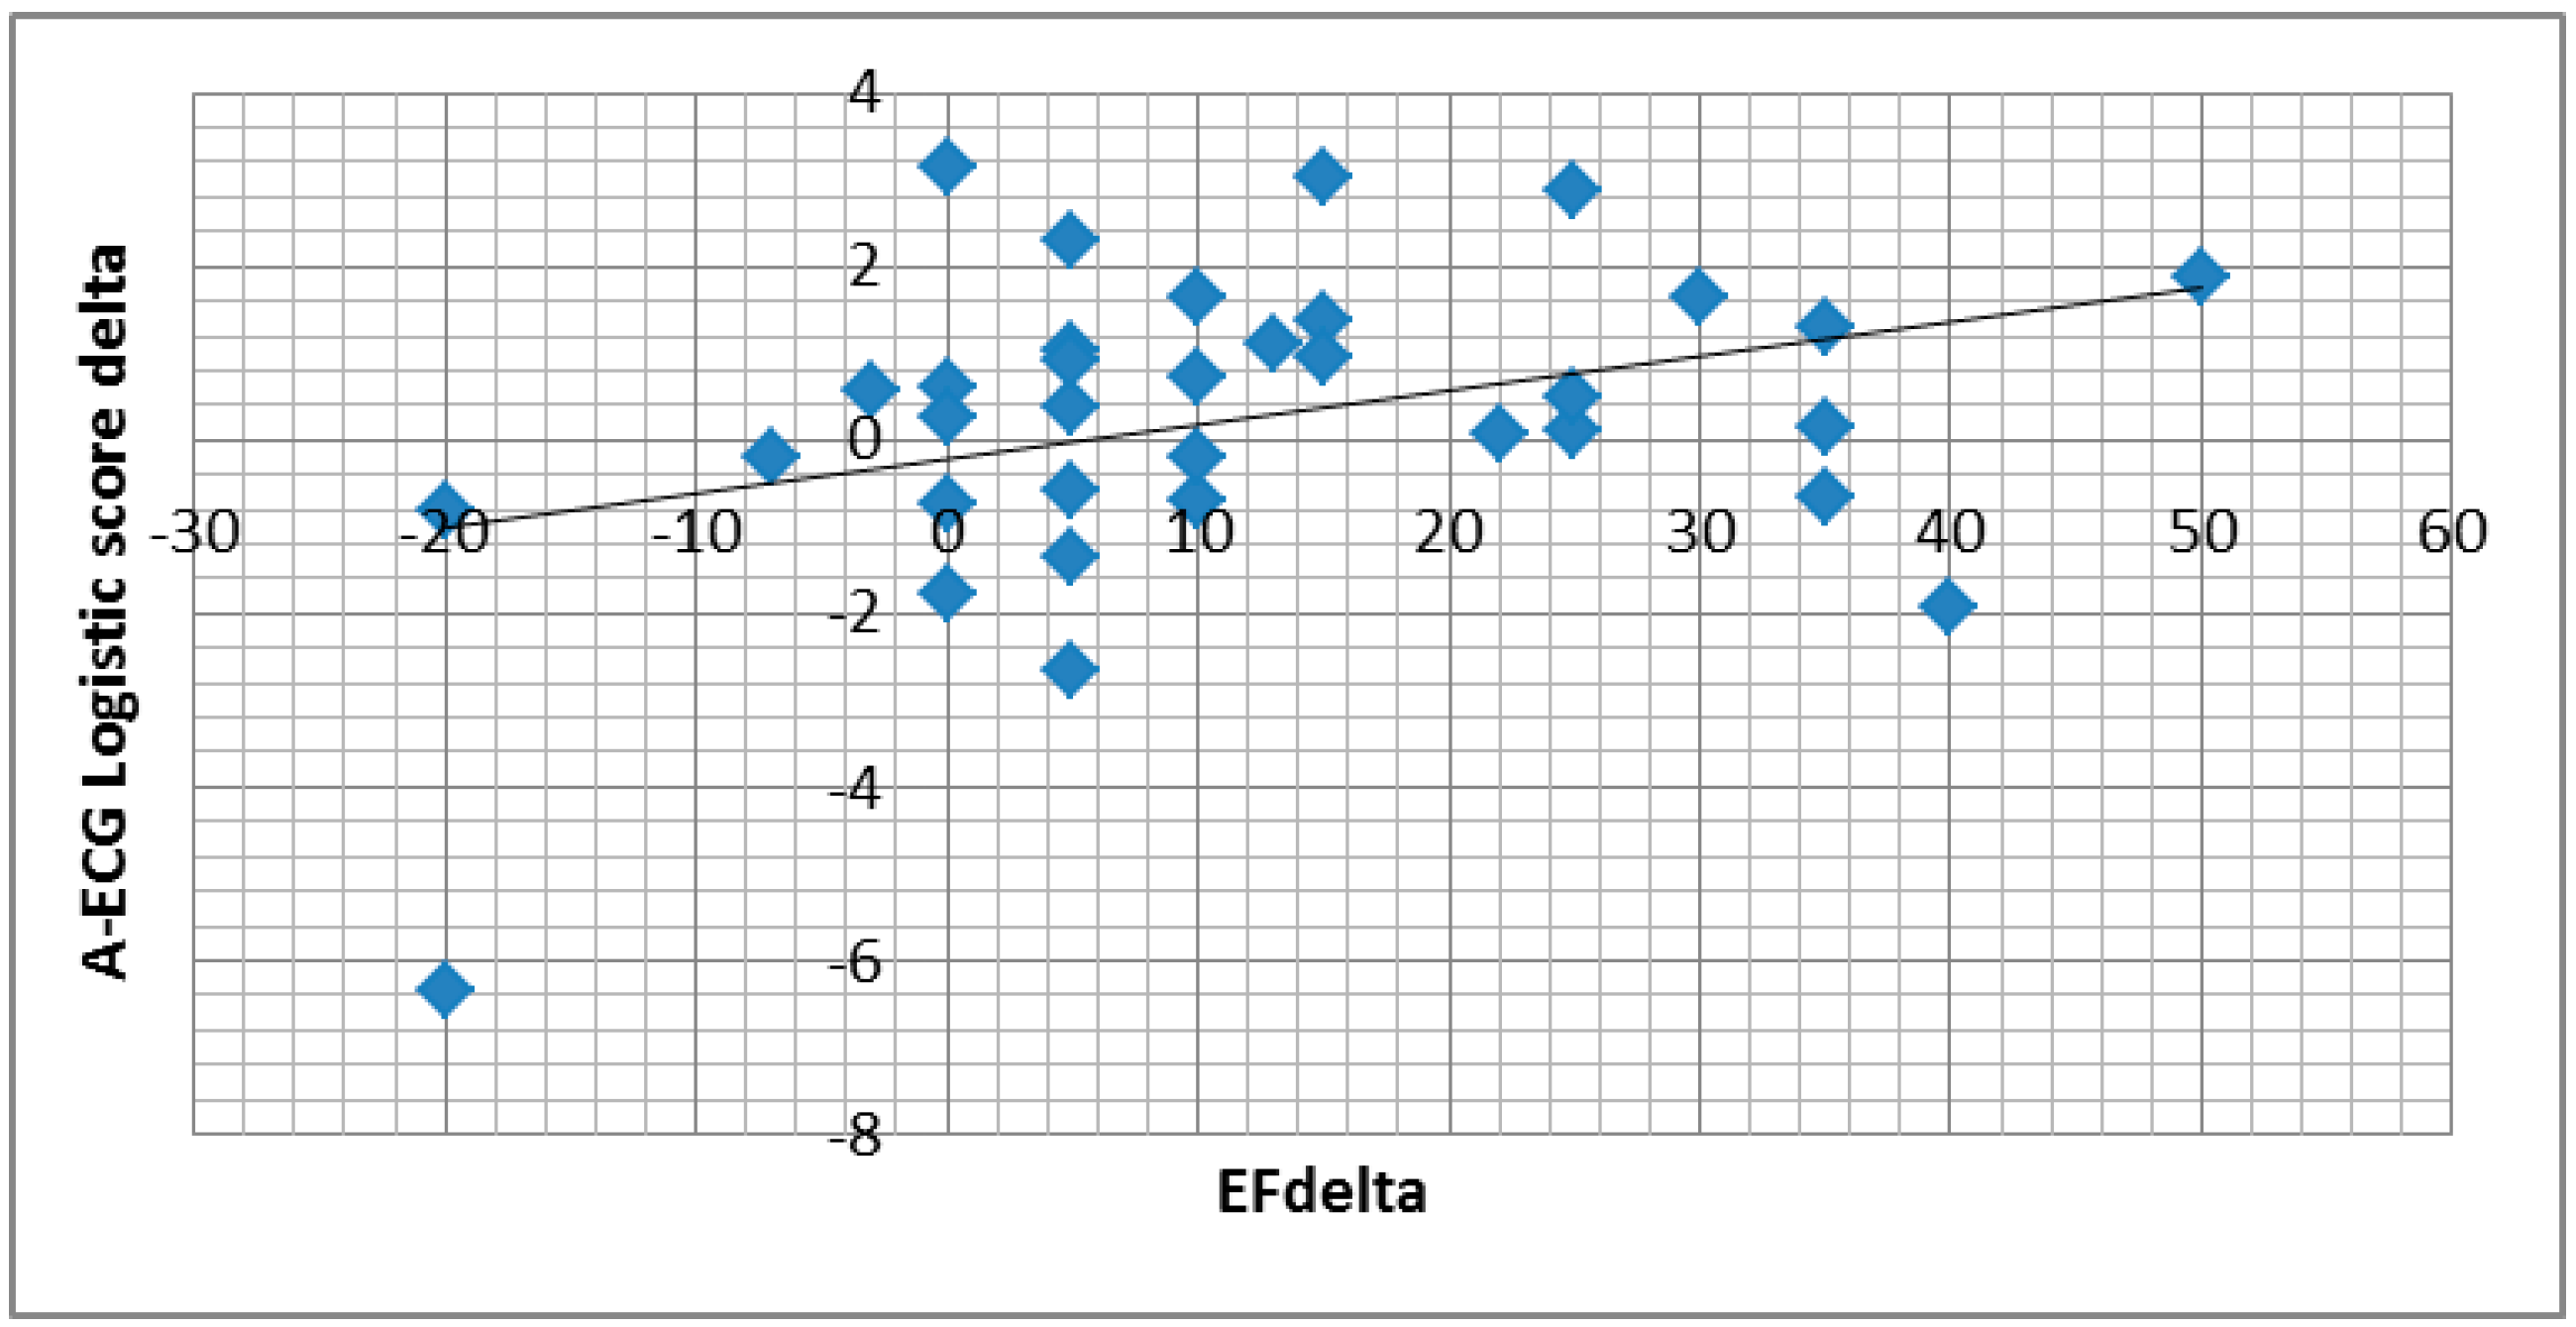
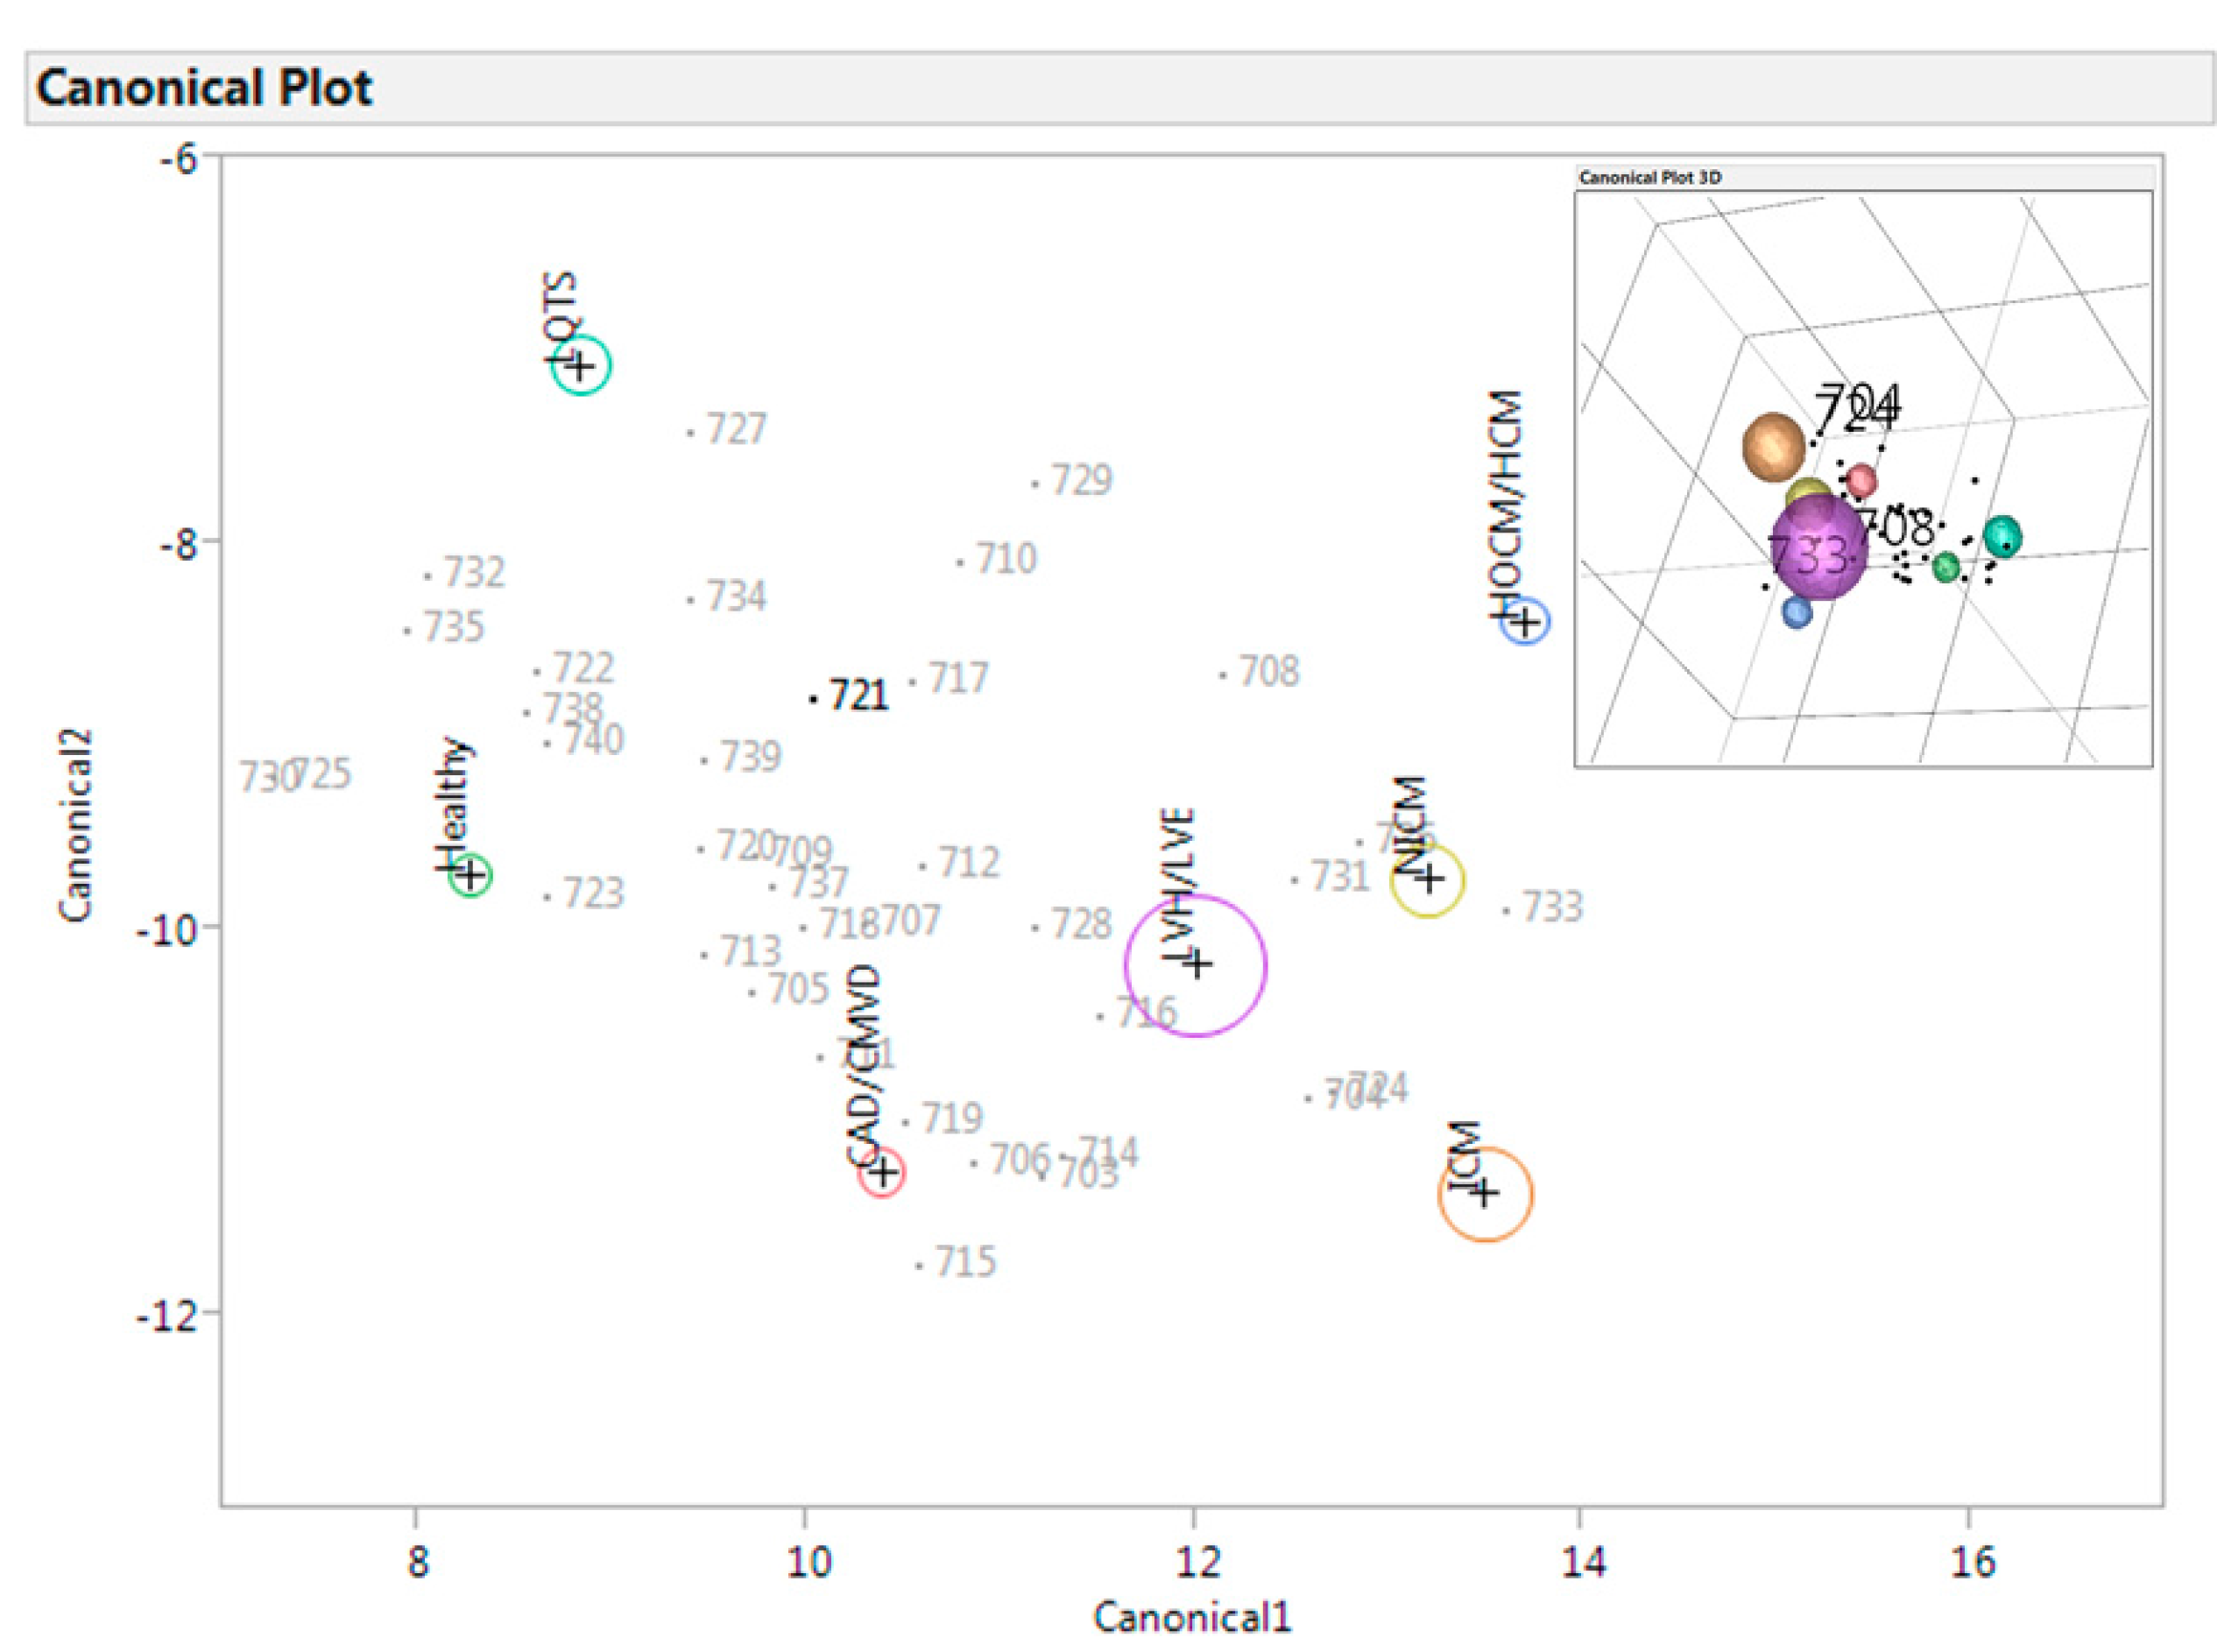
3.2. A-ECG


3.3. Human Reader Sub-Study
| Multiple Diagnoses | Cardiologists | General Practitioners |
|---|---|---|
| Sensitivity | 25% | 15% |
| Specificity | 71% | 42% |
| Binary Diagnosis (Normal/Abnormal) | Cardiologists | General Practitioners |
| Sensitivity | 90% | 85% |
| Specificity | 63% | 58% |
3.4. Controls

4. Discussion
5. Conclusions
Limitations
Acknowledgments
Author Contributions
Conflicts of Interest
References
- Goudie, B.M.; Jarvis, R.I.; Donnan, P.T.; Sullivan, F.M.; Pringle, S.D.; Jeyaseelan, S.; Struthers, A.D. Screening for left ventricular systolic dysfunction using GP-reported ECGs. Br. J. Gen. Pract. 2007, 57, 191–195. [Google Scholar] [PubMed]
- Kardys, I.; Kors, J.A.; van der Meer, I.M.; Hofman, A.; van der Kuip, D.A.; Witteman, J.C. Spatial QRS-T angle predicts cardiac death in a general population. Eur. Heart J. 2003, 24, 1357–1364. [Google Scholar] [CrossRef] [PubMed]
- Fayn, J.; Rubel, P.; Pahlm, O.; Wagner, G.S. Improvement of the detection of myocardial ischemia thanks to information technologies. Int. J. cardiol. 2007, 120, 172–180. [Google Scholar] [CrossRef] [PubMed]
- Rautaharju, P.M.; Kooperberg, C.; Larson, J.C.; LaCroix, A. Electrocardiographic predictors of incident congestive heart failure and all-cause mortality in postmenopausal women, the Women’s Health Initiative. Circulation 2006, 113, 481–489. [Google Scholar] [CrossRef] [PubMed]
- Yamazaki, T.; Froelicher, V.F.; Myers, J.; Chun, S.; Wang, P. Spatial QRS-T angle predicts cardiac death in a clinical population. Heart rhythm 2005, 2, 73–78. [Google Scholar] [CrossRef] [PubMed]
- Okin, P.M.; Malik, M.; Hnatkova, K.; Lee, E.T.; Galloway, J.M.; Best, L.G.; Howard, B.V.; Devereux, R.B. Repolarization abnormality for prediction of all-cause and cardiovascular mortality in American Indians: the Strong Heart Study. J. Cardiovasc. Electrophysiol. 2005, 16, 945–951. [Google Scholar] [CrossRef] [PubMed]
- Zabel, M.; Malik, M.; Hnatkova, K.; Papademetriou, V.; Pittaras, A.; Fletcher, R.D.; Franz, M.R. Analysis of T-wave morphology from the 12-lead electrocardiogram for prediction of long-term prognosis in male US veterans. Circulation 2002, 105, 1066–1070. [Google Scholar] [CrossRef] [PubMed]
- Batdorf, B.H.; Feiveson, A.H.; Schlegel, T.T. The effect of signal averaging on the reproducibility and reliability of measures of T-wave morphology. J. Electrocardiol. 2006, 39, 266–270. [Google Scholar] [CrossRef] [PubMed]
- Schlegel, T.T.; Kulecz, W.B.; DePalma, J.L.; Feiveson, A.H.; Wilson, J.S.; Rahman, M.A.; Bungo, M.W. Real-time 12-lead high-frequency QRS electrocardiography for enhanced detection of myocardial ischemia and coronary artery disease. Mayo. Clin. Proc. 2004, 79, 339–350. [Google Scholar] [CrossRef] [PubMed]
- Berger, R.D.; Kasper, E.K.; Baughman, K.L.; Marban, E.; Calkins, H.; Tomaselli, G.F. Beat-to-beat QT interval variability: Novel evidence for repolarization lability in ischemic and nonischemic dilated cardiomyopathy. Circulation 1997, 96, 1557–1565. [Google Scholar] [CrossRef] [PubMed]
- Piccirillo, G.; Magri, D.; Matera, S.; Magnanti, M.; Torrini, A.; Pasquazzi, E.; Schifano, E.; Velitti, S.; Marigliano, V.; Quaglione, R.; et al. QT variability strongly predicts sudden cardiac death in asymptomatic subjects with mild or moderate left ventricular systolic dysfunction: A prospective study. Eur. Heart. J. 2007, 28, 1344–1350. [Google Scholar] [CrossRef] [PubMed]
- Vrtovec, B.; Sinkovec, M.; Starc, V.; Radovancevic, B.; Schlegel, T.T. Coronary artery disease alters ventricular repolarization dynamics in type 2 diabetes. Pacing. Clin. Electrophysiol. 2005, 28 (Suppl 1), S178–S181. [Google Scholar] [CrossRef] [PubMed]
- Starc, V.; Schlegel, T.T. Real-time multichannel system for beat-to-beat QT interval variability. J. Electrocardiol. 2006, 39, 358–367. [Google Scholar] [CrossRef] [PubMed]
- Marek, M.J.; Thomas, B.A.; Camm, J.; Kleiger, R.E.; Malliani, A.; Moss, A.J.; Schwartz, P.J. Heart rate variability. Standards of measurement, physiological interpretation, and clinical use. Task Force of the European Society of Cardiology and the North American Society of Pacing and Electrophysiology. Eur. Heart J. 1996, 17, 354–381. [Google Scholar] [CrossRef] [PubMed]
- Goldberger, A.L.; Amaral, L.A.; Hausdorff, J.M.; Ivanov, P.; Peng, C.K.; Stanley, H.E. Fractal dynamics in physiology: Alterations with disease and aging. Proc. Natl. Acad. Sci. USA 2002, 99 (Suppl 1), 2466–2472. [Google Scholar] [CrossRef] [PubMed]
- Jain, A.K.; Duin, R.P.W.; Jianchang, M. Statistical pattern recognition: A review. IEEE Trans. Pattern Anal. Mach. Intell. 2000, 22, 4–37. [Google Scholar] [CrossRef]
- Schlegel, T.T.; Kulecz, W.B.; Feiveson, A.H.; Greco, E.C.; DePalma, J.L.; Starc, V.; Vrtovec, B.; Rahman, M.A.; Bungo, M.W.; Hayat, M.J.; et al. Accuracy of advanced versus strictly conventional 12-lead ECG for detection and screening of coronary artery disease, left ventricular hypertrophy and left ventricular systolic dysfunction. BMC Cardiovasc. Disord. 2010, 10. [Google Scholar] [CrossRef]
- Committee, N.E.A. Streamlined ethical guidelines for health and disability research. http://neac.health.govt.nz/streamlined-ethical-guidelines-health-and-disability-research (accessed on 12 May 2015).
- Kors, J.A.; van Herpen, G.; Sittig, A.C.; van Bemmel, J.H. Reconstruction of the Frank vectorcardiogram from standard electrocardiographic leads: diagnostic comparison of different methods. Eur. Heart J. 1990, 11, 1083–1092. [Google Scholar] [PubMed]
- Gladding, P.; Cave, A.; Zareian, M.; Smith, K.; Hussan, J.; Hunter, P.; Erogbogbo, F.; Aguilar, Z.; Martin, D.; Chan, E.; et al. Open Access Integrated Therapeutic and Diagnostic Platforms for Personalized Cardiovascular Medicine. J. Pers. Med. 2013, 3, 203–237. [Google Scholar] [CrossRef] [PubMed]
- Palmeri, S.T.; Harrison, D.G.; Cobb, F.R.; Morris, K.G.; Harrell, F.E.; Ideker, R.E.; Selvester, R.H.; Wagner, G.S. A QRS scoring system for assessing left ventricular function after myocardial infarction. N. Engl. J. Med. 1982, 306, 4–9. [Google Scholar] [CrossRef] [PubMed]
- Gottwik, M.G.; Parisi, A.F.; Askenazi, J.; McCaughan, D. Computerized orthogonal electrocardiogram: relation of QRS forces to left ventricular ejection fraction. Am. J. Cardiol. 1978, 41, 9–13. [Google Scholar] [CrossRef] [PubMed]
- Davie, A.P.; Francis, C.M.; Love, M.P.; Caruana, L.; Starkey, I.R.; Shaw, T.R.; Sutherland, G.R.; McMurray, J.J. Value of the electrocardiogram in identifying heart failure due to left ventricular systolic dysfunction. BMJ 1996, 312. [Google Scholar] [CrossRef]
- Velavan, P.; Khan, N.K.; Rigby, A.S.; Goode, K.; Komajda, M.; Follath, F.; Swedberg, K.; Madeira, H.; Clark, A.L.; Cleland, J.G. Relation between severity of left ventricular systolic dysfunction and repolarisation abnormalities on the surface ECG: A report from the Euro heart failure survey. Heart 2006, 92, 255–256. [Google Scholar] [CrossRef] [PubMed]
- Fioretti, P.; Brower, R.W.; Lazzeroni, E.; Simoons, M.L.; Wijns, W.; Reiber, J.H.; Bos, R.J.; Hugenholtz, P.G. Limitations of a QRS scoring system to assess left ventricular function and prognosis at hospital discharge after myocardial infarction. Br. Heart J. 1985, 53, 248–252. [Google Scholar] [CrossRef] [PubMed]
- Young, S.G.; Abouantoun, S.; Savvides, M.; Madsen, E.B.; Froelicher, V. Limitations of electrocardiographic scoring systems for estimation of left ventricular function. J. Am. Coll. Cardiol. 1983, 1, 1479–1488. [Google Scholar] [CrossRef] [PubMed]
- Bacharova, L. Electrocardiography-left ventricular mass discrepancies in left ventricular hypertrophy: Electrocardiography imperfection or beyond perfection? J. Electrocardiol. 2009, 42, 593–596. [Google Scholar] [CrossRef] [PubMed]
- Borleffs, C.J.W.; Scherptong, R.W.C.; Man, S.C.; van Welsenes, G.H.; Bax, J.J.; van Erven, L.; Swenne, C.A.; Schalij, M.J. Predicting Ventricular Arrhythmias in Patients With Ischemic Heart Disease: Clinical Application of the ECG-Derived QRS-T Angle. Circulation 2009, 2, 548–554. [Google Scholar] [PubMed]
- Madias, J.E.; Song, J.; White, C.M.; Kalus, J.S.; Kluger, J. Response of the ECG to short-term diuresis in patients with heart failure. Ann. Noninvasive Electrocardiol. 2005, 10, 288–296. [Google Scholar] [CrossRef] [PubMed]
- Levy, D.; Salomon, M.; D'Agostino, R.B.; Belanger, A.J.; Kannel, W.B. Prognostic implications of baseline electrocardiographic features and their serial changes in subjects with left ventricular hypertrophy. Circulation 1994, 90, 1786–1793. [Google Scholar] [CrossRef] [PubMed]
- Kitada, R.; Fukuda, S.; Watanabe, H.; Oe, H.; Abe, Y.; Yoshiyama, M.; Song, J.M.; Sitges, M.; Shiota, T.; Ito, H.; et al. Diagnostic accuracy and cost-effectiveness of a pocket-sized transthoracic echocardiographic imaging device. Clin. Cardiol. 2013, 36, 603–610. [Google Scholar] [PubMed]
© 2015 by the authors; licensee MDPI, Basel, Switzerland. This article is an open access article distributed under the terms and conditions of the Creative Commons Attribution license (http://creativecommons.org/licenses/by/4.0/).
Share and Cite
Johnson, K.; Neilson, S.; To, A.; Amir, N.; Cave, A.; Scott, T.; Orr, M.; Parata, M.; Day, V.; Gladding, P. Advanced Electrocardiography Identifies Left Ventricular Systolic Dysfunction in Non-Ischemic Cardiomyopathy and Tracks Serial Change over Time. J. Cardiovasc. Dev. Dis. 2015, 2, 93-107. https://doi.org/10.3390/jcdd2020093
Johnson K, Neilson S, To A, Amir N, Cave A, Scott T, Orr M, Parata M, Day V, Gladding P. Advanced Electrocardiography Identifies Left Ventricular Systolic Dysfunction in Non-Ischemic Cardiomyopathy and Tracks Serial Change over Time. Journal of Cardiovascular Development and Disease. 2015; 2(2):93-107. https://doi.org/10.3390/jcdd2020093
Chicago/Turabian StyleJohnson, Kerryanne, Stacey Neilson, Andrew To, Nezar Amir, Andrew Cave, Tony Scott, Martin Orr, Mia Parata, Victoria Day, and Patrick Gladding. 2015. "Advanced Electrocardiography Identifies Left Ventricular Systolic Dysfunction in Non-Ischemic Cardiomyopathy and Tracks Serial Change over Time" Journal of Cardiovascular Development and Disease 2, no. 2: 93-107. https://doi.org/10.3390/jcdd2020093