
The Influence of the Precursor’s Nature and Drying Conditions on the Structure, Morphology, and Thermal Properties of TiO2 Aerogels

 ,
,
Abstract
:
1. Introduction
2. Results and Discussion
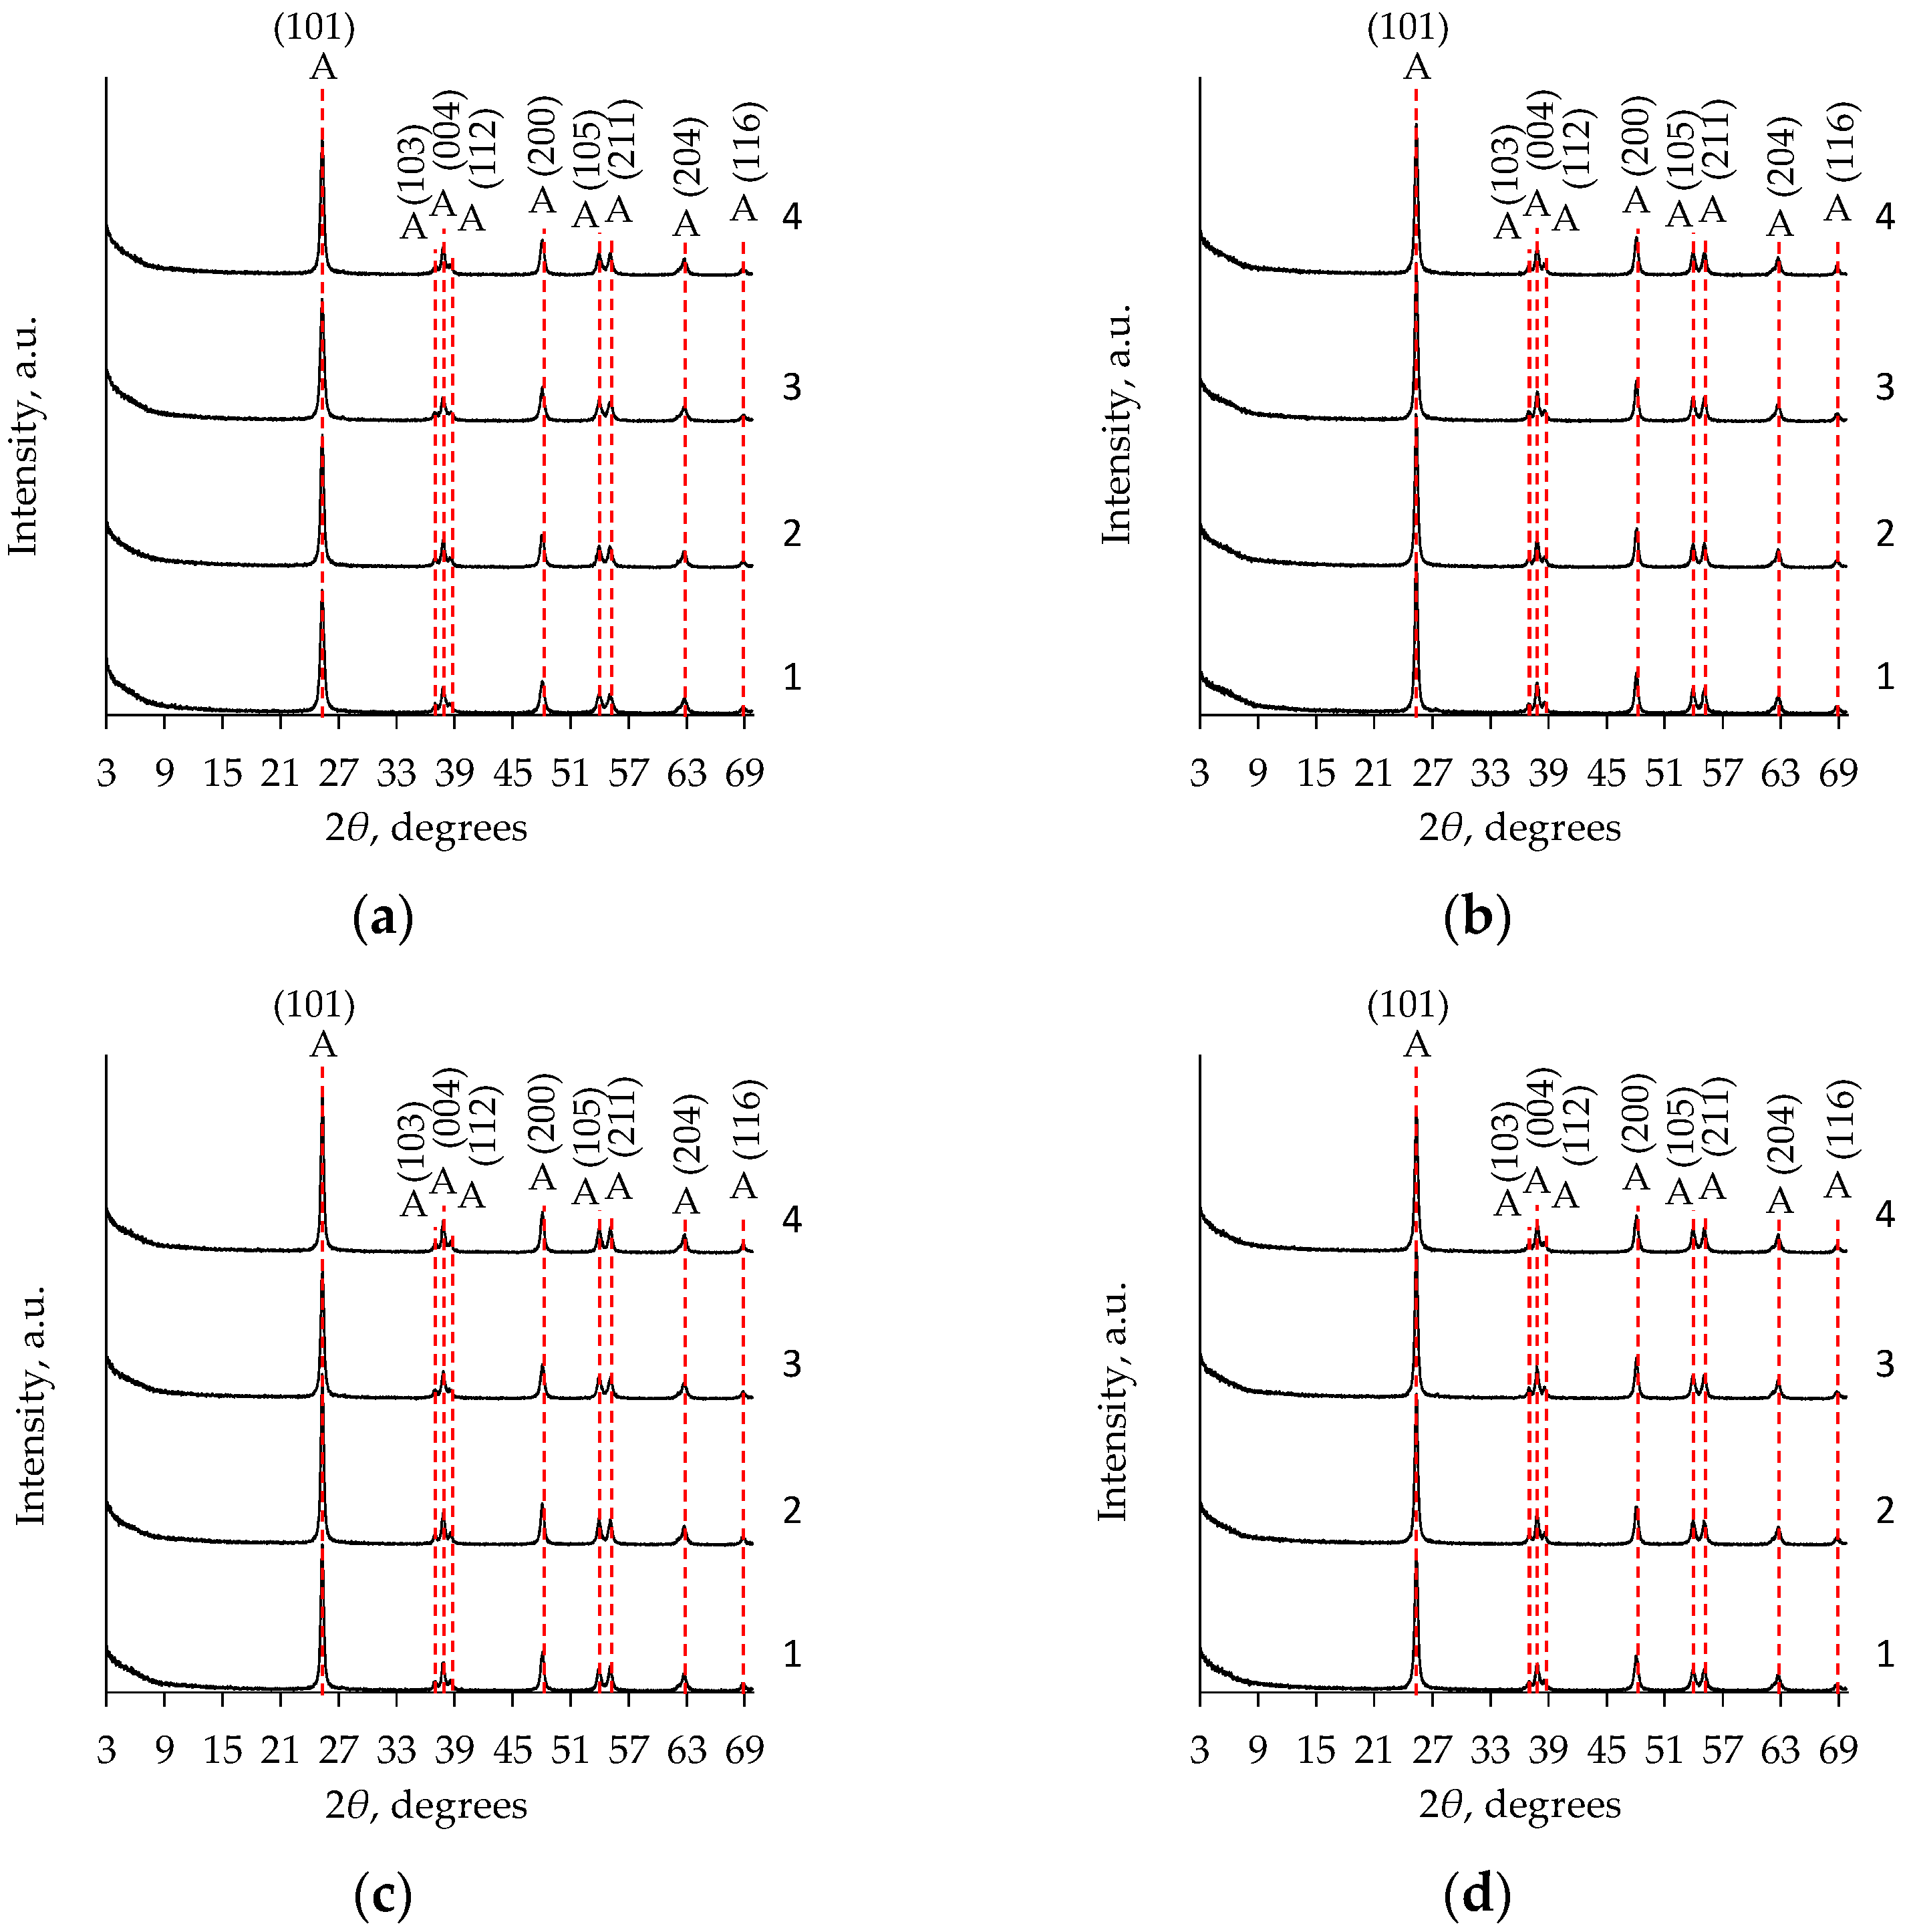
2.1. XRD Analysis
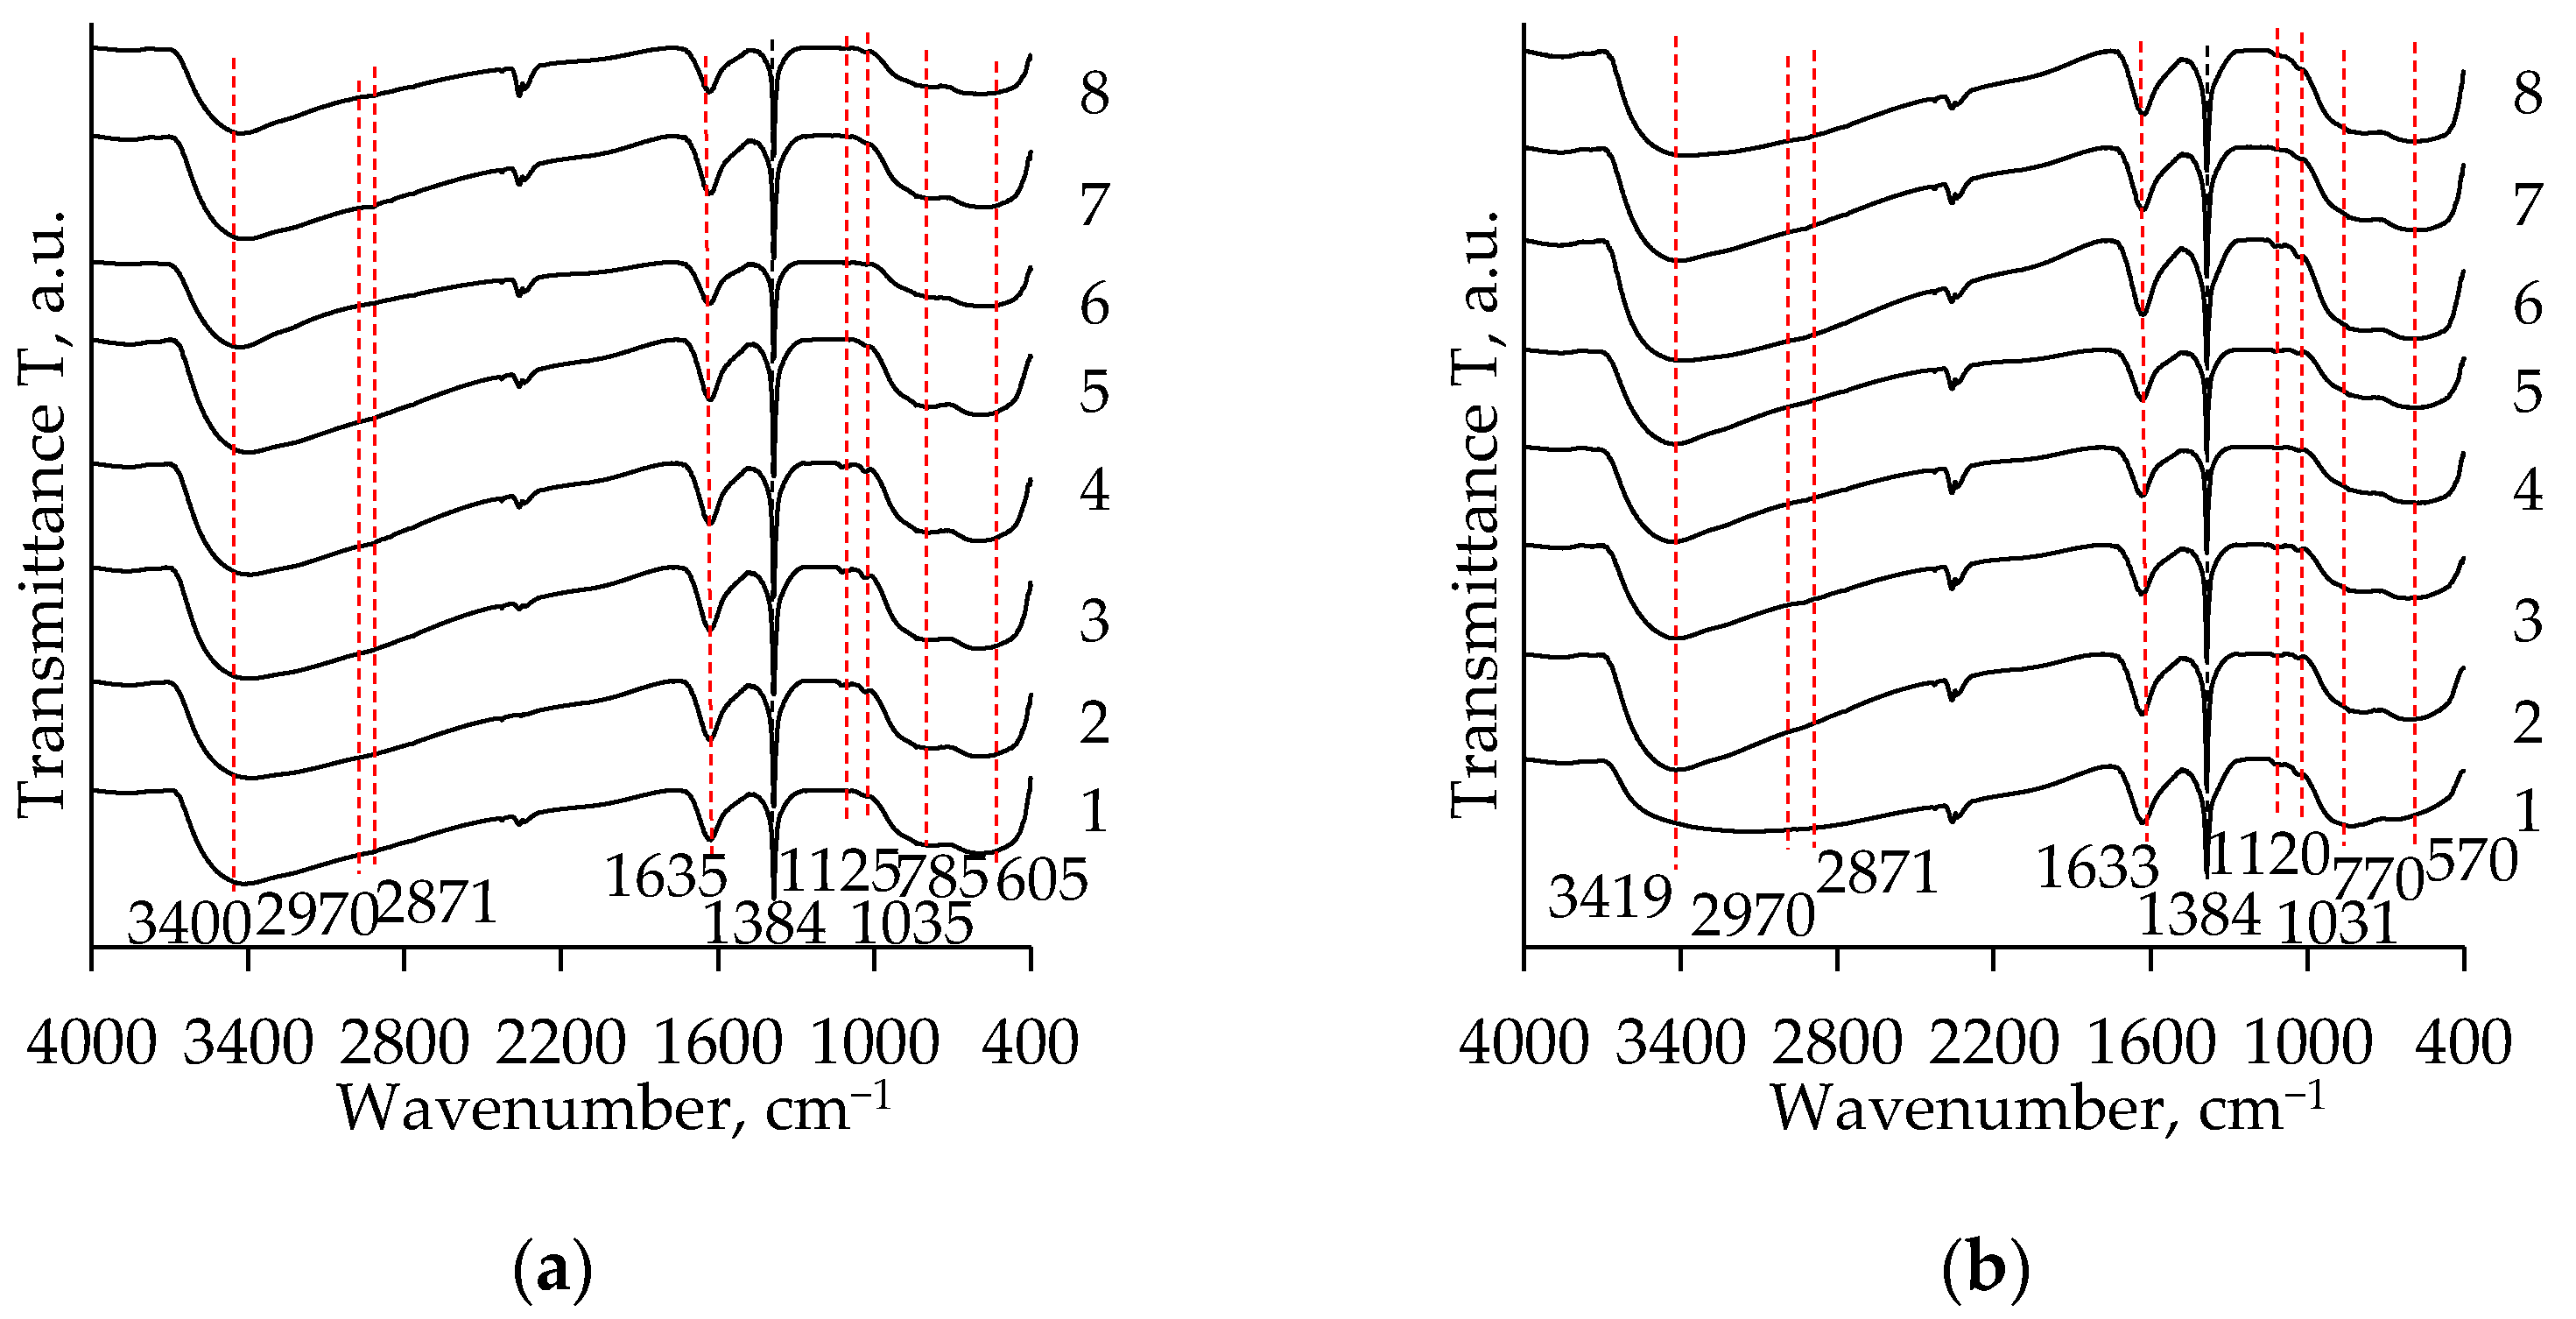
2.2. FT-IR Analysis
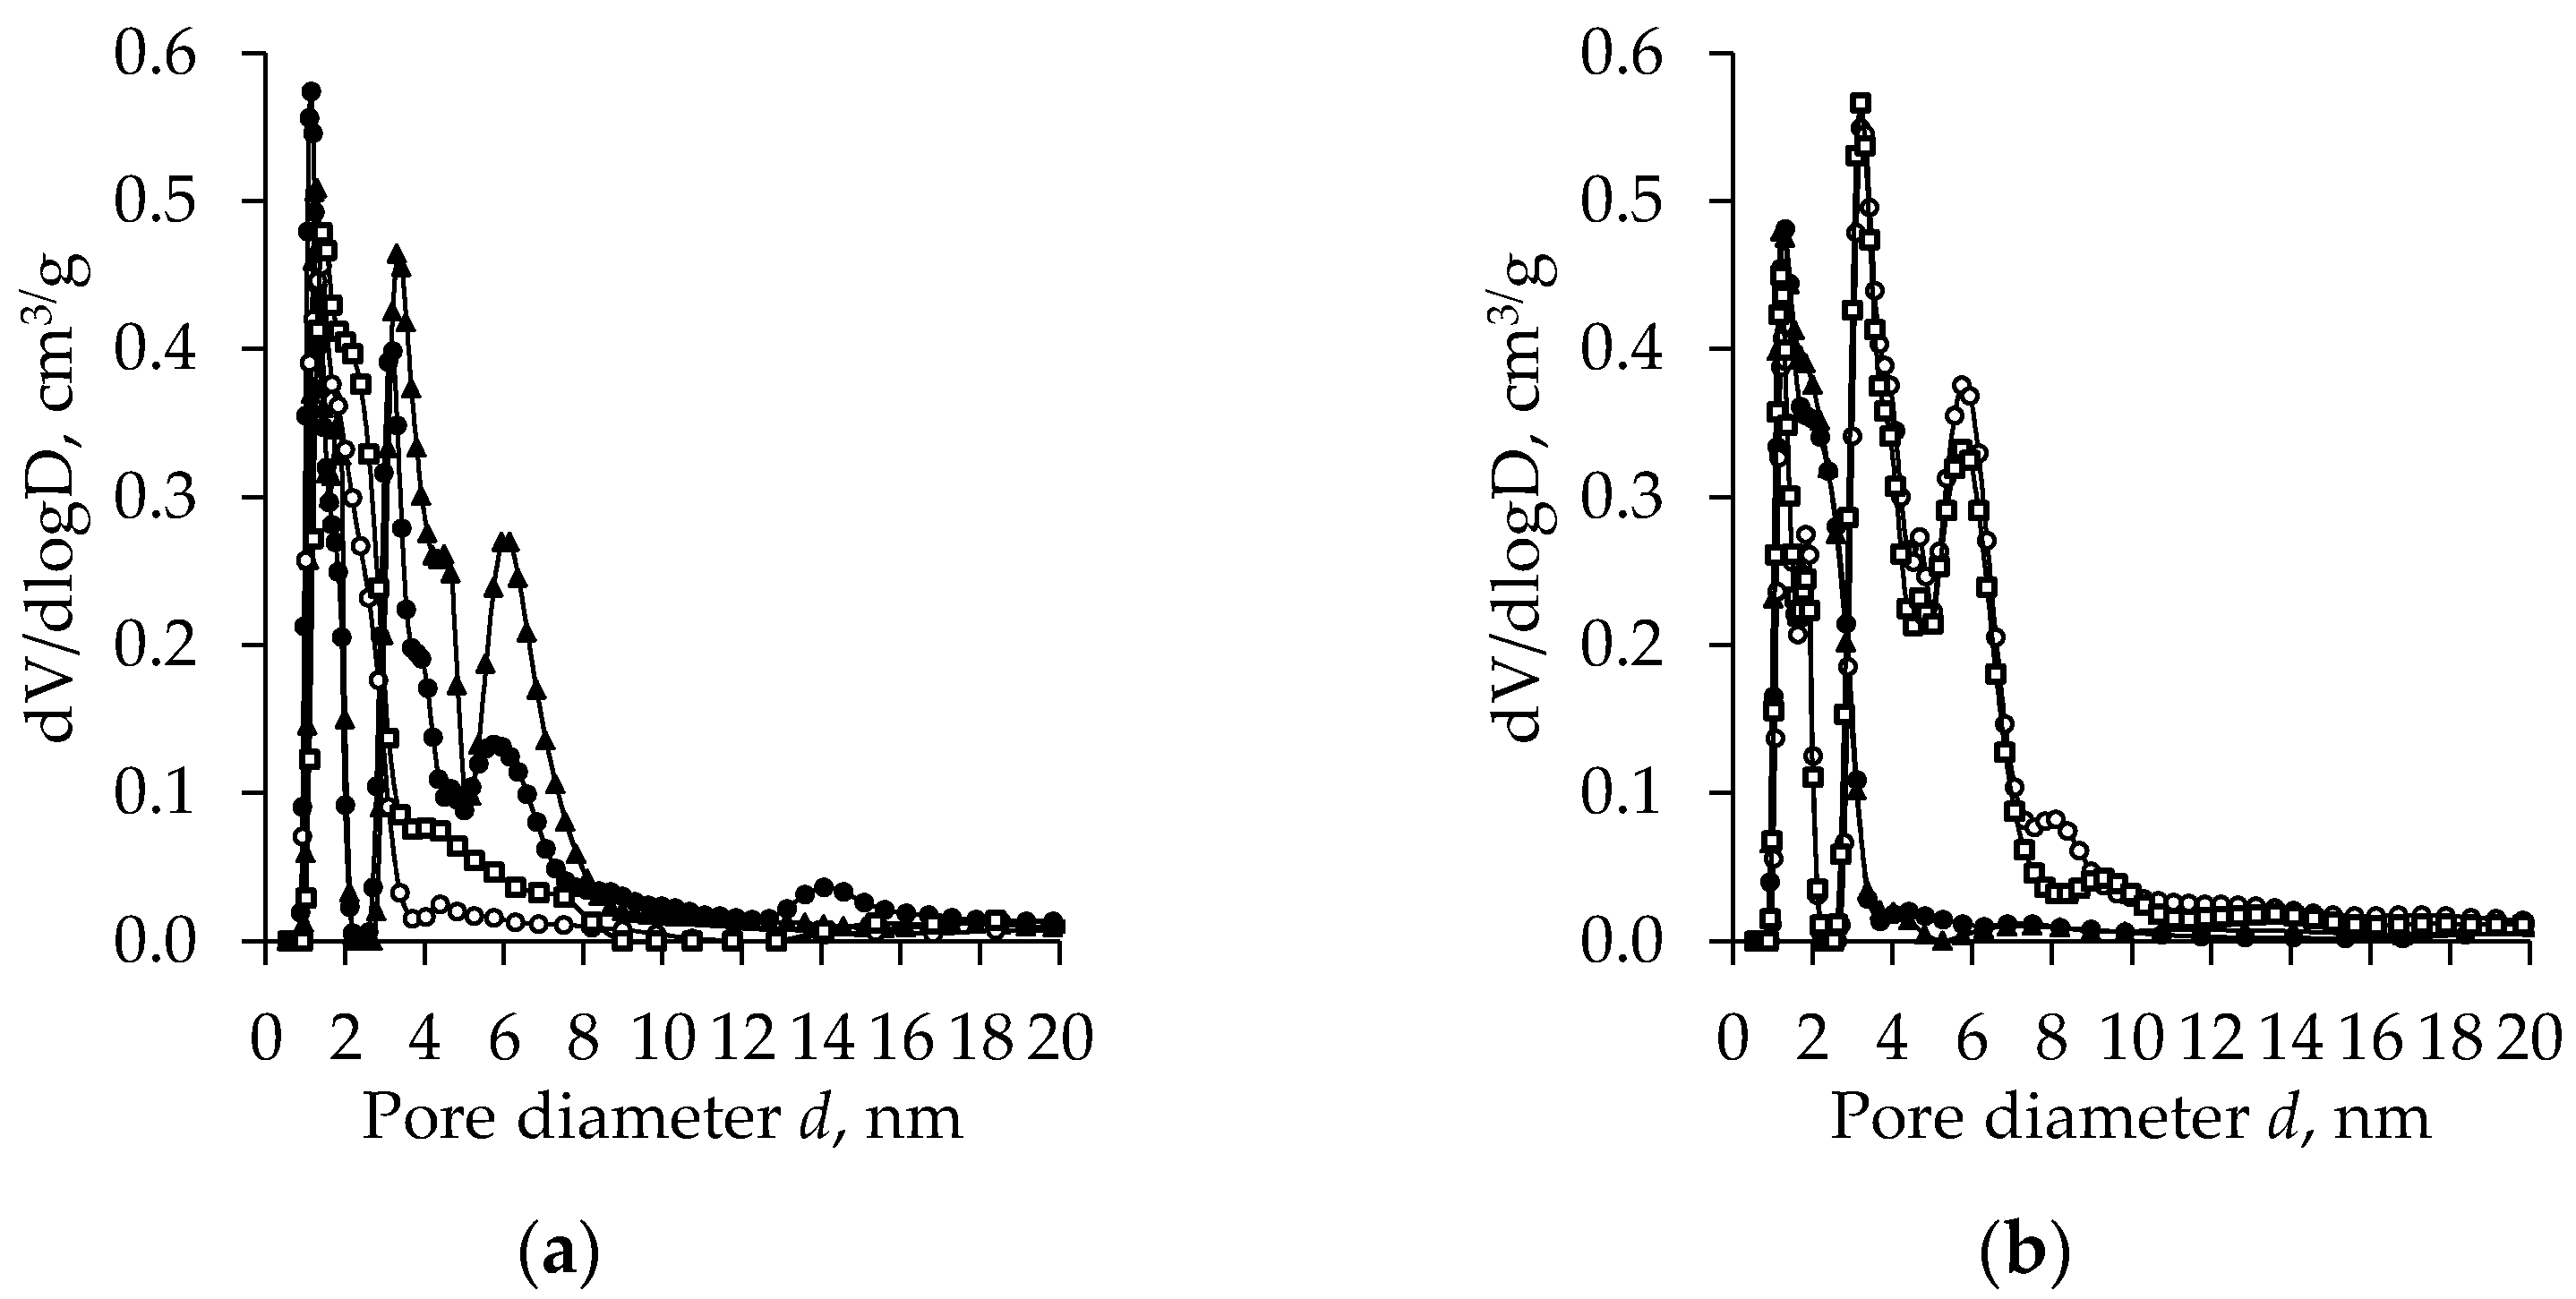
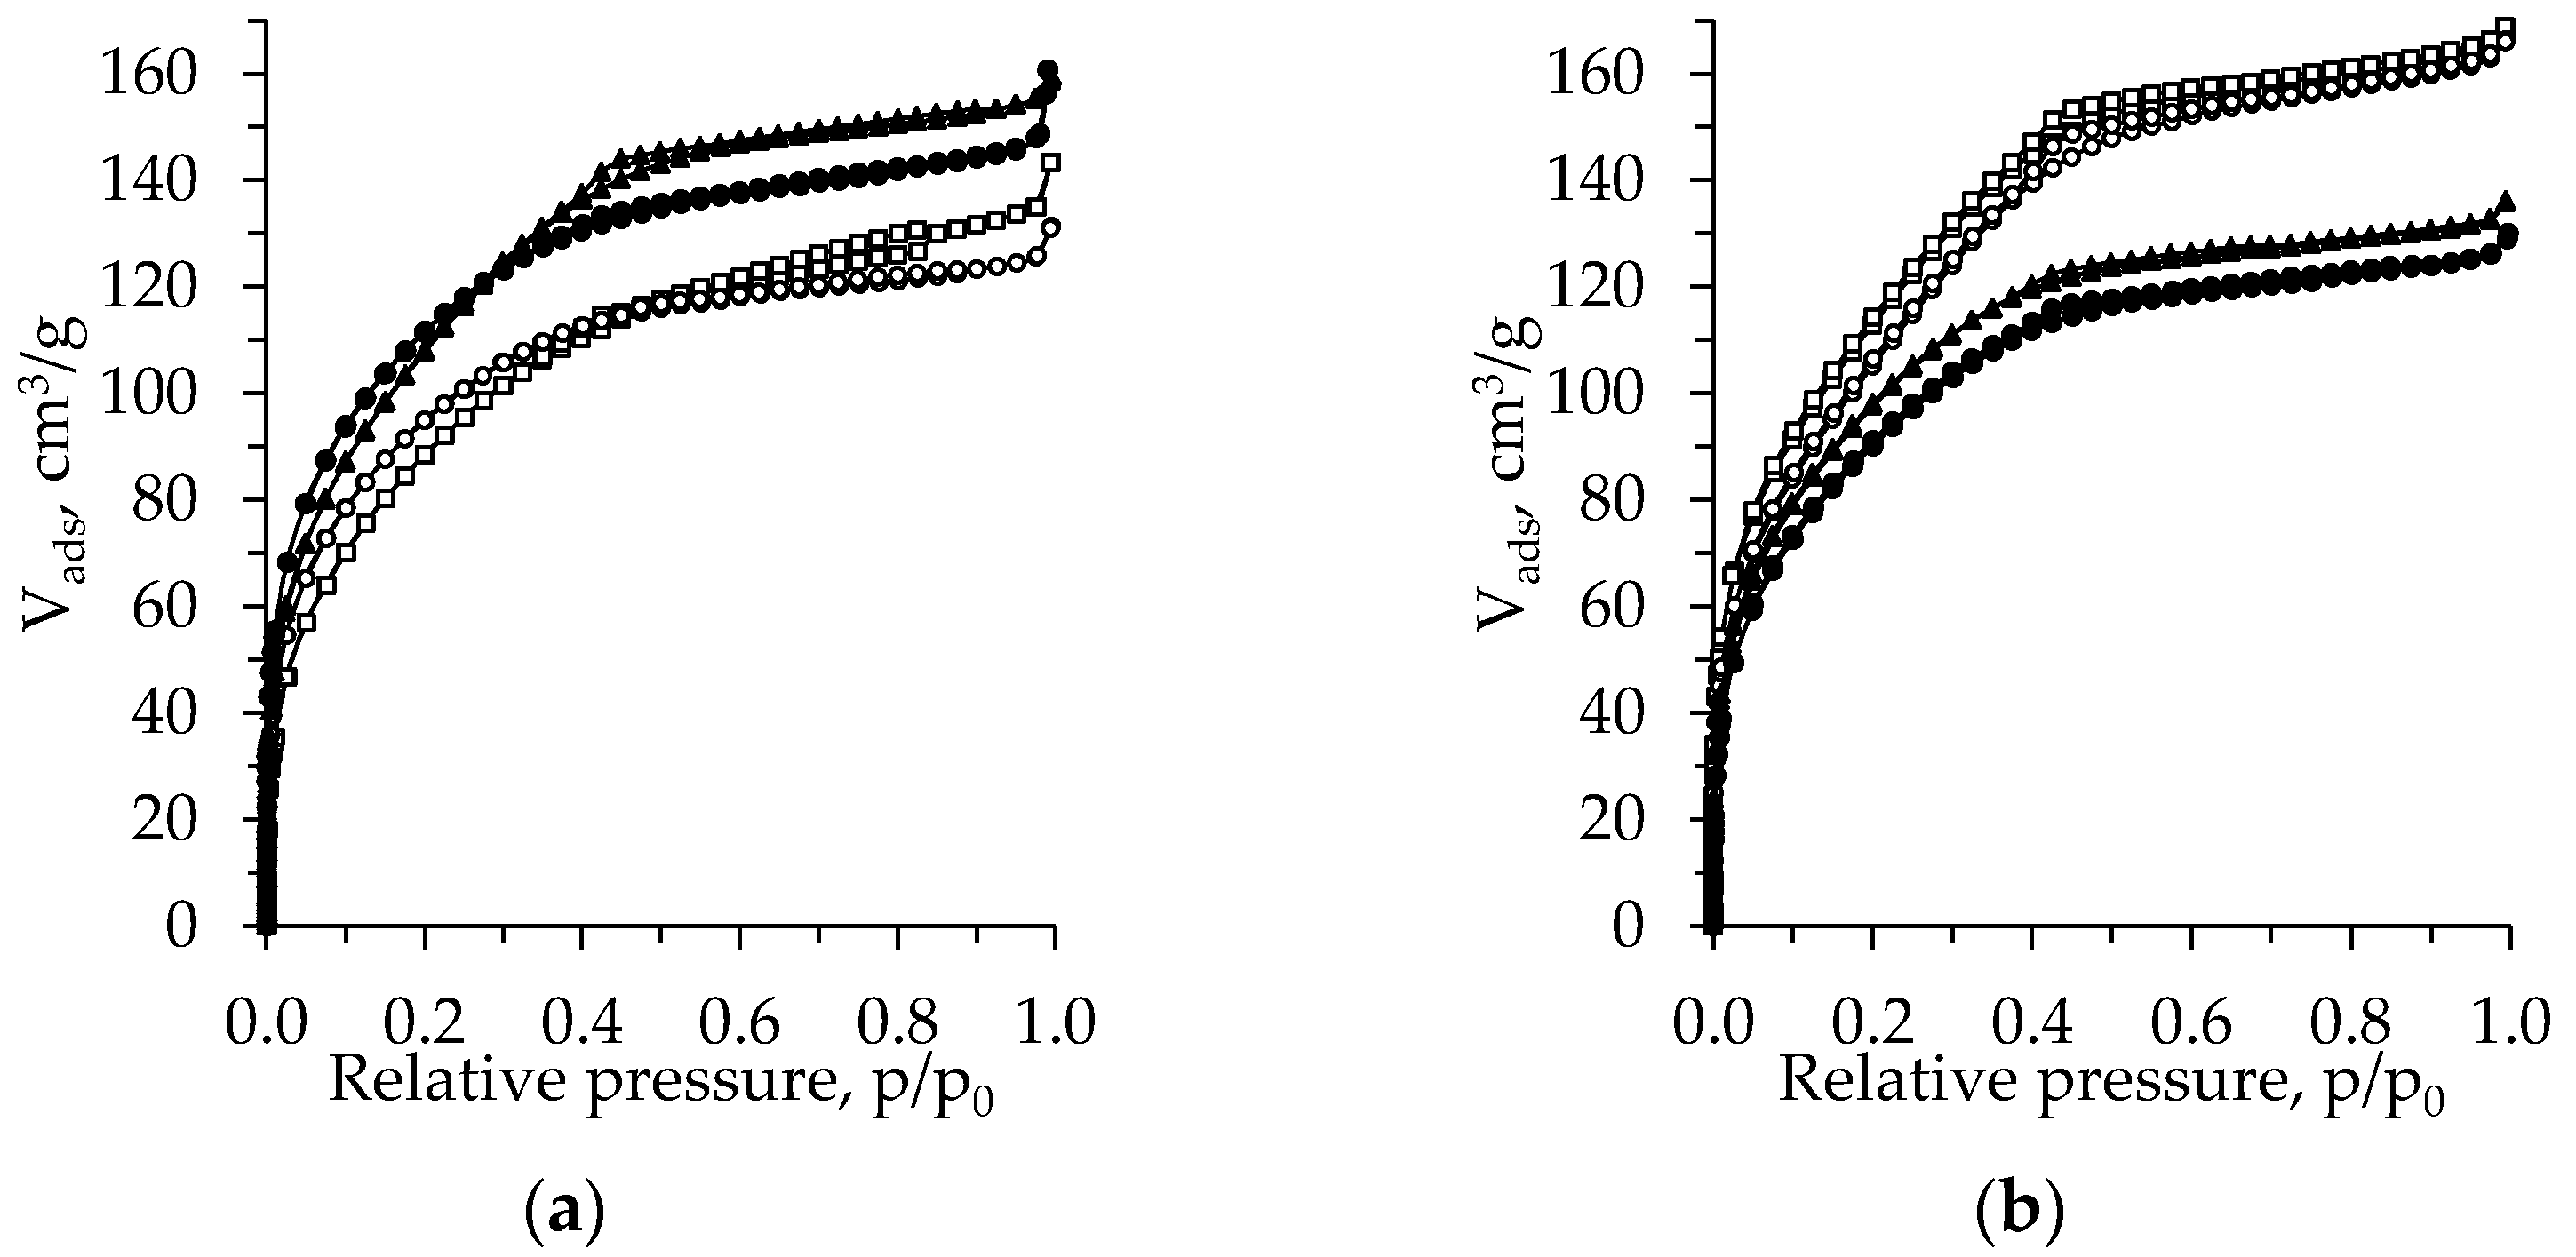
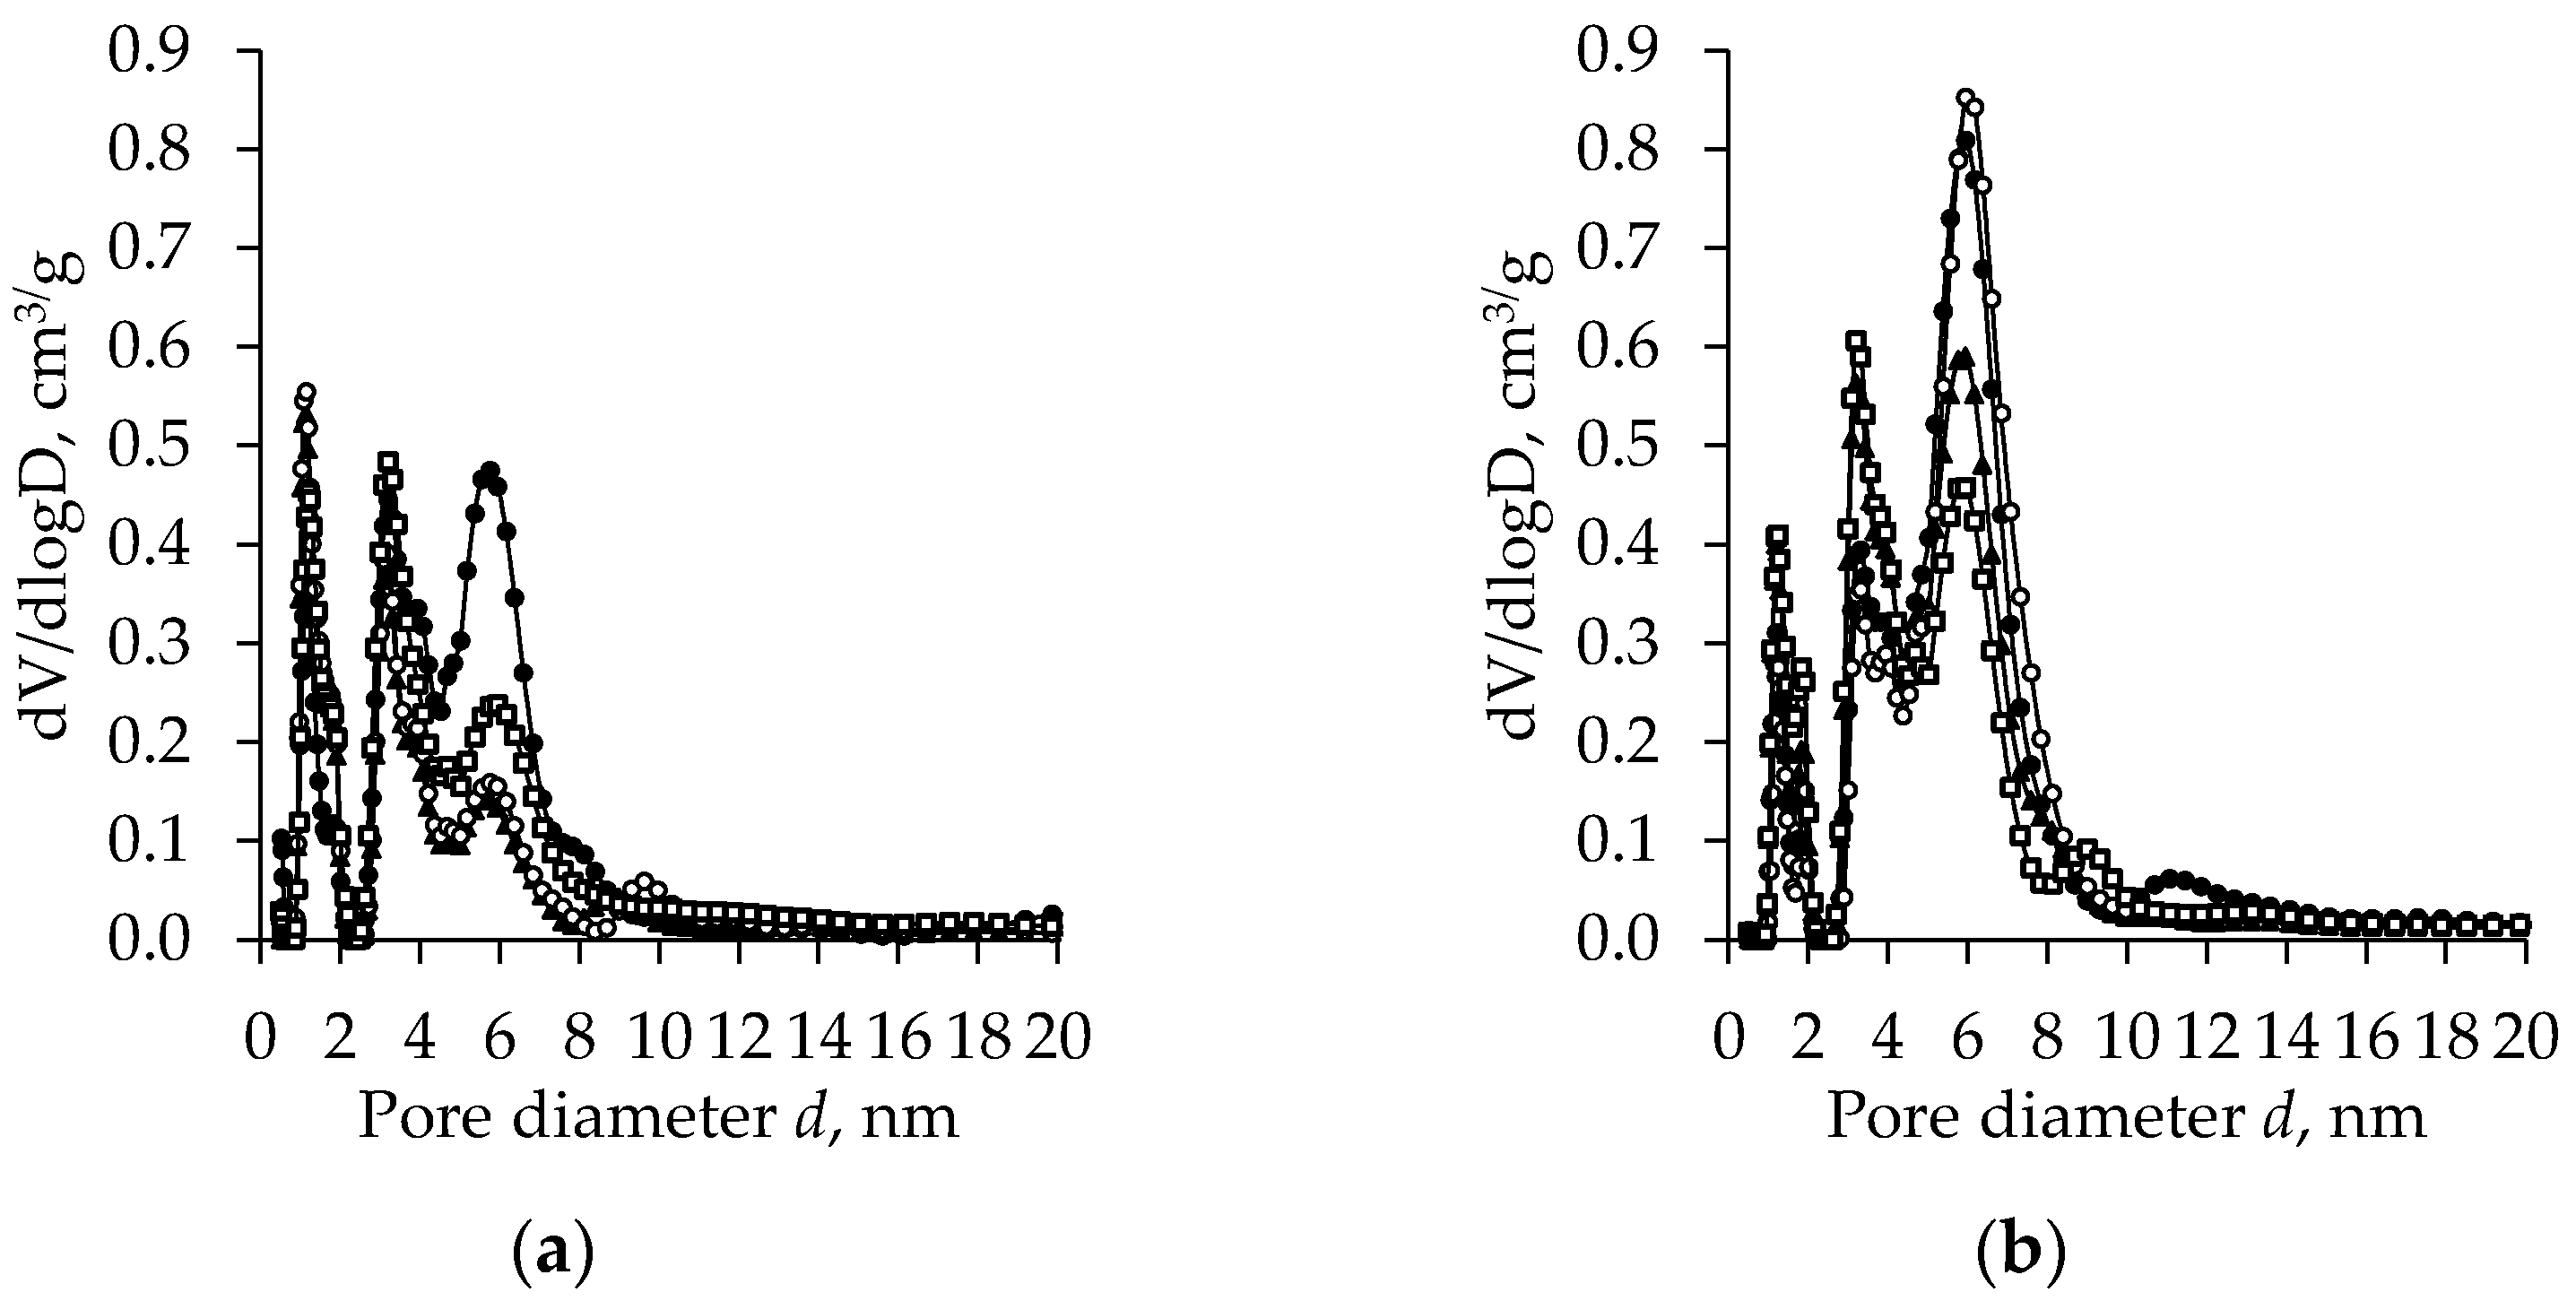
2.3. BET Analysis
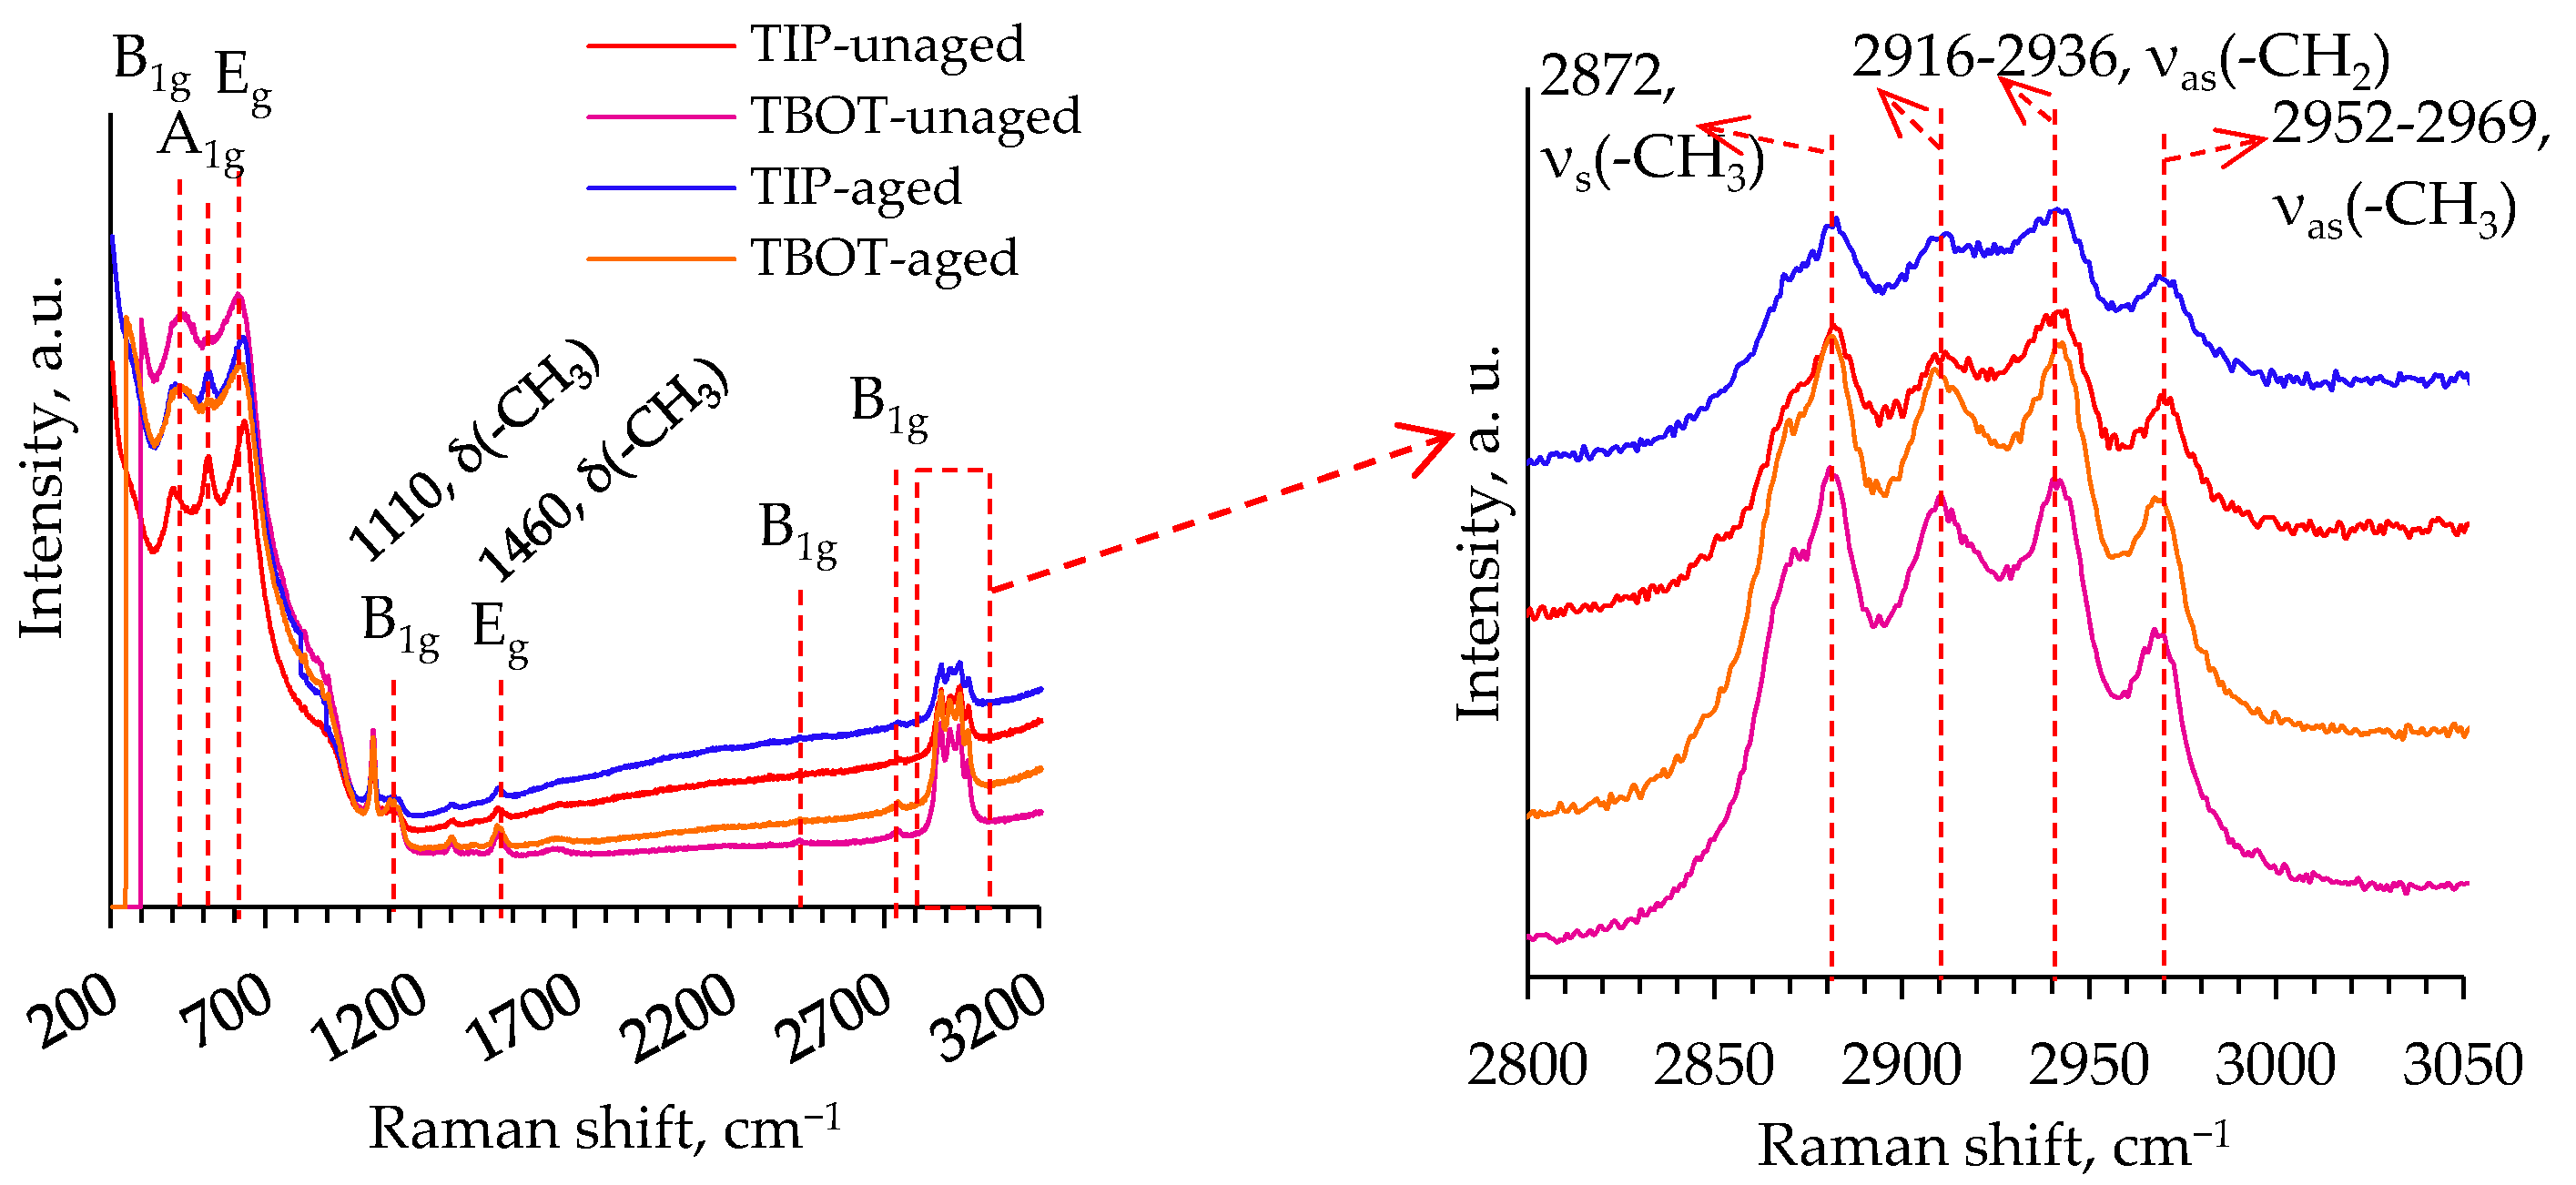
2.4. Raman Analysis
2.5. Thermal Analysis
2.6. Morphology of TiO2 Aerogels
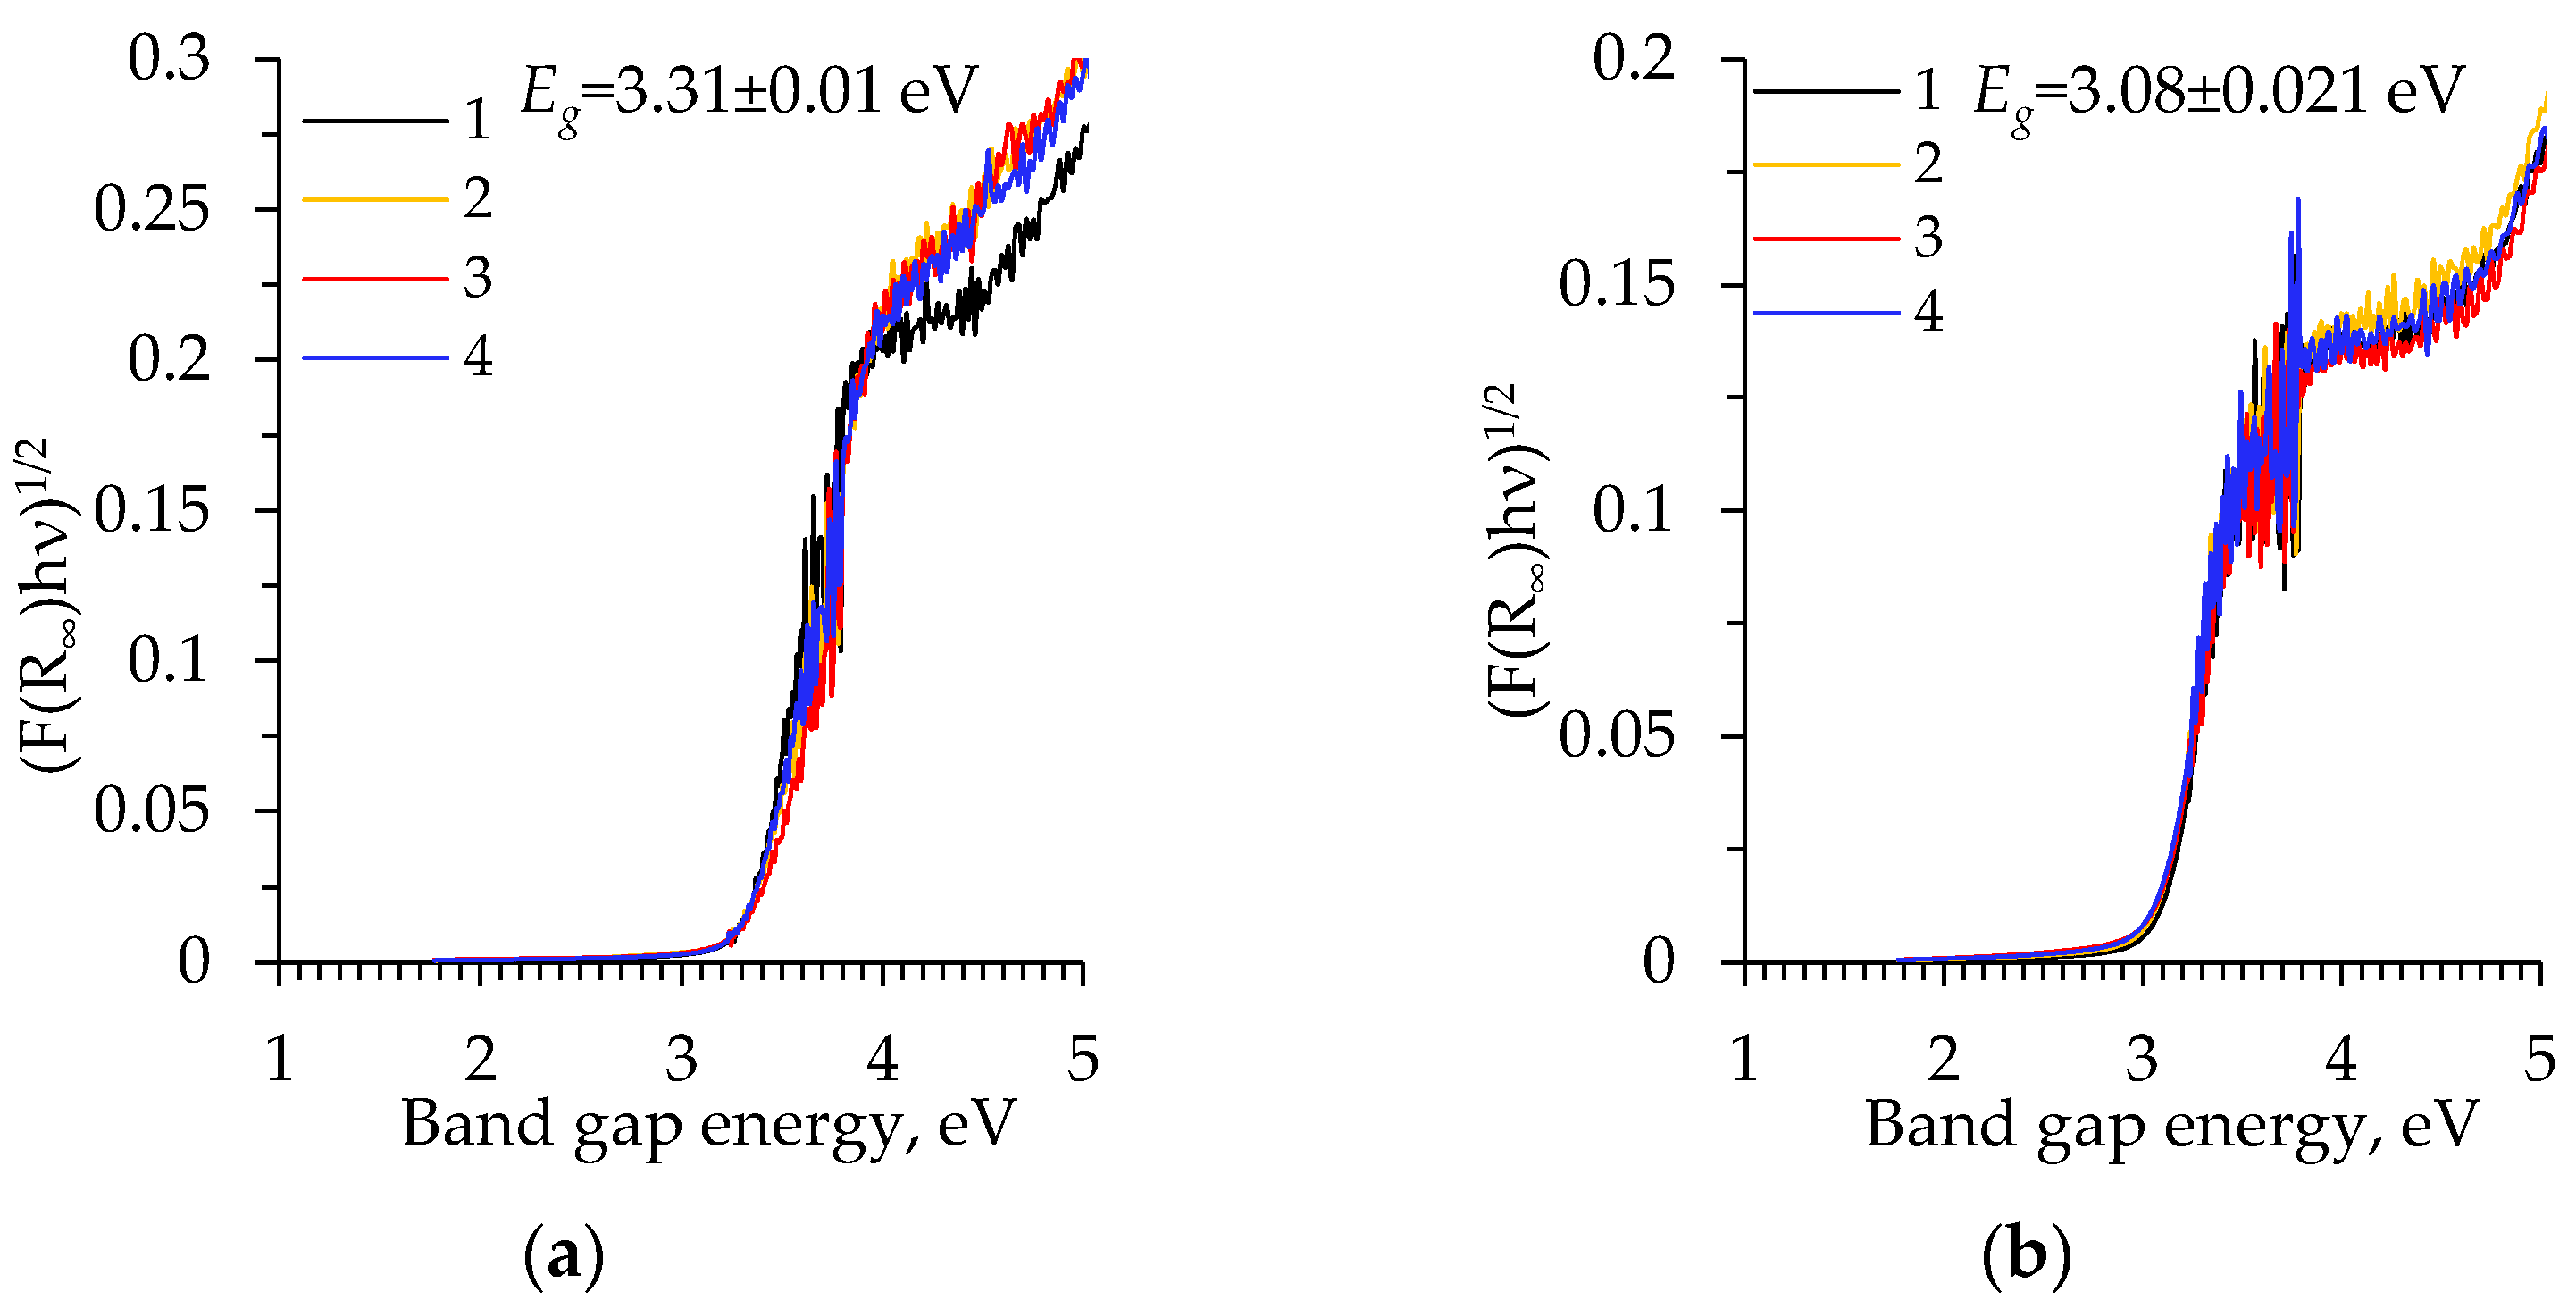
2.7. UV–Vis Spectroscopy Analysis
2.8. Thermal Conductivity Measurements
3. Conclusions
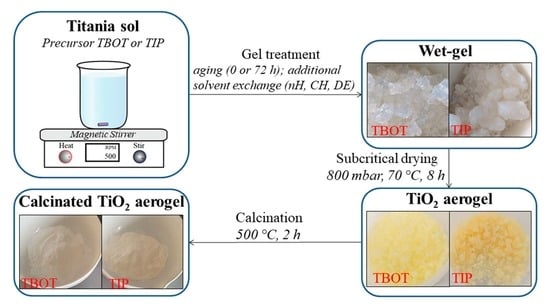
4. Materials and Methods
4.1. Synthesis of TiO2 Aerogels
4.2. Characterization
Supplementary Materials
Author Contributions
Funding
Institutional Review Board Statement
Informed Consent Statement
Data Availability Statement
Acknowledgments
Conflicts of Interest
References
- Yorov, K.E.; Baranchikov, A.E.; Kiskin, M.A.; Sidorov, A.A.; Ivanov, V.K. Functionalization of aerogels with coordination compounds. Russ. J. Coord. Chem. 2022, 48, 89–117. [Google Scholar] [CrossRef]
- Huang, J.; Wang, X.; Guo, W.; Niu, H.; Song, L.; Hu, Y. Eco-friendly thermally insulating cellulose aerogels with exceptional flame retardancy, mechanical property and thermal stability. J. Taiwan Inst. Chem. Eng. 2022, 131, 104159. [Google Scholar] [CrossRef]
- Sun, S.; Yan, Q.; Wu, M.; Zhao, X. Carbon aerogel based materials for secondary batteries. Sustain. Mater. Technol. 2021, 30, e00342. [Google Scholar] [CrossRef]
- Du, L.; Lu, T.; Li, B. CO2 capture and sequestration in porous media with SiO2 aerogel nanoparticle-stabilized foams. Fuel 2022, 324, 124661. [Google Scholar] [CrossRef]
- Wang, X.; Tian, Y.; Yu, C.; Liu, L.; Zhang, Z.; Wu, Y.; Shen, J. Organic/inorganic double-precursor cross-linked alumina aerogel with high specific surface area and high-temperature resistance. Ceram. Int. 2022, 48, 17261–17269. [Google Scholar] [CrossRef]
- Walker, R.C.; Potochniak, A.E.; Hyer, A.P.; Ferri, J.K. Zirconia aerogels for thermal management: Review of synthesis, processing, and properties information architecture. Adv. Colloid Interface Sci. 2021, 295, 102464. [Google Scholar] [CrossRef]
- Bernardes, J.C.; Müller, D.; Pinheiro, G.K.; Rambo, C.R. Enhancing the optical transparency of TiO2 aerogels with high surface area through water-based synthesis. Opt. Mater. 2020, 109, 110359. [Google Scholar] [CrossRef]
- Ardani, M.; Imani, M.; Tadjarodi, A. Core shell Fe3O4@TiO2/silica aerogel nanocomposite; synthesis and study of structural, magnetic and photocatalytic properties. Microporous Mesoporous Mater. 2022, 338, 111757. [Google Scholar] [CrossRef]
- Sahare, P.; Alvarez, P.G.; Yanez, J.M.S.; Luna-Bárcenas, G.; Chakraborty, S.; Paul, S.; Estevez, M.; Beilstein, J. Engineered titania nanomaterials in advanced clinical applications. Beilstein J. Nanotechnol. 2022, 13, 201–218. [Google Scholar] [CrossRef]
- Trinh, T.T.P.N.X.; Giang, N.T.H.; Huong, L.M.; Thinh, D.B.; Dat, N.M.; Trinh, D.N.; Hai, N.D.; Oanh, D.T.Y.; Nam, H.M.; Phong, M.T.; et al. Hydrothermal synthesis of titanium dioxide/graphene aerogel for photodegradation of methylene blue in aqueous solution. J. Sci. Adv. Mater. Devices 2022, 7, 100433. [Google Scholar] [CrossRef]
- Salehi Taleghani, M.; Salman Tabrizi, N.; Sangpour, P. Enhanced visible-light photocatalytic activity of titanium dioxide doped CNT-C aerogel. Chem. Eng. Res. Des. 2022, 179, 162–174. [Google Scholar] [CrossRef]
- Giang, N.T.H.; Huy, L.G.; Khoi, V.H.; Phong, H.H.T.; Hai, N.D.; Tai, L.T.; Dat, N.M.; Trinh, D.N.; Phong, M.T.; Hieu, N.H. Enhanced photocatalytic activity of titanium dioxide-doped graphene aerogel towards p-nitrophenol removal from aqueous solutions. Mater. Technol. 2022, 1–12. [Google Scholar] [CrossRef]
- Alwin, S.; Sahaya Shajan, X.; Ranjini, M.; Nabhiraj, P.Y.; Ananthapadmanabhan, P.V. Plasma treated TiO2 aerogel nanostructures as photoanode material and its influence on the performance of quasi-solid dye-sensitized solar cells. Mater. Res. Bull. 2017, 86, 201–208. [Google Scholar] [CrossRef]
- Liang, S.; Wang, X.; Cheng, Y.-J.; Xia, Y.; Müller-Buschbaum, P. Anatase titanium dioxide as rechargeable ion battery electrode—A chronological review. Energy Stor. Mater. 2022, 45, 201–264. [Google Scholar] [CrossRef]
- Macwan, D.P.; Dave, P.N.; Chaturvedi, S. A review on nano-TiO2 sol–gel type syntheses and its applications. J. Mat. Sci. 2011, 46, 3669–3686. [Google Scholar] [CrossRef]
- Aboulouard, A.; Gultekin, B.; Can, M.; Erol, M.; Jouaiti, A.; Elhadadi, B.; Zafer, C.; Demic, S. Dye sensitized solar cells based on titanium dioxide nanoparticles synthesized by flame spray pyrolysis and hydrothermal sol-gel methods: A comparative study on photovoltaic performances. J. Mater. Res. Technol. 2020, 9, 1569–1577. [Google Scholar] [CrossRef]
- Ramesh, S.C.; Ramkumar, P.; Columbus, C.C.; Shajan, X.S. Experimental and simulation studies of platinum-free counter electrode material for titania aerogel-based quasi-solid dye-sensitized solar cell. IEEE J. Photovolt. 2020, 10, 1757–1761. [Google Scholar] [CrossRef]
- Pinheiro, G.K.; Serpa, R.B.; de Souza, L.V.; Sartorelli, M.L.; Reis, F.T.; Rambo, C.R. Increasing incident photon to current efficiency of perovskite solar cells through TiO2 aerogel-based nanostructured layers. Colloids Surf. A Physicochem. Eng. Asp. 2017, 527, 89–94. [Google Scholar] [CrossRef]
- Aitola, K.; Gava Sonai, G.; Markkanen, M.; Jaqueline Kaschuk, J.; Hou, X.; Miettunen, K.; Lund, P.D. Encapsulation of commercial and emerging solar cells with focus on perovskite solar cells. Sol. Energy 2022, 237, 264–283. [Google Scholar] [CrossRef]
- Moussaoui, R.; Elghniji, K.; ben Mosbah, M.; Elaloui, E.; Moussaoui, Y. Sol–gel synthesis of highly TiO2 aerogel photocatalyst via high temperature supercritical drying. J. Saudi Chem. Soc. 2017, 21, 751–760. [Google Scholar] [CrossRef]
- Zu, G.; Shen, J.; Wang, W.; Lian, Y.; Zou, L.; Zhang, Y.; Liu, B.; Zhang, F. Heat-resistant, strong titania aerogels achieved by supercritical deposition. J. Supercrit. Fluids 2015, 106, 145–151. [Google Scholar] [CrossRef]
- Yue, X.; Xiang, J.; Chen, J.; Li, H.; Qiu, Y.; Yu, X. High surface area, high catalytic activity titanium dioxide aerogels prepared by solvothermal crystallization. J. Mater. Sci. Technol. 2020, 47, 223–230. [Google Scholar] [CrossRef]
- Kim, Y.N.; Shao, G.N.; Jeon, S.J.; Imran, S.M.; Sarawade, P.B.; Kim, H.T. Sol–gel synthesis of sodium silicate and titanium oxychloride based TiO2–SiO2 aerogels and their photocatalytic property under UV irradiation. Chem. Eng. J. 2013, 231, 502–511. [Google Scholar] [CrossRef]
- Alwin, S.; Ramasubbu, V.; Shajan, X.S. TiO2 aerogel–metal organic framework nanocomposite: A new class of photoanode material for dye-sensitized solar cell applications. Bull. Mater. Sci. 2018, 41, 27. [Google Scholar] [CrossRef] [Green Version]
- Dutoit, D.C.M.; Schneider, M.; Hutter, R.; Baiker, A. Titania–silica mixed oxides: IV. Influence of Ti content and aging on structural and catalytic properties of aerogels. J. Catal. 1996, 161, 651–658. [Google Scholar] [CrossRef]
- Kitazawa, N.; Watanabe, Y. Preparation of mesoporous oxide films via block copolymer templating. J. Non-Cryst. Solids 2010, 356, 109–113. [Google Scholar] [CrossRef]
- Ganesamoorthy, R.; Vadivel, V.K.; Kumar, R.; Kushwaha, O.S.; Mamane, H. Aerogels for water treatment: A review. J. Clean. Prod. 2021, 329, 129713. [Google Scholar] [CrossRef]
- Chen, Y.X.; Hendrix, Y.; Schollbach, K.; Brouwers, H.J.H. A silica aerogel synthesized from olivine and its application as a photocatalytic support. Constr. Build. Mater. 2020, 248, 118709. [Google Scholar] [CrossRef]
- Doneliene, J.; Fataraite-Urboniene, E.; Rudzikas, M.; Pakalka, S.; Danchova, N.; Ulbikas, J. Effect of precursor nature and sol-gel synthesis conditions on TiO2 aerogel’s structure. Molecules 2021, 26, 5090. [Google Scholar] [CrossRef]
- Sui, R.; Rizkalla, A.; Charpentier, P.A. Experimental study on the morphology and porosity of TiO2 aerogels synthesized in supercritical carbon dioxide. Microporous Mesoporous Mater. 2011, 142, 688–695. [Google Scholar] [CrossRef]
- Viet, T.Q.Q.; Khoi, V.H.; Thi Huong Giang, N.; Thi Van Anh, H.; Dat, N.M.; Phong, M.T.; Hieu, N.H. Statistical screening and optimization of photocatalytic degradation of methylene blue by ZnO–TiO2/rGO nanocomposite. Colloids Surf. A Physicochem. Eng. Asp. 2021, 629, 127464. [Google Scholar] [CrossRef]
- Lowell, S.; Shields, J.E.; Thomas, M.A.; Thommes, M. Characterization of Porus Solids and Powders: Surface Area, Pore Size and Density; Particle Technology Series; Springer: New York, NY, USA, 2004; Volume 16, pp. 11–14, 43–45. [Google Scholar] [CrossRef]
- Nawaz, M.; Miran, W.; Jang, J.; Lee, D.S. One-step hydrothermal synthesis of porous 3D reduced graphene oxide/TiO2 aerogel for carbamazepine photodegradation in aqueous solution. Appl. Catal. B Environ. 2017, 203, 85–95. [Google Scholar] [CrossRef]
- Wei, X.; Cai, H.; Feng, Q.; Liu, Z.; Ma, D.; Chen, K.; Huang, Y. Synthesis of co-existing phases Sn-TiO2 aerogel by ultrasonic-assisted sol-gel method without calcination. Mater. Lett. 2018, 228, 379–383. [Google Scholar] [CrossRef]
- Parale, V.G.; Kim, T.; Phadtare, V.D.; Yadav, H.M.; Park, H.-H. Enhanced photocatalytic activity of a mesoporous TiO2 aerogel decorated onto three-dimensional carbon foam. J. Mol. Liq. 2019, 277, 424–433. [Google Scholar] [CrossRef]
- Borrás, A.; Gonçalves, G.; Marbán, G.; Sandoval, S.; Pinto, S.; Marques, P.A.A.P.; Fraile, J.; Tobias, G.; López-Periago, A.M.; Domingo, C. Preparation and characterization of graphene oxide aerogels: Exploring the limits of supercritical CO2 fabrication methods. Chem. Eur. J. 2018, 24, 15903–15911. [Google Scholar] [CrossRef] [Green Version]
- Durães, L.; Ochoa, M.; Rocha, N.; Patrício, R.; Duarte, N.; Redondo, V.; Portugal, A. Effect of the drying conditions on the microstructure of silica based xerogels and aerogels. J. Nanosci. Nanotechnol. 2012, 12, 6828–6834. [Google Scholar] [CrossRef] [Green Version]
- Habibi, S.; Jamshidi, M. Synthesis of TiO2 nanoparticles coated on cellulose nanofibers with different morphologies: Effect of the template and sol-gel parameters. Mater. Sci. Semicond. Process. 2020, 109, 104927. [Google Scholar] [CrossRef]
- Cesnovar, A.; Paunovic, P.; Grozdanov, A.; Makreski, P.; Fidanchevska, E. Preparation of nano-crystalline TiO2 by sol-gel method using titanium tetraisopropoxide (TTIP). Adv. Nat. Sci. Theory Appl. 2012, 1, 133–142. Available online: https://www.researchgate.net/publication/234164554_Preparation_of_nano-crystalline_TiO2_by_sol-gel_method_using_titanium_tetraisopropoxide_TTIP (accessed on 7 June 2022).
- Kong, Y.; Shen, X.-D.; Cui, S. Direct synthesis of anatase TiO2 aerogel resistant to high temperature under supercritical ethanol. Mater. Lett. 2014, 117, 192–194. [Google Scholar] [CrossRef]
- Poo-arporn, Y.; Luengprasert, K.; Tonlublao, S.; Loiha, S.; Ruangvittayanon, A.; Poo-arporn, R.P. The influence of calcination temperature on (photo)electrochemical property of TiO2 prepared by the sol-gel method. IOP Conf. Ser. Mater. Sci. Eng. 2020, 965, 012005. [Google Scholar] [CrossRef]
- Nateq, M.H.; Ceccato, R. Sol-gel synthesis of TiO2 nanocrystalline particles with enhanced surface area through the reverse micelle approach. Adv. Mater. Sci. Eng. 2019, 2019, 1567824. [Google Scholar] [CrossRef] [Green Version]
- Gonçalves, M.C.; Pereira, J.C.; Matos, J.C.; Vasconcelos, H.C. Photonic band gap and bactericide performance of amorphous sol-gel titania: An alternative to crystalline TiO2. Molecules 2018, 23, 1677. [Google Scholar] [CrossRef] [PubMed] [Green Version]
- Luna, A.L.; Matter, F.; Schreck, M.; Wohlwend, J.; Tervoort, E.; Colbeau-Justin, C.; Niederberger, M. Monolithic metal-containing TiO2 aerogels assembled from crystalline pre-formed nanoparticles as efficient photocatalysts for H2 generation. Appl. Catal. B Environ. 2020, 267, 118660. [Google Scholar] [CrossRef]
- Gutzov, S.; Lerch, M. Preparation and optical properties of Zr-Ce-O-N materials. J. Europ. Ceram. Soc. 2001, 21, 595–601. [Google Scholar] [CrossRef]
- Tsekov, R.; Evstatieva, E.; Smirniotis, P.G. Surface diffusion control of the photocatalytic oxidation in air/TiO2 heteroge-neous reactors. Phys. Chem. Comm. 2002, 5, 161–164. [Google Scholar] [CrossRef] [Green Version]
- Kim, Y.N.; Hwang, H.M.; Wang, L.; Kim, I.; Yoon, Y.; Lee, H. Solar-light photocatalytic disinfection using crystalline/amorphous low energy bandgap reduced TiO2. Sci. Rep. 2016, 6, 25212. [Google Scholar] [CrossRef] [PubMed] [Green Version]
- Saha, D.; Ajimsha, R.S.; Rajiv, K.; Mukherjee, C.; Gupta, M.; Misra, P.; Kukreja, L.M. Spectroscopic ellipsometry characterization of amorphous and crystalline TiO2 thin films grown by atomic layer deposition at different temperatures. Appl. Surf. Sci. 2014, 315, 116–123. [Google Scholar] [CrossRef]
- Johnes, W.; March, N.H. Theoretical Solid State Physics; Courier Dover Publications: New York, NY, USA, 1985. [Google Scholar]
- Petrov, V.; Danchova, N.; Gutzov, S. Temperature dependent optical spectroscopy: A study of holmium diphenanthroline nitrate in DMF. Spectrochim. Acta Part A Mol. Biomol. Spectrosc. 2020, 227, 117527. [Google Scholar] [CrossRef]
- Gutzov, S.; Ahmed, G.; Petkova, N.; Füglein, E.; Petkov, I. Preparation and optical properties of samarium doped sol–gel materials. J. Non-Cryst. Solids 2008, 354, 3438–3442. [Google Scholar] [CrossRef]
- Scmidt, W. Optische Spektroskopie; Wiley-VCH: Weinheim, Germany, 2000; pp. 273–307. [Google Scholar]


| Precursor | Ageing Duration, h | Solvent | Surface Area *, m2/g | Pore Volume *, cm3/g | CBET Constant * |
|---|---|---|---|---|---|
| TIP | 0 | - CH nH DE | 397.257 373.878 398.166 420.178 | 0.244 0.192 0.206 0.235 | 90.156 84.773 82.372 67.304 |
| 72 | - CH nH DE | 396.665 439.581 351.235 462.211 | 0.269 0.271 0.247 0.276 | 55.687 47.050 45.727 55.375 | |
| TBOT | 0 | - CH nH DE | 409.955 404.379 348.767 334.882 | 0.212 0.225 0.182 0.196 | 78.273 49.223 68.408 42.937 |
| 72 | - CH nH DE | 337.288 363.361 399.636 421.080 | 0.183 0.192 0.237 0.240 | 50.619 57.696 43.530 53.418 |
| Precursor | Ageing Duration, h | Solvent | Peak Characteristics | Heat of Process, J/g | Mass Loss, % | ||
|---|---|---|---|---|---|---|---|
| Tonset, °C | Tmax, °C | Tend, °C | |||||
| TIP | 0 | - | 380.8 | 420.8 | 449.7 | 283.83 | 2.272 |
| CH | 428.9 | 452.1 | 467.4 | 678.39 | 3.752 | ||
| nH | 429.2 | 449.4 | 462.7 | 706.00 | 4.279 | ||
| DE | 430.5 | 452.5 | 468.5 | 705.21 | 3.551 | ||
| 72 | - | 369.4 | 419.4 | 456.1 | 282.60 | 2.407 | |
| CH | 388.8 | 432.5 | 458.3 | 385.80 | 2.251 | ||
| nH | 368.9 | 412.4 | 455.2 | 282.95 | 1.863 | ||
| DE | 405.7 | 440.2 | 462.1 | 447.65 | 3.077 | ||
| TBOT | 0 | - | 418.4 | 448.8 | 465.9 | 651.85 | 5.063 |
| CH | 413.1 | 449.4 | 468.0 | 729.47 | 5.118 | ||
| nH | 421.2 | 454.3 | 473.2 | 765.44 | 5.140 | ||
| DE | 418.7 | 450.1 | 466.8 | 714.02 | 4.809 | ||
| 72 | - | 410.1 | 446.1 | 464.8 | 703.29 | 4.494 | |
| CH | 404.3 | 443.8 | 465.1 | 651.50 | 4.175 | ||
| nH | 383.9 | 434.3 | 460.5 | 518.37 | 3.863 | ||
| DE | 392.9 | 437.0 | 460.1 | 446.77 | 3.496 | ||
| Precursor | Ageing Duration, h | Solvent | Crystallite Size, nm |
|---|---|---|---|
| TIP | 0 | - | 18.52 |
| nH | 18.03 | ||
| 72 | - | 20.62 | |
| nH | 21.60 | ||
| TBOT | 0 | - | 22.92 |
| nH | 20.11 | ||
| 72 | - | 20.47 | |
| nH | 23.08 |
| Precursor | Ageing Duration, h | Solvent | ρa, cm3/g | ρt, cm3/g | Porosity, % | |||
|---|---|---|---|---|---|---|---|---|
| Before Calcination | After Calcination | Before Calcination | After Calcination | Before Calcination | After Calcination | |||
| TIP | 72 | - | 0.68 | 1.13 | 2.66 | 4.89 | 74 | 77 |
| nH | 0.68 | 1.20 | - | - | - | - | ||
| TBOT | 72 | - | 0.69 | 1.16 | 2.29 | 4.36 | 70 | 73 |
| nH | 0.69 | 1.29 | - | - | - | - | ||
| Precursor | Solvent | Thermal Conductivity k *, W/m·K | Δk After Calcination | |
|---|---|---|---|---|
| TIP | - | Before calcination | 0.085 | - |
| nH | 0.079 | - | ||
| TBOT | - | 0.084 | - | |
| nH | 0.082 | - | ||
| TIP | - | After calcination | 0.100 | 0.016 |
| nH | 0.099 | 0.02 | ||
| TBOT | - | 0.106 | 0.024 | |
| nH | 0.105 | 0.023 |
Publisher’s Note: MDPI stays neutral with regard to jurisdictional claims in published maps and institutional affiliations. |
© 2022 by the authors. Licensee MDPI, Basel, Switzerland. This article is an open access article distributed under the terms and conditions of the Creative Commons Attribution (CC BY) license (https://creativecommons.org/licenses/by/4.0/).
Share and Cite
Donėlienė, J.; Fataraitė-Urbonienė, E.; Danchova, N.; Gutzov, S.; Ulbikas, J. The Influence of the Precursor’s Nature and Drying Conditions on the Structure, Morphology, and Thermal Properties of TiO2 Aerogels. Gels 2022, 8, 422. https://doi.org/10.3390/gels8070422
Donėlienė J, Fataraitė-Urbonienė E, Danchova N, Gutzov S, Ulbikas J. The Influence of the Precursor’s Nature and Drying Conditions on the Structure, Morphology, and Thermal Properties of TiO2 Aerogels. Gels. 2022; 8(7):422. https://doi.org/10.3390/gels8070422
Chicago/Turabian StyleDonėlienė, Jolanta, Eglė Fataraitė-Urbonienė, Nina Danchova, Stoyan Gutzov, and Juras Ulbikas. 2022. "The Influence of the Precursor’s Nature and Drying Conditions on the Structure, Morphology, and Thermal Properties of TiO2 Aerogels" Gels 8, no. 7: 422. https://doi.org/10.3390/gels8070422