Article

Computational Modelling for Efficient Transdentinal Drug Delivery

by
Agathoklis D. Passos
1,
Dimitris Tziafas
2,
Aikaterini A. Mouza
1 and
Spiros V. Paras
1,*
1
Department of Chemical Engineering, Aristotle University of Thessaloniki, 541 24 Thessaloniki, Greece
2
Hamdan Bin Mohamed College of Dental Medicine, DHCC Dubai, Dubai, UAE
*
Author to whom correspondence should be addressed.
Submission received: 14 November 2017 / Revised: 21 December 2017 / Accepted: 25 December 2017 / Published: 27 December 2017
(This article belongs to the Special Issue Flow and Heat or Mass Transfer in the Chemical Process Industry)

Abstract

:
This work deals with the numerical investigation of the delivery of potential therapeutic agents through dentinal discs (i.e., a cylindrical segment of the dentinal tissue) towards the dentin–pulp junction. The aim is to assess the main key features (i.e., molecular size, initial concentration, consumption rate, disc porosity and thickness) that affect the delivery of therapeutic substances to the dental pulp and consequently to define the necessary quantitative and qualitative issues related to a specific agent before its potential application in clinical practice. The computational fluid dynamics (CFD) code used for the numerical study is validated with relevant experimental data obtained using micro Laser Induced Fluorescence (μ-LIF) a non-intrusive optical measuring technique. As the phenomenon is diffusion dominated and strongly dependent on the molecular size, the time needed for the concentration of released molecules to attain a required value can be controlled by their initial concentration. Finally, a model is proposed which, given the maximum acceptable time for the drug concentration to attain a required value at the pulpal side of the tissue along with the aforementioned key design parameters, is able to estimate the initial concentration to be imposed and vice versa.

Graphical Abstract

1. Introduction

During the last few decades, clinical practice has been oriented towards the design and development of modern dental treatment techniques that would ensure the long-term maintenance of vitality and function of the dentine–pulp complex [1]. The traditional treatment strategies in vital pulp therapy have been mainly focused on protection of dental pulp from possible irritation presented by components released from dental materials and induction of replacement of diseased dentin by a layer of tertiary dentine [2]. Furthermore, the fact that the pulp–dentin complex can be repaired, and, as a part of reparative events, tertiary dentin is formed, has recently led the scientific community towards the development of novel optimal procedures and production of potential therapeutic agents for use in regenerative pulp therapies. There is a growing weight of evidence that bioactive molecules diffused through the dentinal tubules can regulate the biosynthetic activity of pulpal cells [3,4,5]. The idea of using the dentinal tubules, i.e., structures running in parallel to the whole thickness of dentin, for drug delivery in pulp, was originally proposed by Pashley [6]. Later, Pashley [7] suggested that the therapeutic agents must consist of small molecules or ions that exhibit relatively high diffusion coefficients.
Although it is well known that a remaining dentin zone (Remaining Dentin Thickness, RDT) is necessary for maintaining the dental pulp function [8], much still needs to be learned about the effect of potent toxic components that are released from traditional restorative materials or bioactive signaling molecules, a knowledge that will form the basis for novel regenerative therapeutic procedures. As it is expected, the size of the RDT plays an important role in the level of penetration of exogenous compounds to the pulp. This is in accordance with Tak and Usumez [9], who concluded that the amount of HEMA that diffused through the dentin to the pulp is increased in the case of decreasing RDT. It is reasonable to suggest that any toxic interruption of pulp functions or therapeutic upregulation of the responsible for the biosynthetic activity of teeth odontoblasts will probably reflect the molecular concentration of these constituents at the dentin–pulp interface area [10]. Thus, a number of delivery considerations have to be initially addressed. However, due to the minute dimensions of the dentinal tubules, the experimental study of the drug delivery through the dentinal tubules under the same conditions as in clinical therapy is practically unachievable using the current experimental techniques. Thus, it is necessary to develop novel techniques that would permit the prediction of the transport rate of selected therapeutic molecules.
Several in vitro experimental studies reported in the literature concern the inward diffusion of substances in dentinal slabs that are placed in custom made split-chamber devices under the absence/existence of simulated pulpal pressure. Pashley and Matthews [11] conducted experiments aiming to evaluate the influence of outward forced convective flow on the inward diffusion of radioactive iodide. In addition Hanks and Wataha [12] investigated the diffusion of various biological and synthetic molecules through dentine, including resin components and dyes. However, due to the limitations imposed by the experimental techniques, these studies fail to fully represent the actual tooth case and can only provide information on the permeability of dentinal discs with respect to several substances. Due to the non-uniformity of the cross-section of dentinal tubules, the theoretical equations, which are derived from Fick’s Second Law and are used for estimating the flow through a tubulus, are very complicated to be applied. Consequently, computational fluid dynamics (CFD) appear to be the most feasible method for studying the problem under consideration. Several studies confirmed the suitability of CFD for dental pulp study e.g., [13,14,15,16]. In a previous study [17], we have numerically investigated the delivery of bioactive therapeutic agents to the dentin-enamel junction (DEJ) through a typical dentin tubule that has no obstructions or alterations of any type. The results of this initial approach led to the formulation of a simplified model that is able to estimate the initial drug concentration that must be imposed, so as a given type of therapeutic molecules to be effectively transported through a single and enclosed dentinal tubule.
The present work extends our previous study by numerically investigating the delivery of potential therapeutic agents through dentinal discs (i.e., a cylindrical segment of the dentinal tissue) towards the dentin–pulp junction in enclosed cavities. New key design parameters (i.e., Remaining Dentin Thickness, Porosity and Consumption Rate) have been addressed in a way that fully represents the actual tooth case. The aim is to quantify the effect of these parameters on the transdentinal diffusion characteristics. The study will also include the effect of the number of the active dentinal tubules expressed by a porosity value as well as the effect of the dentin–pulp barrier expressed as a consumption rate at the pulp on the drug delivery characteristics.

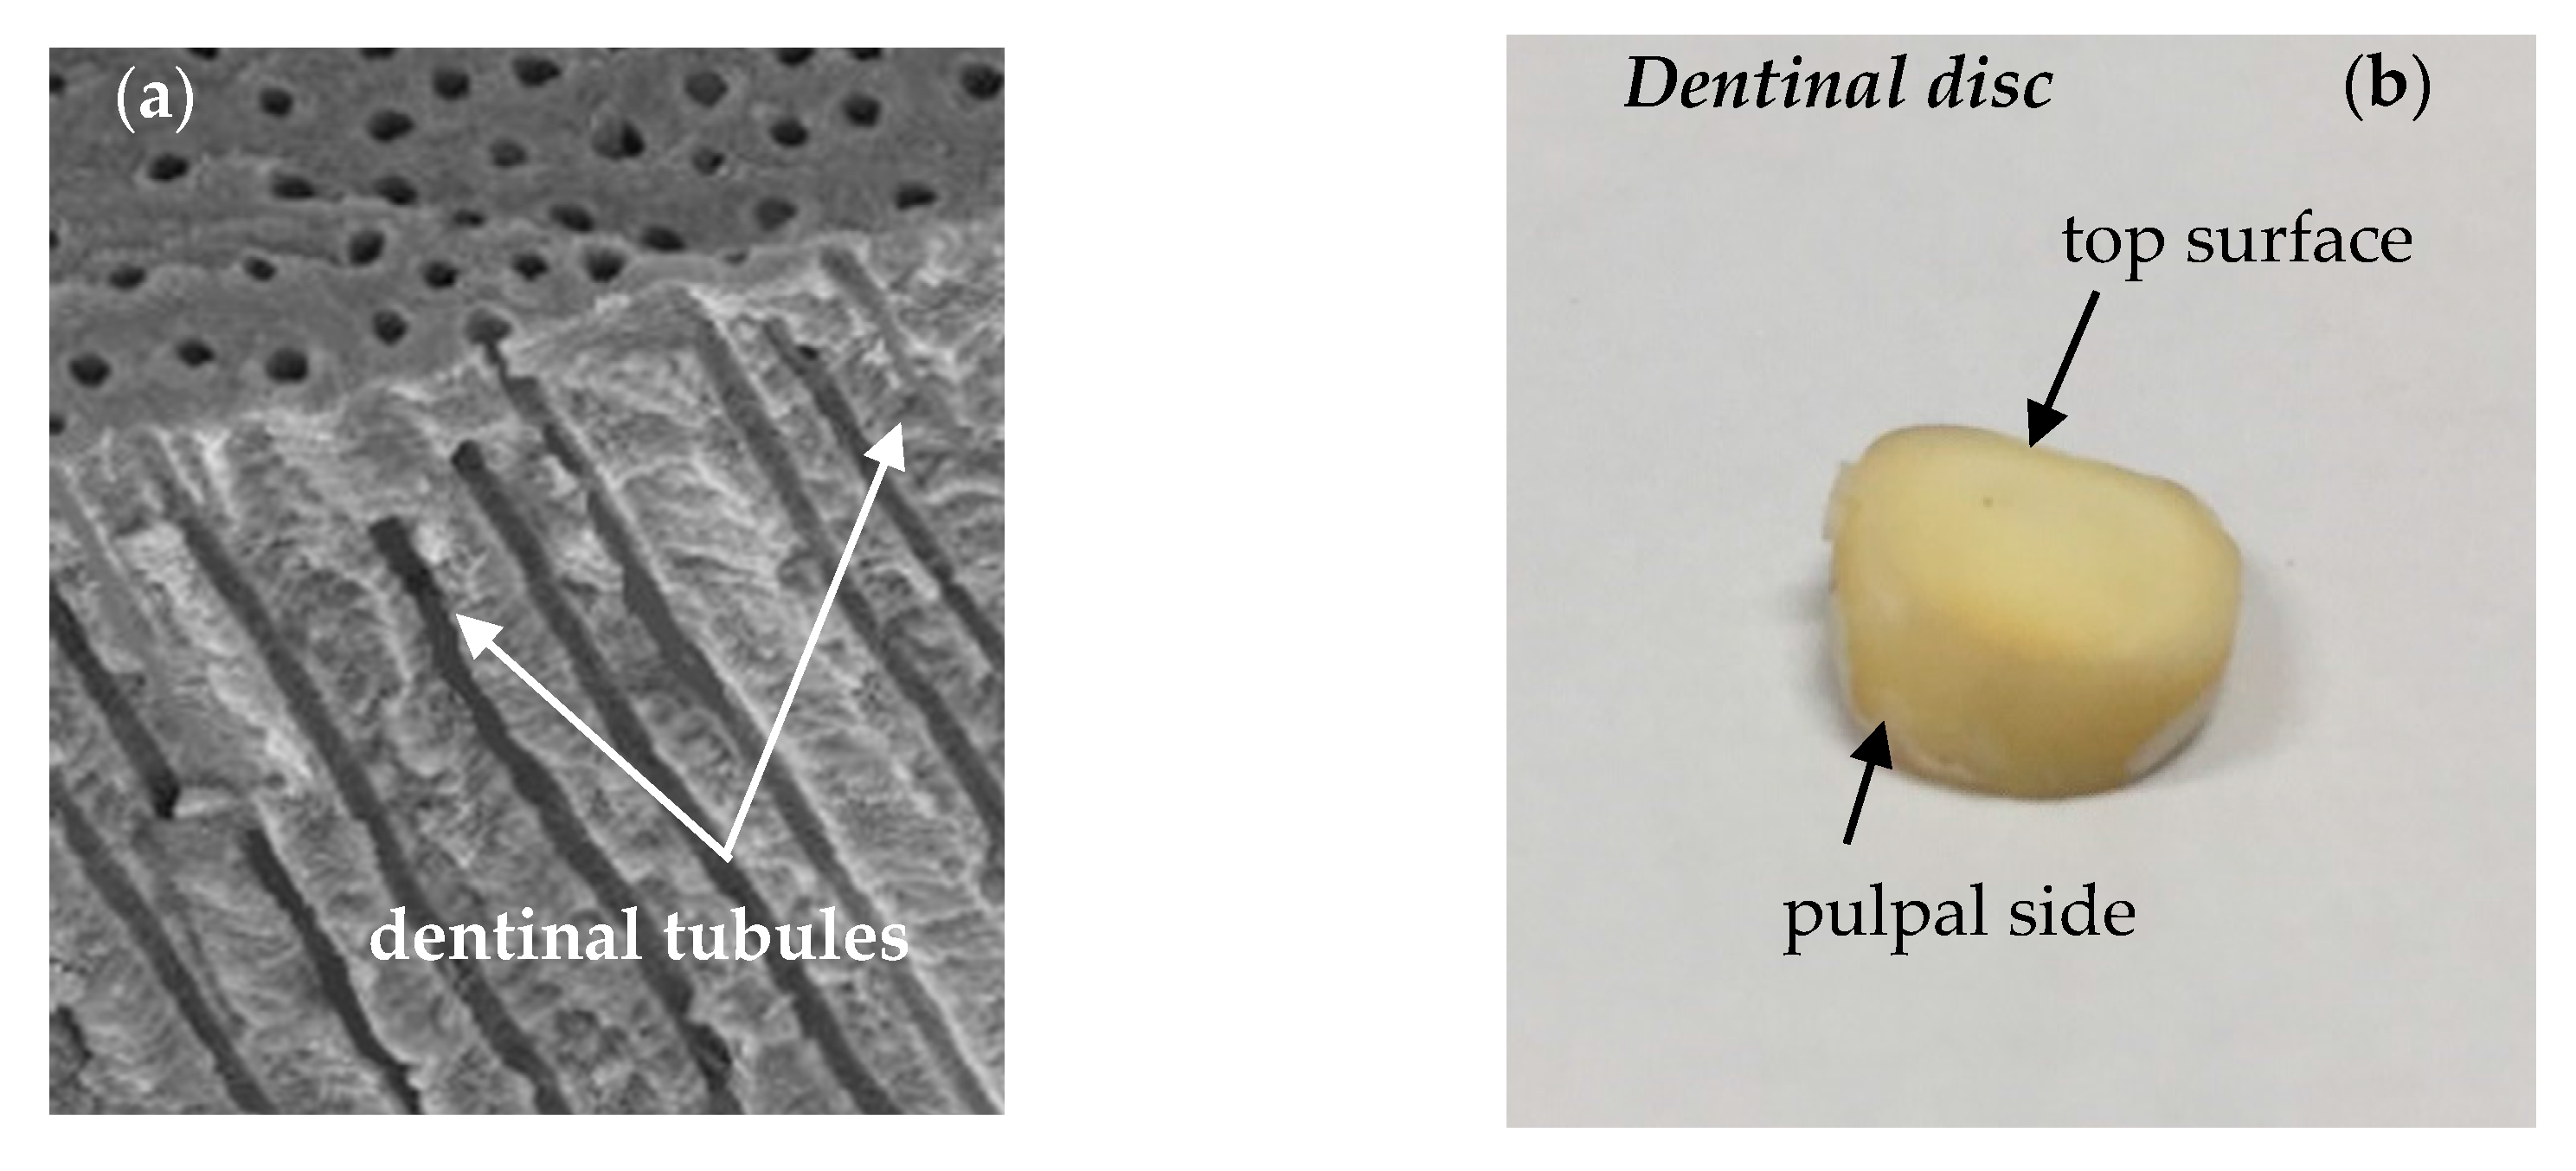
2. Transport of Therapeutic Compounds through the Dentinal Tissue

Dentin is a mineralized matrix that is porous and yellow-hued. It is made up of 70% inorganic materials (mainly hydroxyapatite and some non-crystalline amorphous calcium phosphate), 20% organic materials (90% of which is collagen type 1 and the remaining 10% ground substance, which includes dentine-specific proteins), and 10% water [18]. The dentin tissue consists of microscopic channels, the dentinal tubules, which radiate outwards through the dentin from the pulp to the exterior cementum or enamel border (Figure 1a). In the tooth crown, the dentinal tubules extend from the dentino-enamel junction (DEJ) to the pulp periphery following an S-shaped path. Tapering from the inner to the outermost surface, they have an average diameter of 2.5 μm near the pulp, 1.2 μm in the middle of the dentin, and 0.9 μm at the DEJ, while the total tissue width is estimated to be about 2.5 mm [19]. Most of the dentinal tubules contain non-myelinated terminal nerves and odontoblasts that are placed in an environment filled with dentinal fluid [20,21,22].
The number of dentinal tubules per unit area depends on the age and gender of each individual, while their density and diameter define the surface area that they occupy. For example, the area of dentin occupied by tubules at the dentino-enamel junction is only 1% and increases to 45% at the pulp chamber [18], while their density near the pulp varies between 59,000 to 76,000 tubules/mm2. In addition, the dentinal tubules are connected to each other by branching canalicular systems.
In clinical practice, when the dentin pulp complex is affected by caries or trauma, biological compounds are placed in enclosed cavities and then diffuse through the dentinal fluid to the pulp. In this case, the surface of the traumatized dentin tissue must be covered with suitable dental materials after the addition of the therapeutic agent. In the case of open cavities, compounds/bacteria and consequently also therapeutic agents placed in the vicinity of the cavity may never enter the dentinal tubules because of the fluid tendency to flow outwards.
In the framework of the present computational study, the dentinal tissue is modeled as a porous disc with tortuosity value τ = 1. The transport of substances in a cylindrical section of the tissue is investigated under the effect of the geometrical characteristics of the tissue, the size and the initial concentration of the applied molecules as well as their consumption rate at the pulpal side of the tooth.

3. Materials and Methods

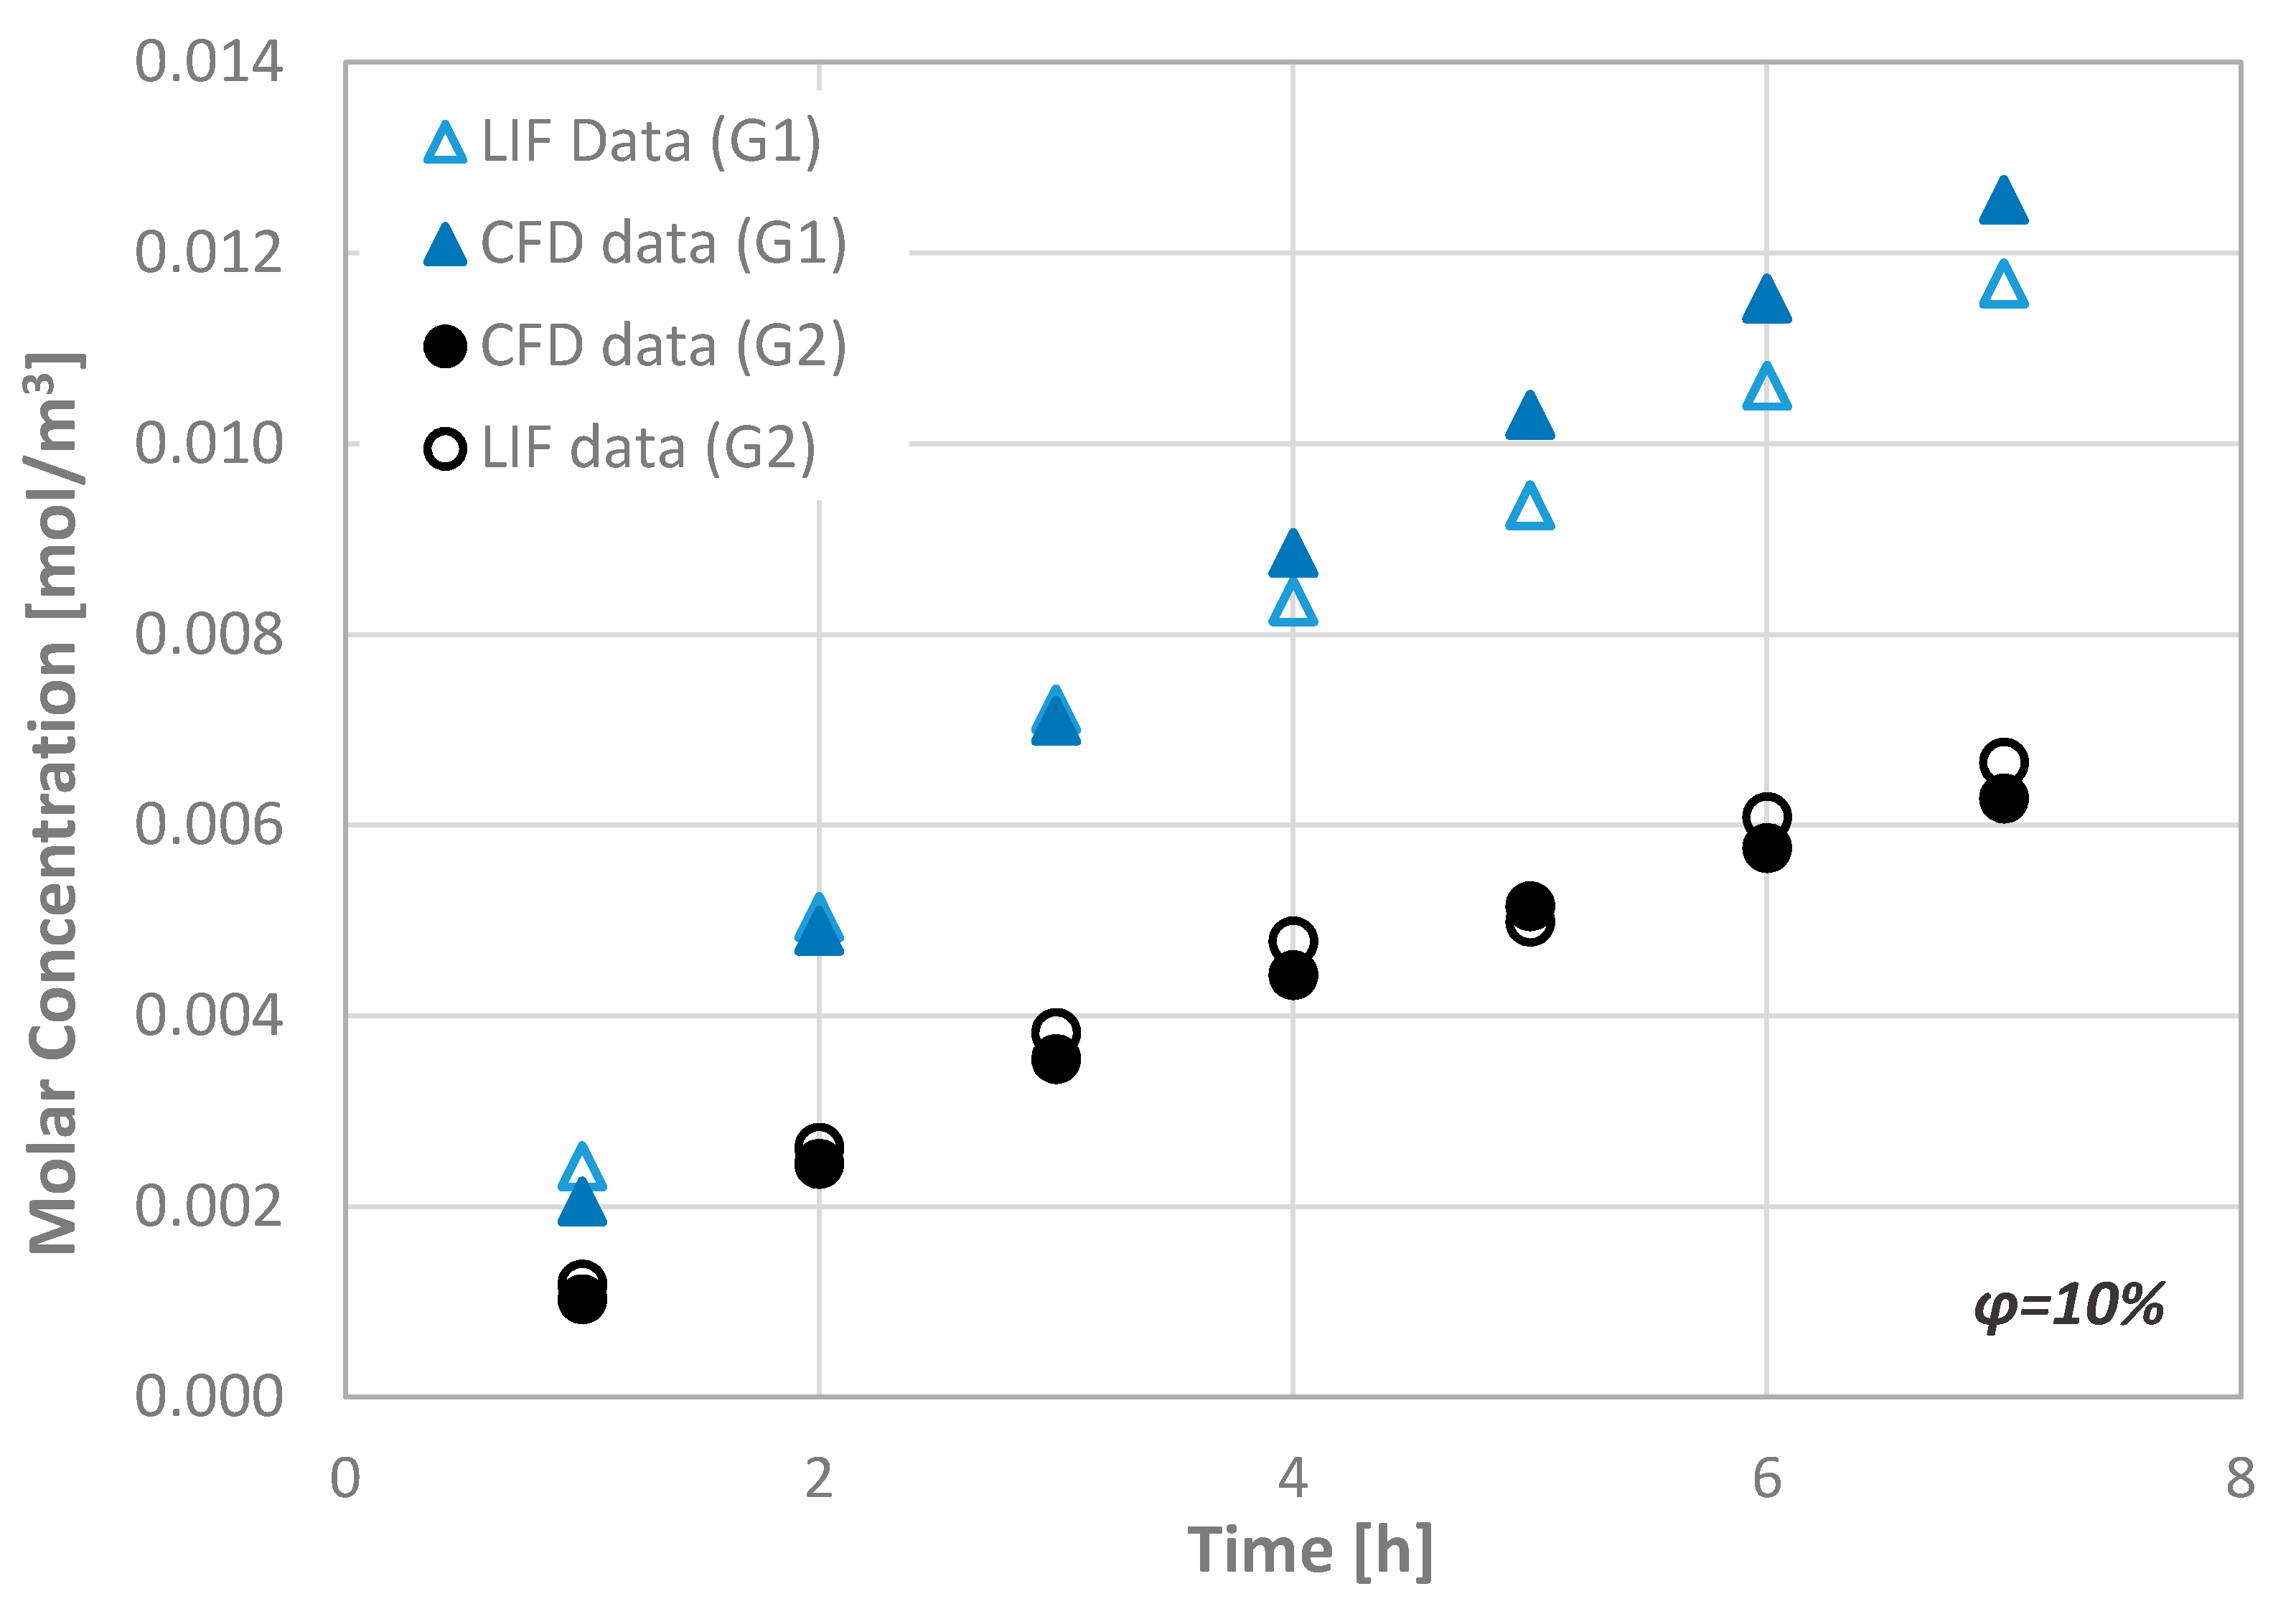
3.1. Code Validation

Prior to proceeding with the computational procedure, the CFD simulations were validated using experimental data acquired by performing experiments using dentinal porous discs. The dentinal discs employed were 0.85 ± 0.05 mm thick (Figure 1b) and were cut perpendicular to the vertical axis of exported human teeth, just above the level of the pulp horns, by a low speed saw ISOMET (Buehlel, Lake Bluff, IL, USA) under constant water flow. The dentine discs were hand-sanded under tap water, by a 600-grit silicon carbide paper to achieve a uniform flat surface with smear layer, acid-etched on both sides, with 35% phosphoric acid (Ultra etch, Ultradent, South Jordan, UT, USA) for 15 s and then thoroughly rinsed with water spray in order to clean the disc and remove the smear layer from the dentine. The disc was placed between two transparent glass tubes with a standard central hole (32 mm2) and it was attached with a minimum quantity of aquarium marine silicone (Top sil, Mercola, Athens, Greece) carefully placed on the enamel margins of the dentine disc. After the silicone was set, all of the joints were reinforced externally with sticky wax (Kem-den, Purton, UK) and the whole system was filled with Ringer’s solution (Vioser, Iraklio, Greece) to be checked for leakages. The experimental conduit, which is schematically presented in Figure 2, is a closed system that was constructed at the Dental School of Aristotle University of Thessaloniki.
The μ-LIF experimental setup, available in our Lab, is shown in Figure 3. The measuring section was illuminated by a double cavity Nd:YAG Laser emitting at 532 nm. The fluid flux was measured by a high sensitivity charge-coupled device (CCD) camera (Hisense MkII, Qingdao, China), connected to a Nikon (Eclipse LV150, Tokyo, Japan) microscope, which moves along the vertical axis with an accuracy of one micron. A 10X air immersion objective with NA = 0.20 was used. For each measurement, at least 20 images were acquired at a sampling rate of 5 Hz.
Experiments were conducted using two liquids, namely distilled water as reference and distilled water marked with the fluorescent dye Rhodamine B, completely dissolved in water. The diffusion of Rhodamine B in the aqueous solution (diffusion coefficient in water 4.5 × 10⁻¹⁰ m2/s [23]) through the dentinal disc to the opposite area (i.e., the observation area) is measured using the non-intrusive experimental technique μ-LIF (μ-Laser Induced Fluorescence). Two concentration groups of the aqueous solution were used, namely G1 for M0 = 0.1 mg/L and G2 for M0 = 0.05 mg/L.
As reported by Bindhu and Harilal [24], the Rhodamine B quantum yield (up to ϕ = 0.97 at low concentrations) depends on the solvent and on the type of excitation (i.e., continuous or pulsed), while it weakly decreases with increasing concentration. Rhodamine B, dissolved in water, is most effectively excited by green light and emits red light with the maximum intensity in the range 575–585 nm [24,25]. Image processing and concentration calculations were performed using appropriate software (Flow Manager by Dantec Dynamics, Skovlunde, Denmark).
A typical procedure for μ-LIF measurements is as follows [17]:
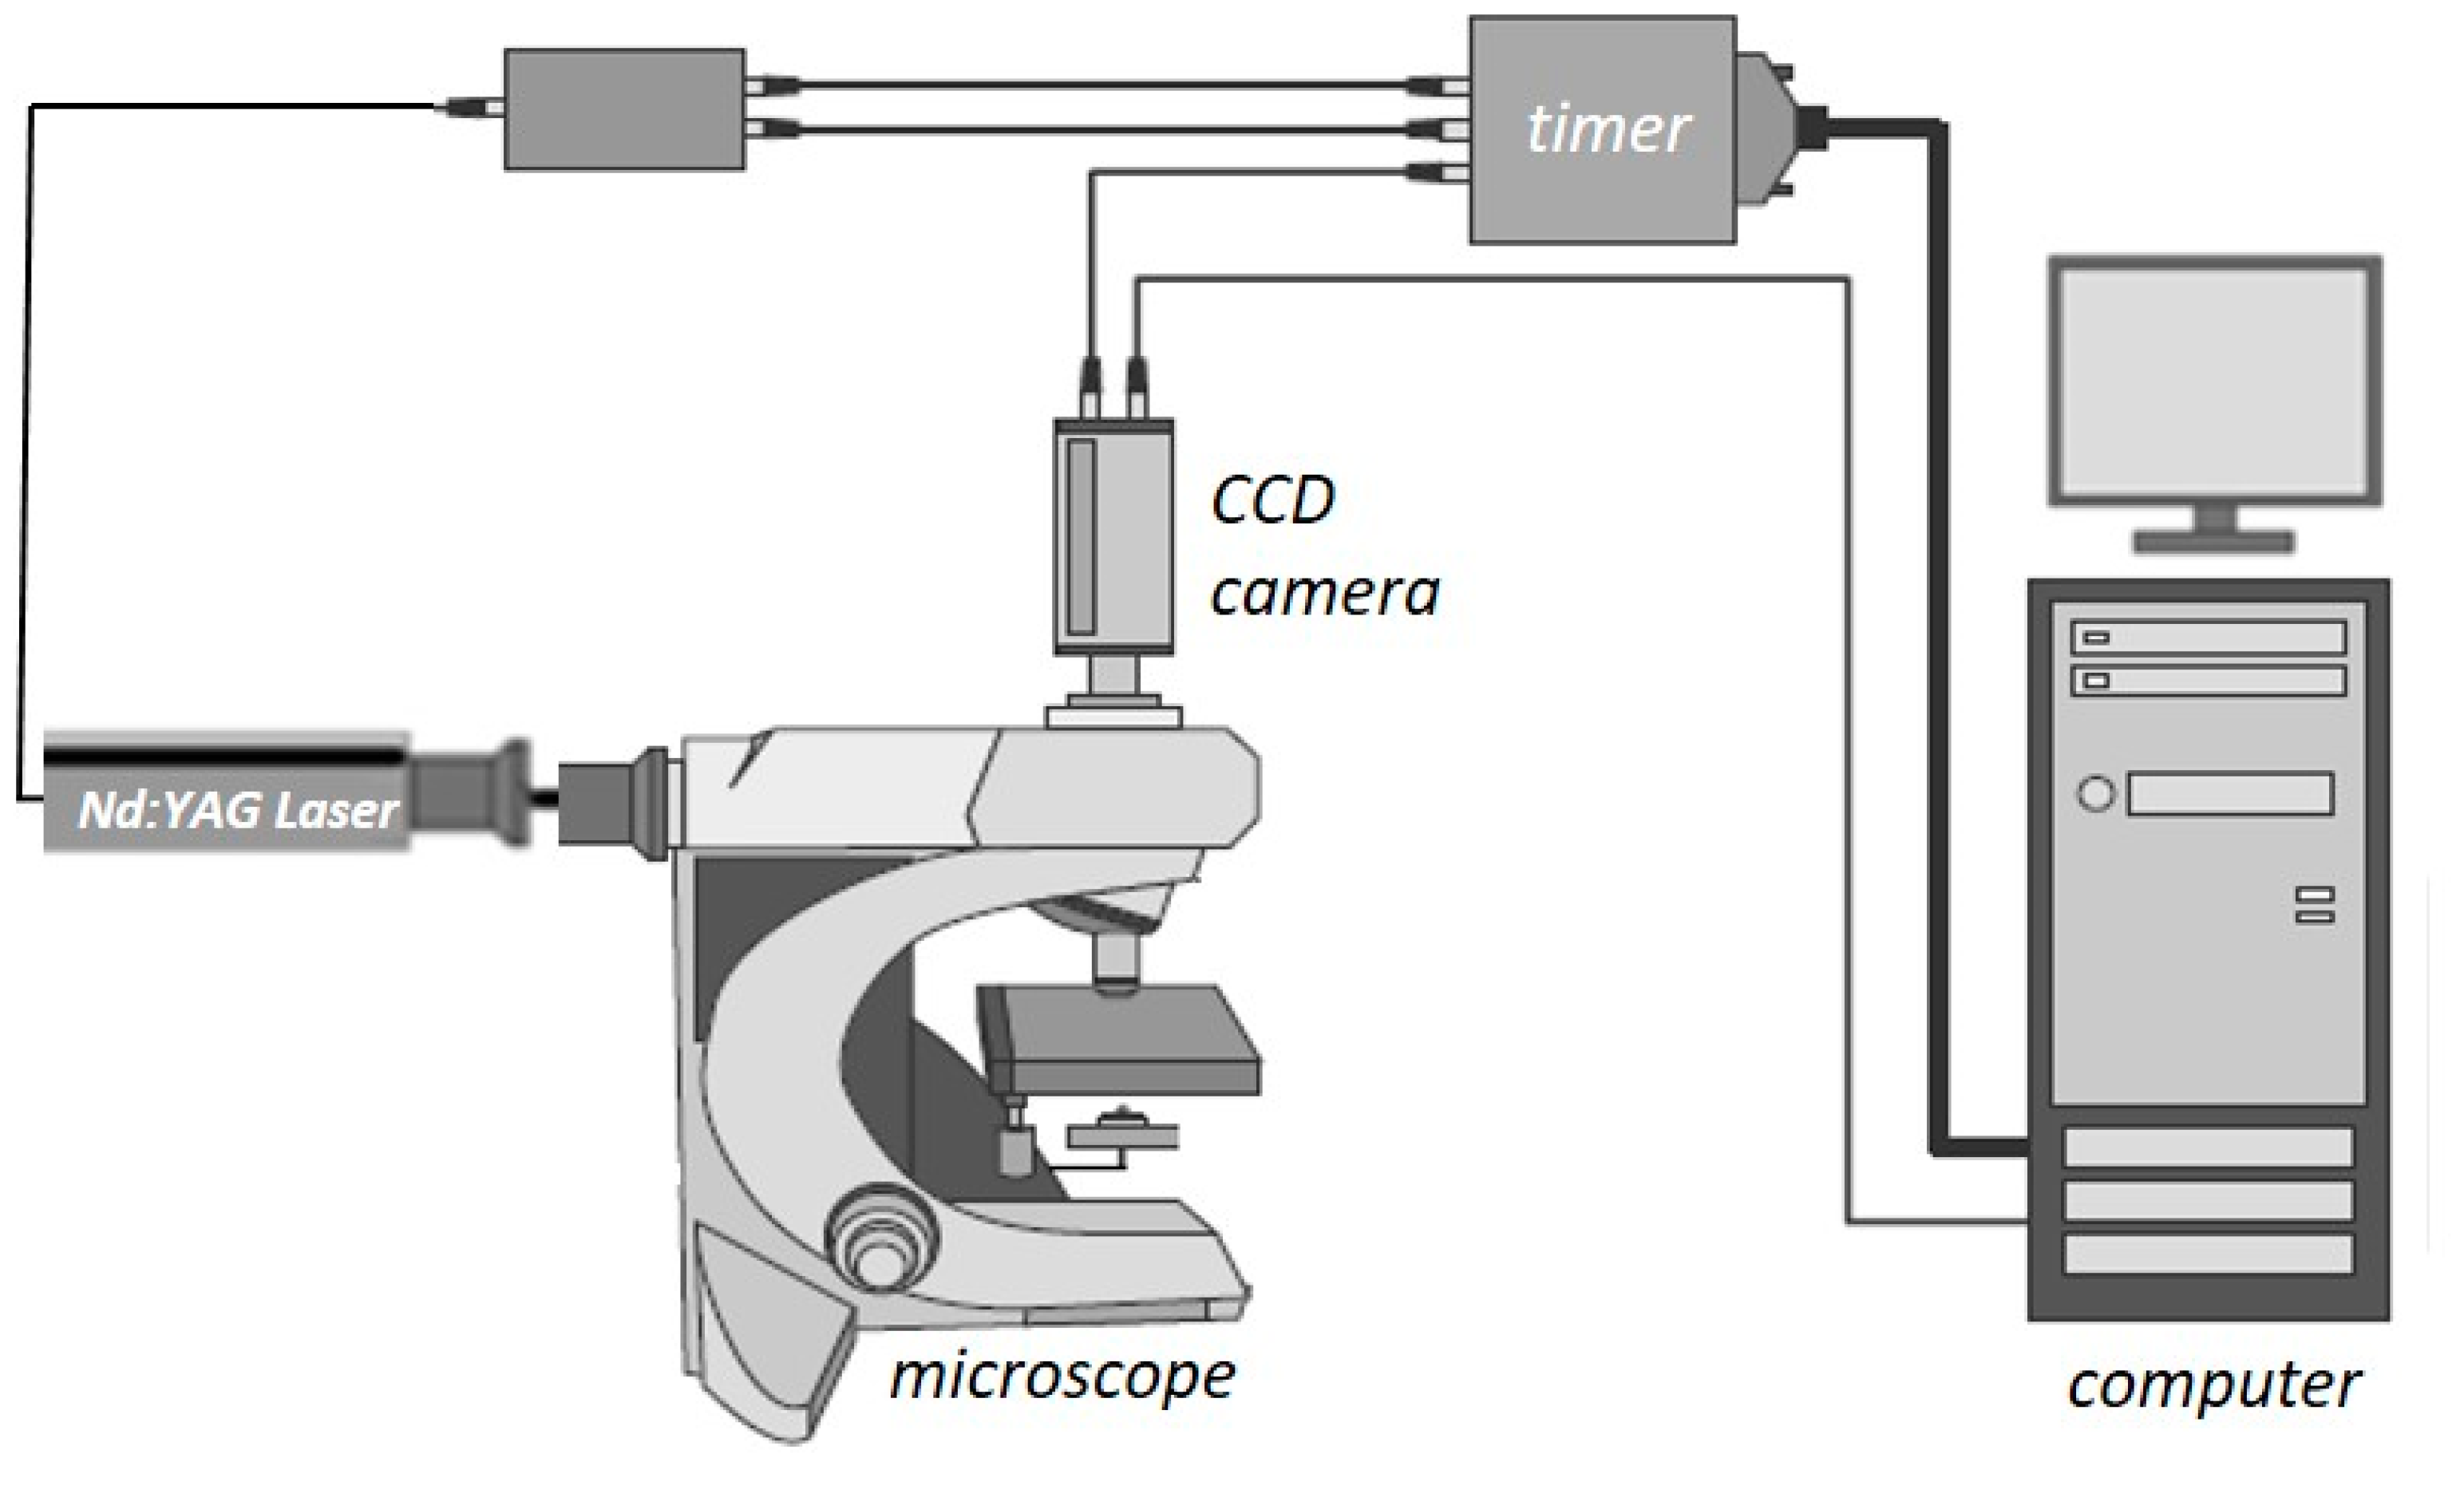
  • Prior to the actual measurements, the system is calibrated using suitable solutions. In our case aqueous Rhodamine B solutions with known concentrations, namely, M = 0.05, 0.025 and 0.00 mg/L were employed, while, for each concentration Ci, an image C(x,y) is taken.
  • To reduce noise, image masking of the acquired images is performed before defining an appropriate Region of Interest (ROI), at which the fluorescence intensity is measured.
  • The relationship between the measured fluorescence intensity field I(x,t) and the concentration field C(x,y) is determined.
  • A set of 20 images is acquired and the mean image is calculated.
  • Each mean image is compared with the previously defined μ-LIF calibration curve.
During our experiments, the lens was focused on the middle plane of the capillary, while the optical system was set to have an ROI of 300 × 580 μm. To minimize the uncertainty of the experimental procedure, care was taken for the experimental conditions to be identical to those of the calibration procedure. The uncertainty of the method is estimated to be less than ±5% [26]. The concentration measurements were performed at the observation area (Figure 2), namely at a distance of 1 mm from the pulpal side of the dentinal disc. As there is no lateral diffusion, i.e., the process is 1D, the concentration can be considered constant along the diameter of the tube, meaning that the μ-LIF measurement corresponds to the mean concentration at a cross-section of the conduit.
The porosity of the dentin disc was defined by employing Scanning Electron Microscopy (SEM). More precisely, using the acquired images, the porosity was estimated by measuring the area occupied by dentinal tubules. Apart from the experimental measurements, we also performed computational simulations in a computational domain that fully represents the experimental setup (i.e., dentinal disc dimensions and initial Rhodamine B concentrations). The obtained numerical results are in very good agreement with the corresponding experimental ones. In Figure 4, the measured temporal molar concentration (CL) values of Rhodamine B at the observation area of a dentinal disc with porosity ϕ = 10% are compared with the corresponding CFD simulation results.
Since the comparison of the CFD data with the available experimental results indicate a very good agreement, i.e., better than ±15%, the CFD code can be considered suitable for performing additional simulations concerning the transport of substances through the porous disc.

3.2. Numerical Procedure

In this study, we aim to investigate the delivery of potential therapeutic substances, which are placed at the top surface of the dentinal tissue, to the pulpal side by molecular diffusion through the dentinal fluid that occupies the micro-pores of the tissue. In order to accomplish this, we assume that dentine is a porous tissue with a porosity value related directly to the volume of dentinal fluid per unit volume of the tissue. Since the porosity of the dentin tissue is generally unknown and its thickness, especially in cases of traumatized teeth, is variable, we perform a parametric study that incorporates the effect of these two parameters on the diffusion process characteristics. In addition, the present parametric study includes the effect of the consumption of the diffusates at the pulpal side of the dentinal tissue, where the odontoblasts are located. The consumption at the pulpal side of the dentinal tissue is modeled by employing a constant consumption rate of the diffusate using an appropriate built-in feature of the CFD code. Since the consumption rate of the agents is considered to be unknown, we employed a range of consumption rates between 0 (i.e., no consumption is assumed) and 10−10 kg/(m2·s). Finally, a parametric study is performed that includes the effect of:
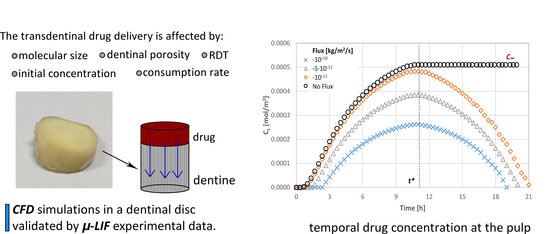
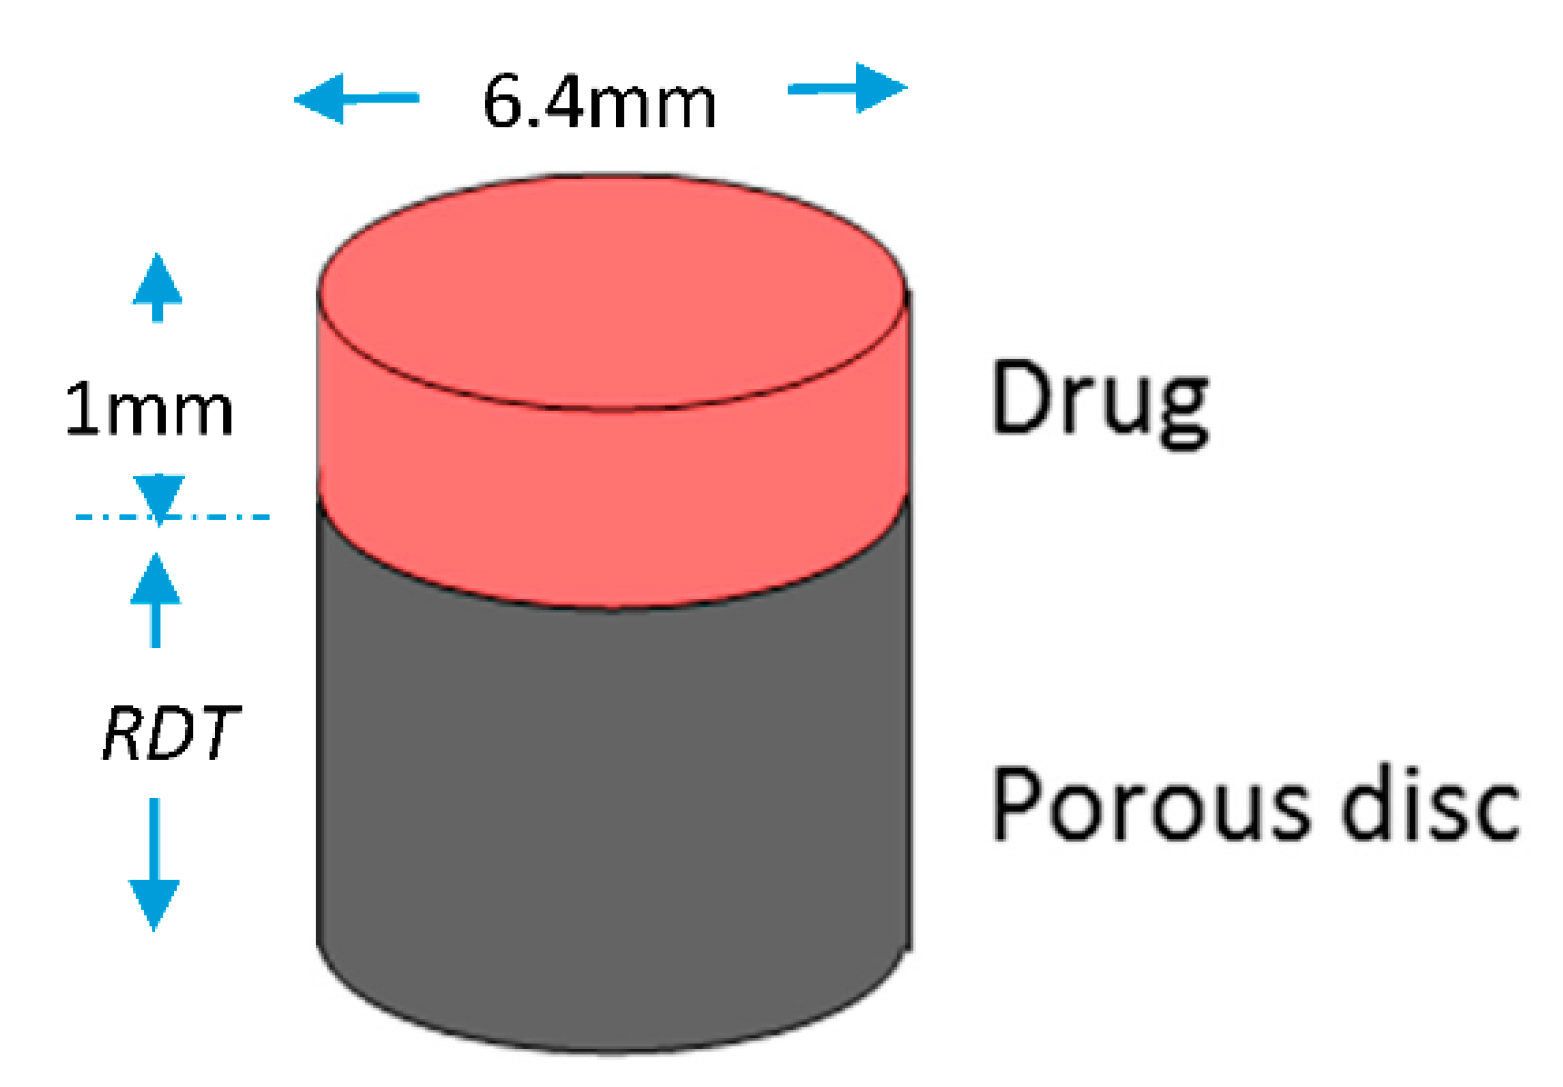
  • the porosity of the tissue (ϕ),
  • the thickness of the tissue (Remaining Dentinal Thickness, RDT),
  • the initial concentration (M0) of the substances to be diffused,
  • the molecular size of the substances to be diffused, i.e., their Diffusion Coefficient and
  • the consumption rate (R) of the diffusate at the pulpal side
on the transport characteristics through an enclosed dentinal disc.
The porous disc is considered to be initially full with dentinal fluid, i.e., a fluid that has the thermophysical properties of water. In Figure 5, the computational domain is schematically presented. The disc is cylindrical with a cross-section area of 32 mm2, while the diffusate occupies a volume of 32 mm3.
The permeability of porous media is usually expressed as a function of certain physical properties of the interconnected system, such as porosity and tortuosity. Although it is natural to assume that permeability values depend on porosity, an appropriate relationship is not simple to be determined, since this would require a detailed knowledge of size distribution and spatial arrangement of the pore channels in the porous medium. For instance, two porous systems can have the same porosities but different permeabilities. One of the most widely accepted and simplest models for the permeability–porosity relationship is the Kozeny–Carman (KC) model, which provides a link between media properties and flow resistance in pore channels. In this study, we apply the general Poiseuille equation in a straight channel with a generic cross-sectional shape [27]:
U c h a n n e l = A a 1 n d p d x
where A is the generic cross-sectional area of the micro-channel and a is a dimensionless geometric factor. Classical derivations of the KC model [28,29] consider the case of a circular cross-section as a starting point in Equation (1), i.e., A/a = R2/8. They extend and adapt Equation (1) to the equivalent channel model of the porous body by taking into consideration the effects of (i) the effective tortuous path, (ii) the effective volume and (iii) the concept of effective radius R:
U = c R 2 8 φ τ 1 n d p d x
where c (=2 for cylindrical micro-pores) was introduced as an empirical geometrical parameter, ϕ is the porosity, τ the tortuosity defined as the square of the ratio between the effective channel length Le due to the tortuous path and the length L of the porous body (τLe/L). Comparison of Equation (2) with Darcy’s law gives the following expression for defining the permeability (k) (Equation (3)):
k = c R 2 8 φ τ
To study the diffusion process, we employ substances, whose molecular sizes are the same as those of proteins or therapeutic agents used in dental clinic practice. The radius Rmin and the diffusion coefficient D of a protein can be estimated by Equations (4) and (5) [30]:
R min = 0.066 M w 1 / 3
where Rmin is given in nanometers and the molecular weight Mw in Daltons (Da)
D = k T 6 π μ R s
where k = 1.38 × 10⁻¹⁶ g·cm2·s−2·K−1 is the Boltzmann constant and T the absolute temperature. k is given here in centimeter–gram–second units because D is expressed in centimeter–gram–second, while μ is the solute viscosity in g/(cm·s). In our case, it is assumed to be that of water, as its thermophysical properties are very close to those of the actual dentinal fluid [31]. Rs, called Stokes radius, represents the radius of a smooth sphere that would have the same frictional coefficient f with a protein and is expressed in centimeters in this equation. Assuming that f equals fmin, i.e., the minimal frictional coefficient that a protein of a given mass would obtain if the protein were a smooth sphere of radius Rmin, in Equation (5), Rs can be replaced by Rmin.
In this study, three different diffusates, which cover a wide range of molecular sizes that correspond to the size of actual bioactive molecules, are considered. The radius Rs of the molecules tested is in the range of 2.2–22.0 nm and consequently the corresponding diffusion coefficient, D, in water at 37 °C, is in the range of 1.36–0.14 × 10⁻¹⁰ m2/s. For example, bone morphogenetic protein (BMP-7) is a bioactive protein used in the dental clinic practice with approximately 50 kDa molecular weight and Rs of 2.2 nm. To conduct a parametric study, three initial mass concentration values for each diffusing substance are employed, i.e., 0.10, 0.05 and 0.01 mg/mL following our previous study [17].
The parametric study was performed using three porosity values (ϕ), namely 5%, 10% and 20%, which can be regarded to adequately represent the porosity values of the dentin tissue, as it can be seen from Section 2. Employing the Design Exploration features of the ANSYS Workbench® package (18, ANSYS, Canonsburg, PA, USA) and following the Design of Experiments (DOE) methodology, a set of “computational experiments” was initially designed. The DOE methods allow the designer to extract as much information as possible from a limited number of test cases and makes the method ideal for CFD models that are significantly time-consuming [32]. Eventually, the temporal and spatial concentration at the pulpal side of the disc will be calculated using the computational procedure. A summary of the design variables range is given in Table 1.
A grid dependence study was also performed for the case involving the diffusate with the highest diffusion coefficient value. This leads to the construction of an unstructured mesh of 1 × 10⁶ of tetrahedral elements, while the porosity model is used to account for the space occupied by dentinal tubules per unit area in the disc. All simulations were run in transient mode, while the total simulation time for each run varied in the range of 10–25 h, depending on the consumption rate (R) applied. A time-step dependence study was also performed (i.e., time steps in the range of 5–10 s). Zero flux was inposed as boundary conditions at all the walls of the computational domain, while, when a consumption rate is employed, negative flux is imposed at the pulpal side. For the discretization scheme, the High Resolution one was employed and as for the transient scheme, a Second Order Backward Euler scheme was used. A high-performance unit for parallel computing, which runs on a Gentoo Linux distribution, was used.

4. Results

Since the behavior observed among the numerous computational results of the present study is similar, only typical examples of the effect of each key design parameter on the molar concentration at the pulpal side of the dentinal discs (CL) are presented. The general case, i.e., when a consumption rate is imposed at the pulp, is presented first. For the simulations concerning the effect of the other parameters, no consumption is assumed, i.e., R = 0.

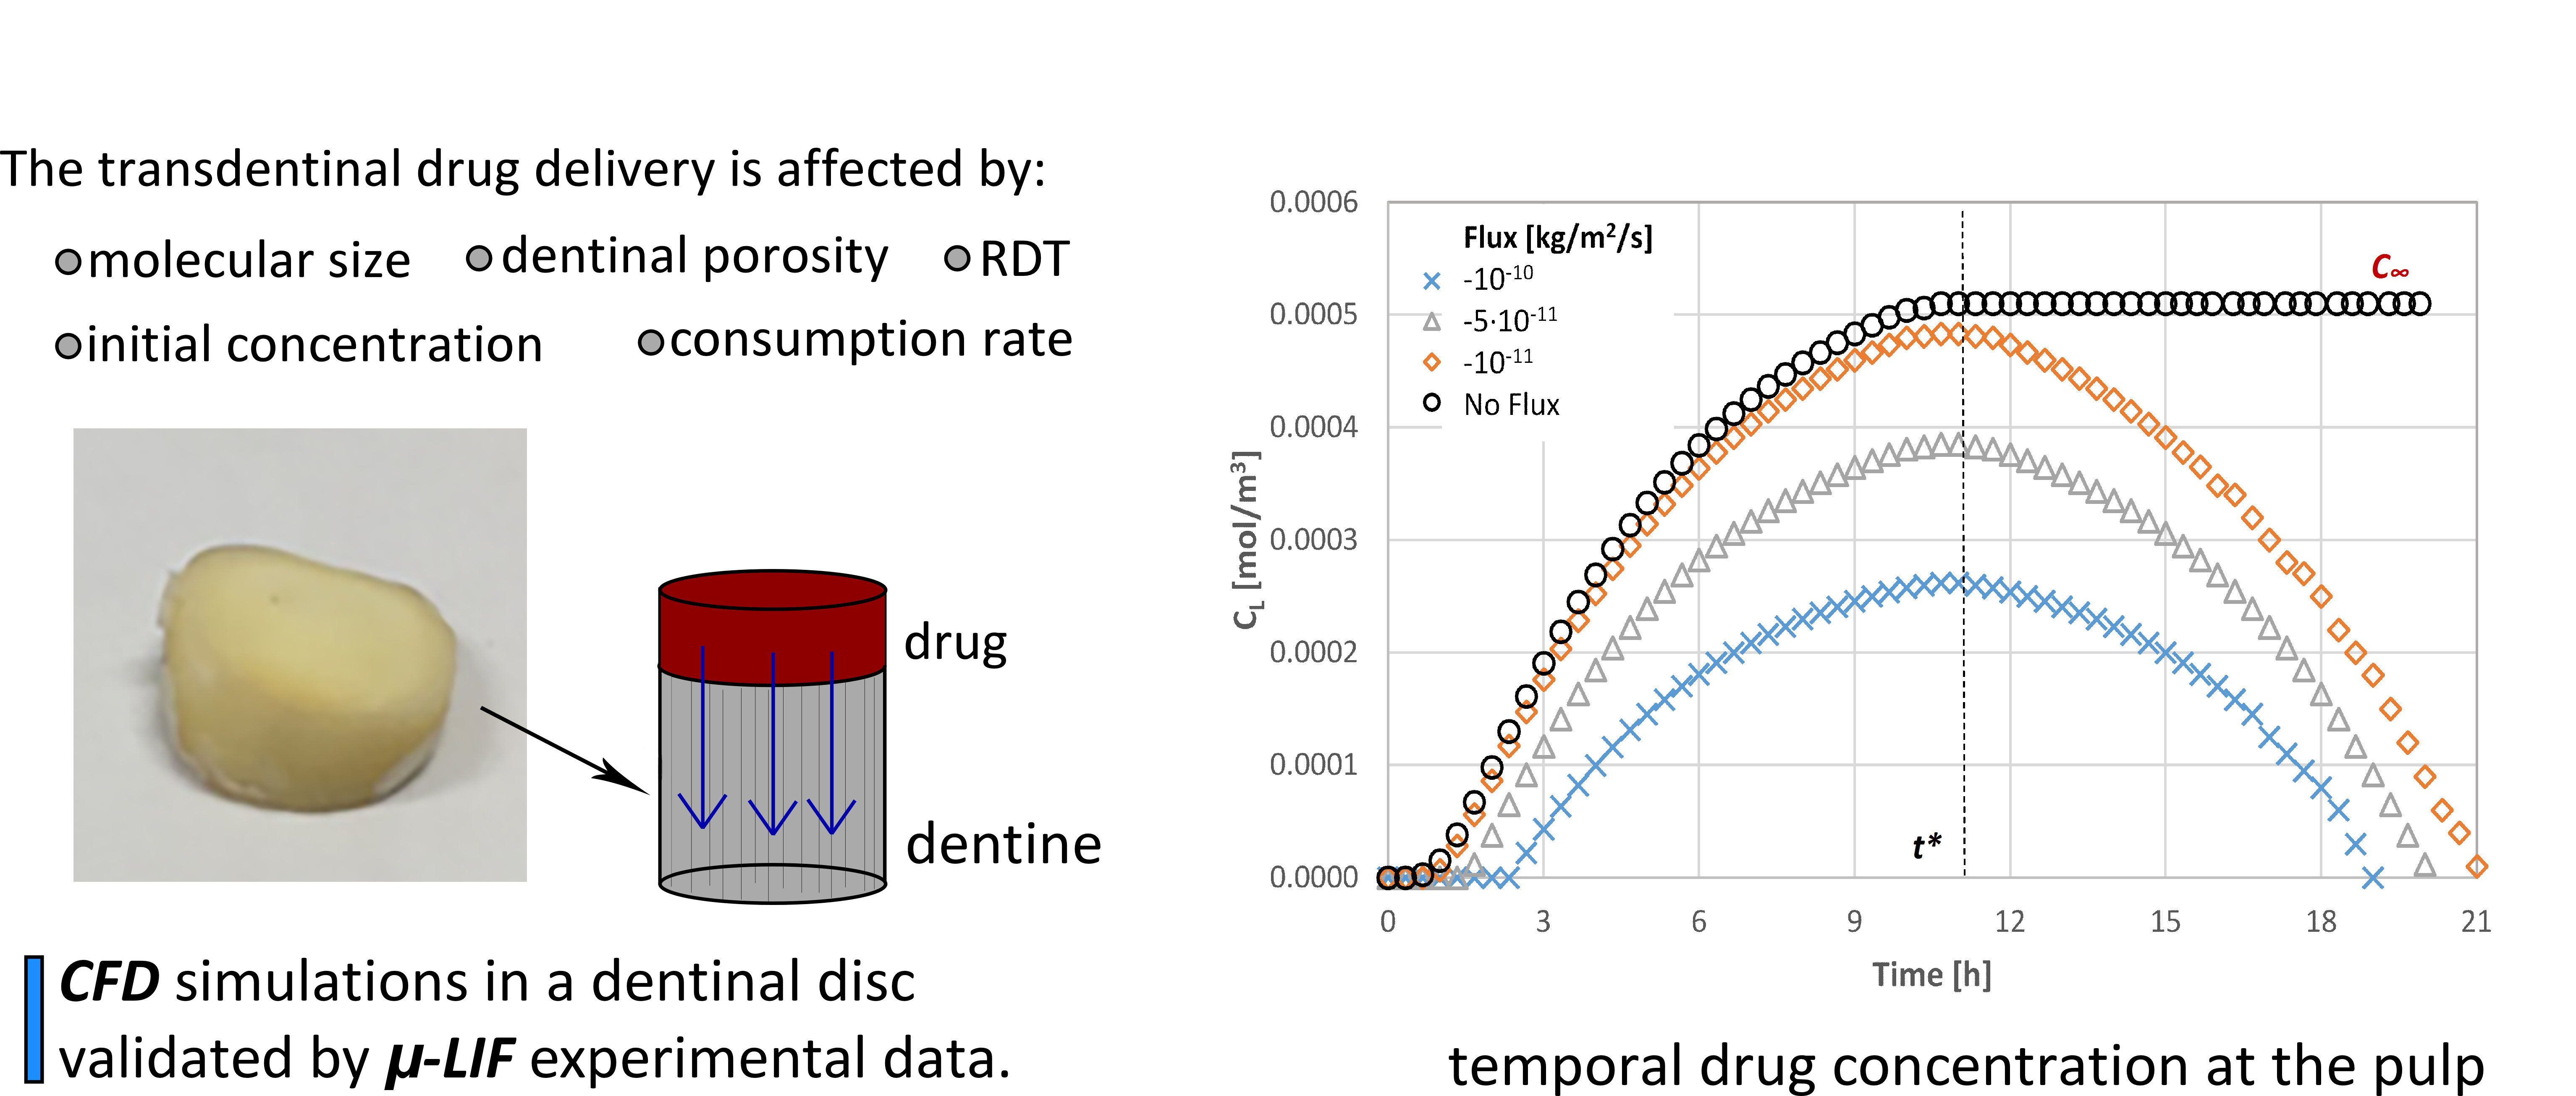
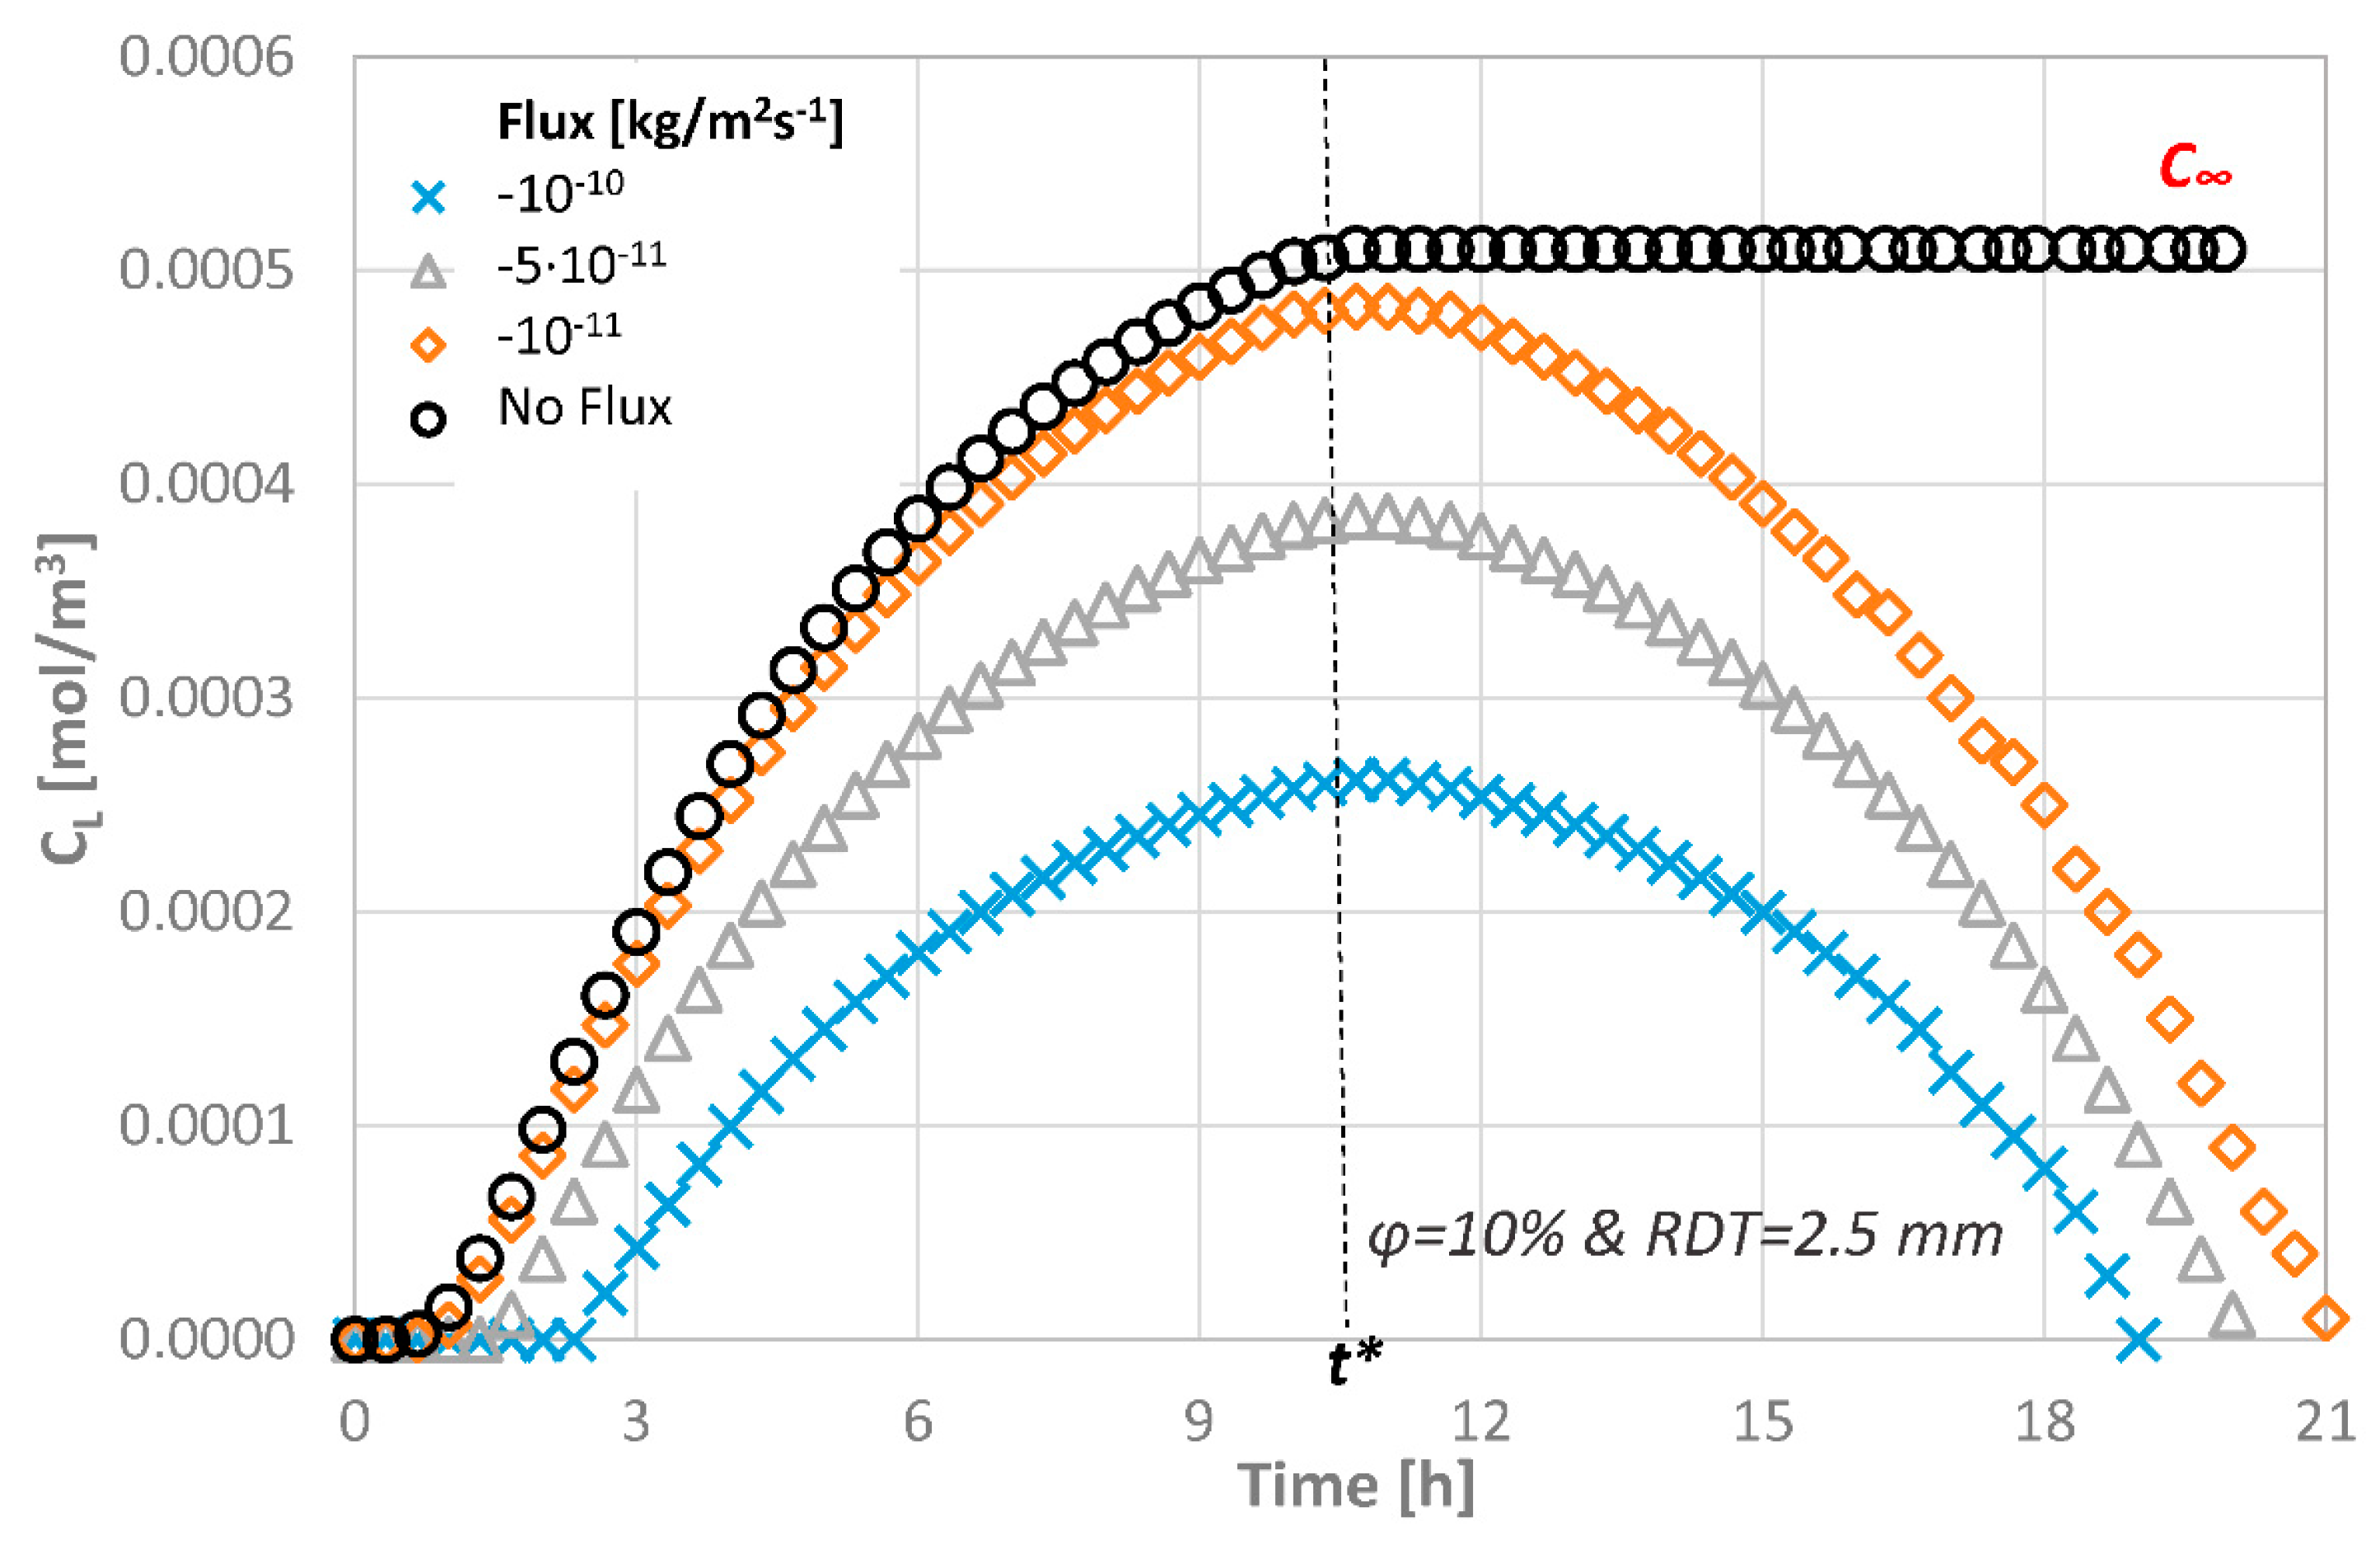
4.1. Effect of the Agent Consumption Rate at the Pulpal Side

Figure 6 shows the concentration at the pulpal side for the various consumption rates applied, when an agent with Rs = 2.2 nm and M0 = 0.10 mg/mL is employed at the top of the dentinal disc of ϕ = 10%. As it can be seen, the concentration value at the pulpal side is lower than the initial one regardless of the consumption rate applied. The concentration value may exhibit 100% decrease when the lowest and the highest consumption rates are compared. During the first time steps of the agent application on the disc, the concentration gradient along the disc thickness is high and the concentration at the pulpal side CL increases until t* = 1 (i.e., dashed line), if the agents are consumed, and, after this critical time, equilibrium cannot be reached. On the contrary, as time passes, the agent is being continuously consumed, which means that the concentration at the pulp will decrease until the agent disappears.
It is expected that, after a few hours, the tissue will be free of the agent presence. The total estimated time for this to happen depends on the consumption rate, the porosity of the dentinal disc and the initial concentration. For a consumption rate of 10−10 kg/(m2·s), the total estimated time for an agent of Rs = 2.2 nm to be fully consumed is approximately 18 h in a porous disc of ϕ = 10%.
From Figure 6, it becomes evident that the consumption rate of the therapeutic agent does not affect the form of the curve but only the magnitude of the CL values. In order to facilitate the evaluation of the effect of the other parameters, a zero consumption rate at the pulp end is assumed for the remaining CFD simulations.

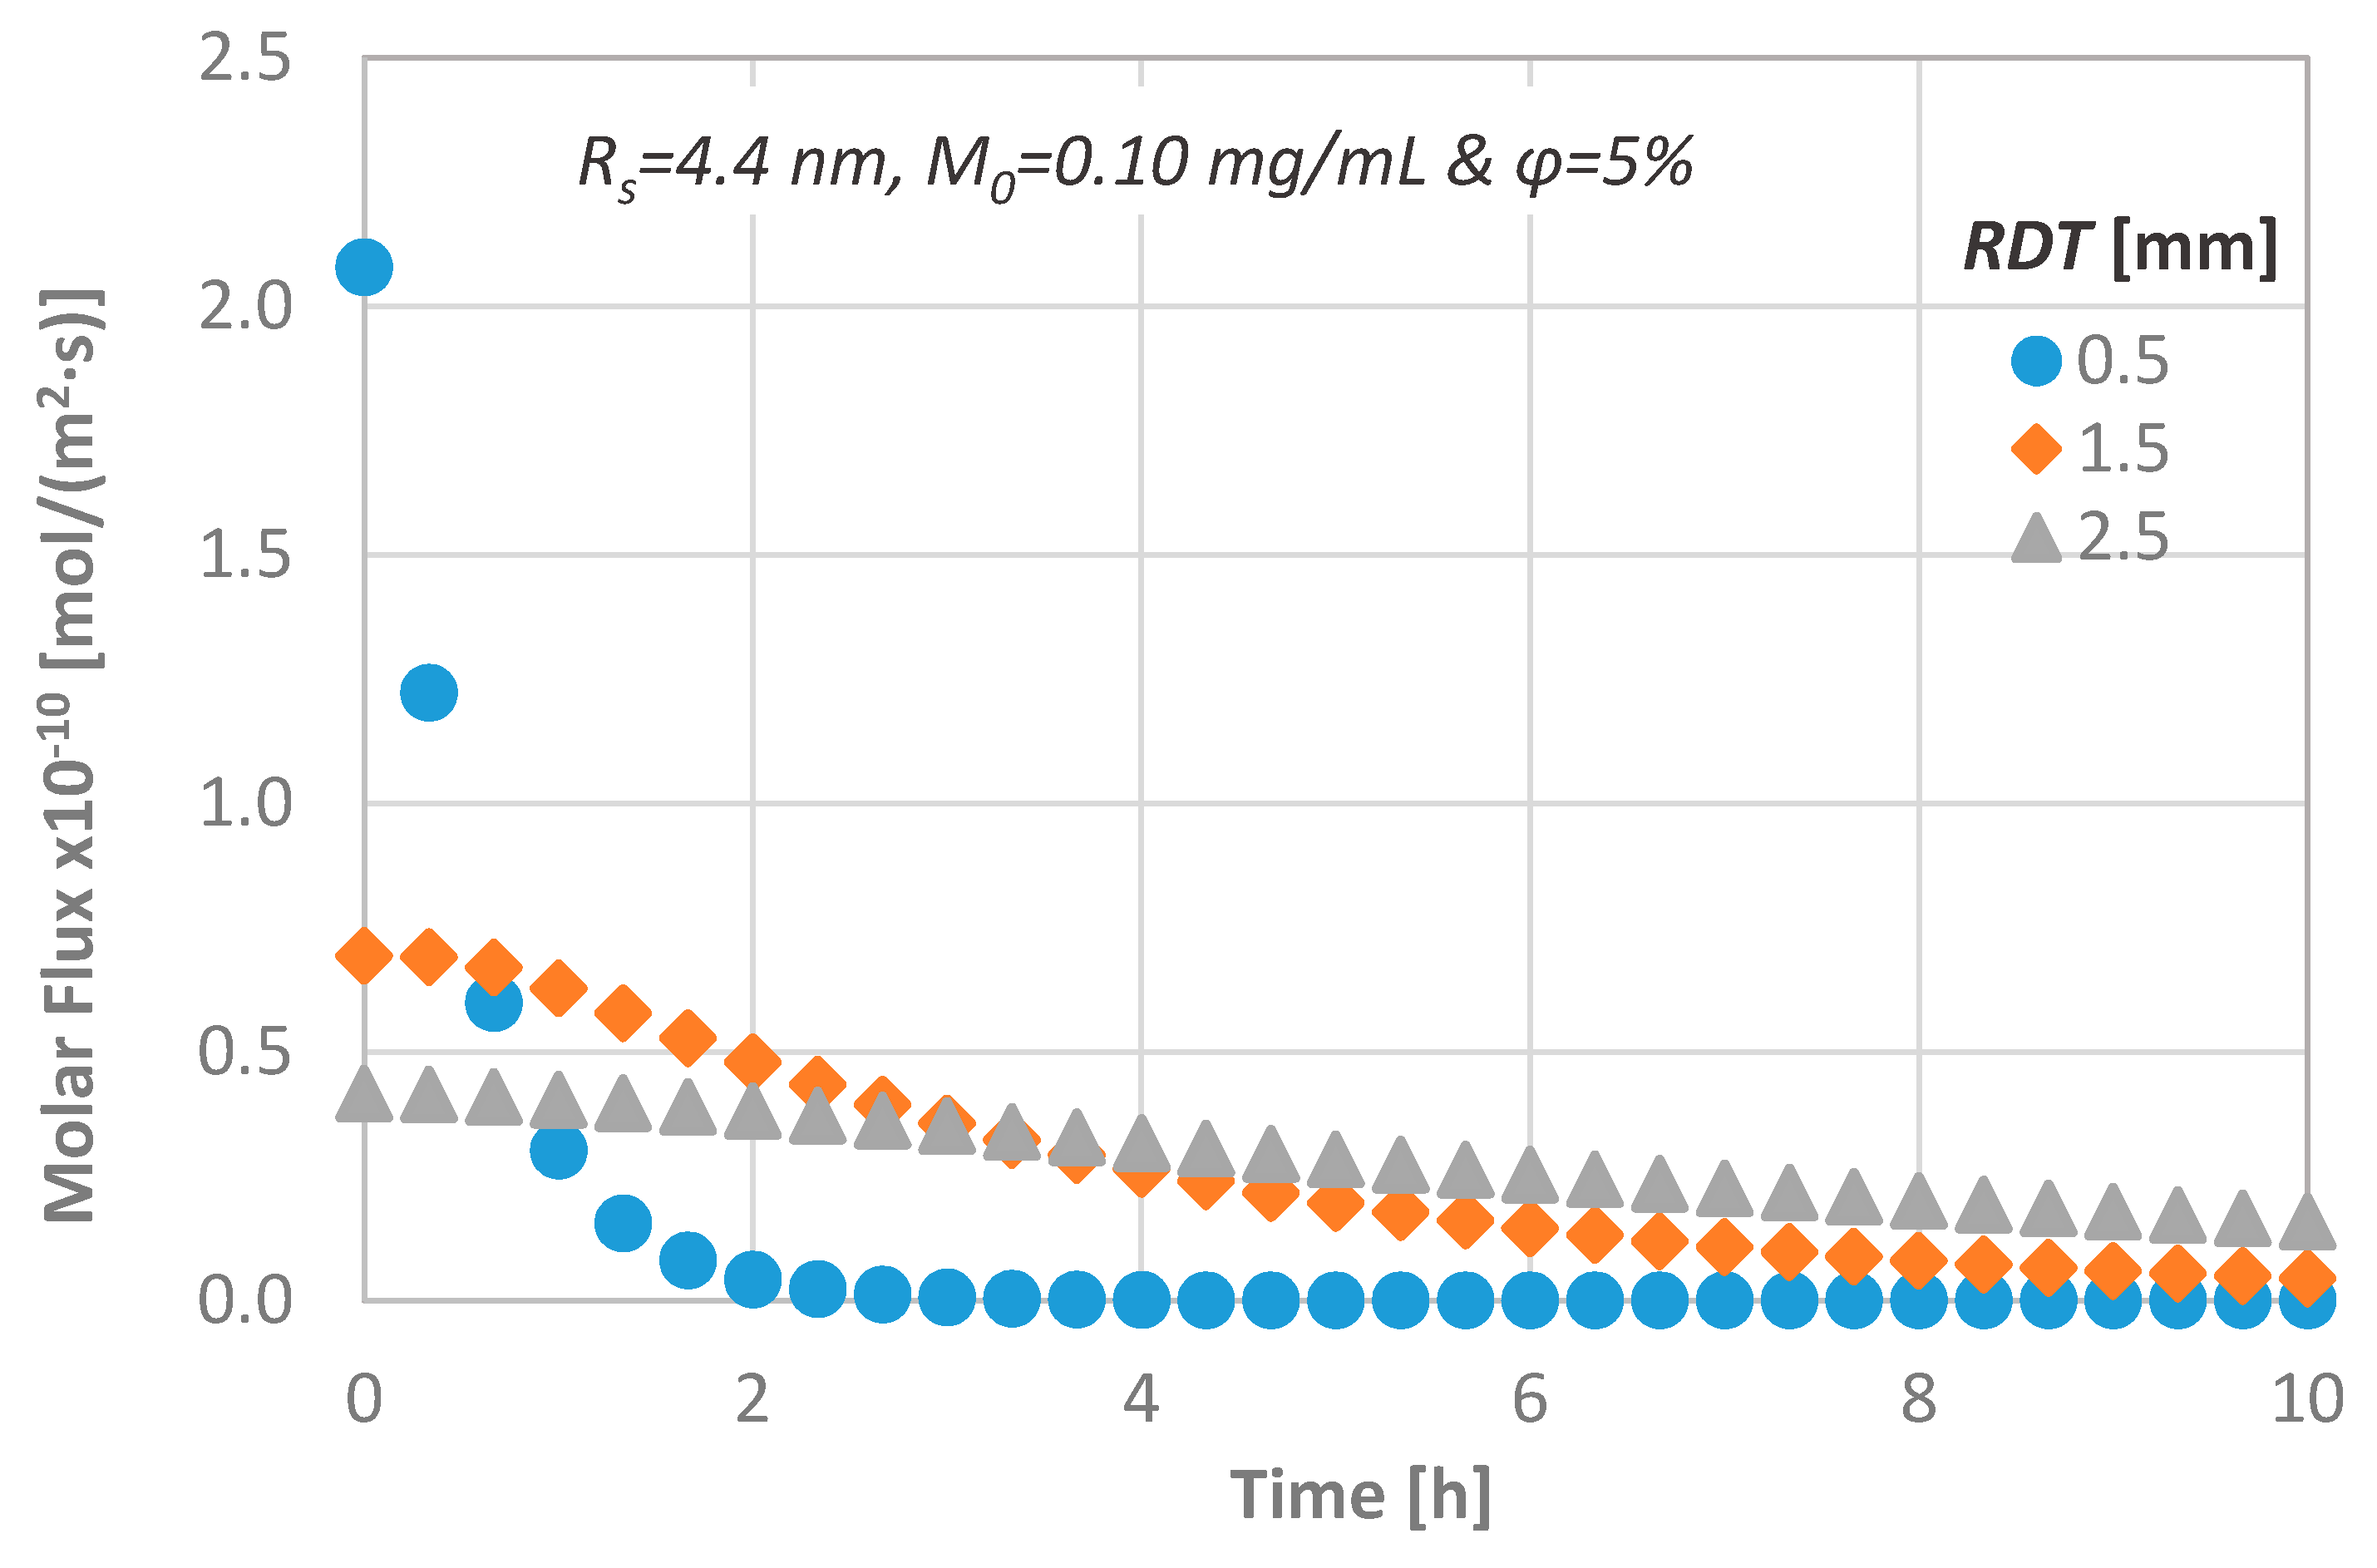
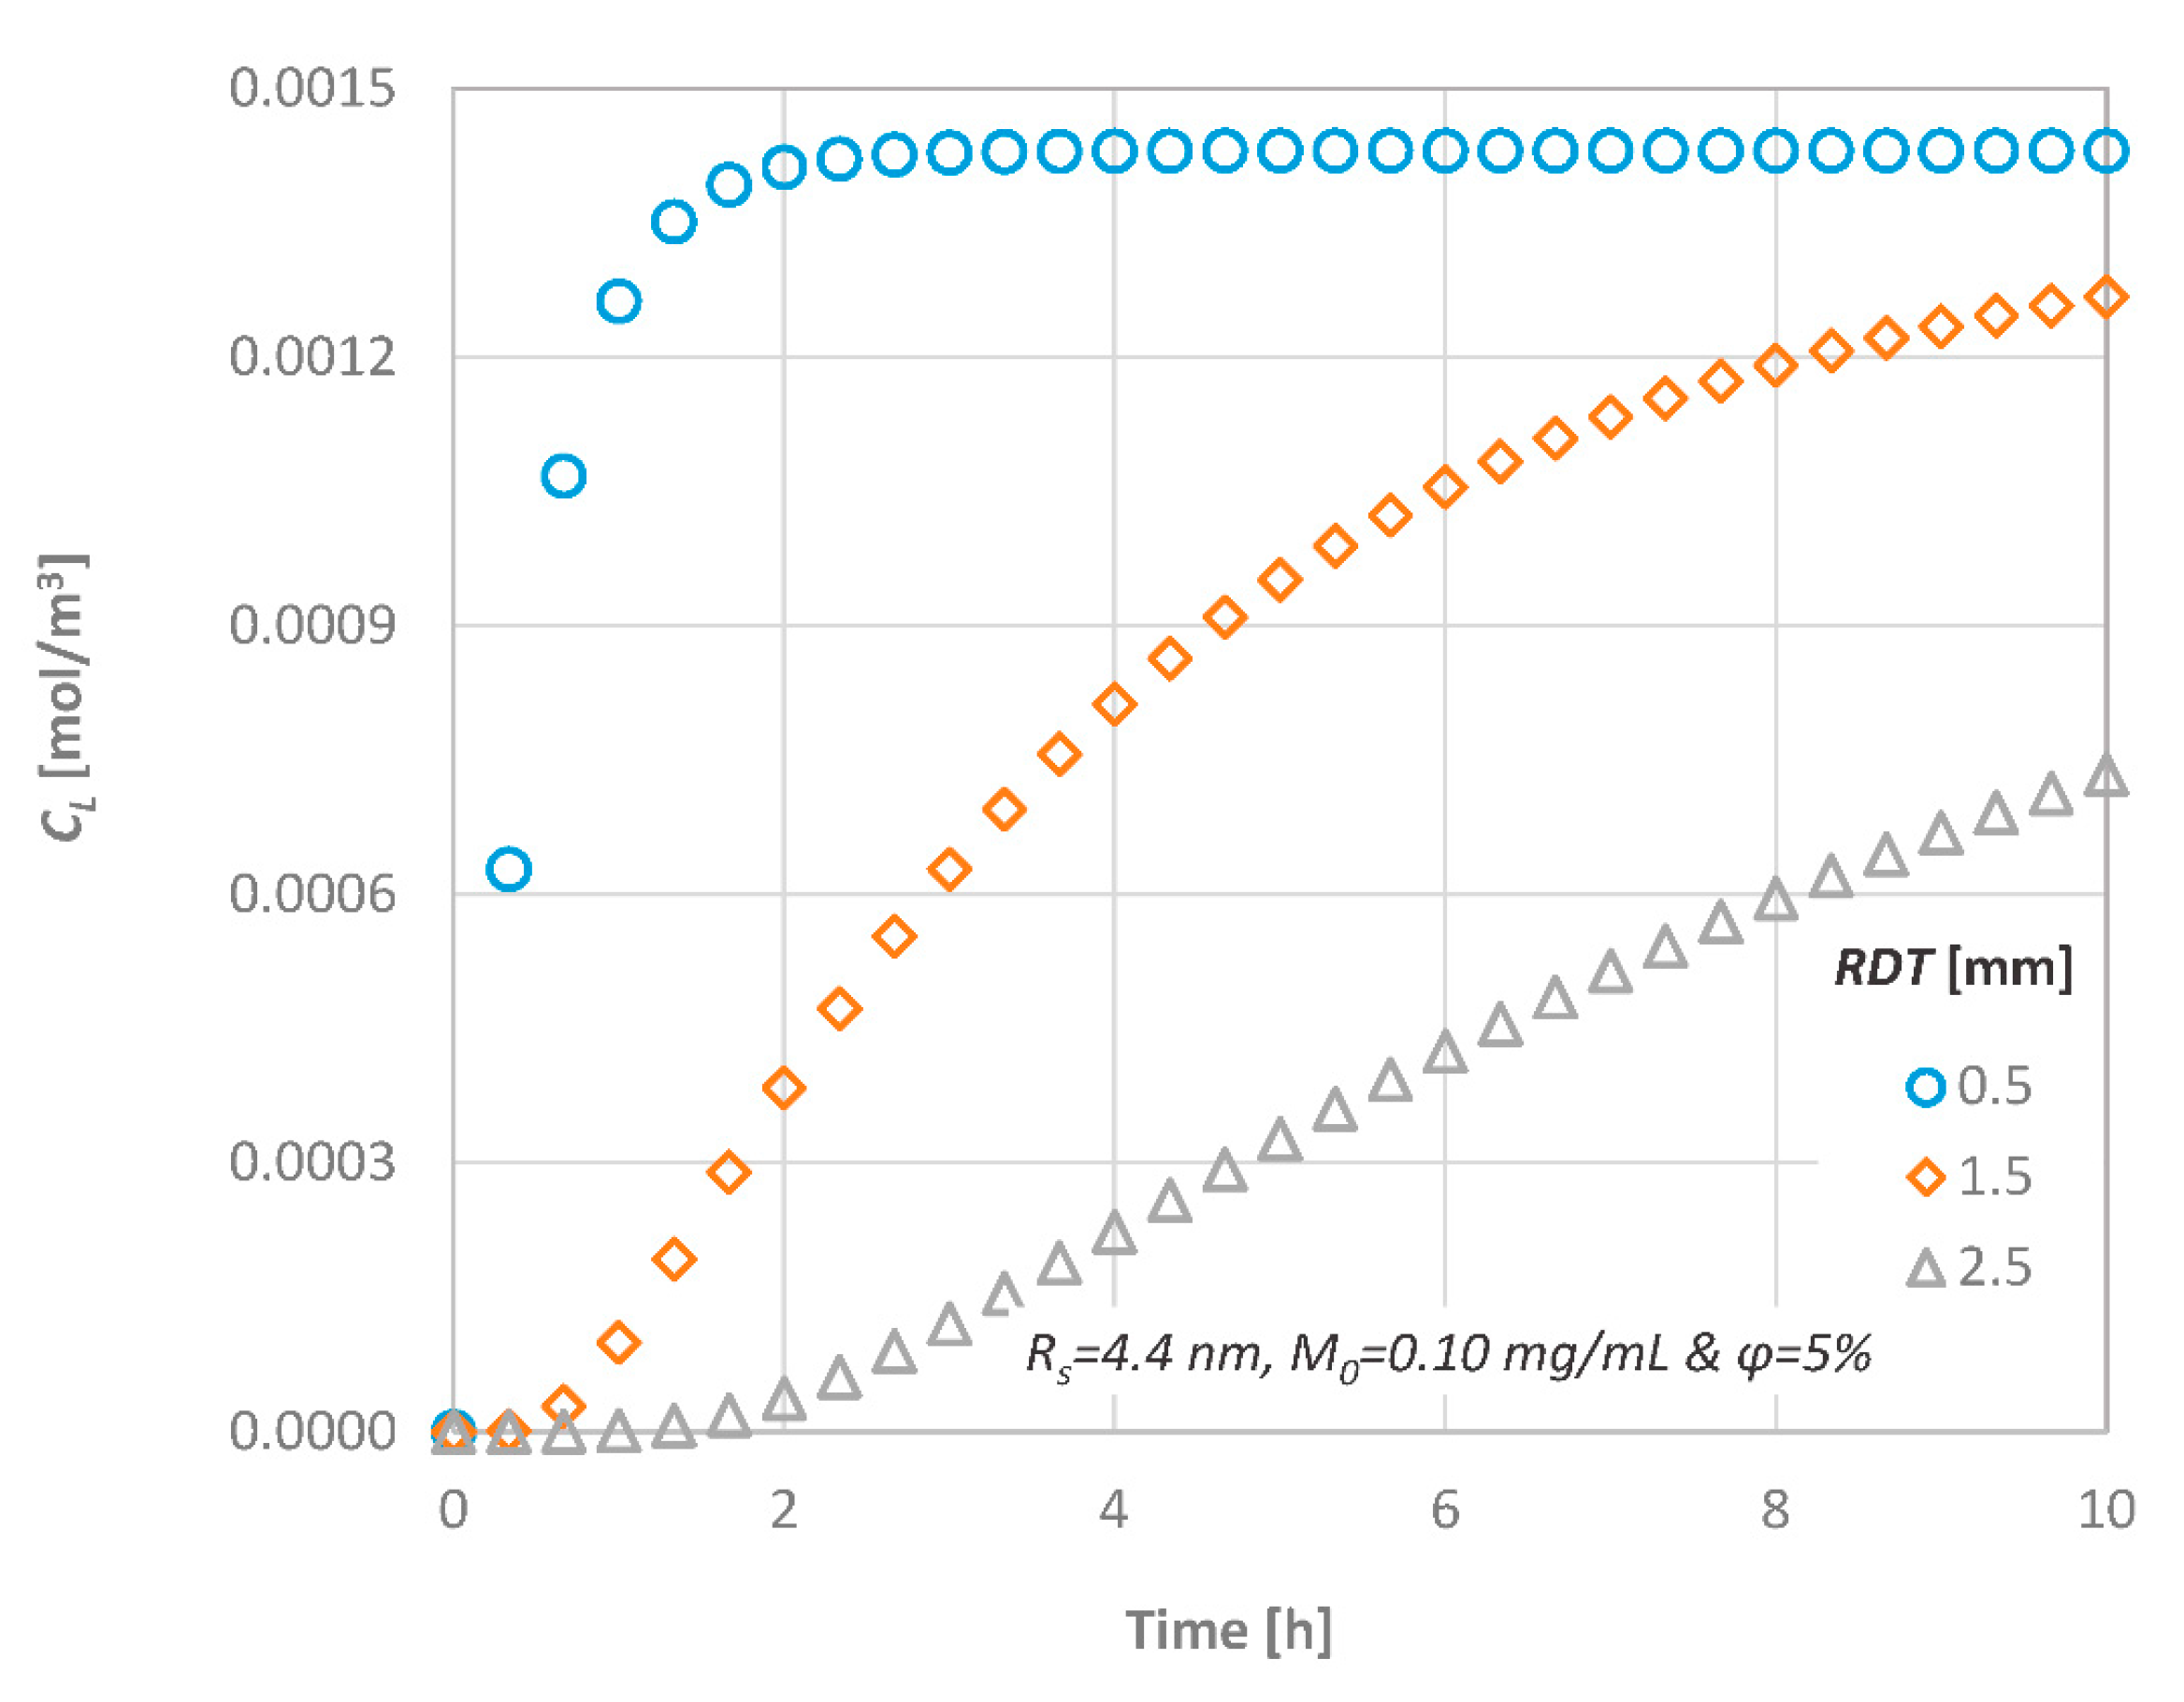
4.2. Effect of Remaining Dentin Thickness (RDT)

The effect of the RDT on the concentration at the pulpal side (CL) is shown in Figure 7, when a substance of Rs = 4.4 nm at M0 = 0.10 mg/mL is diffused through a dentinal disc of ϕ = 5%. As it is expected, since the process is considered one-dimensional, it is dominated by the diffusion length. For discs with significant low thickness, the delivery of substances to the pulp is rapid, and a steady state condition can be quickly achieved. For example, when a dentinal disc of 0.5 mm is employed, the concentration at the pulpal side reaches its final value after two hours of application. The time barrier for steady state condition can be easily estimated from the dimensionless time variable t = D/L2.
In order to gain a greater insight into the transport process through dentinal discs, the temporal molar flux is calculated and presented in Figure 8. The magnitude of the diffusional flux across the dentinal tissue is inversely proportional to the dentine thickness, an observation that agrees with the relevant literature [11,33].

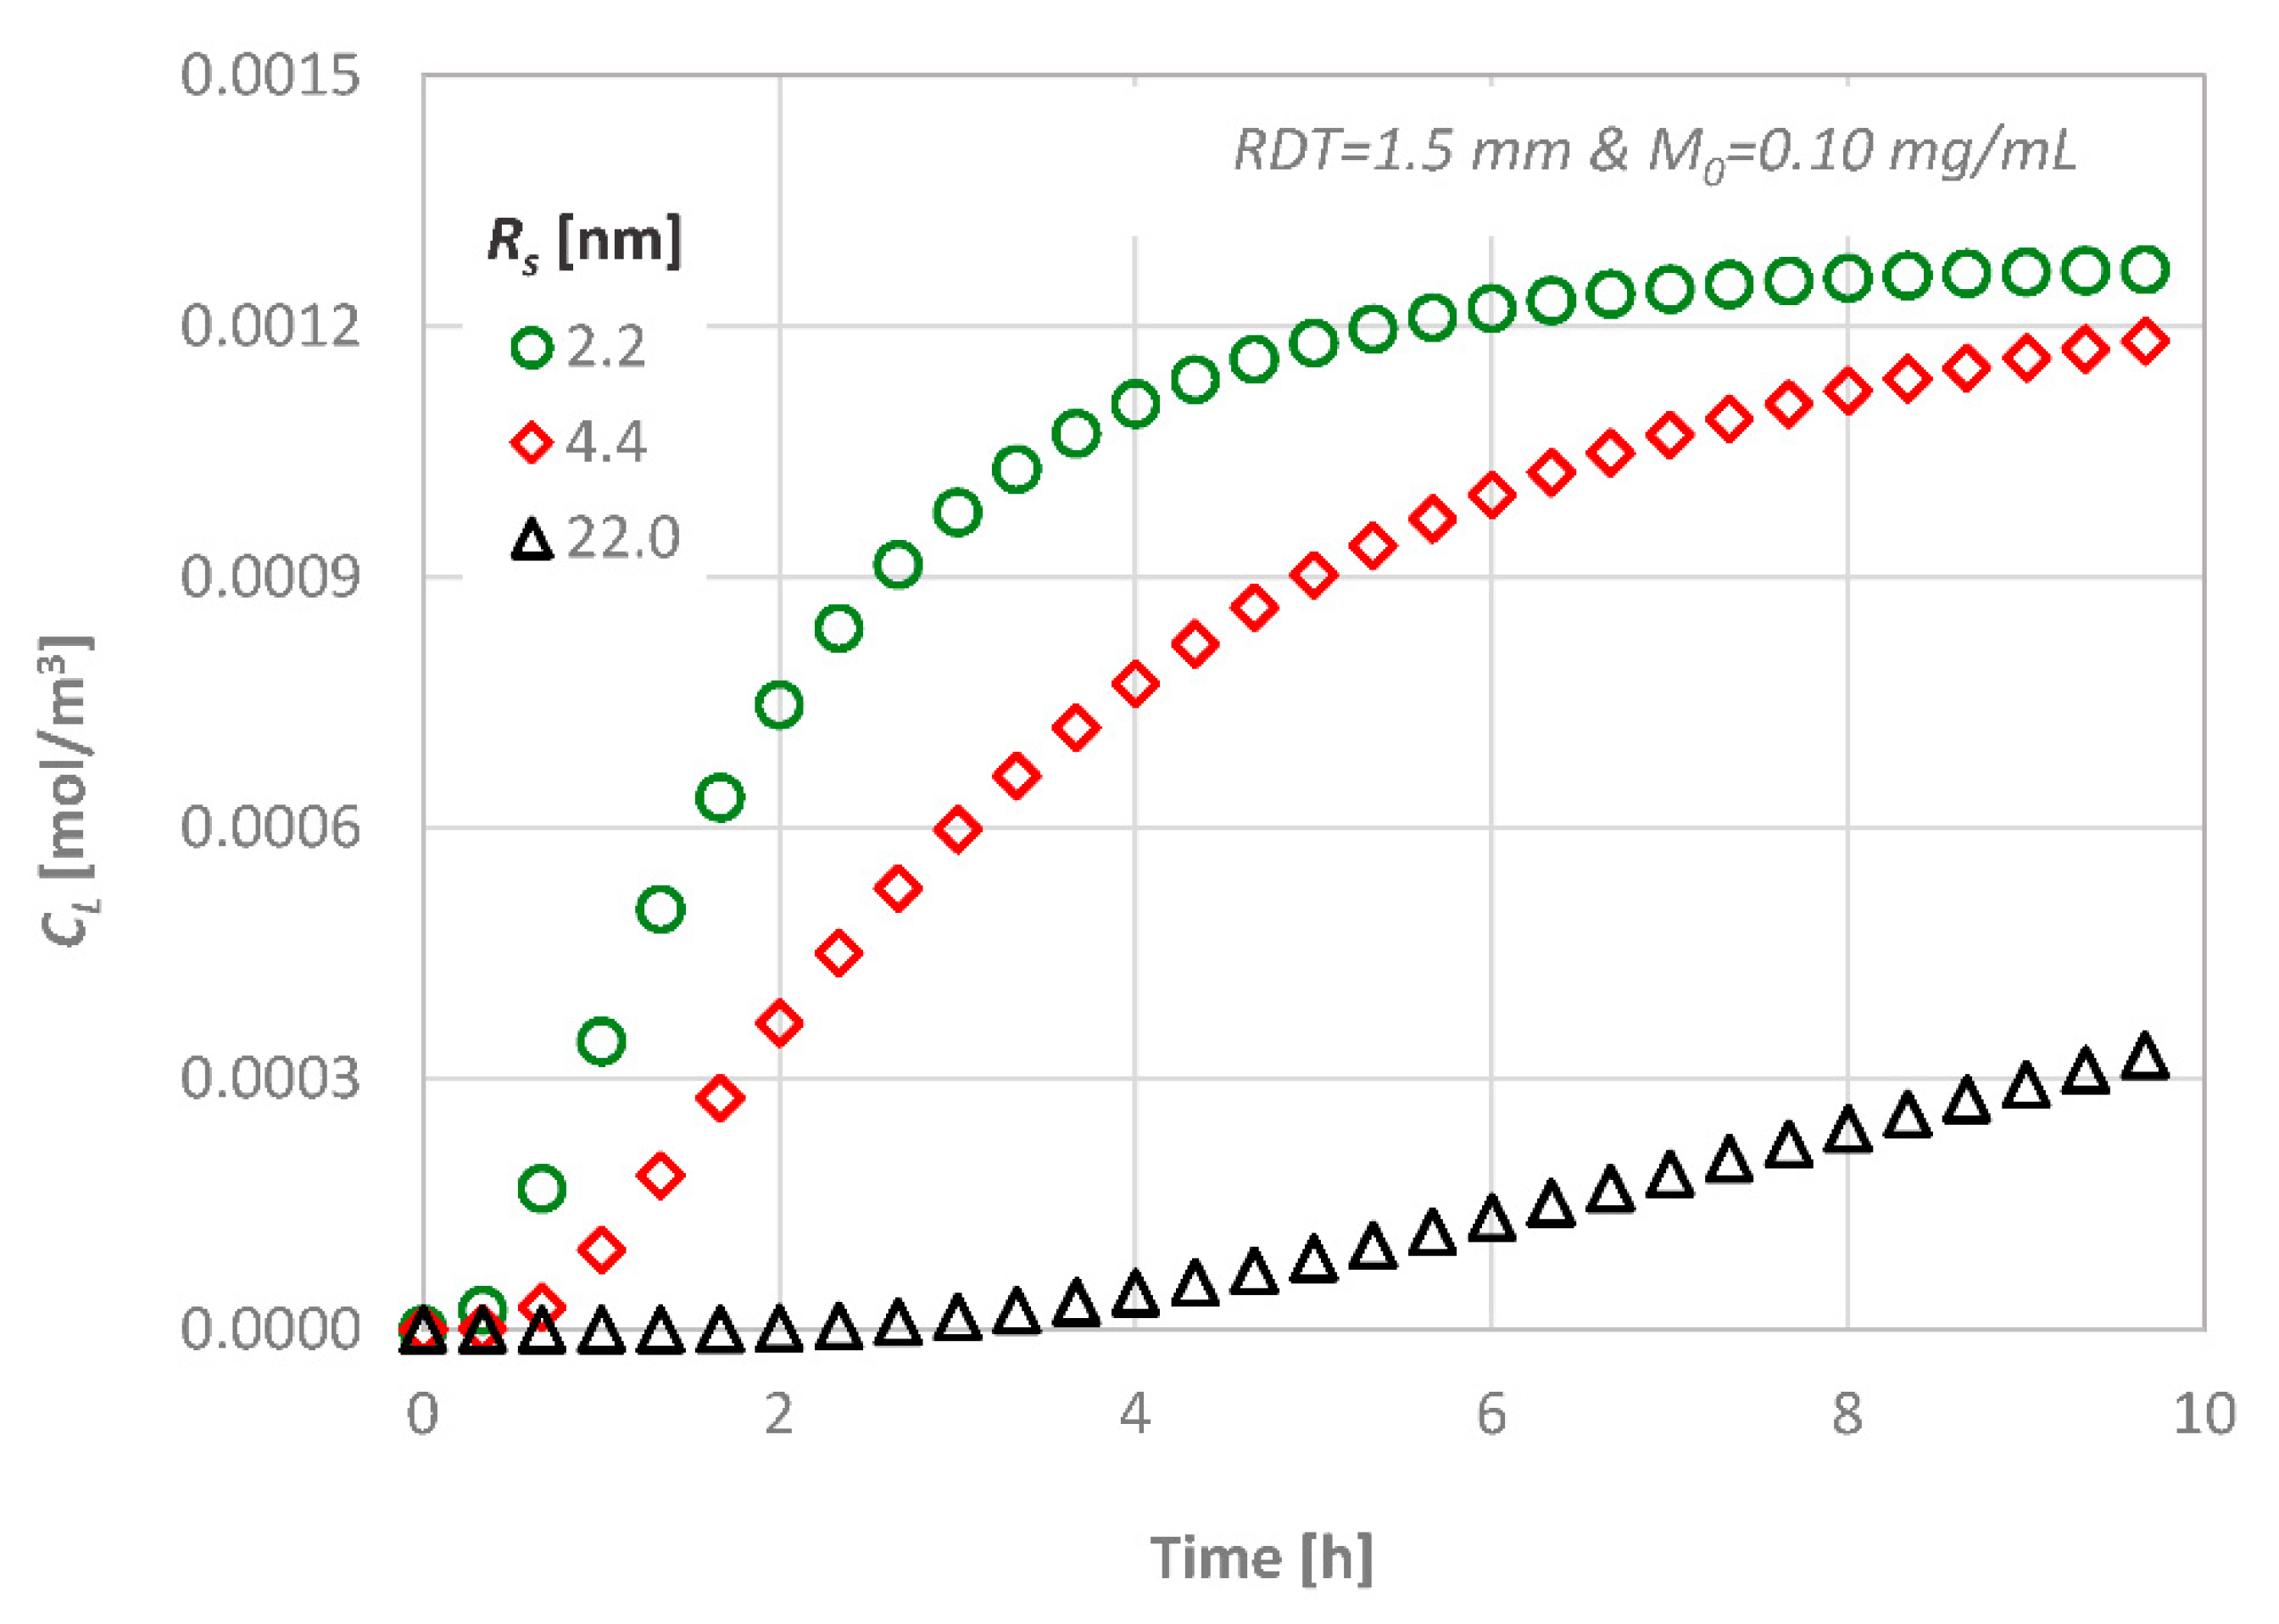
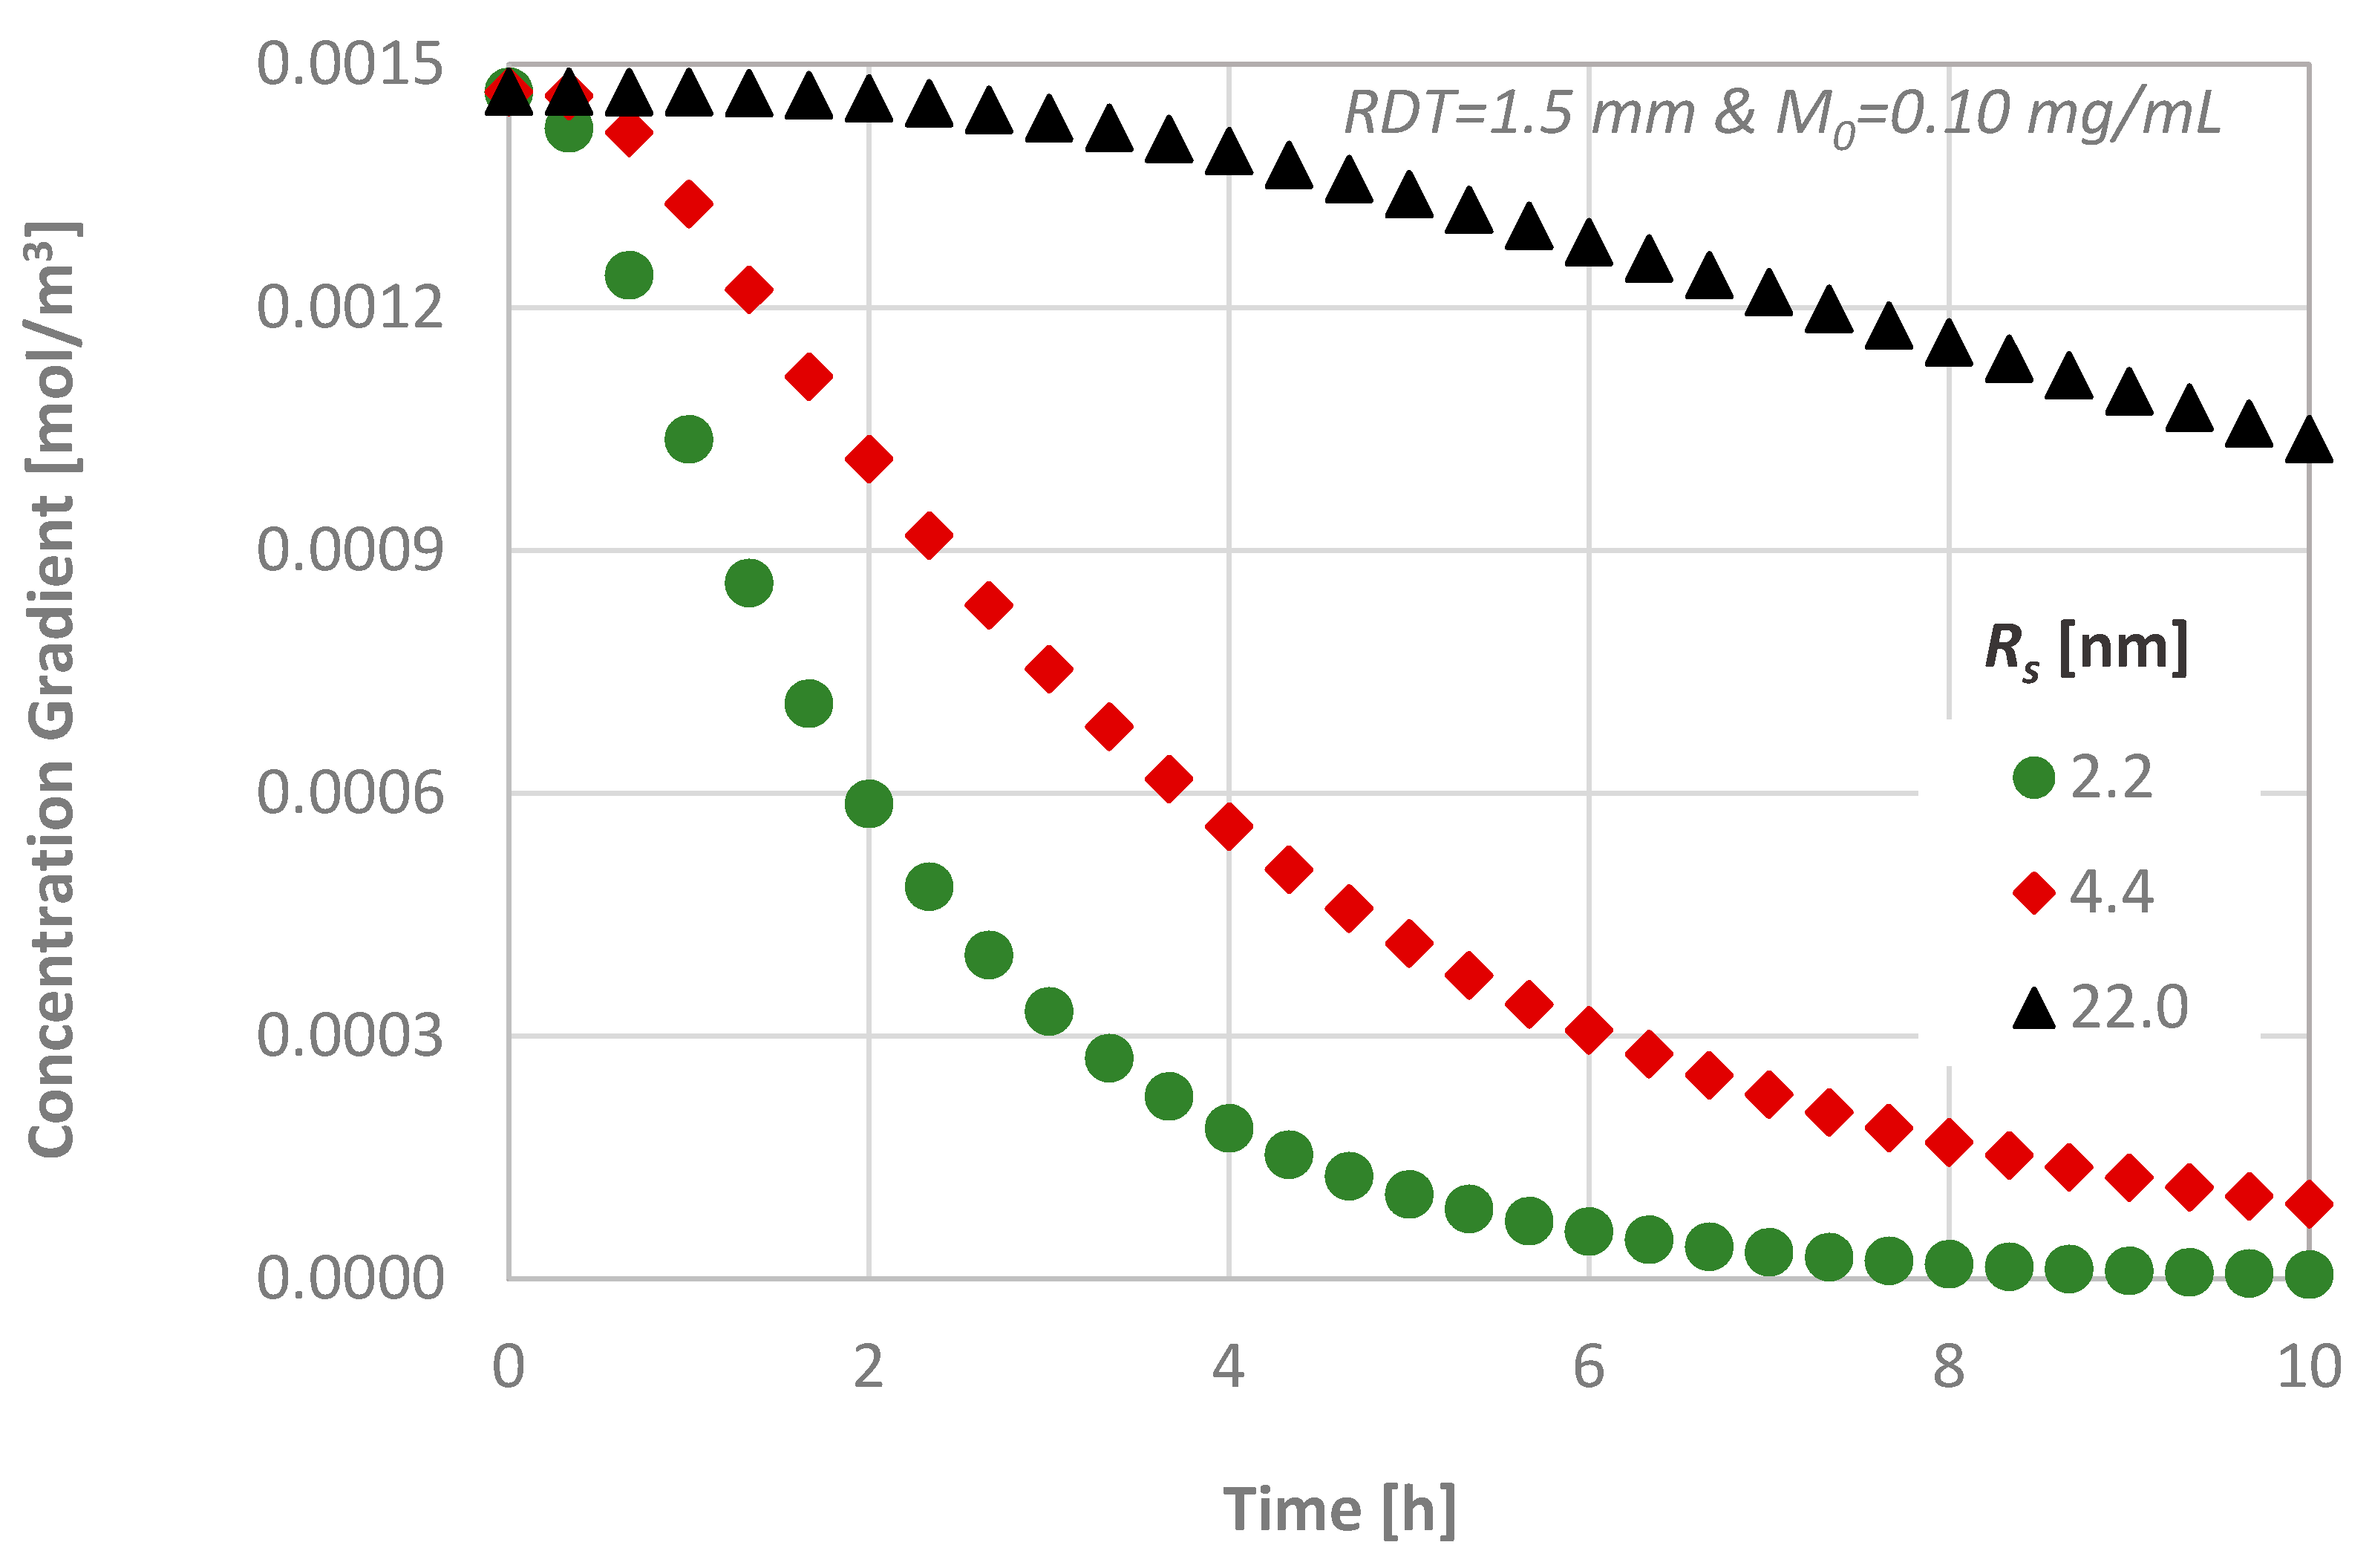
4.3. Effect of the Molecular Size

For a given dentinal disc (i.e., given RDT and porosity), the diffusion is controlled by the diffusion coefficient of each diffusing agent, while the estimated final value will be the same in all cases. The concentration variation with time at the bottom end area is presented in Figure 9 for three substances with different molecular sizes. As it is expected, substances/proteins with larger molecules penetrate at a lower rate inside the disc because their diffusion coefficient is a function of the size of the molecules as described in Section 3.2.
For the delivery of substances with different molecular sizes, the concentration gradient inside the dentinal tissue is presented in Figure 10. The molar flux is greater during the middle steps of the process, as the substance penetrates at a greater rate inside the tissue. Obviously, the substances with greater molecular sizes diffuse at a lower rate through media, and, as it can also be seen from Figure 9, it needs more than 10 h for the concentration CL of the substance with the greatest molecular size to reach steady state conditions (i.e., the concentration gradient to be zero).

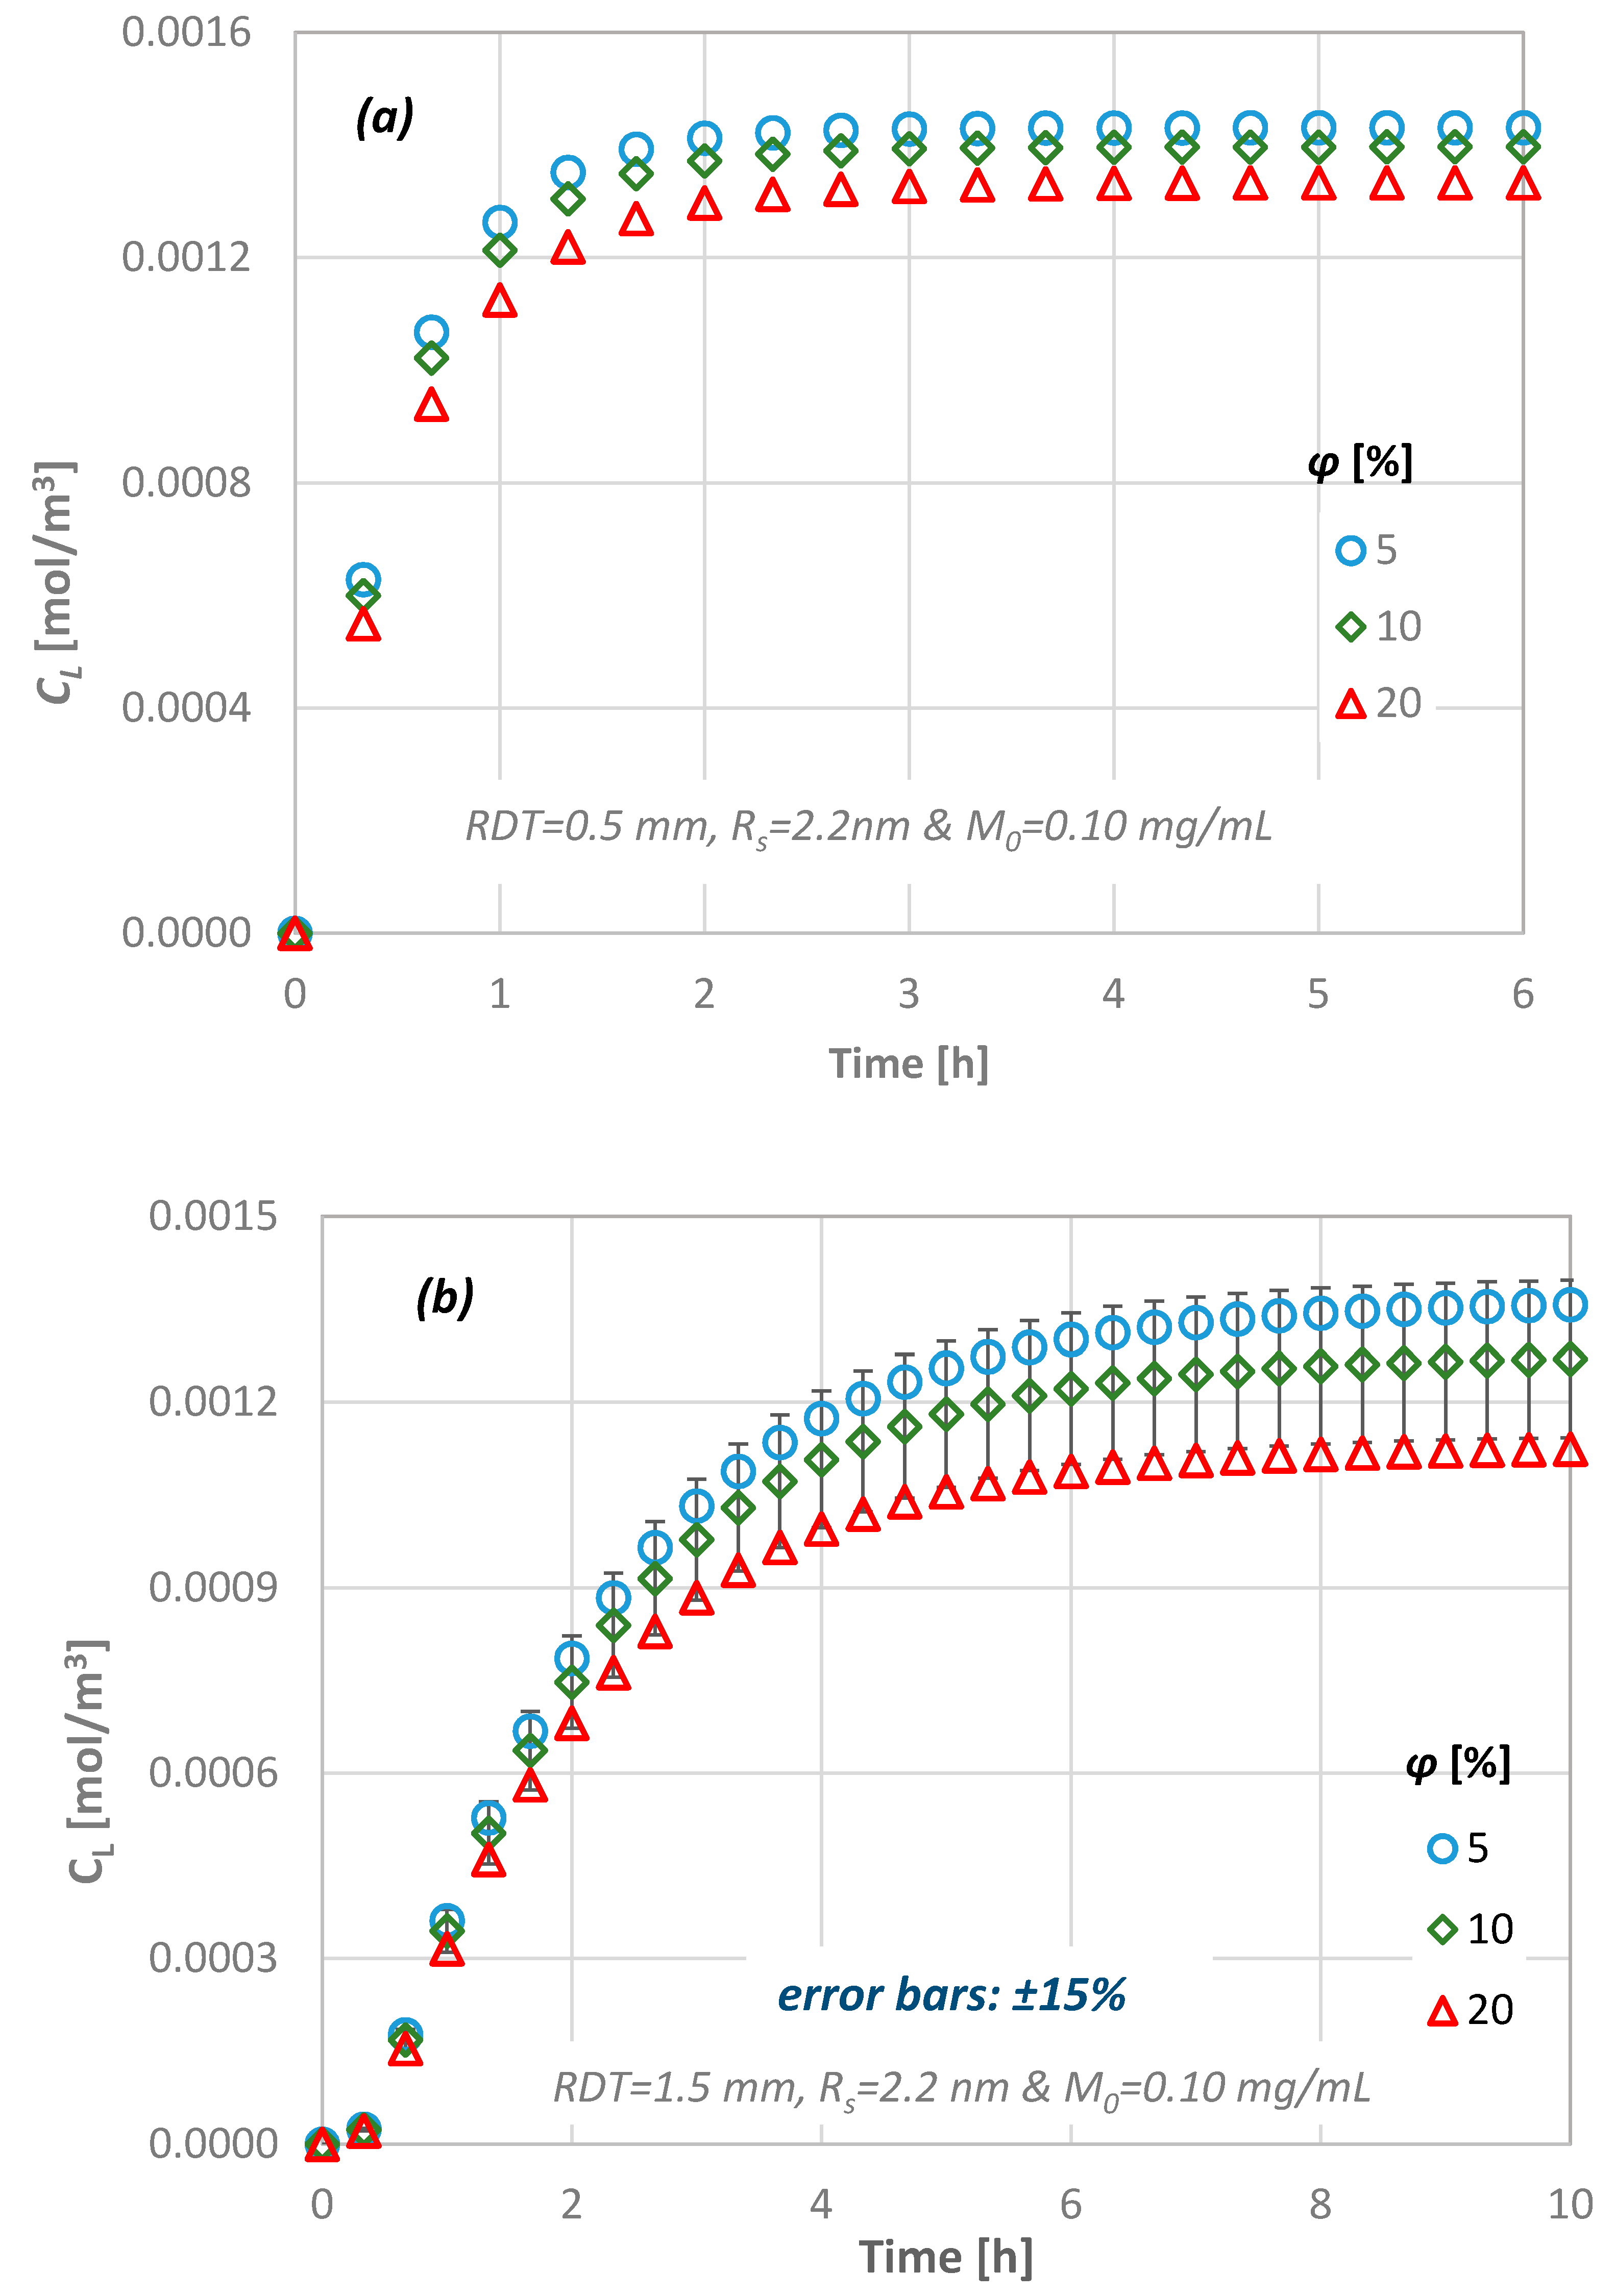
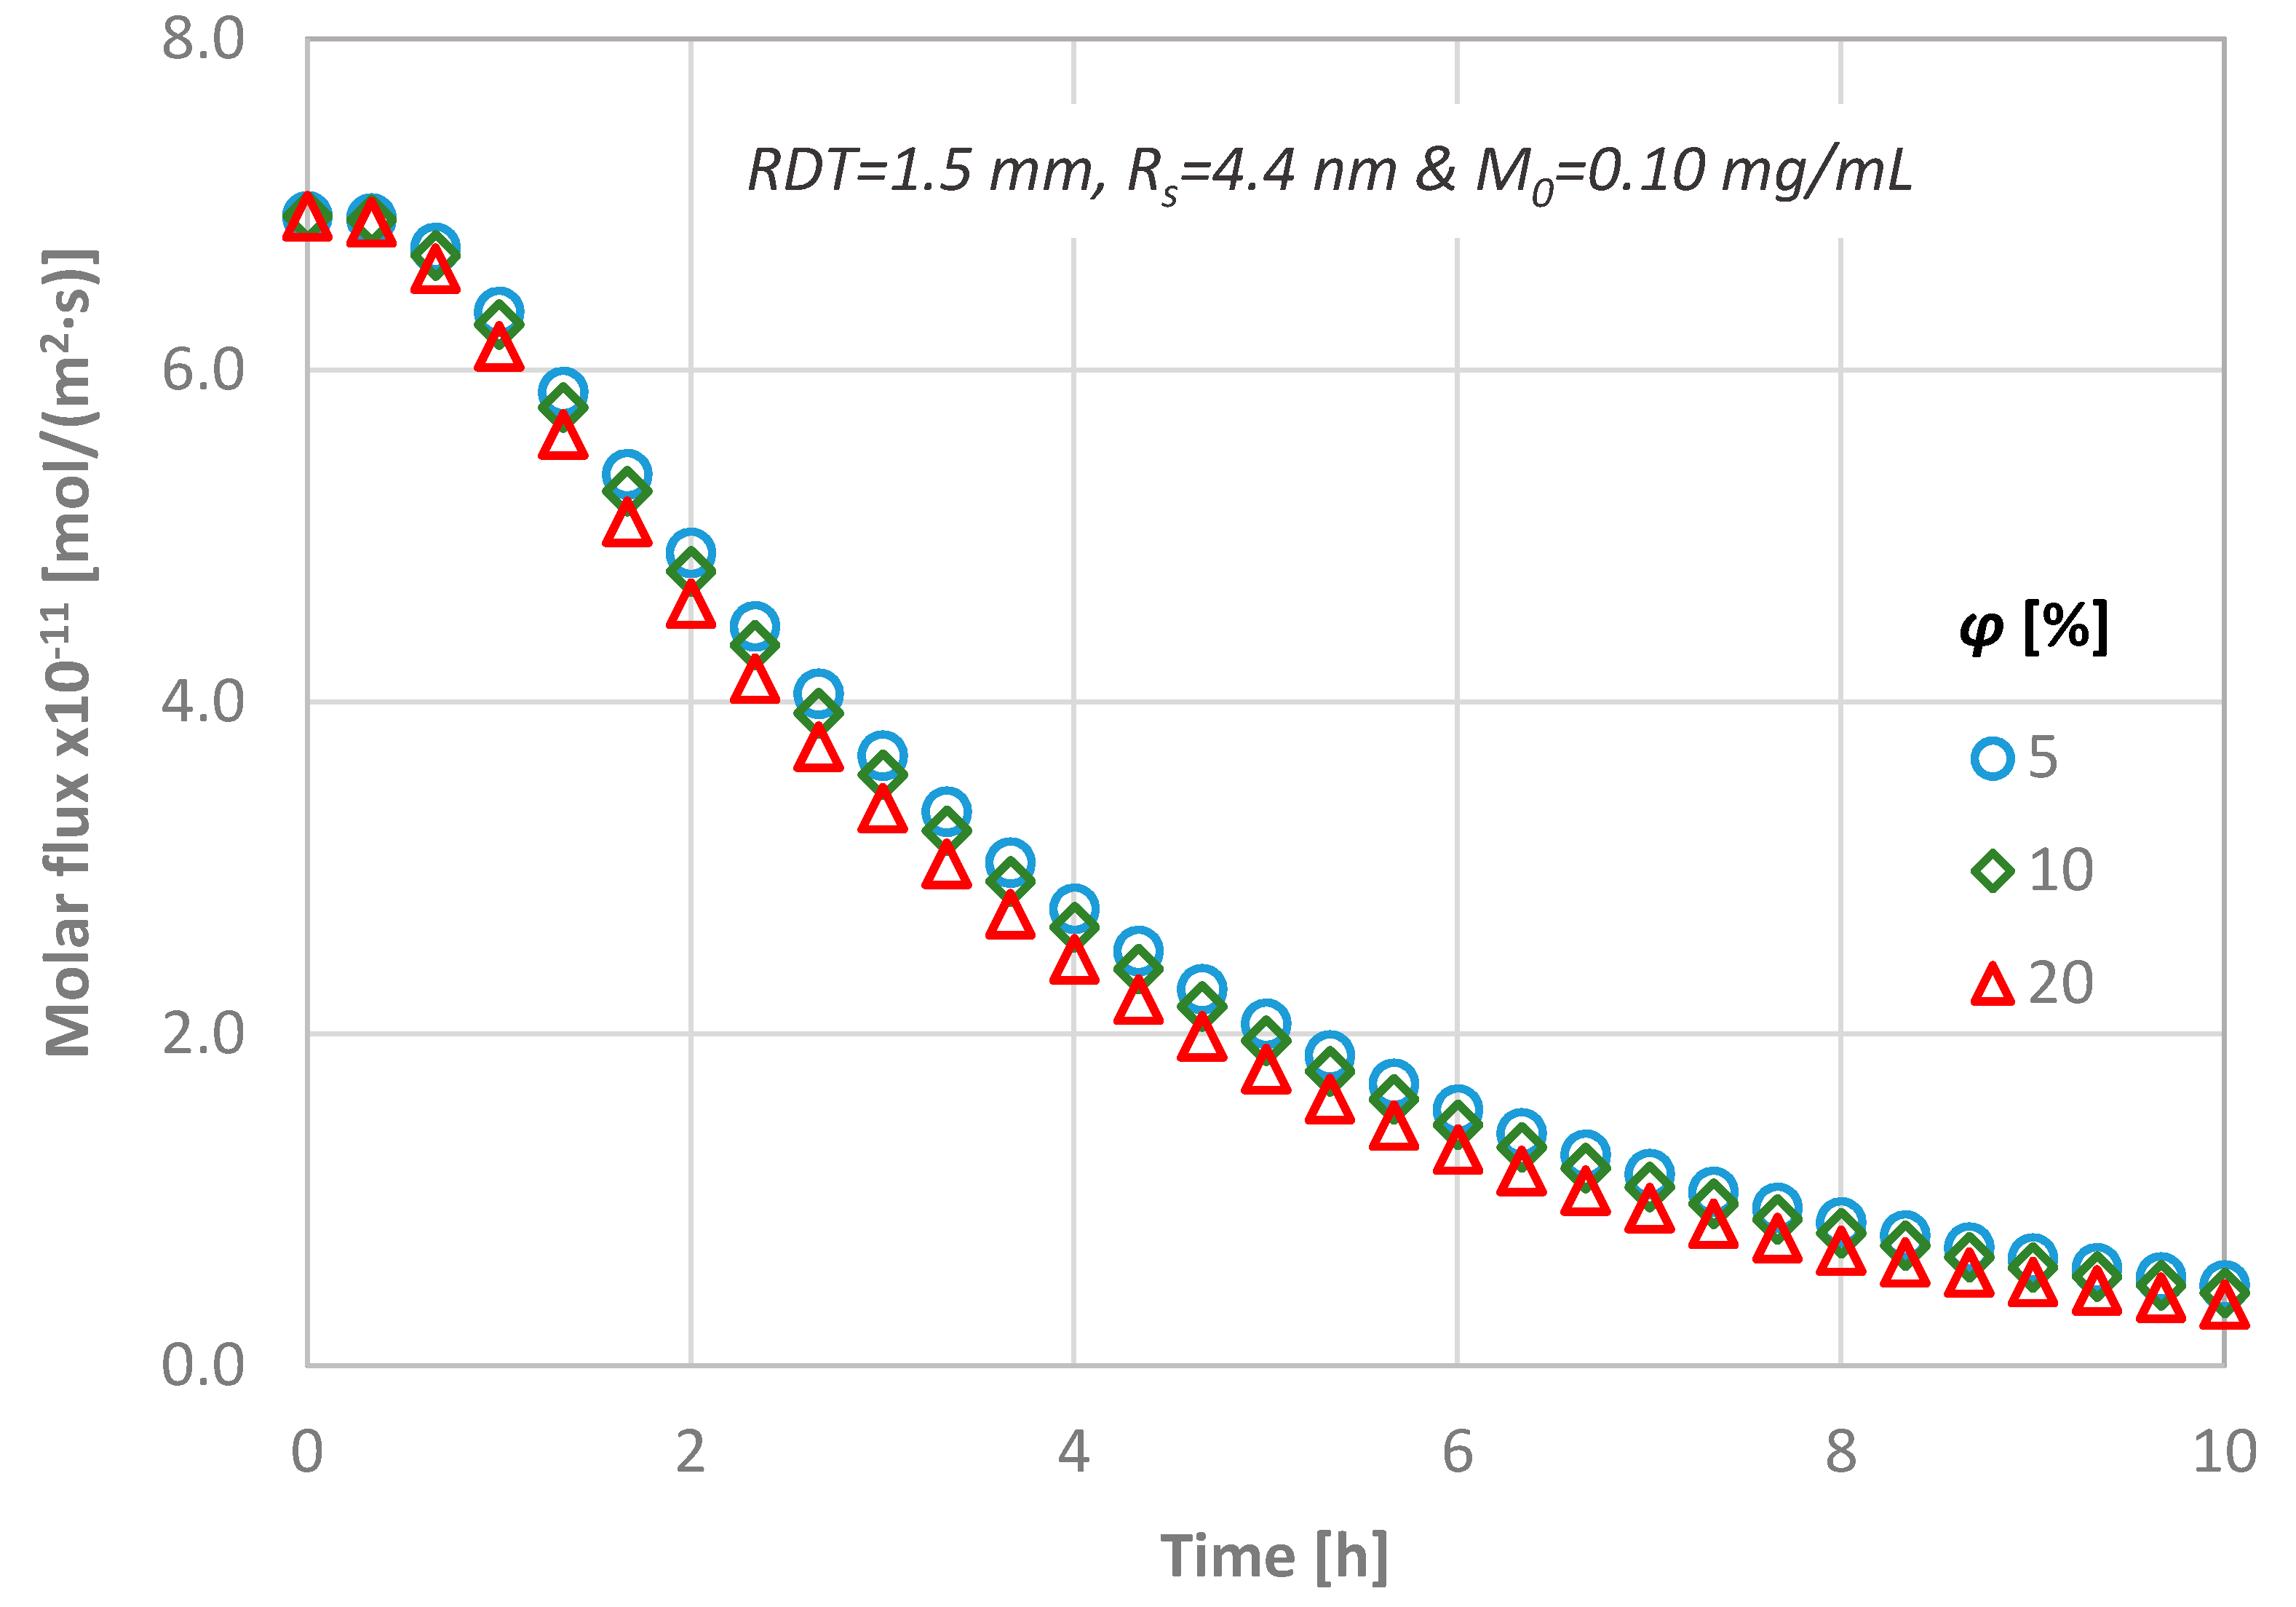
4.4. Effect of Dentine Porosity

Figure 11 presents the calculated temporal concentration values of the diffusing agent at the pulpal side of the dentinal discs as a function of the porosity of the tissue. As the porosity of the tissue decreases, higher values of concentration are observed at the pulpal side because the available area for the substance to be diffused is reduced. However, the porosity of the discs does not affect the time needed for the steady state condition to be reached.
The variation in concentration at the pulpal side depends strongly on both the porosity and the dentin thickness. The results indicate that there is 5% difference between the minimum and the maximum RDT of the dentinal discs investigated in this study for low porosity values, i.e., 5%. As the total pore volume increases, this difference also increases and reaches its upper limit of 15% for the dentin slab with the maximum thickness (i.e., RDT = 2.5 mm).
In Figure 12, the flux for three different dentinal discs in terms of porosity values is presented, while the RDT, the diffusion coefficient and the initial substance concentration are kept constant (i.e., RDT = 1.5 mm, Rs = 4.4 nm and M0 = 0.01 mg/mL). From Figure 12, it can be observed that the magnitude of the porosity value does not practically affect the calculated molar flux through the dentinal discs.

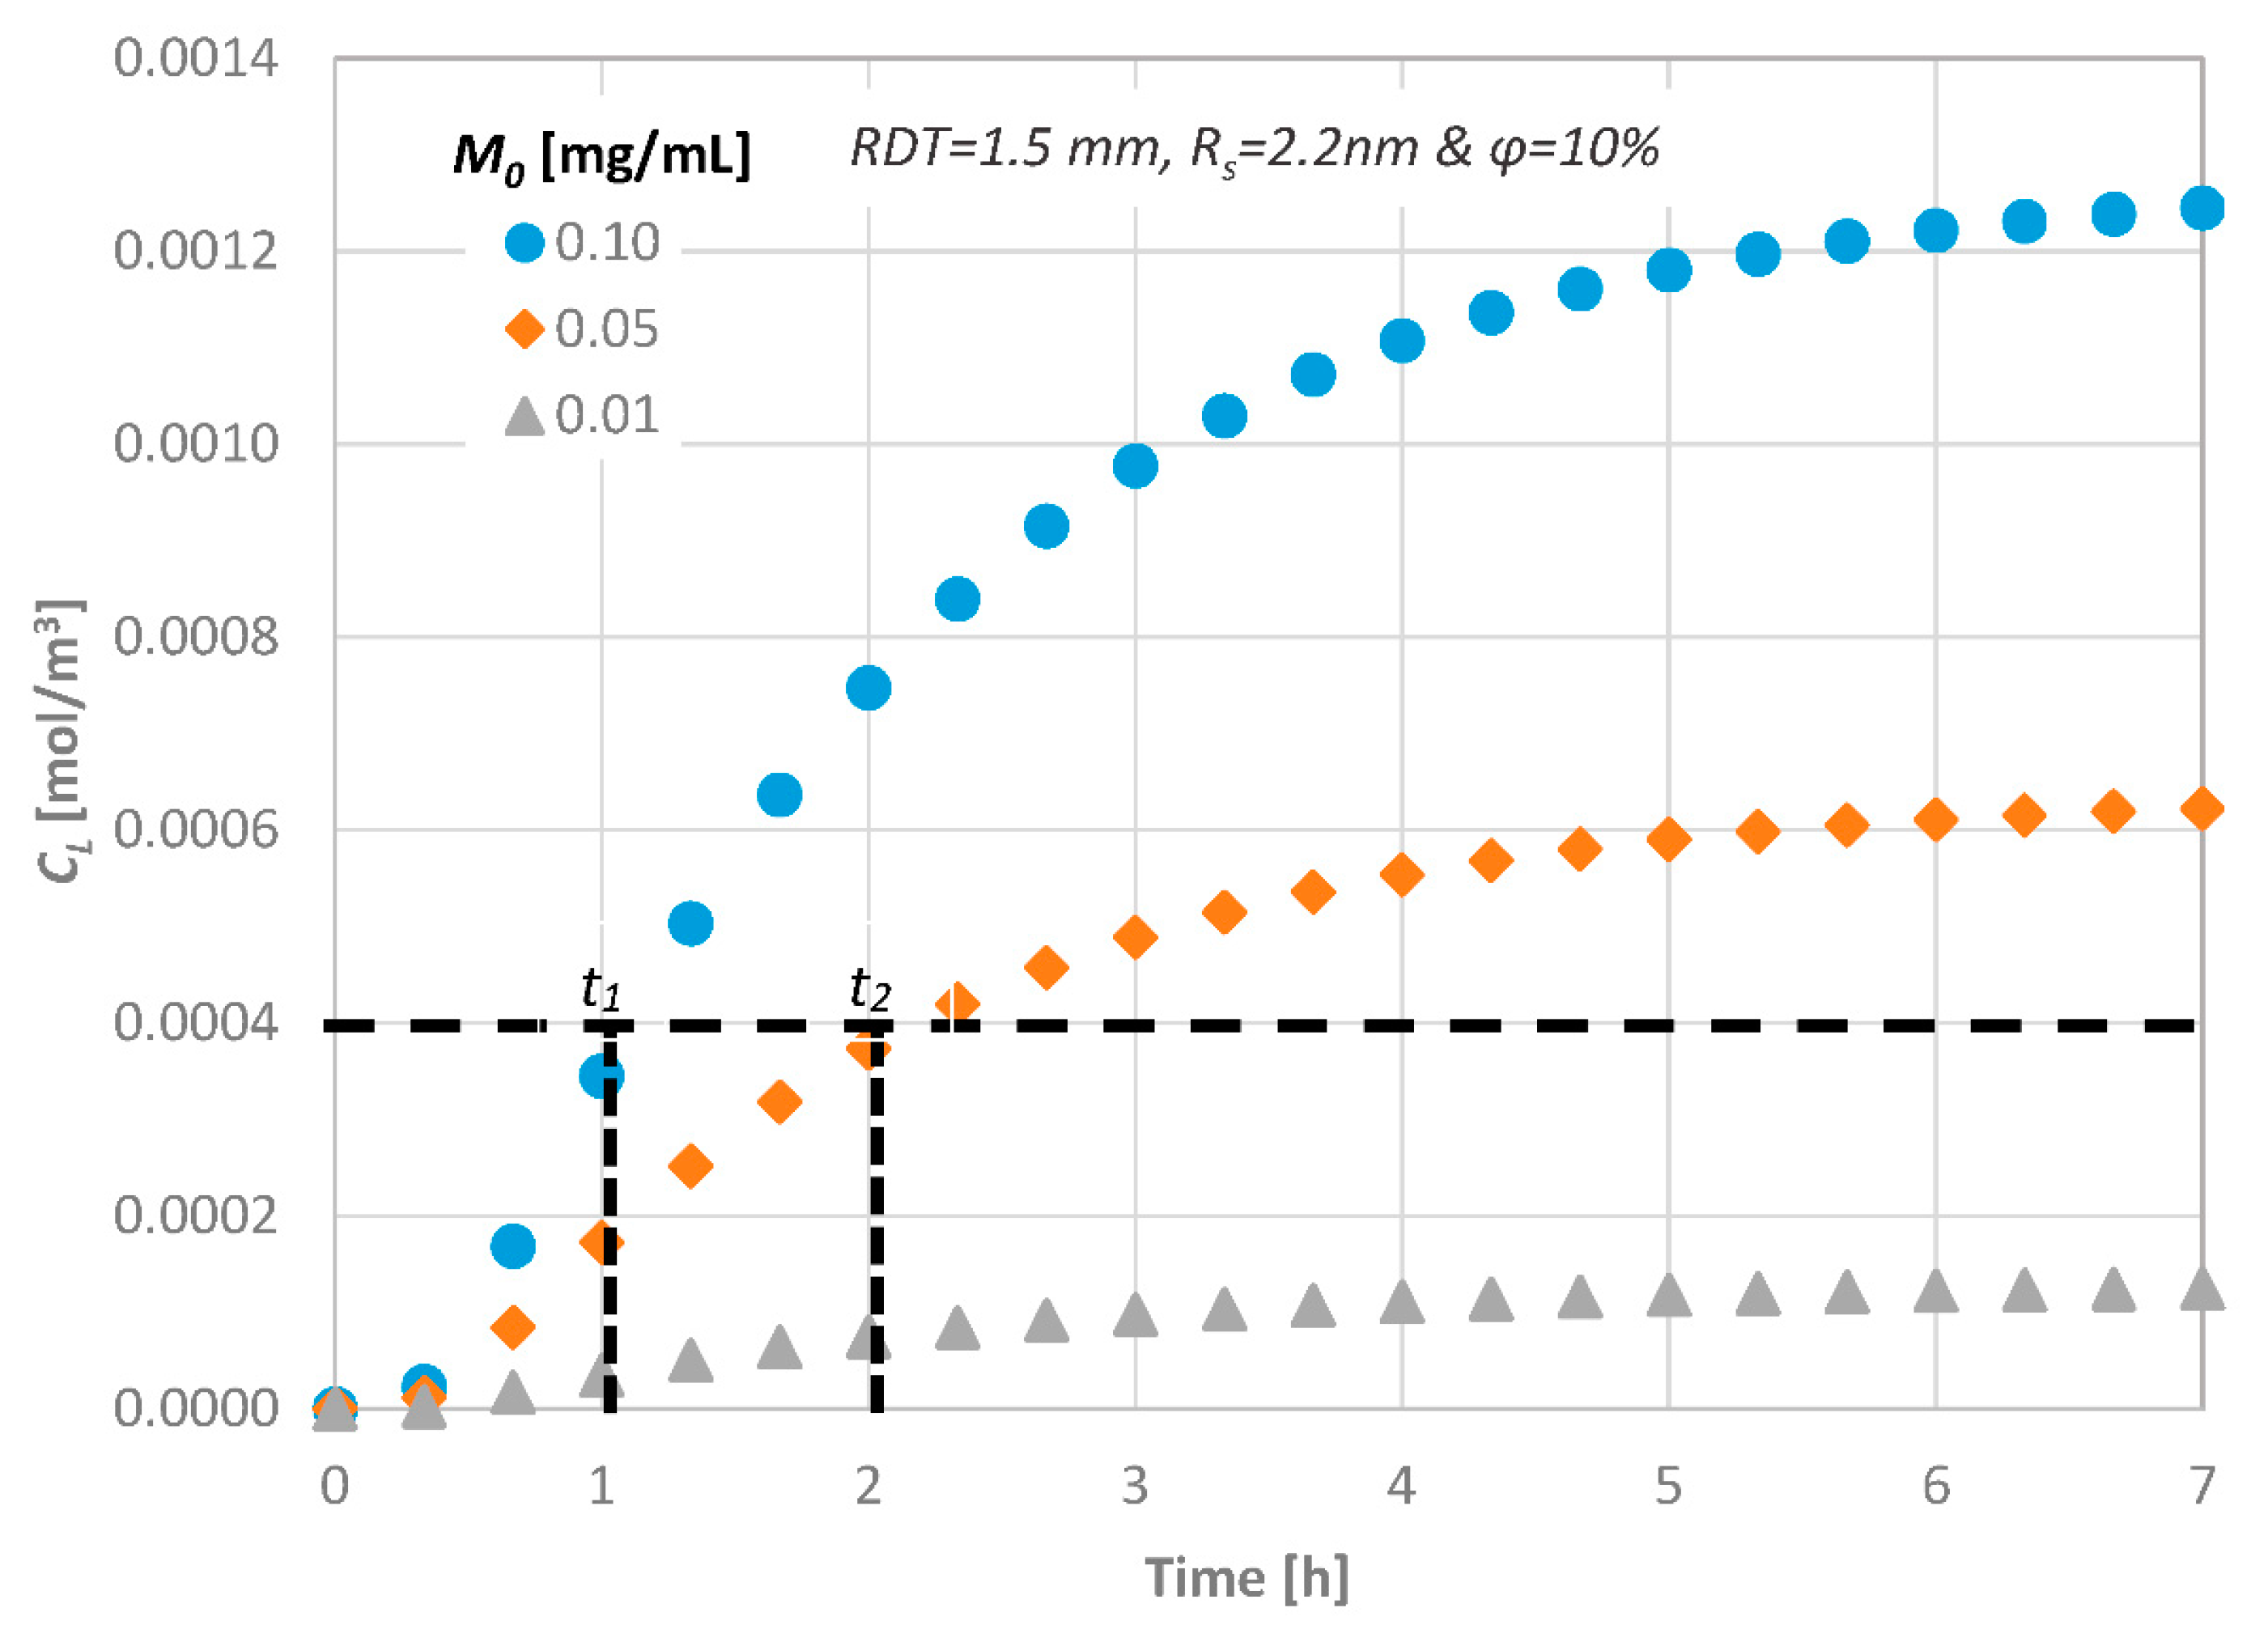
4.5. Effect of the Initial Diffusate Concentration

The transport of a substance similar to the therapeutic agent BMP-7, through a dentinal disc of RDT = 1.5 mm to the pulpal side under different values of initial concentration, has also been studied. The calculated concentrations at the bottom of the disc, CL, are presented in Figure 13. One can observe that approximately 0.5 h is needed for the first molecules of the substance to reach the bottom end of a dentinal disc of 1.5 mm RDT. This is in agreement with the literature and especially with Pashley and Matthews [11] who have reported that diffusion is a low process and, depending on their size, it requires 30–120 min for the molecules to reach the pulp across a 1–2 mm dentin thickness.
Obviously, the time required for the concentration of signaling molecules to attain a specific value at the bottom end is controlled by their initial concentration, i.e., by increasing the initial concentration of a potential therapeutic agent, the mass flux inside the disc increases and thus the signaling time of the molecules decreases (t1 and t2 in Figure 12). This is important for clinical practice of dentistry, since, by this procedure, the behavior of each therapeutic agent can be predicted prior to its application.

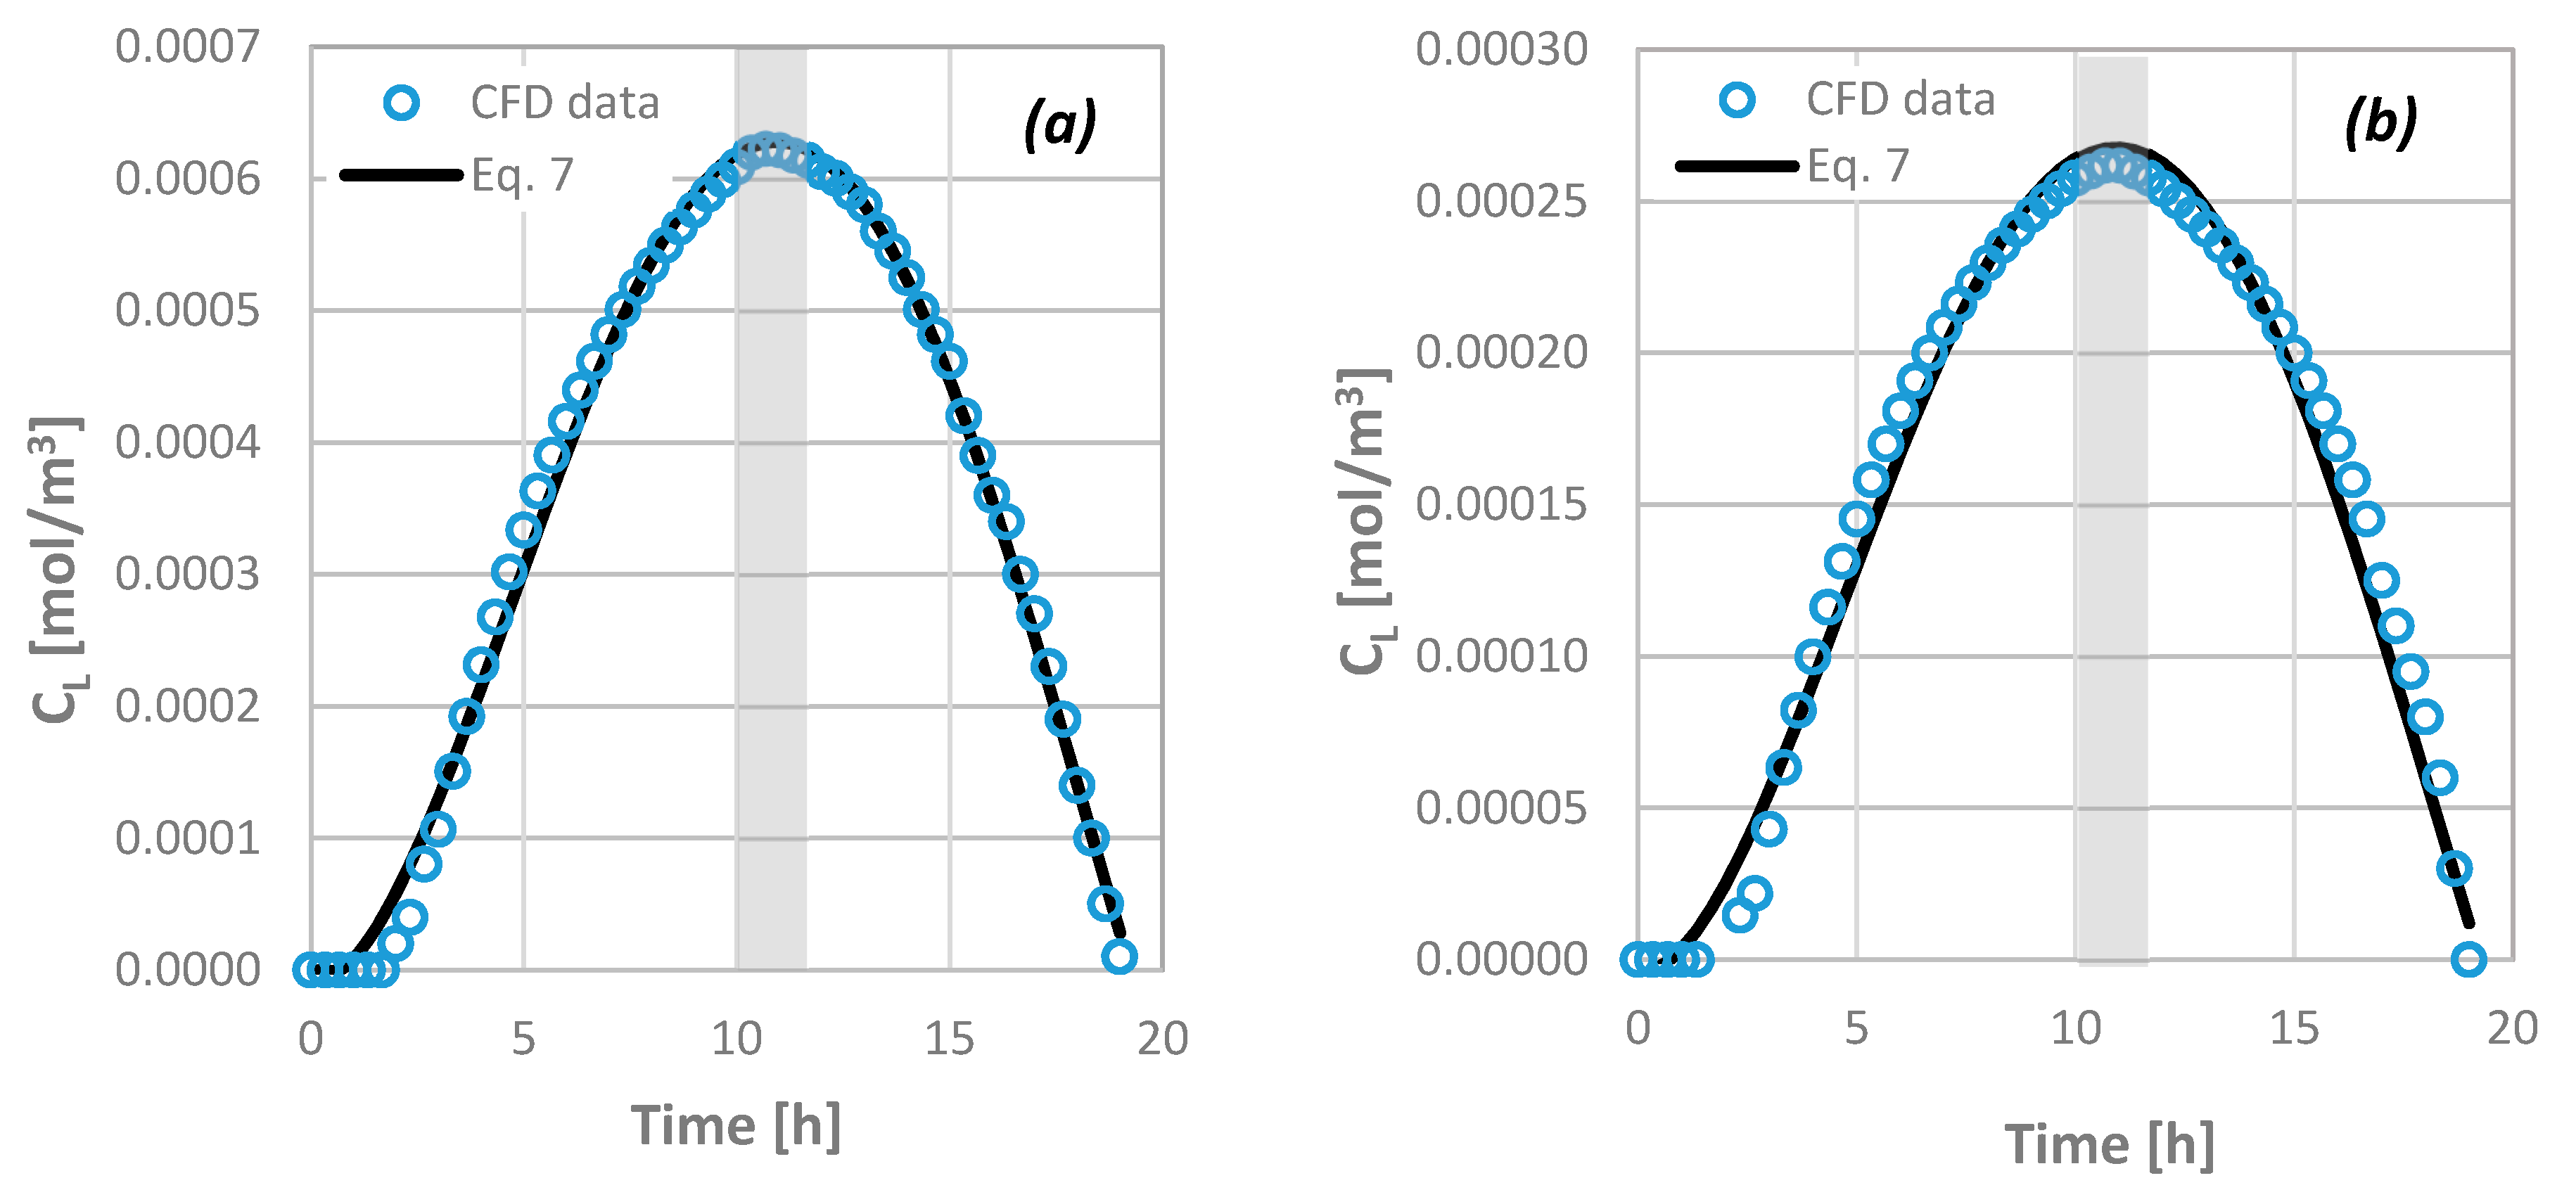
4.6. Prediction of the Drug Pulpal Concentration

In an effort to obtain a generalized correlation concerning the delivery of agents through porous domains to the dental pulp that could simulate human dentin tissues, we employed and modified a previous proposed correlation [17] concerning the diffusion through a typical dentinal tubule (Equation (6)):
C L C 0 = 1.1 exp ( 0.115 t * ln ( t * ) + 10 3 L )
Equation (6) is a simplified approach that predicts the temporal concentration distribution of the agent at the dentin–pulp junction in the ideal case where all dentinal tubules share the same geometrical characteristics and there is no agent consumption. Obviously, this cannot always adequately represent the actual case. For this reason, a new correlation for the prediction of the diffusion characteristics through dentinal discs is formulated to include all the key design parameters investigated in the present study. In the case where agents are consumed in the pulp, the shape of the molar concentration curvature differs from the one calculated through Equation (6), which assumes no flux (i.e., consumption of agents) at the bottom end of the dentinal tubules. The new equation (Equation (7)) is a 4th order polynomial that also takes into account the gradual decrease of the diffusate until its extinction:
C L = C 0 ( 10 10 R + 2.1 ) ( 125 R D T + 1.3 ) 0.11 φ 0.27 ( 1.1 t * 4 5 t * 3 + 4.9 t * 2 + 0.06 t * + 0.01 )
where R is the consumption rate in kg/(m2·s) and RDT is expressed in m. The outcome of Equation (7) is in very good agreement with the available data from the computational simulations (overall uncertainty is less than ±15%). Figure 14 presents this comparison when an agent of Rs = 2.2 nm is transported through a 2.5 mm thick dentinal disc of ϕ = 10% for M0 = 0.10 (Figure 14a) and 0.05 (Figure 14b) mg/mL, respectively.
If there is no consumption of the agent, Equation (7) is valid for t* ≤ 1 (at the maximum CL). Equation (7) permits the estimation of the necessary initial concentration of the therapeutic agent to be imposed for an efficient therapy to be achieved, i.e., the drug concentration at the pulp to reach a critical signaling value dictated by the dental clinical practice, when the maximum acceptable time of application and the consumption rate are given. From Figure 14, it can be observed that there is always a time margin during which the agent retains its maximum value at the pulp (i.e., ~2 h in the specific case of Figure 14; grey area). However, since the R values have been arbitrarily chosen, the scientific community that deals with phenomena related with the dental pulp irrigation and dentinal tissue regeneration must quantify the desirable consumption rate of biomolecules/proteins in the vicinity of the pulp.

5. Conclusions

This study aims to investigate the key features that affect transdentinal drug delivery and consequently to determine the necessary quantitative and qualitative issues to be addressed before the application of effective treatment modalities in dental clinical practice. These issues are also related to the diffusion of potentially irritating molecules released from restorative materials. The study has been conducted using CFD simulations validated with relevant experimental data acquired by employing the novel, non-intrusive μ-LIF technique. More specifically, the effect of the molecular size and the initial concentration of various compounds on the transdentinal diffusion characteristics were investigated. The geometrical characteristics (i.e., the porosity of the tissue and its thickness) as well as the consumption rate of these agents at the pulpal side were also included in a parametric study based on the Design of Experiments (DOE) methodology.
The computational results reveal that:
  • the transdentinal diffusion of drugs is mainly affected by the molecular size and the RDT, as it was expected,
  • a porosity change of 5% to 20% results in less than ±15% CL difference,
  • a variation of the agent consumption rate at the pulpal side between 0 and 10−10 kg/(m2·s), leads to a 100% CL decrease, while the consumption time is 18–25 h.
Finally, in the framework of thorough investigation of the physico-chemical and clinical parameters that influence the transdentinal delivery of potential irritating substances or therapeutic biomolecules in non-exposed dentinal cavities, we propose a new model. Given the geometrical characteristics of a dentinal cavity (i.e., porosity and RDT) in addition to the type of applied molecules, their critical pulpal concentration and the rate of their consumption at the pulp, the proposed model is able to estimate the initial concentration to be imposed if the desirable critical time of application is known and vice versa.

Acknowledgments

The authors would like to thank the Lab technician Asterios Lekkas and Christos Gogos for the construction and installation of the experimental setup. This research has been co-financed by the EU (ESF) and Hellenic National Funds Program “Education and Lifelong Learning” (NSRF)-Research Funding Program: “ARISTEIA”/“EXCELLENCE” (Grant No. 1904).

Author Contributions

Spiros V. Paras and Dimitris Tziafas had the initial conception of this work; Spiros V. Paras and Agathoklis D. Passos designed the experiments; Agathoklis D. Passos performed the experiments acquired and analyzed the data and drafted the work; Spiros V. Paras and Aikaterini A. Mouza interpreted the results and revised the manuscript.

Conflicts of Interest

The authors declare no conflict of interest.

Nomenclature

CMolar concentration, mol/m3
CLMolar concentration at the bottom end, mol/m3
CoInitial molar concentration, mol/m3
CFinal molar concentration (for t = L2/D), mol/m3
DCoefficient of diffusion, m2/s
jConcentration flux, mol/m2·s
LLength, m
Μ0Mass concentration, g/m3
MwMolecular weight, g/mol
RAgent consumption rate, kg/(m2·s)
RDTRemaining dentinal thickness, m
RsStokes radius, m
rRadius of conduit, m
TTemperature, °C
t*Dt/L2, dimensionless
tTime, s
UVelocity, m/s
xDistance, m
μViscosity, g/cm·s
ϕPorosity, %

References

  1. De Peralta, T.L.; Nör, J.E. Regeneration of the living pulp. In The Dental Pulp: Biology, Pathology, and Regenerative Therapies; Springer: Berlin/Heidelberg, Germany, 2014; pp. 237–250. [Google Scholar]
  2. Tziafas, D.; Smith, A.J.; Lesot, H. Designing new treatment strategies in vital pulp therapy. J. Dent. 2000, 28, 77–92. [Google Scholar] [CrossRef]
  3. Rutherford, B.; Spangberg, L. Transdentinal stimulation of reparative dentine formation by osteogenic protein-1 in monkeys. Arch. Oral Biol. 1995, 40, 681–683. [Google Scholar] [CrossRef]
  4. Kalyva, M.; Papadimitriou, S.; Tziafas, D. Transdentinal stimulation of tertiary dentine formation and intratubular mineralization by growth factors. Int. Endod. J. 2010, 43, 382–392. [Google Scholar] [CrossRef] [PubMed]
  5. Smith, A.J.; Tobias, R.S.; Murray, P.E. Transdentinal stimulation of reactionary dentinogenesis in ferrets by dentine matrix components. J. Dent. 2001, 29, 341–346. [Google Scholar] [CrossRef]
  6. Pashley, D.H. Dentin Permeability: Theory and Practice; CRC Press Inc.: Boca Raton, FL, USA, 1990. [Google Scholar]
  7. Pashley, D.H. Dentin permeability and dentin sensitivity. Proc. Finn. Dent. Soc. 1992, 88 (Suppl. S1), 31–37. [Google Scholar] [PubMed]
  8. Murray, P.E.; Smith, A.J. Remaining dentine thickness and human pulp responses. Int. Endod. J. 2003, 36, 33–43. [Google Scholar] [CrossRef] [PubMed]
  9. Tak, O.; Usumez, A. Diffusion of HEMA from resin cements through different dentin thicknesses in vitro. Am. J. Dent. 2015, 28, 285–291. [Google Scholar] [PubMed]
  10. Smith, A.J. Vitality of the dentin–pulp complex in health and disease: Growth factors as key mediators. J. Dent. Educ. 2003, 67, 678–689. [Google Scholar] [PubMed]
  11. Pashley, D.H.; Matthews, W.G. The effects of outward forced convective flow on inward diffusion in human dentine in vitro. Arch. Oral Biol. 1993, 38, 577–582. [Google Scholar] [CrossRef]
  12. Hanks, C.T.; Wataha, J.C. Permeability of biological and synthetic molecules through dentine. J. Oral Rehabil. 1994, 21, 475–487. [Google Scholar] [CrossRef] [PubMed]
  13. Boutsioukis, C.; Lambrianidis, T.; Kastrinakis, E. Irrigant flow within a prepared root canal using various flow rates: A computational fluid dynamics study. Int. Endod. J. 2009, 42, 144–155. [Google Scholar] [CrossRef] [PubMed]
  14. Boutsioukis, C.; Verhaagen, B.; Versluis, M.; Kastrinakis, E.; van der Sluis, L.W. Irrigant flow in the root canal: Experimental validation of an unsteady computational fluid dynamics model using high-speed imaging. Int. Endod. J. 2010, 43, 393–403. [Google Scholar] [CrossRef] [PubMed]
  15. Gao, Y.; Haapasalo, M. Development and validation of a three-dimensional computational fluid dynamics model of root canal irrigation. J. Endod. 2009, 35, 1282–1287. [Google Scholar] [CrossRef] [PubMed]
  16. Su, K.C.; Chuang, S.F. An investigation of dentinal fluid flow in dental pulp during food mastication: Simulation of fluid-structure interaction. Biomech. Model. Mechanobiol. 2014, 13, 527–535. [Google Scholar] [CrossRef] [PubMed]
  17. Passos, A.D.; Tziafas, D.; Mouza, A.A.; Paras, S.V. Study of the transdentinal diffusion of bioactive molecules. Med. Eng. Phys. 2016, 38, 1408–1415. [Google Scholar] [CrossRef] [PubMed]
  18. Ingle, J.I.; Bakland, L.K.; Baumgartner, J.C. Ingle’s Endodontics 6; BC Decker: Hamilton, ON, Canada, 2008. [Google Scholar]
  19. Garberoglio, R.; Brannstrom, M. Scanning electron microscopic investigation of human dentinal tubules. Arch. Oral Biol. 1976, 21, 355–362. [Google Scholar] [CrossRef]
  20. Andrew, D.; Matthews, B. Displacement of the contents of dentinal tubules and sensory transduction in intradental nerves of the cat. J. Physiol. 2000, 529 Pt 3, 791–802. [Google Scholar] [CrossRef] [PubMed]
  21. Fearnhead, R.W. Histological evidence for the innervation of human dentine. J. Anat. 1957, 91, 267–277. [Google Scholar] [PubMed]
  22. Hildebrand, C.; Fried, K. Teeth and tooth nerves. Prog. Neurobiol. 1995, 45, 165–222. [Google Scholar] [CrossRef]
  23. Gendron, P.O.; Avaltroni, F.; Wilkinson, K.J. Diffusion coefficients of several rhodamine derivatives as determined by pulsed field gradient-nuclear magnetic resonance and fluorescence correlation spectroscopy. J. Fluoresc. 2008, 18, 1093–1101. [Google Scholar] [CrossRef] [PubMed]
  24. Bindhu, C.V.; Harilal, S.S. Effect of the excitation source on the quantum-yield measurements of rhodamine B laser dye studied using thermal-lens technique. Anal. Sci. 2001, 17, 141–144. [Google Scholar] [CrossRef] [PubMed]
  25. Sakakibara, J.; Adrian, R.J. Whole field measurement of temperature in water using two-color laser induced fluorescence. Exp. Fluids 1999, 26, 7–15. [Google Scholar] [CrossRef]
  26. Murphy, D.B. Fundamentals of Light Microscopy and Electronic Imaging; Wiley: Hoboken, NJ, USA, 2002. [Google Scholar]
  27. Mortensen, N.A.; Okkels, F.; Bruus, H. Reexamination of Hagen-Poiseuille flow: Shape dependence of the hydraulic resistance in microchannels. Phys. Rev. E 2005, 71, 057301. [Google Scholar] [CrossRef] [PubMed]
  28. Paterson, M.S. The equivalent channel model for permeability and resistivity in fluid-saturated rock—A re-appraisal. Mech. Mater. 1983, 2, 345–352. [Google Scholar] [CrossRef]
  29. Panda, M.N.; Lake, L.W. Estimation of single-phase permeability from parameters of particle-size distribution. AAPG Bull. Am. Assoc. Pet. Geol. 1994, 78, 1028–1039. [Google Scholar]
  30. Erickson, H.P. Size and shape of protein molecules at the nanometer level determined by sedimentation, gel filtration, and electron microscopy. Biol. Proced. Online 2009, 11, 32–51. [Google Scholar] [CrossRef] [PubMed]
  31. Kishen, A.; Vedantam, S. Hydromechanics in dentine: Role of dentinal tubules and hydrostatic pressure on mechanical stress-strain distribution. Dent. Mater. 2007, 23, 1296–1306. [Google Scholar] [CrossRef] [PubMed]
  32. Stogiannis, I.A.; Mouza, A.A.; Paras, S.V. Study of a micro-structured PHE for the thermal management of a fuel cell. Appl. Therm. Eng. 2013, 59, 717–724. [Google Scholar] [CrossRef]
  33. Outhwaite, W.C.; Livingston, M.J.; Pashley, D.H. Effects of changes in surface area, thickness, temperature and post-extraction time on human dentine permeability. Arch. Oral Biol. 1976, 21, 599–603. [Google Scholar] [CrossRef]
Figure 1. (a) dentinal tubules running perpendicularly from pulpal wall towards dentino-enamel junction (DEJ) scanning electron microscopy (SEM), reproduced with permission from [17] and (b) dentinal disc of a human tooth.
Fluids 03 00004 g001
Figure 2. Schematic of the experimental conduit. Reproduced with permission from [17].
Fluids 03 00004 g002
Figure 3. Schematic representation of the μ-LIF experimental setup. Reproduced with permission from [17].
Fluids 03 00004 g003
Figure 4. Typical comparison of the molar concentration values at the observation area of the μ-LIF technique with the corresponding computational results (ϕ = 10%).
Fluids 03 00004 g004
Figure 5. Computational domain for the porous disc model. (RDT = 0.5–2.5 mm).
Fluids 03 00004 g005
Figure 6. Molar concentration at the pulpal side of the dentinal discs as a function of different consumption rates for ϕ = 10% and RDT = 2.5 mm.
Fluids 03 00004 g006
Figure 7. Effect of the Remaining Dentin Thickness (RDT) on the diffusion characteristics; CL versus time.
Fluids 03 00004 g007
Figure 8. Effect of the RDT on the diffusion characteristics; molar flux versus time.
Fluids 03 00004 g008
Figure 9. Effect of the molecular size on the diffusion characteristics; CL versus time.
Fluids 03 00004 g009
Figure 10. Effect of the molecular size on the diffusion characteristics; concentration gradient versus time.
Fluids 03 00004 g010
Figure 11. Effect of the dentinal disc porosity value on the diffusion characteristics for: (a) RDT = 0.5 mm, Rs = 2.2 nm and (b) RDT = 1.5 mm, Rs = 2.2 nm.
Fluids 03 00004 g011
Figure 12. Temporal molar flux distribution for three different porous discs (RDT = 1.5 mm, Rs = 4.4 nm and M0 = 0.10 mg/mL).
Fluids 03 00004 g012
Figure 13. Effect of the initial substance concentration on the diffusion characteristics.
Fluids 03 00004 g013
Figure 14. Comparison of computational fluid dynamics (CFD) data concerning the concentration of agents at the bottom end of the porous disc as a function of time with the outcome of Equation (7) for: RDT = 2.5 mm, ϕ = 10%, Rs = 2.2 nm and (a) M0 = 0.10 mg/mL and (b) M0 = 0.05 mg/mL.
Fluids 03 00004 g014
Table 1. Constraints of the design variables.
ParameterLower BoundUpper Bound
Porosity (ϕ), %520
Remaining Dentinal Thickness (RDT), mm0.52.5
Initial Concentration (M0), mg/mL0.010.10
Molecular Size (Rs), nm2.222.0
Consumption Rate (R), kg/(m2·s)010−10

