1. Introduction
Materials like colloidal suspensions, emulsions, foams, gels, and granular materials only flow irreversibly when a finite threshold shear stress—known as the
yield stress—is exceeded [
1,
2,
3,
4,
5,
6,
7,
8,
9].
Carbopol
, a trademark owned by Lubrizol Corporation (Wickliffe, OH, USA), is a family of commercial polymers frequently employed in the cosmetics, pharmaceutical, paint, and food industry as a thickening, suspending, dispersing, and stabilizing agent [
10]. In research activities, its solutions are frequently employed in flow visualization experiments [
11,
12,
13,
14], because they are transparent gels that are relatively easy to prepare [
15,
16,
17].
There are more than 10 grades of Carbopol polymers, which may be subdivided into several categories based on their physical structure and chemical composition, crosslink density, polymerization solvent, type of cross-linking, network electrical charge, and physical appearance [
18]. Carbopol is a high molecular weight, hydrophilic, and crosslinked polyacrylic acid polymer. This physical hydrogel presents a three-dimensional polymer network that is swollen by water, and presents temporary, reversible interchain entanglements that are stronger when compared to chemical hydrogels.
Specifically, in the present research we employed Carbopol NF 980, also known as a monograph Carbomer Homopolymer Type C (former Carbomer 940) by U.S. Pharmacopeia/National Formulary (USP/NF) in the United States. Carbopol NF 980 is a synthetic homopolymer, polyacrylic acid crosslinked with allyl sucrose or allyl pentaerythritol, which is polymerized in a co-solvent system. It is supplied as a white and dry powder of primary particles averaging 0.2
m in diameter. It is a weak anionic polyelectrolyte polymer that must be neutralized in order to achieve a high viscosity. Each particle (or network structure) is a mixture of tightly coiled linear polymer chains, which are soluble in polar solvents. The viscosity of Carbopol solutions is not a function of the size of its powder particles [
19].
It is well known that this polymer forms a colloidal dispersion when hydrated in water at controlled pH and temperature. Frequently, a Carbopol aqueous dispersion is neutralized with a common base, such as sodium hydroxide (NaOH), converting the acidic polymer into a salt. When neutralized, the polymer presents the ability to absorb and retain water. Polymer chains interconnected by crosslinks begin to hydrate, and partially uncoil due to electrostatic repulsion in order to form irreversible agglomerates [
20]. The desired yield stress nature is due to the presence of high molecular weight polyacrylate branched chains that form interchain entanglements which prevent flow at low shear stresses [
19,
21,
22]. During hydration the chains may increase up to 10 times their original diameter [
23], and the ionization process leads to a crosslink of the swollen molecules, forming a microgel network with stronger bonds.
In order to better understand the rheological properties of Carbopol solutions, it is fundamental to improve the knowledge of their relation with the material microstructure [
24]. Data obtained in rheological measurements are better interpreted when supported by visualization techniques such as microscopy, X-ray, neutron and light scattering, nuclear magnetic resonance (NMR) or differential scanning calorimetry (DSC) [
25]. Indeed, Ref. [
23] investigated Carbopol viscoelastic properties through direct analysis of the microscopic network structure by scanning electron cryomicroscopy (cryoSEM). Likewise, Ref. [
26] studied elasticity through microrheology. On the other hand, Ref. [
20] emphasized the need for novel microscopic scale experiments, that would be able to simultaneously describe local dynamics and flow behavior.
Steady and oscillatory simple shear flows provide information on the relationship between the rheological properties and the macromolecular structure. Viscoelastic effects are a result of the interaction between polymer chains that is related to the viscous behavior, and the chains recoiling due to thermal motion, which is related to the elastic behavior [
27]. Colloidal dispersions such as Carbopol present a typical viscoelastic behavior at low stresses [
28]. On the other hand, elastic effects decrease and eventually tend to become negligible at the higher stresses found in the nonlinear steady state.
The rheological properties of Carbopol dispersions have been extensively investigated [
16,
23,
29,
30,
31]. These properties depend on the type and degree of crosslinking, which in turn depend on molecule swelling and medium density. Carbopol dispersion is usually seen as simple model yield stress fluids [
32,
33]. Their viscoplastic steady state behavior is well represented by the Herschel-Bulkley equation [
34], which can accommodate a yield stress and a power-law shear-thinning behavior. However, for some soft glassy materials, other important features cannot be neglected, such as pronounced elastic and thixotropic behavior (especially when the stress is close to the yield stress), transient and initial internal stresses, normal stress differences, and irreversibility of the deformed states [
9,
32,
35,
36,
37]. Ref. [
38] argue that, at low stresses, the microgels do not move relatively to each other, but are able to deform, resulting in a solid-like elastic behavior. At large stresses, there is relative mobility of the microgels, leading to a liquid-like viscoelastic behavior.
Yield stress materials can be classified according to their microstructure as repulsive-dominated jammed glasses, networked gels with attractive interactions or a combination thereof [
39,
40]. According to [
39], Carbopol gels are classified into the first category.
Ref. [
16] describes Carbopol gels as concentrated, percolated, and disordered dispersions with glassy structure. Structural variations occur as the polymer concentration is increased. For
wt%, the dispersion obtained possesses no yield stress; for
wt% a percolated viscoelastic dispersion is obtained; for
wt% the dispersion obtained is phase-inverted percolated with excess of solvent; and for
wt% a closely packed and disordered structure is observed, due to polydispersity.
Using confocal fluorescence microscopy, Ref. [
17] observed that the Carbopol microgels are indeed polydisperse. They also observed that, at the same concentration, Carbopol Ultrez 10 and ETD 2050 (Lubrizol Corporation, Wickliffe, OH, USA) present the same mesostructure, despite a difference in particle size. The microgels have complex shape when unconstrained, and possess soft elasticity and capacity to adapt their outer shape and swelling ratio to local space and solvent availability conditions. In addition, the maximum volume concentration can be quite high due to the also high albeit as yet not quantified polydispersity.
For a 1.5 wt% concentration, Ref. [
19] observed the existence of highly swollen deformable microgel particles closely packed and in intimate contact. The high viscosity is determined by network cross-link density, which governs particle-particle interaction. On the other hand, dilute dispersions, i.e., dispersions of fully swollen particles with no contact, the particle-solvent interactions result in lower viscosity and elasticity.
Carbopol dispersions show different behavior depending on the solvent [
41]. In general, water is used as a solvent. However, co-solvent and anhydrous systems have also been used [
42]. Ethanol and isopropanol can be thickened adding Carbopol polymers [
43]. In this case, it is crucial to use the appropriate neutralizer, which varies depending upon the alcohol content. In addition, previous works have already demonstrated the possibility of formulating Carbopol systems using different hydrophilic solvents such as polyethylene glycol (PEG) 400, glycerol, silicone, and tetraglycol without neutralization [
44].
The choice of the solvent is also important because solvents such as glycerol and propylene glycol can modify hydrogen bond characteristics between water, solvent, and polymer, thereby affecting polymer swelling and the viscoelastic properties [
30,
41,
45].
The present research aims to explore the rheological properties of Carbopol NF 980 dispersions in different formulations. Solvent type, polymer concentration, gel preparation, mechanical properties, and phenomenological behavior are all discussed. We carried out systematic rheological experiments, in transient and steady state regimes, from which we observe that Carbopol gels are not as “simple” as usually assumed.
3. Results and Discussion
3.1. Stress Amplitude Sweep Tests
Typical results for a stress amplitude sweep test are presented in
Figure 1. The material is a 0.123 wt% Carbopol aqueous dispersion, and the frequency was kept fixed at 1 Hz. In this figure, the storage modulus
, loss modulus
, and complex modulus
are given as a function of the imposed shear stress amplitude,
. Instrument inertia [
61] and flow inhomogeneity [
59] effects are corrected for.
Figure 1 can be divided into three regions, namely the linear viscoelastic region (LVR), the yielding region, and the non-linear region. The LVR occurs in the low stress amplitude range, and is characterized by constant (i.e., stress-amplitude independent) moduli. It corresponds to the so-called “small-amplitude oscillatory shear” (SAOS) flow regime. Both the yielding and the non-linear region are in the domain of the so-called “large-amplitude oscillatory shear” (LAOS) flow regime.
In the LVR, the imposed stress is small in comparison to the strength of the bonds that sustain the microstructure, so that its integrity is unaffected. The microgels remain in their “cages”, i.e., are allowed to deform elastically but do not move significantly relative to each other. This microstructure confers a predominantly elastic behavior to the material, as indicated by a large
in comparison with
. The elastic preponderance indicates a low internal dissipation within microgels [
16].
At this point it is interesting to emphasize that the definitions of
and
originate from the assumption that both the input and output waves be sinusoidal, i.e., that the stress depends linearly on the shear strain and on the shear rate. In other words,
and
cannot depend on the stress amplitude, by definition. Therefore, in principle the values of
and
shown in
Figure 1 would be meaningless beyond the LVR, because they do depend on the stress amplitude. There is no guarantee that the output (strain) wave is sinusoidal outside the LVR, in potential conflict with the basic hypothesis of the theory from which
and
arise. This fact is typically overlooked in the literature, probably because the trends observed for
and
beyond the LVR seem to be in qualitative agreement with the expected behavior.
The reason for the successful performance of
and
outside their domain is the fact that in this case the output waves are not too far from sinusoidal beyond the SAOS regime. This is illustrated in
Figure 2. That is, for this Carbopol dispersion at 1 Hz (and seemingly for Carbopol dispersions in general at 1 Hz), the so-called quasilinear large-amplitude oscillatory shear (QL-LAOS) flow regime prevails beyond the LVR. The existence of this regime was recently discovered theoretically by [
62] and later confirmed experimentally [
63]. The quasilinearity (sinusoidal output wave) occurs because at a given stress amplitude the microscopic state does not change along the cycle (as in SAOS), although it changes with the stress amplitude, in contrast to what is observed in the SAOS regime. The microscopic state remains unchanged along the cycle because the characteristic time needed for changes in the microscopic state is longer than the characteristic time of the flow, namely
s in the present case.
In addition, the characteristic time needed for changes in the microscopic state is expected to decrease as the stress amplitude is increased, i.e., the microstructure is expected to break faster at larger stresses. Therefore, at large enough stress amplitudes the output waves should cease to be sinusoidal, i.e., the flow should no longer be within the QL-LAOS regime. This is because, when the time required for changes in the microscopic state is shorter or comparable with the characteristic time of the flow (namely the cycle period), then the microscopic state changes along the cycle. Since the mechanical behavior is a function of the microscopic state, the mechanical behavior varies along the cycle, rendering the output wave non-sinusoidal. In our experiments, however, we did not attain large enough stress amplitudes to leave significantly the QL-LAOS regime.
The dependence of and on the stress amplitude is a result of the onset of a bond breaking process (yielding). The larger the stress amplitude the lower the structuring level, which results in less elasticity, as indicated by the decreasing as the stress amplitude is increased. In the yielding region, located in the middle range of stress amplitude and around the crossover point, the stress amplitude is high enough to cause some bond breaking, i.e., some microgels escape from their cages and more relative motion occurs. The frictional forces that arise due to relative motion dissipate more mechanical energy, which explains the increase in . Within this range of stress amplitude the structuring level is still high enough to retain a percolated microstructure and a sizable elasticity response, as indicated by the still high values of found in this region.
It is tempting to take a characteristic stress amplitude of the yielding region as the yield stress, because it is throughout this region that yielding takes place. An obvious choice of characteristic stress amplitude would be the one at which the and curves cross. However, the crossover stress amplitude depends to a great extent on the frequency of oscillation, while the definition of yield stress precludes such a dependence. This frequency dependence occurs because the bond breaking process depends both on the stress intensity and on the time period during which the imposed stress persists, in consonance with the discussion above regarding the characteristic time needed for changes in the microscopic state. The larger the imposed stress the lower the time period required to break the bonds, and vice versa. Therefore, in oscillatory flows, for a given stress amplitude the larger the frequency the shorter the stress persistence. Hence, for larger frequencies (shorter stress persistencies) larger stress amplitudes are required to break the bonds. In view of this discussion it might be argued that the yield stress can be identified as the limit as the frequency approaches zero of the crossover stress amplitude. However, as the frequency is reduced, the output wave will eventually cease to be sinusoidal, and hence and will lose their physical meanings.
The non-linear region starts beyond the crossover point, where attains its maximum and starts decreasing, and where starts decreasing much faster than . The high stress amplitudes found in this region cause a massive bond breakage, so that the microstructure is no longer percolated. This confers a liquid behavior to the material. Moreover, the higher the stress amplitude, the lower the structuring level, leading to a more viscous and less elastic behavior.
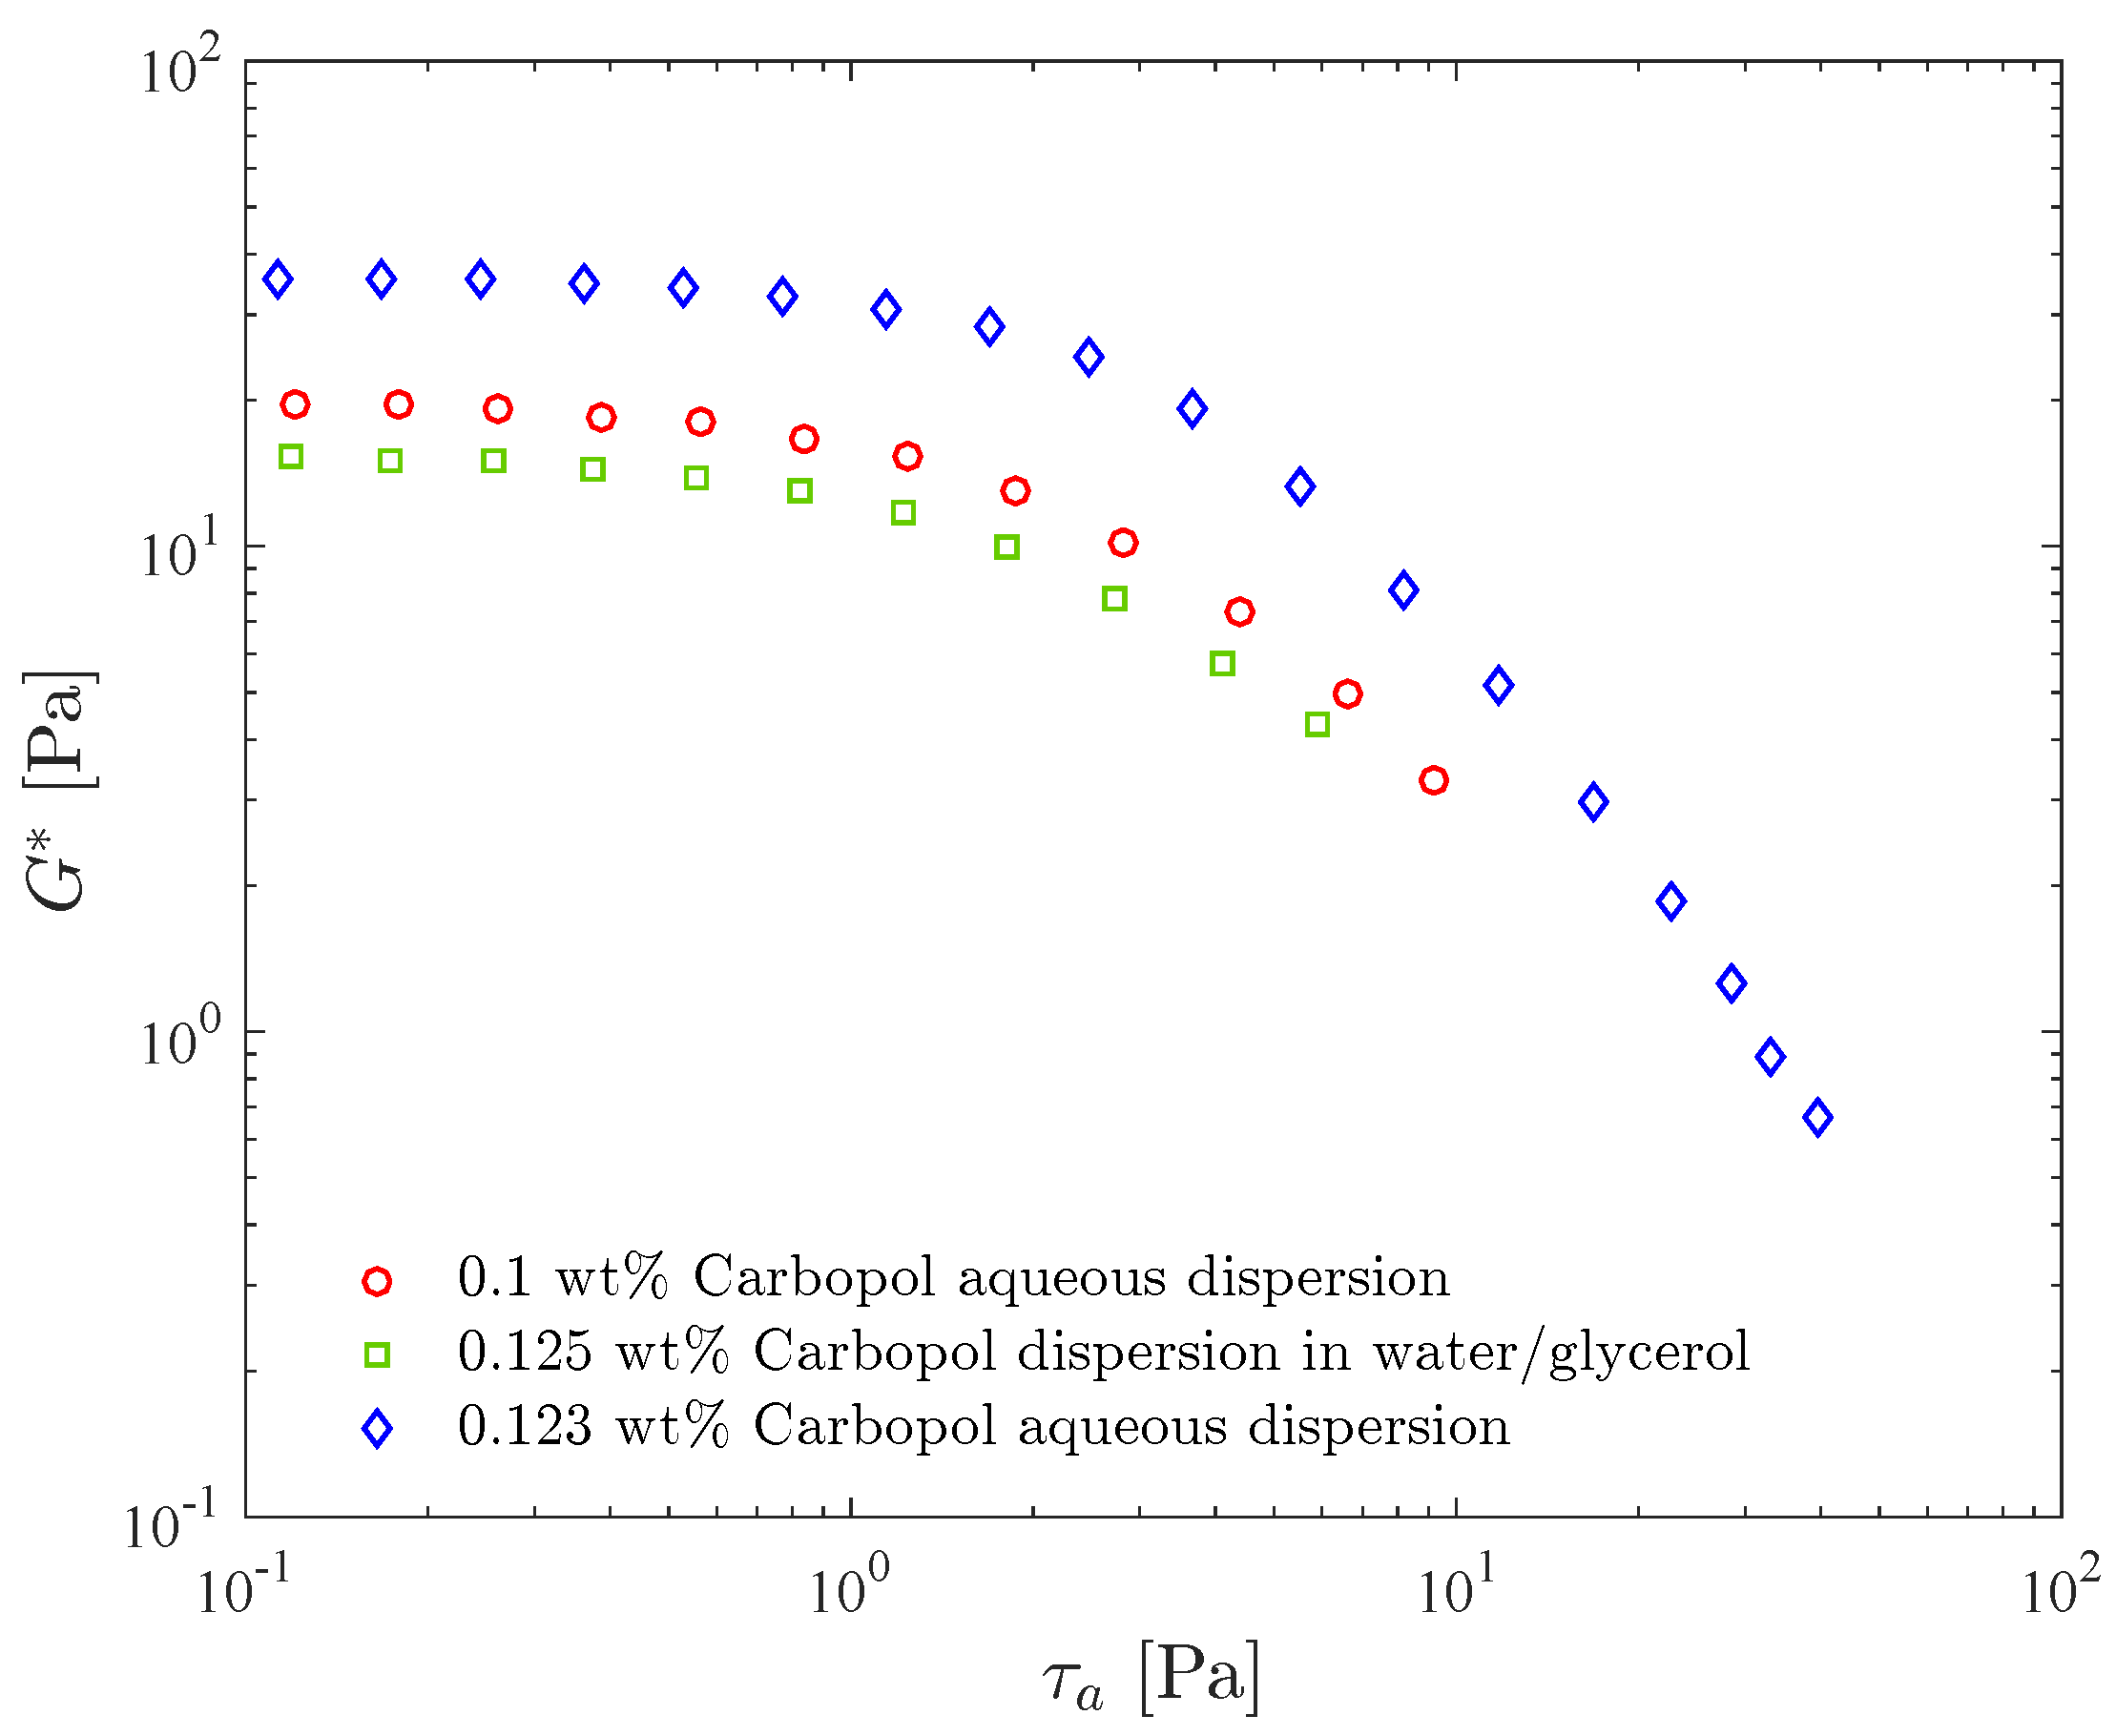
Figure 3 shows the complex shear modulus as a function of the stress amplitude for three different dispersions, namely two in water and one in a water/glycerol solution. Comparing the results for the two aqueous dispersions, it is seen that
is larger for the more concentrated one throughout the stress amplitude range, as expected. Moreover, the LVR range does not change significantly with concentration, as also observed by [
38].
Figure 3 also illustrates the influence of the solvent on the complex modulus. It is seen that the
curve for the water/glycerol Carbopol dispersion lies below the curves for the two aqueous dispersions, despite the fact that its Carbopol concentration is the highest, illustrating that the presence of glycerol reduces the complex modulus. Since in the LVR
for the three dispersions, this
reduction indicates that glycerol leads to a less elastic structure. The presence of glycerol slightly increases the loss modulus (not shown), as a consequence of the fact that glycerol is more viscous than water. It is interesting to observe that the 0.1 wt% Carbopol aqueous dispersion and the 0.125 wt% Carbopol dispersion in water/glycerol were designed to possess the same yield stress, namely
Pa.
3.1.1. Frequency Sweep Tests
Frequency sweep tests are a useful tool to assess the mechanical response of the material microstructure in its quiescent state [
23]. It is known that the magnitude of the storage modulus
can be related to the molecular weight and network density [
18]. In this test, the stress amplitude is kept constant at a value low enough to ensure that the flow is kept within the linear viscoelastic regime throughout the range of frequency.
Figure 4 shows the storage modulus
and the loss modulus
as a function of the frequency, for the 0.1 wt% aqueous Carbopol dispersion and for the 0.125 wt% Carbopol dispersion in the water/glicerol solution. It is worth recalling that the composition of these two solutions were chosen such that both possess the same yield stress. Comparison of the curves for the two dispersions illustrates the influence of the solvent type on the moduli.
It is seen in this figure that our data lie within the classic rubbery region (or frequency range) [
54], since
remains essentially constant and much larger than
throughout the frequency range, as expected for viscoelastic solids and crosslinked systems [
64,
65]. The
curves, on the other hand, increase with frequency.
Moreover, it is seen in this figure that the and curves for the two materials are essentially coincident, except towards the high end of the frequency range, where the curve for the aqueous dispersion lies below the one for the dispersion in water/glycerol, while for the curves the reverse is true. This indicates that more mechanical energy is dissipated at larger frequencies, and that the more viscous continuous phase tends to dissipate more energy. Moreover, the fact that the moduli of the two dispersions are essentially coincident suggests that the yield stress and the moduli—which are completely distinct properties—are closely related to the microstructure characteristics at its quiescent state, which is expected to be similar for both dispersions.
3.1.2. Time Sweep Tests
The time sweep test consists of observing how the moduli change over time for a constant frequency and stress amplitude. The choice of stress amplitude and frequency should be such as to ensure that the flow is within the linear viscoelastic regime, i.e., the imposed stresses should be negligible when compared to the strength of the microstructure. This test is usually employed to investigate the material stability, i.e., if microscopic changes occur over time. Useful information such as polymer degradation, molecular weight building, cross-linking, solvent evaporation, sedimentation, setting and curing can be obtained with this test. It also allows the determination of the maximum time duration of a test to ensure that none of the just listed effects will interfere in the results.
Figure 5 compares the complex modulus
time sweep results for the 0.1 wt% Carbopol aqueous dispersion and for the 0.125 wt% dispersion of Carbopol in water/glycerol solution. Both curves were obtained at 1 Hz and at stress amplitudes well below the yield stress (which is 2.7 Pa), namely 0.08 and 0.1 Pa, respectively.
The results in
Figure 5 show that the dispersions under investigation are very stable and free from aging, as indicated by the fact that the
curves are essentially horizontal, except for a very short transient behavior probably due to microstructure rebuilding after sample loading. The curve for the water/glycerol dispersion lies above the one for the aqueous dispersion, in accordance with the discussion and results presented above.
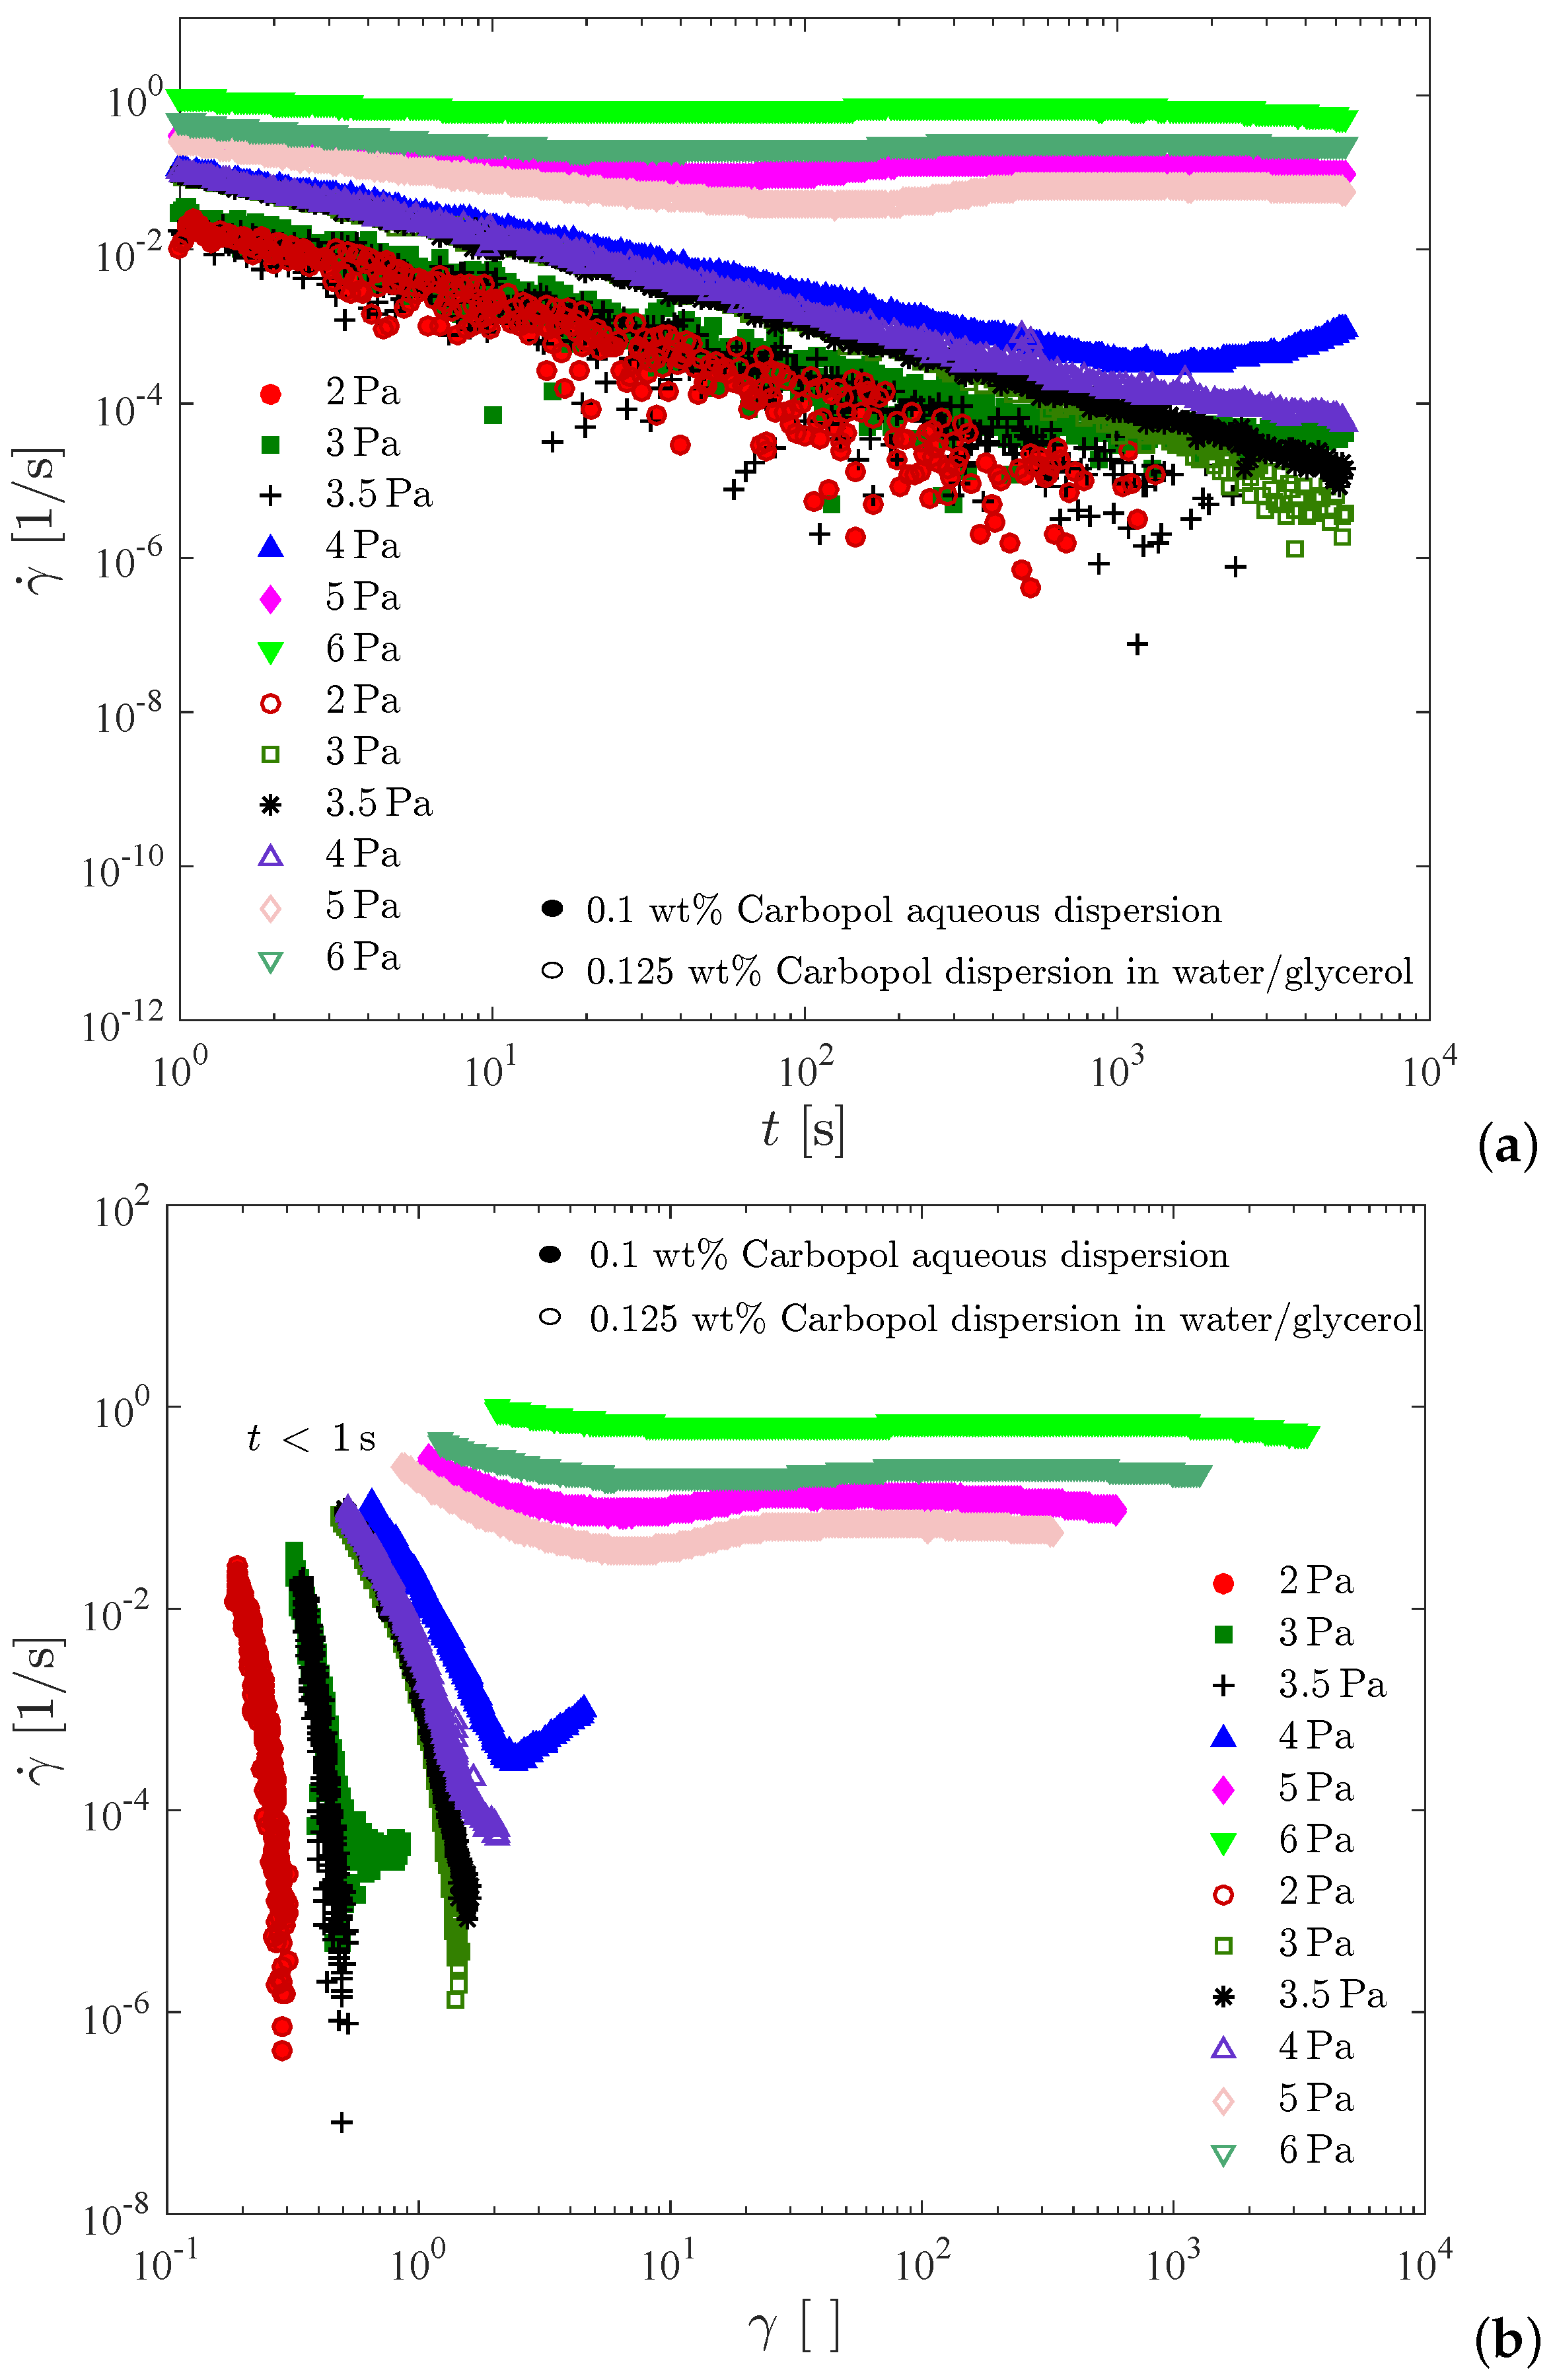
3.2. Constant Shear Rate Tests
Figure 6 shows the transient viscosity of the two Carbopol dispersions that possess the same yield stress. In this test, the sample is loaded on the rheometer and left to rest for a few minutes to allow for the microstructure reconstruction. Then, at time
we impose a constant shear rate, and record the transient shear stress (or viscosity) response. Due to the error caused by the instrument inertia, the data pertaining to the first second of each test were discarded.
For both dispersions and all shear rate values investigated, it is seen in
Figure 6 that the viscosity eventually reaches a steady state. The larger the shear rate the lower the steady-state viscosity, because larger shear rates imply larger shear stresses, which in turn result in more intense microstructure breakdown. Consequently, structuring levels pertaining to larger shear rates are lower, and there is a one-to-one relationship between the steady-state viscosity and the structuring level (e.g., [
62,
66,
67]).
Figure 6 also shows that for both dispersions the time required for the steady state to be reached, say
, decreases as the shear rate is increased. Specifically,
s for
s
, respectively. These results are in agreement with the generally accepted rule of thumb
used to estimate
. To understand this trend we first note that the steady-state stresses corresponding to very low shear rates are always very close to the yield stress, while for high shear rates the corresponding shear stresses are well above the yield stress. Therefore, the long times required for the achievement of the steady state at low shear rates mean that the Carbopol dispersions display a sizable thixotropic effect when the stress is very close but above the yield stress. For larger stresses there is no thixotropy, as indicated by the very short times required for the steady state to be achieved.
The shear stress evolution with time is well illustrated by the curve for the 0.125 wt% Carbopol dispersion in glycerol/water at
s
, highlighted in the insert of
Figure 6. At time
, the gel is unstrained and fully structured, and thus it is a viscoelastic solid. At
, when the shear rate jump occurs, a corresponding shear stress jump is expected due to an initially purely viscous response of the still unstrained sample. This viscous contribution to the stress is expected to remain fixed while the material remains fully structured, because the shear rate remains fixed in this test. The strain increases linearly, starting from zero at
, causing the growth (also from zero) of the elastic contribution to the stress.
At large enough strains (but still below the yield point), the elastic contribution to the stress becomes much larger than the viscous one, and a linear growth of the (total) stress is observed. When the stress reaches the yield stress, the microstructure undergoes a major collapse and ceases to be percolated, and hence the material becomes a viscoelastic liquid and eventually a steady state is reached.
A sizable stress overshoot followed by a slight undershoot is observed in this curve, because in this case the imposed shear rate is small enough to cause stresses just above the yield stress, so that the microstructure does not respond instantaneously to the stress changes (i.e., thixotropic behavior).
For larger imposed shear rate values, most of the features of the stress evolution described here for s are expected to be preserved, but occur too fast to be observable in this test.
The influence of the solvent type on the transient viscosity is quite mild. It is observed that for the lower shear rates, slightly longer values are required for Carbopol dispersions in water/glycerol. This suggests that the breakup process is hindered by the higher viscosity of the water/glycerol solution.
3.3. Flow Curves
The effect of the type of solvent and Carbopol concentration on the flow curve is illustrated in
Figure 7, where the (steady-state) shear stress is given as a function of the shear rate for the 0.1 wt%, 0.123 wt% and the 0.125 wt% Carbopol aqueous dispersions, and also for the 0.125 wt% and 0.15 wt% Carbopol dispersions in the water/glycerol solution.
All flow curves are obtained by decreasing the shear rate from 100 to 10 1/s. This procedure reduces significantly the time duration of the tests, as compared to imposing ascending shear rate values. It is worth emphasizing the importance of determining a large enough time at each applied shear rate, to allow steady state to be achieved before moving to the next shear rate value. As mentioned above, the steady-state time can be estimated as . In our experiments, we impose each shear rate value for a maximum period of 1000 s. At each 30 s, an averaged torque is recorded. After three consecutive 30-s periods the corresponding values of the averaged torque are compared, and steady state is assumed when they are the same within 0.1%.
The range of shear rate is limited from below by the rheometer torque resolution and from above by sample inertia effects. In addition, the use of cross-hatched parallel plates should be limited to moderate shear stresses, to avoid the occurrence of flow within the protuberances. In this connection, a smooth Couette geometry was used in the range between 3000 and 100 s.
All the flow curves given in
Figure 7 possess the usual Herschel-Bulkley shape. In addition, all of them are monotonic, indicating that shear banding does not occur [
68,
69].
The Herschel-Bulkley parameters for all curves are also given in
Figure 7. As expected, it is seen that, for a given continuous phase, increasing the Carbopol concentration causes both the yield stress and the consistency index to increase, and the power law index to slightly decrease [
70]. Moreover, the values found for the power-law index ranged from 0.38 to 0.48, in good agreement with the observations of [
17].
It can be seen in
Figure 7 that the flow curve for the 0.125 wt% aqueous dispersion lies well above the one for the 0.125 wt% dispersion in water/glycerol, demonstrating that at the same, Carbopol concentration, the one with a more viscous solvent, possesses a significantly lower viscosity level. In addition, the dispersion in water/glycerol possesses a higher power-law index than the aqueous dispersion, and hence the former is less pseudoplastic than the latter.
Comparing now the flow curves of two dispersions with the same yield stress (0.1 wt% aqueous dispersion and 0.125 wt% dispersion in water/glycerol; and 0.125 wt% aqueous dispersion and 0.15 wt% dispersion in water/glycerol), the dispersions in water/glycerol possess a viscosity level higher than the one of the corresponding aqueous dispersions, as it can be directly observed in
Figure 7.
3.4. Creep Tests
The creep test consists of imposing a constant shear stress to an initially unstrained and fully structured sample, and recording the time evolution of the shear rate (or viscosity). It is commonly employed to assess viscoplastic and thixotropic effects of complex fluids, and especially to measure the yield stress [
9,
71,
72,
73]. A number of creep tests are required in order to identify the yield stress: if the imposed stress is lower than the yield stress, then the shear rate approaches zero as a maximum elastic strain is approached, as expected for solids of amorphous microstructure [
60,
61,
74]; and if the imposed stress is above the yield stress then the shear rate eventually attains a constant (steady-state) value [
75].
The yield stress obtained from creep tests is the so-called static yield stress,
, i.e., it is the stress needed to cause irreversible flow on a sample initially unstrained and fully structured [
9,
71,
72]. In contrast, the shear stress obtained from curve fitting to data of a flow curve test is the so-called dynamic yield stress,
. In general, these two yield stresses are distinct from each other, the dynamic yield stress being smaller than static yield stress [
71].
Figure 8 presents creep test results for the 0.1 wt% Carbopol aqueous dispersion and for the 0.125 wt% Carbopol dispersion in water/glycerol. In
Figure 8a the shear rate is plotted as a function of time, while in
Figure 8b the same data are plotted as a function of the shear strain,
. For all curves shown in
Figure 8, the data obtained below one second were discarded due to contamination with the instrument inertia [
76,
77]. Therefore, for each curve in
Figure 8b a different initial strain is observed.
Figure 8 illustrates that the two dispersions possess similar static yield stresses, namely between 4 and 5 Pa for the dispersion in water/glycerol and between 3.5 and 4 Pa for the aqueous dispersion. It is noted that the curve for 4 Pa pertaining to the aqueous dispersion possesses a minimum at about 1400 s (or at a Hencky strain of about 2.5). Therefore, at 4 Pa the sample deformed elastically up to about 1400 s and then the microstructure collapsed, leading to the onset of irreversible flow. This long time delay before the occurrence of yielding is usually referred to as the avalanche effect [
78], and is another manifestation of the thixotropic behavior of Carbopol dispersions when the imposed stress is very close but above the yield stress. It is interesting to comment that had we conducted the creep tests for 1000 s only, we would have concluded that the static yield stress of the aqueous dispersion is above 4 Pa, because at this point there was no sign of irreversible flow. On the other hand, if the tests had lasted for two hours, for example, it is possible that the aqueous dispersion would flow at stresses below 3.5 Pa. Therefore, the static yield stress obtained with this test is a function of the time duration of the test. In fact, this is also true for any other method for measuring the yield stress, as extensively discussed in the literature (e.g., [
62]).
Ref. [
36] observed a similar behavior for a dispersion of Carbopol ETD 2050, and interpreted it as an avalanche-like behavior involving wall slip and transient shear banding. They assumed the Carbopol dispersion as a “simple yield stress fluid”, i.e., a non-thixotropic viscoplastic material. A roughened Couette cell was employed and shear-rate controlled experiments were performed. The same behavior was later reported by [
79] for shear-stress controlled experiments. On the other hand, the transient shear banding phenomenon was not observed by [
80] under similar conditions for a yield stress fluid. Ref. [
81] affirm that steady state is very difficult to be achieved under the influence of wall slip. Likewise, they observed that the solid-liquid transition is not reversible upon increasing or decreasing of the applied stresses, due to elastic and thixotropic effects. According to [
82], imposing a constant shear stress, the glass fluidization near yielding is very slow, and persistent spatial heterogeneities remain present. Ref. [
83] obtained a monotonic flow curve for a material that presented a time delay before yielding [
78], and concluded that thixotropy cannot be ignored. More recently, Ref. [
84] emphasized that the preparation procedure of Carbopol dispersions is of paramount importance as far as the final mechanical behavior is concerned. Low stirring times lead to large (non-colloidal) microgels and a non-thixotropic behavior. Long stirring times, on the other hand, lead to colloidal microgels and a time-dependent behavior. All this discussion attests that the physical origin of the time delay before yielding is not fully understood.
3.5. Constant Shear Rate vs. Constant Shear Stress Tests
Figure 9 presents a comparison between results obtained by imposing a constant shear rate, as in
Figure 6, and a constant shear stress, as in
Figure 8. For each dispersion, the values of imposed stress and shear rate were selected such that the steady-state viscosity was roughly the same both for imposed stress and rate.
For both dispersions considered in
Figure 9, a viscosity overshoot is observed when a constant shear stress just above the yield stress is applied. On the other hand, imposing a constant shear rate leads to a much milder and difficult to observe viscosity overshoot, and to a faster achievement of steady state.
This behavior can be explained by observing that the viscosity overshoot that occurs with the application of a constant stress just above the yield stress is due to thixotropy, i.e., due to the time lag that is observed between the application of the stress and the microstructure collapse (yielding). Moreover, the viscosity overshoot is milder when the shear rate is imposed because in this case the transient shear stress is larger, which reduces or eliminates the thixotropic effect.
Creep-Recovery Tests
The creep-recovery test consists of imposing a stress above the yield stress until steady state is achieved, and then imposing a step change to a stress below the yield stress. The shear strain is recorded, and plotted as a function of time. This test is useful to assess the elasticity of the yielded material and also to provide the time required for the microstructure to rebuild. During the first step of the test, namely when a stress above the yield stress is imposed, the structuring level is brought down to a certain extent, while during the second step when the stress is below the yield stress the microstructure rebuilds.
Figure 10 presents the time evolution of the shear strain for the 0.1 wt% Carbopol aqueous dispersion and the 0.125 wt% Carbopol dispersion in water/glycerol. Upon inspection of these figures, it becomes clear that the qualitative behavior of both solutions is the same. The results indicate that the dispersions possess no elasticity whatsoever at the structuring levels that correspond to 5 and 3.5 Pa respectively, as attested by the absence of recoil right after the stress reduction. Another result is that the microstructure of both dispersions rebuild instantaneously, since no flow is observed after the stress reduction.


 and
and 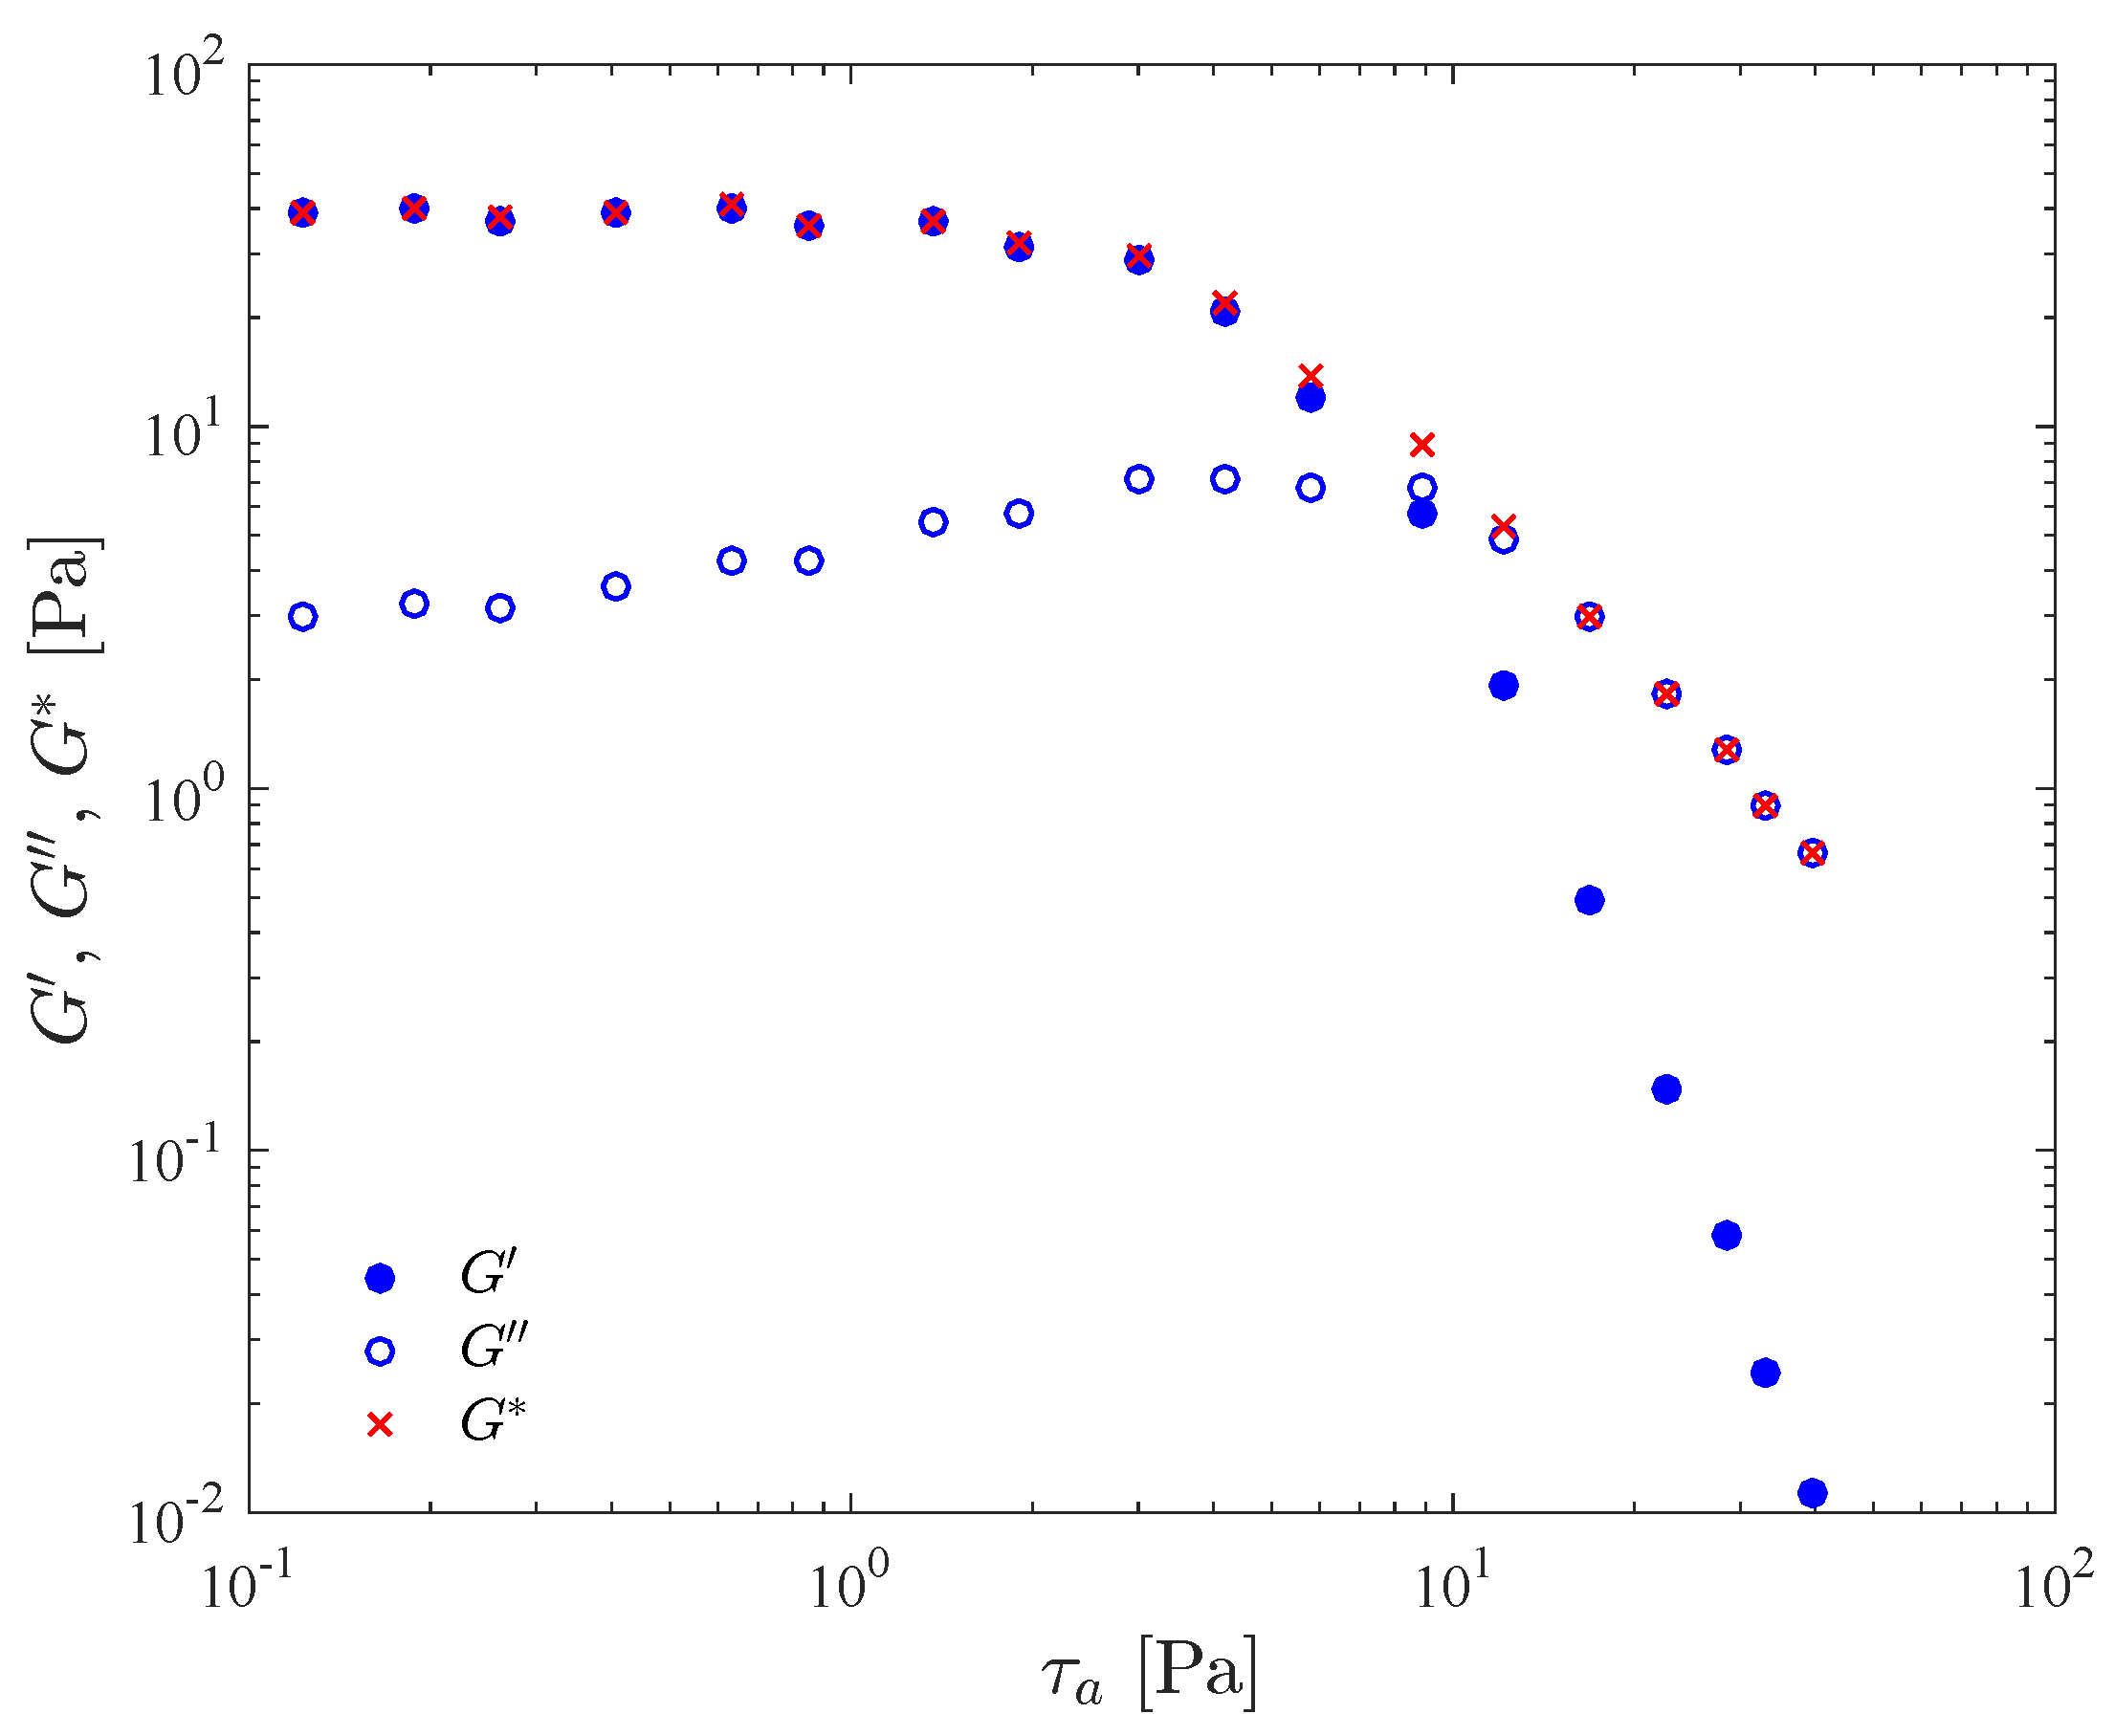


