Fluid Flow and Mass Transport in Brain Tissue


Chemical and Biological Engineering, Montana State University, Bozeman, MT 59717, USA
*
Author to whom correspondence should be addressed.
Fluids 2019, 4(4), 196; https://doi.org/10.3390/fluids4040196
Submission received: 29 October 2019
/
Revised: 19 November 2019
/
Accepted: 22 November 2019
/
Published: 26 November 2019
(This article belongs to the Special Issue Coupled Flow and Heat or Mass Transport)
Abstract
:Despite its small size, the brain consumes 25% of the body’s energy, generating its own weight in potentially toxic proteins and biological debris each year. The brain is also the only organ lacking lymph vessels to assist in removal of interstitial waste. Over the past 50 years, a picture has been developing of the brain’s unique waste removal system. Experimental observations show cerebrospinal fluid, which surrounds the brain, enters the brain along discrete pathways, crosses a barrier into the spaces between brain cells, and flushes the tissue, carrying wastes to routes exiting the brain. Dysfunction of this cerebral waste clearance system has been demonstrated in Alzheimer’s disease, traumatic brain injury, diabetes, and stroke. The activity of the system is observed to increase during sleep. In addition to waste clearance, this circuit of flow may also deliver nutrients and neurotransmitters. Here, we review the relevant literature with a focus on transport processes, especially the potential role of diffusion and advective flows.
1. Introduction
The brain is one of the last frontiers in physiology and medicine, and has been long under-explored due to difficulties and concerns of breaching the cranial vault. Over recent decades, the combination of new imaging technologies, transgenic (genetically-altered) animal models, and innovative surgical procedures have shed great light on the workings of the brain, importantly the live brain. In addition, non-invasive (or minimally-invasive) imaging technologies have enabled in vivo investigation of the human brain. As more data become available for study, the opportunity and necessity for engineers to contribute to the field of neuroscience is growing rapidly. A particular opportunity is integration of data into comprehensive models based on fluid dynamics, material science, transport phenomena, reaction kinetics and thermodynamic fundamentals.
The transport of molecules is an essential link in many physiological and pathological processes of the brain. For example, transport is critical to delivery of nutrients, such as glucose [1], and other materials needed for cell repair and renewal. Communication relies on molecular transport, where transport rates determine the range-of-action for neurotransmitters [2,3] and transport effects cell-to-cell communication [4]. The brain produces metabolic waste at a higher rate than any other organ, making transport of molecules out of the brain (waste clearance) a critical cerebral process [5]. In addition, fluid flow can initiate cell activity (mechano-transduction) such as the opening of cell receptors [6]. Finally, transport is a major determinant in delivery of therapeutics to the brain and the movement of biomarkers to the peripheral body for detection [7].
Waste clearance has recently been the most studied role of molecular transport in the brain, as its failure is a central feature of neurodegenerative disease [4] and injury, such a post traumatic brain injury (TBI) [8,9]. Protein aggregates, mis-folded proteins that accumulate into insoluble clumps, are a common feature in patients with amyotrophic lateral sclerosis (ALS), Alzheimer’s disease, Parkinson’s disease and other neurodegenerative diseases, implying that reduced clearance from the brain could be a shared phenomenon in neurodegeneration [10]. The removal of protein waste was traditionally attributed to intra- and extra-cellular degradation [11], or for select proteins, by tailored protein channel transport across vascular cell walls [12,13]. Contemporary researchers are elucidating an ordered molecular transport pathway in the brain, which utilizes cerebrospinal fluid, brain-specific anatomy, and state of consciousness (i.e., sleep), and may be a complimentary process for clearing potentially toxic waste from brain tissue.
Due to the demonstrated role of this waste transport pathway in neurodegeneration, stroke [14], diabetes [15], depression [16], multiple sclerosis [17], and others [18,19], the literature in this field has become extensive. In this review, we seek to summarize what is known specifically with respect to fluid and mass transfer mechanisms and the anatomy and physiology that directly affect transport. Fluid dynamic and mass transport calculations and computational models in this field suffer from an incomplete understanding of the physical situation, high variance in measured physical parameters, and limited quantitative data for validation of theories put forward. An effort is made here to thoroughly summarize the current understandings and key data as a reference for those interested in transport in the brain. Transport theories and governing equations appropriate to the different elements of brain transport are presented and discussed. The general focus is with respect to waste clearance, but most concepts apply directly to the functions described in the preceding paragraphs. Acronyms used throughout the text are summarized in Table 1.
2. Background
2.1. Relevant Physiology
Outside the brain, waste is cleared from tissues by the lymphatic system. Fluid “leaks” through blood vessel walls, driven by arterial pressure, and flows across the interstitial space that surrounds cells. Normal fluid movement through tissue is important for hydration, for nutrition, and to facilitate waste clearance. Interstitial flow is a slow, creeping flow, such as not to disrupt the delicate environment required by mammalian cells. Interstitial velocities in the peripheral body range from 10 to 100 μm/min [20,21]. The interstitial fluid (ISF), containing molecular waste and depleted in nutrients, is collected by lymph vessels, and delivered to the venous circulation where it is carried to the liver and kidneys for processing.
To protect the brain from threats like viruses, the blood–brain barrier (BBB) tightly controls transport of molecules across the cerebral vascular walls. Tight junctions between endothelial cells at the blood vessel wall prevent fluid leakage. Most molecular transport between the vasculature and the brain occurs via protein channels within the cell walls. Although many types of protein channels are present, each is specific to a particular molecule or narrow group of molecules. In addition, lymph vessels are absent from brain tissue (lymph vessels were recently identified in the meninges, which surrounds the brain, but is outside the BBB. See Section 3.4.2). From this perspective, the brain appears to lack a non-specific route for clearance, critical for molecules without a protein channel such as large polar substances like sucrose [12] and protein aggregates implicated in neurodegenerative diseases. Yet the brain’s high metabolic rate makes multiple routes of waste clearance imperative. It follows that the brain must have a non-molecule-specific system of waste removal.
The brain sits within a thick-walled skull, surrounded by and “bathed in” cerebrospinal fluid (CSF). CSF has long been thought to facilitate waste clearance, similar to lymphatics in the peripheral body, however the exact processes were poorly understood [5,22]. As shown in Figure 1, CSF circulates around the brain and spinal chord. It is produced mainly in the choroid plexus, a collection of special endothelial cells that filter blood plasma to create CSF. CSF is about 99% water with several dissolved ions, and has a much lower protein concentration than plasma (detailed compositions can be found in [23]). The choroid plexus is located in the lateral and fourth cerebral ventricles near the center of the brain. CSF flows through the ventricles to the cisterna magna at the lower back of the brain and into the subarachnoid space (SAS) that surrounds the brain and spinal cord. The brain produces approximately 500 mL of CSF daily. Only 100-150 mL fills the fluid spaces of the brain and spine at any time, inferring constant circulation and reabsorption [5]. CSF efflux is via arachnoid granulations in the SAS (Figure 1) and along nerve bundles exiting the brain and spine.
Unique to cerebral vasculature is an annular space surrounding each blood vessel as it penetrates the brain tissue that is filled with fluid, called the perivascular space (PVS) [24]. As blood vessels penetrate the tissue and branch into ever smaller vessels, the perivascular space follows at least to the level of arterioles and venules, and possibly capillaries, reaching all parts of the brain. As illustrated in Figure 2, the PVS is bounded on the inside by the vascular wall and on the outside by glial limitans, which consist of layers of astrocyte endfeet. (Astrocytes are glial cells with several long cellular processes terminating in endfeet. See reference [25] for descriptive illustrations of perivascular space at different levels of the vasculature.) The inner wall is elastic, and transport of molecules is tightly controlled by the BBB. The outer barrier, which we term the perivascular “wall” (PVW), is mechanically more rigid and is permeable. Molecules can enter the interstitium through gaps between endfeet and through specific protein channels in the endfeet walls, such as aquaporin-4 (AQP4) that transports water. This perivascular space has been shown to be connected to the cerebrospinal fluid (CSF) of the subarachnoid space [26,27], giving CSF thorough access to brain tissue.
In the current literature, the terms ‘perivascular’ and ‘paravascular’ are each used, sometimes interchangeably, to refer to the annular space described above. Some authors use both terms to differentiate two hypothesized compartments surrounding the cerebral vasculature: perivascular, referring to the space within the basement membrane of the smooth muscle cells adjacent to the vascular wall, and paravascular, referring to the space adjacent to the astrocytes (the reason for this hypothesized separation is discussed in Section 3.1). “Virchow–Robin space” is also a term used to refer to the paravascular space. No consensus currently exists within the field on this terminology, in part because there is not yet a clear anatomical understanding of the nature of these spaces and whether they differ from each other. For simplicity, we use the term ‘perivascular’ to indicate the fluid-filled, annular space surrounding cerebral vasculature, and do not distinguish separate compartments.
Brain tissue, also called the parenchyma, is made up of neural and glial cells, as well as the fluid-filled spaces between the cells, called the extracellular or interstitial space. The interstitial fluid (ISF) that fills the extracellular space (ECS) is believed to have a composition similar to CSF [29], around 99% water. Within the interstitial fluid, ion concentrations are regulated to optimize signaling, and at the same time waste must be promptly removed to minimize neurotoxicity [29].
The ECS and possibly the PVS contain a network of proteins called the extracellular matrix (ECM). ECM may impede fluid and mass transport in the ECS and PVS. Cerebral ECM is primarily composed of brain-specific glycosaminoglycans (GAGs) [5]. GAGs give the ECM characteristics of excellent shock absorption and high polarity, attracting water molecules and acting as a lubricant.
2.2. Relevant Transport
For the application of waste clearance, molecules to be transported out of the brain reside in the extracellular space, which is filled with interstitial fluid. The ECS is a tortuous and narrow space where the width of channels measures 40–60 nm [30] (Figure 2 insert). Molecules move by diffusion down a concentration gradient, colliding with each other and the cell walls. Some may interact with the cell walls or ECM, slowing their progress. Diffusion may be augmented by advection, or interstitial flow. If flow exists in the interstitial spaces of the brain, it may be at most similar in magnitude to interstitial flow in other tissues of the body, measured at 10–100 µm/min [20,21]. The interstitial fluid of the brain is believed to be similar to the CSF, mostly water and a Newtonian fluid [31]. The Reynolds number (Re) of a potential flow in the interstitial spaces is therefore around Re = 10−7 to 10−6, indicating a creeping (Stokes) flow where viscous forces dominate. For large molecules, diffusive and advective rates are similar, and the coupling of fluid and mass transport leads to more efficient waste removal.
In the peripheral body (outside the brain), a molecule moves through the ECS to the nearest capillary or lymph vessel, an average of 20 µm away. The molecule permeates the wall of the vessel and enters a “pipe” with significant flow. The average velocity of lymph is about 1 mm s−1 [32] (1000 times faster than interstitial flow). Re for lymphatic vessel flow is about 0.1, indicating laminar flow where inertial forces also govern fluid dynamics. In brain tissue, due to the BBB and the absence of lymph vessels, molecules must transport either all the way to the CSF surrounding the brain or to the nearest perivascular space. The path from ECS to perivascular space is approximately 60 µm and the path from ECS to CSF is a distance of millimeters. It was traditionally thought that transport through brain tissue was by diffusion only to the CSF. If perivascular advection occurs with velocities at even a fraction of lymphatic flow, waste clearance rates are significantly faster.
2.2.1. Diffusion and Advection
Movement of molecules in a fluid occurs by two possible mechanisms: diffusion and advection (in the field of brain transport, convection is the combination of both diffusion and advection). Diffusion occurs via the random motion of molecules from high to low concentration. Diffusion is always occurring, and its rate depends upon the size of the molecule. Advection is the transport of a substance by bulk flow. Bulk flow requires an external driving force, a common one being a pressure gradient. In a free medium, advection is molecular-size independent; all solute molecules move in the direction and with the velocity of the bulk flow. The characteristic time scale (Figure 3), useful in comparing the rates of different processes, for each transport mechanism is
where
- = relevant length scale,
- = velocity, and
- = diffusivity.
Often, both mechanisms occur simultaneously and the Peclet () number is utilized to understand their relative impact on overall rate of transport. is the rate of advection over the rate of diffusion (or characteristic diffusion time divided by the characteristic advection time). For , transport is predominantly diffusion, and transport is primarily by advection.
2.2.2. Osmotics
Since body fluids contain many solutes (CSF osmolality = 289 Osm/L), osmosis must always be considered. If large solute gradients exist that are not rapidly adjusted by diffusion, they result in an osmotic potential, or pressure. Osmotic pressure can drive water flow across cell walls to balance the overall solute concentration, via dilution. Within the brain interstitium, most of this flow occurs locally and is managed locally. Aquaporin channels (AQP), protein channels specific to water, in the vascular walls are constantly transporting water between the interstitial fluid (ISF) and the blood to balance osmotic differentials associated with local solute variations.
2.2.3. Transport Equations for Interstitial Space (Porous Media)
Despite the incredible complexity of brain tissue, from a transport perspective it has been successfully treated as a homogeneous, porous tissue, using the simplification of a stationary phase (the cells) and a mobile phase (the ISF). This requires the inherent assumption that the heterogeneous nature of brain tissue behaves in a homogeneous way over the length scale of interest. The porous media approach has been useful in characterizing this complex material in a way that can be simply described and compared when looking at transport in different regions of the brain, and in the healthy versus diseased or injured brain. The transport equations describing flow and mass transfer in porous brain tissue are
where
- = concentration in the ISF,
- = free diffusivity,
- = tortuosity,
- = apparent diffusivity,
- = source term,
- = void volume = VECS/Vtotal,
- = cellular uptake and adsorption,
- = superficial velocity,
- = hydraulic conductivity, and
- = pressure.
The mass transfer equation (Equation (4)) includes a diffusion term, a source term, a reaction or adsorption term, and an advection term. It is adapted for porous media by including void volume and tortuosity. Void volume is the fraction of the ECS volume to the total volume. Tortuosity represents the degree to which molecular transport is slowed by interaction with the porous medium; it is a property of both the medium and the molecule. Tortuosity incorporates (1) the additional distance a molecule must travel to move around obstacles in the medium, including dead spaces (“dead-end” pores), and (2) how its progress is slowed by interaction with the walls and extracellular matrix, or exclusion from pathways due to molecular size. The continuity equation (Equation (5)) is a statement of conservation of mass, shown here for a fluid of constant density.
Darcy’s law for flow in a porous media (Equation (6)) relates superficial velocity to hydraulic conductivity and pressure gradient. Superficial velocity is a non-physical variable peculiar to porous media flow; it is a hypothetical flow velocity calculated as if the mobile (liquid) phase were the only phase present in a given cross-sectional area. Superficial velocity leads to ease of calculations for volumetric flow and other variables. Intrinsic velocity is the actual liquid velocity within the ECS at a specific location. Average intrinsic velocity () is simply superficial velocity () divided by void volume, . Hydraulic conductivity is a parameter of the tissue, characterizing the ease with which a fluid moves through a porous media. The hydraulic conductivity of brain ECS has been shown to vary with void volume fluctuations [33].
Darcy’s law assumes an incompressible fluid and a flow dominated by viscous forces ( << 1, Stokes Flow). These assumptions hold true in brain tissue due to the very small dimensions of the interstitial space and the small pressure differences possible within the brain (see Section 3.6.2.), leading to small velocities. More complex models exist for flow in porous media [34], but Darcy’s law is the most appropriate for the very low Reynolds numbers encountered in interstitial flow. “Darcy’s law has been utilized successfully in several biomedical applications” [34] (see Swartz et al. [21] for a more detailed discussion of interstitial flow and mass transport in biological tissues).
2.2.4. Equations of Flow for Perivascular Space
The perivascular space is annular, filled with CSF, and may also contain ECM. The width of the PVS is similar to the vessel diameter, around 30–40 µm for arterioles and venules. As described above, its inner wall is elastic and impermeable, and its outer wall is more rigid and permeable. We assume for now perivascular flow is laminar, based on lymphatic flow in the peripheral body, and may be through porous media, due to the ECM. Brinkman developed a model for porous media flow that accounted for boundary effects [35], such as in a vessel (Equation (7)). Flow in the perivascular space is defined by the Navier–Stokes equation, modified with a Darcy term (last term) for porous media dampening, and the continuity equation (Equation (8))
where
- intrinsic velocity;
- effective viscosity;
- density;
- pressure;
- void volume;
- gravitational acceleration, and
- hydraulic conductivity
Perivascular flow may be driven by a pressure difference, ISF or CSF production, or by peristaltic motion due to pulsation of the vascular wall (discussed further in Section 3.6.1.). In the case of peristaltic flow, the inner boundary deforms transiently with the passage of arterial pulse waves, adding significant complexity to the solution of Equations (7) and (8).
2.2.5. Transport Parameters
Measurement of transport parameters and tissue properties in living organisms is challenging. In vivo measurements are preferred, as significant changes have been observed upon the fixation of tissues required for ex vivo imaging and analysis, such as shrinkage. However, even in vivo measurements can be inaccurate, as invasive procedures may cause physiological stress that affects parameter values. Although non-invasive imaging techniques are developing, they often lack the resolution to measure fundamental properties and structure changes, such as tissue permeability and vessel expansion during arterial pulsations. Therefore, good measures of physical parameters are rare and significant parameter variance exists across the literature. Results from calculations and computational models are often highly dependent on model assumptions, notably which parameter values were employed, and can be challenging to verify given quantitative experimental observations are also rare. It follows that conclusions drawn from such models should be considered in light of the assumptions made.
3. Evolution of the Field
3.1. Key Experimental Work
The majority of the experimental work investigating molecular transport in the brain tracks the movement of molecular probes, or tracers, to draw conclusions about transport. Nicholson gives an excellent review of the early studies including radiotracers, real-time iontophoresis (RTI), and integrated optical imaging (IOI) [38]. Tracers were chosen to minimize cellular interaction () and maximize signal. Initially, transport was assumed to occur by diffusion only (no advection) due to the very small dimensions of the fluid-filled space and therefore large perceived resistance to flow. Using Equation (4) without the advection term, experimental data was reduced to the porous media parameters of void volume () and tortuosity (λ) to characterize and compare tissue in the brain. A void volume of about 20% and tortuosity of about 1.6 (for small molecules) are surprisingly consistent across brain regions and adult species [36]. These parameters were also shown to change significantly during development and to be altered by pathologies and external conditions, most notably altered osmotic conditions.
Helen Cserr was among the first to note tracer movement in the brain that was much faster than would be expected by diffusion alone and occurred along preferential routes that looked to follow the vasculature [49]. Cserr et al. also observed similar efflux rates in rat brains for three interstitially injected molecules whose diffusion coefficients spanned a five-fold range, concluding this molecular-size independent transport was driven primarily by advection [22]. Rennels et al. investigated whether CSF could move from the subarachnoid space into the interstitial fluid. Horseradish peroxidase (44 kDa) injected into the subarachnoid CSF of dogs and cats was observed to move rapidly along parenchymal vasculature and entered the ECS within minutes of injection [50]—faster than could be explained by diffusion alone. Rennels et al. were also able to distinguish the influx pathway of the tracer molecules as the perivascular space surrounding cerebral arteries.
Beta-amyloid deposits surrounding cerebral vessels were identified as a hallmark of Alzheimer’s disease, providing additional evidence for solute transport along the vasculature [51,52]. Beta amyloid was considered a “natural tracer”—the deposition of aggregates indicating failure of the normal clearance route. Deposits are found along arteries, arterioles, and capillaries, but rarely along veins and venules [53,54], suggesting solute clearance from the parenchyma occurred outward along a periarterial space [53,55,56,57]. Further, deposits are observed to accumulate around the walls and in the basement membranes of cerebral vessels [52,53], not in the classic perivascular space where Rennels et al. observed tracer movement. It was hypothesized that ISF flowed out along the basement membranes of arterioles and arteries, carrying extracellular waste. In 2008, Carare et al. observed outward, advective transport of tracers from the parenchyma along the basement membranes of arterial walls, confirming this idea [55].
A mechanism was sought for this unexpected flow within the highly-resistive basement membrane and in opposition to blood flow—“retrograde” flow [52,56,58,59]. Weller et al. introduced the idea of a drainage pathway along the basement membrane of the smooth muscle cells, which make the outer wall of capillaries and arteries, directly to cervical lymph nodes and separate from CSF drainage [57]. This direct route from the parenchyma to the lymphatic system provided a significant pressure differential for driving advective flow (further discussed in Section 3.6.4.). However, it required a physical separation of the periarterial space into two compartments: (1) a basement membrane drainage route and (2) a perivascular route connecting SAS CSF to the parenchyma (Figure 4). The basement membrane route was termed the “perivascular” space by Weller and has been called the intramural periarterial space by others [12,29]; intermural periarterial is used throughout this text. The route connecting the SAS to the parenchyma was termed the “paravascular” space by Weller and the extramural periarterial space by others [12,29], extramural periarterial is used throughout this text. A layer of pia-arachnoid tissue was proposed to separate the two spaces.
In 2012, an imaging study enabling observation of tracer movement in live subjects shed further light upon this idea of preferential transport routes. Using in vivo two-photon laser scanning microscopy, Iliff et al. (the Nedergaard group) showed movement of tracers from subarachnoid CSF along the periarterial space into the brain [27]. Fluorescent ovalbumin (43 kDa) was shown to enter the brain specifically within the periarterial space, between the smooth muscle (of the outer vascular wall/inner perivascular wall) and the astrocytic endfeet (of the outer perivascular wall). Three tracers of varying molecular size (3, 40, and 2000 kDa) were observed to move from the SAS rapidly and at similar rates along the periarterial space into the brain, which was interpreted as advective flow. The two smaller tracers crossed the “periarterial wall”, moving into the interstitium. The rate of fluorescence increase in the interstitium was slower for the larger molecule (see Section 3.6.2. for the effect of molecular size on transport rates). Iliff et al. used ex vivo microscopy to observe the tracers leaving the interstitium along large venous structures to primary perivenous drainage pathways.
Investigating tracer transport from the brain interstitium outward, Iliff and colleagues observed the clearance rate of interstitially delivered dextran-10 (10 kDa) was identical to mannitol (380 Da) [27], confirming the findings of Cserr. Having observed transport from the CSF into the brain interstitium to be molecular-size dependent with exclusion of the largest tracer from the interstitium, and transport from the interstitium out to be molecular-size independent; Iliff et al. hypothesized a molecular-size dependent resistance at the periarterial wall [27].
Seeking to understand the biological mechanisms at the perivascular wall, Iliff et al. conducted experiments comparing clearance from Aqp4 knockout (KO) mice, mice lacking AQP4 channels, to wild-type (WT) mice [27]. AQP4 is a water channel that is preferentially expressed on the astrocytic endfeet (covering approximately 50% of their surface [61]) comprising the perivascular wall. A 70% reduction in mannitol clearance was observed in KO mice compared to the WT mice. Periarterial influx was observed to be unaffected, while the 3 kDa tracer movement into the interstitium was abolished in the KO mice. The authors hypothesized that astroglial AQP4 channels might be a low-resistance pathway for water movement through the interstitium, maintaining the advective flow circuit from the periarterial to perivenous space.
3.2. Glymphatic Hyothesis
From the observations noted above, Nedergaard’s group proposed the following theory for transport of molecules in the brain (Figure 2) [4,10,27]
- CSF from the subarachnoid space moves along periarterial spaces into the brain (in the same direction as blood flow, termed antegrade) by advective transport;
- From the periarterial space the fluid moves into the brain interstitium, facilitated by AQP4 channels on astrocytic endfeet comprising the perivascular wall;
- The fluid flows across the interstitium, dissolving or entraining waste molecules, and
- Carries them to the perivenous space, where they are transported out of the brain via primary perivenous drainage pathways.
This theory was named the glymphatic system due to its dependence on glial cells (astrocytes) and its lymphatic-like purpose—a circulatory system outside the cardiovascular system that clears extracellular waste. The glymphatic system thus proposed both perivascular and interstitial advection, adding perivascular velocity, perivascular wall permeability, and interstitial hydraulic conductivity to the list of key parameters describing transport in the brain (Table 2).
Several researchers have confirmed the antegrade perivascular flow observed by Iliff et al.—solutes moving from the SAS into the parenchyma along periarterial space and out of the parenchyma via perivenous space [14,25,50,62,63,64,65]. In addition, new findings offer different interpretations of previous observations supporting intramural periarterial flow. New theories of beta-amyloid plaque formation, e.g., shear-induced amyloid formation [66], have developed that are independent of the direction of perivascular flow. Bedussi et al. demonstrated a single periarterial compartment, rather than physically separated compartments that might allow flow in opposite directions [65]. Fixation artifacts [39] may explain Carare’s observation of intramural periarterial transport. However, multiple observations, including in vivo, of periarterial efflux [55,67,68,69] have not yet been explained.
Smith et al. (the Verkman group) repeated Iliff et al.’s experiments in 2017, corroborating transport along the periarterial space faster than diffusion, but finding diffusion alone was adequate to describe transport in the interstitium and also observing no differences in clearance for Aqp4 KO vs. WT mice [62]. To our knowledge, Smith’s work is the only attempt at a direct reproduction of Iliff’s AQP4 experiments. However, several groups investigating the impact of the glymphatic system on different pathologies have corroborated Iliff et al.’s findings. A recently published meta-analysis cites decreased ISF tracer clearance in Aqp4 KO mice and rats in five of six studies (the one outlier being Smith et al.). and demonstrates a clear positive correlation between AQP4 and ISF tracer clearance [70]. Further, Smith et al. used different injection methods and a different strain of Aqp4 KO mice. “The meta-analysis identified the anesthesia protocol, wide range of experimental animals, and injection paradigm were potential causes for the conflicting data reported by Smith” [70].
3.3. Transport in the Whole Brain: Dynamic Contrast-Enhanced (DCE) MRI
Several studies have been published investigating glymphatic function throughout the whole brain using in vivo dynamic contrast-enhanced (DCE) MRI. DCE MRI enables a look at the live brain as a whole organ, but lacks the resolution of microscopy. For example, the perivascular space cannot be distinguished from the interstitium. Iliff et al. observed rapid movement of contrast agent along periarterial pathways to major influx nodes at the pituitary recess, olfactory bulb and pineal recess in rats [71], in agreement with the glymphatic hypothesis (the pituitary and pineal recess house major arteries, the posterior and superior cerebral, and major arteries connect the cisterna magna to the olfactory bulb, the anterior cerebral and olfactory). Contrast movement into and through the brain tissue was highly dependent on molecular size for two contrast agents of 938 Da and 200 kDa. Recall that in Iliff et al. [27], the 200 kDa tracer was excluded from crossing the periarterial wall and that perivascular and interstitial concentrations are combined in the DCE MRI signal. Gakuba et al. [72] (in mice), Benveniste et al. [5] (in rats), and others [14,15,73] confirmed transport of small molecules (638 Da) from the SAS CSF along specific pathways and into brain tissue via DCE MRI on similar time scales to Iliff et al. Pizzo et al. reported DCE MRI concentration changes and time scales for IgG (150 kDa), an endogenous antibody, similar to Iliff’s 200 kDa tracer results [1,2,25].
Dynamic contrast-enhanced MRI is minimally invasive and quantitative, and therefore can be extremely useful in validating results of theoretical models and making parameter calculations. All tracer studies described previously in Section 3. were semi-quantitative, providing approximate values for distance and time, but not concentration. However, DCE MRI has short-comings as signal is reduced for multiple reasons as the tracer penetrates deeper into the brain tissue that must be accounted for to use the data accurately. In DCE MRI, a contrast agent is injected that reduces the normal water signal in relative proportion to the local concentration of the contrast agent; DCE MRI measures the propagation of the contrast agent through this reduction in signal, relative to a pre-injection image. As contrast moves deeper into brain tissue its signal becomes reduced, or “washed out”. This washing out is due to three effects. First, the concentration simply gets lower (compared to the initial bolus) as the contrast agent spreads throughout the brain. Second, as the contrast agent moves into the interstitium (and even the PVS) it is present only in the extracellular space; as a result, there is less contrast agent per total volume, and the signal goes down in proportion with the void volume. Third, the agent’s contrast effect is dependent on the environment (e.g., proton density and mobility of contrast agent). This environmental effect is captured in a parameter called relaxivity, which is also dependent on the field strength. It is possible to measure relaxivity. However, with the exception of one instance [74], we have not found it mentioned or reported in brain transport publications. In addition, safety concerns exist for the required contrast agents. Therefore, DCE MRI studies are performed on animal models and only very rarely, with a clinical indication and outside the U.S., in humans.
Other whole-brain, non-invasive techniques are under development. Positron emission tomography (PET) uses a radioactive tracer, usually a biologically relevant molecule to which a radio-ligand has been attached. PET signal is not washed out due to relaxivity like DCE MRI, so PET provides a more closely quantitative result. A PET technique for monitoring beta amyloid, the characteristic protein aggregate implicated in Alzheimer’s disease, has already been used in human research studies [75]. PET-MRI, in which a PET tracer able to cross the BBB is administered intravenously, is a less invasive way to assess CSF clearance and is being developed for human studies [75,76]. Both MRI and PET are expensive experiments. Recently, transcranial fluorescence mesoscopic imaging has been applied to track cortical CSF flow in real-time in living mice [77]. This technique utilizes LED illumination, which enables fast switching between wavelengths (for tracking multiple tracers), and a macroscope with a wide field of view, enabling imaging of the entire surface of the mouse brain to a depth of 1–2 mm with a resolution similar to MRI (5 μm/pixel) (for comparison, two-photon imaging works to a depth of several 100 μm, and a full MRI scan requires minutes).
3.4. Efflux Routes and Meningeal Lymphatic Vessels
3.4.1. Efflux Routes
Molecular species within the brain are transported by two categories of mechanisms: molecule-specific and general. Molecule-specific mechanisms are tailored to an individual molecule and include transport via tailored protein channels across vascular cell walls into the blood stream [12,13] and intra- and extra-cellular degradation [11]. In a general mechanism, bulk fluid and solutes leave the brain via an efflux route, such as perivascular or perineural routes leading to extracranial lymphatic vessels. Based on a review of data for elimination of substances from the brain, Hladky et al. conclude “if there is a transport mechanism for a substance at the BBB (here meaning the vascular wall), then the BBB is more important than perivascular pathways for the elimination of that substance [12]”. However, some molecules, most importantly protein aggregates implicated in neurodegenerative diseases, do not have available transport routes across the vascular wall.
“A substantial portion of perivascular efflux of large solutes appears to pass to the lymph without first appearing in CSF at the cisterna magna” [12]. The cisterna magna is an enlargement, or reservoir, in the subarachnoid space located at the posterior (back) base of the skull, where CSF exits the ventricles to circulate through the SAS surrounding the brain and spinal cord. This observation suggests that ISF wastes, having exited the brain, do not mix in the CSF and either (1) clear to the CSF, but subsequently efflux through a route near their perivascular exit (glymphatic hypothesis), or (2) exit through a route that is separate from the CSF (intramural periarterial hypothesis).
Several efflux routes for ISF solutes out of the cranium via the CSF have been observed experimentally and are further described below
Arachnoid granulations are small protrusions of arachnoid matter into the dural sinuses (Figure 1B). They are the traditional outflow route for CSF from the SAS into the venous system. Bradbury et al. hypothesized that most of the large solutes in ISF flowed out of the parenchyma into a portion of CSF that subsequently left the brain via the cribiform plate to the nasal mucosa [69]. Perineural CSF surrounding olfactory nerve sheets carries fluid to nasal lymph vessels that cross the cribiform plate (Figure 1A), which separates the cranium from the nasal mucousa [79]. Nasal lymphatic vessels are possibly the most important route for CSF outflow to extracranial lymph vessels [80,81,82]. Meningeal lymph vessels are described below (Section 3.4.2.). Looking at Figure 1, the above list offers exit routes surrounding the brain, meaning a local CSF efflux route would be available to any perivascular exit from the parenchyma.
The exact proportion of clearance along each CSF efflux route is not yet known and may vary adaptively in response to other efflux routes [63,79,83]. For example, mice born without meningeal lymphatic vessels demonstrate no change in intracranial pressure (ICP) or brain water content [63], indicating another pathway has increased its CSF efflux to balance CSF production. With multiple efflux routes identified, it follows that fluid and solutes may simply leave the cranial vault by the path of least resistance.
The second hypothesis, efflux through a route that does not mix with the CSF, has been supported and investigated by Carare [55], Weller [57], and others [58,84]. They propose an intramural periarterial route that passes through the subarachnoid space, but remains physically separated from the CSF. “Interstitial fluid and solutes drain from the brain parenchyma into the basement membranes of capillaries (and then along) the basement membranes between smooth muscle cells of arteries. The ISF and solutes follow (a similar route along surface) arteries and continue through the base of the skull along the carotid artery to cervical lymph nodes. A layer of pia-arachnoid separates (the route in surface) arteries from the CSF in the SAS” [57]. This intramural periarterial efflux route correlates with observations of beta-amyloid deposition and periarterial efflux, and provides a pressure difference for periarterial efflux [55,68,84]. Using molecular characterization, Hannocks et al. recently found no evidence of a pial barrier physically separating surface vessels (both arteries and veins) from the SAS CSF [26], which was in contrast to previous electron micrograph morphological studies [85].
3.4.2. Meningeal Lymph Vessels
Although brain tissue lacks lymph vessels, lymph vessels within the cranium but outside the BBB have recently been identified and look to be an important general efflux route. Substances injected into the parenchyma or the CSF have long been observed in extracranial lymph vessels, such as the cervical lymphatics, although the exact route has remained undefined [29,33,57,86,87]. A network of lymph vessels was recently identified in the meninges (Figure 1B), which may be important to macromolecule clearance and immune surveillance in the brain [63,83]. The meninges are three layers of protective tissue that envelop the brain, external to the SAS. The outermost layer, the dural layer, is attached to the skull and contains the lymph vessels.
The meningeal lymph vessels (also called dural lymph vessels) are functionally capable of absorbing macromolecules from brain tissue and drain into the deep cervical lymph nodes [63,83]. Transgenic mice lacking meningeal lymph vessels demonstrate attenuated clearance of macromolecules from the brain and almost no drainage to the deep cervical lymph nodes [83,88]. In addition, tracers injected into the parenchyma that translocated to the deep cervical lymph nodes were also found in glymphatic spaces, suggesting a connection between the glymphatic system and the meningeal lymph vessels [63,79]. Based on the findings above, the newly identified meningeal lymph vessels provide a missing link for transport of macromolecules from brain tissue and CSF, inside the BBB, to extracranial lymph vessels, outside the BBB, and on to the systemic circulation [5,63,79,83,88].
3.5. Sleep Enhances Glymphatic Function
Studies by the Nedergaard group (published by Xie et al.) observed deeper penetration of a 3 kDa tracer from SAS CSF into brain tissue during sleep [37]. Using RTI, they measured a decrease in void volume with wakefulness, from 23% (asleep) to 14% (awake). (Most RTI experiments are carried out on anesthetized subjects. Xie et al. showed ketamine/xylazine anesthesia to be equivalent to sleep by electrocorticography (ECoG) and electromyography (EMG) recordings, which recorded high prevalence of “delta waves”.) As hydraulic conductivity is known to increase with void volume [33], these results suggest a potential increase in interstitial advective transport with sleep. Hypothesizing that adrenergenic signaling in the awake state modifies cell volume and thus void volume, Xie et al. demonstrated increased CSF tracer influx with administration of adrenergenic antagonists (in awake mice) comparable to influx observed during sleep. From their results, the authors hypothesize the activity of the glymphatic system increases with sleep (this particular proposal has become mainstream in popular culture [89]).
Ray et al. used the change in void volume measured by Xie et al. and a calculated proportional decrease in hydraulic conductivity to estimate the change in interstitial velocity with wakefulness (Table 3) (see Section 3.6.2 for further discussion of interstitial flow). Simulations of Xie et al.’s RTI experiments, using the estimated parameter values given in Table 3, demonstrate good agreement with experimental measurements (Figure 5) [46].
Additional evidence suggests changes in ECS structure and glymphatic activity with state of consciousness. The effect of anesthesia type and protocol on tracer penetration and clearance in the brain was investigated using DCE MRI, with differing results [5,72]. Apparent diffusion coefficient of water (ADCw) measurement by diffusion tensor-weighted imaging (DTI) MRI has also been developed as a non-invasive method of tracking changes in ECS structure, especially between wakefulness and anesthesia [72,90]. Vorisek and Sykova concluded ADCw is less exact than RTI, but can be correlated with changes in void volume [90]. The most significant support is a recent fMRI study in humans that demonstrates enhanced fluid flow in the brain during sleep [91] (see Section 3.6.1 for further details).
Xie et al.’s experiments are unique thus far, having trained an animal to sleep in the experimental apparatus. Sleep has a complex biochemistry and physiology, making it difficult to simulate pharmacologically. The recovery from anesthesia to a “normal” awake state is also difficult to objectify. The work referenced in this section, combined with Mestre et al. [70] highlights a strong correlation of glymphatic system function with both anesthesia and alertness. Until these relationships are better understood, studies should be interpreted with care. (The typical anesthesia for in vivo microscopy and RTI experiments in this field is ketamine/xyaline administered by injection. The typical anesthesia for DCE MRI experiments in this field is isoflurane administered by inhalation.)
3.6. Unanswered Questions
The glymphatic hypothesis (see Figure 2, and Section 3.2) leaves a few questions unanswered: (1) what drives advective flow in the periarterial space, (2) what provides the pressure differential for flow across the interstitium, (3) how do AQP4 water channels (preferentially expressed on the astrocytic endfeet of the perivascular wall) facilitate transport, and (4) what is the route and mechanism of perivenous efflux? The following sections discuss the physics, theories, and data regarding these unanswered questions. Not the marked difference in results from computational modelling due to use of different parameter values and assumptions.
3.6.1. Perivascular Flow: Influx
Potential drivers of perivascular influx are static pressure differential, arterial wall pulsation, and CSF production. The simplest driving force for perivascular flow would be a static pressure gradient. However, in the glymphatic hypothesis, flow is from the SAS (via the periarterial space, then interstitium, then perivenous space) back to the SAS. Local variations in SAS CSF pressure are no more than 0.03 mmHg [60,92], insufficient to drive the hypothesized flows [60].
Iliff et.al. proposed that arterial pulsation might drive periarterial flow [27]. In subsequent work, Iliff used in vivo and ex vivo analysis to test this hypothesis. Increasing the pulsatility of cerebral arteries with an adrenergic agonist accelerated CSF influx into brain tissue, while decreasing pulsatility through carotid artery ligation (a commonly used experimental model of cerebral hypo-perfusion) reduced perivascular CSF influx [93]. In earlier studies, Rennels et al. observed “rapid paravascular influx of (tracer) could be prevented by stopping or diminishing the pulsations of the cerebral arteries by aortic occlusion or by partial ligation of the brachiocephalic artery” [50].
Pulsation-driven flow in the periarterial space is hypothesized to occur by peristalsis. During propagation of the arterial pressure wave, the periarterial space is occluded, forcing fluid to move forward in the direction of blood flow. In the case of a circular tube, it has been shown that for Newtonian fluids there is always a net forward flow of fluid in the same direction as the travelling wave, even against a modest opposing pressure gradient [94]. Annular flow in the direction of the traveling wave was confirmed by computational model for the dimensions of perivascular space and an arterial pulse wave [95], predicting a high periarterial velocity of 105 μm s−1 with Re = 30. However, this study used a pulse wavelength of 100 μm, while the actual wavelength is believed to be on the order of meters [96]. Asgari et al. built a similar computational model incorporating porous media dampening (Equation (7)) and using instead a wavelength of 0.1 m, and concluded there was essentially no net flow [41]. Asgari et al. further showed how dispersion caused by wall pulsations could increase transport rate over diffusion alone (dispersion occurs when non-ideal flow patterns, such as within a pulsating vessel, accelerate transport of a molecule relative to diffusion and without net forward advective motion). Table 4 presents a comparison of periarterial computational modeling approach, assumptions, and simulation results to experimental measurements.
In 2018, both Bedussi et al. and Mestre et al. measured perivascular flow around a surface artery that was pulsatile, correlated with the cardiac cycle, and had net antegrade flow [39,40]. Measurements were made by tracking the movement of fluorescent microspheres. Mestre et al. observed an average perivascular velocity of 18.7 μm s−1 and Bedussi et al. 17–19 μm s−1, which give characteristic transport times around 1000 times faster than diffusion-only transport. The speed of the arterial wall matched that of the CSF, “suggesting arterial wall motion is the principal driving mechanism” of perivascular flow [39]. Interestingly, images of the perivascular space show a cross-sectional shape that is elliptical with a high eccentricity and comparative in area to the vascular cross section [39]. Mestre et al. observed a parabolic flow profile. Parabolic flow results from laminar flow through “empty space”, as opposed to porous space that would give a flattened profile. This result suggests the ECM in the PVS offers little resistance to flow.
Bedussi et al. also performed ex vivo confocal microscopy to determine whether microspheres continued from surface arteries into penetrating vessels. Some penetration into the brain parenchyma was observed along paravascular spaces at the ventral (bottom) side of the brain, but none at the lateral (side) and dorsal (top) parts of the brain [40]. This distribution agrees with DCE MRI results, where tracer progresses from the cisterna magna at the back of the brain, forward along the ventral surface of the brain at early times, progressing laterally at intermediate times and to the ventral surface at much later times (within the brain of mice and rats, arteries are predominant on the ventral surface and veins on the dorsal surface). It is unstated how much time passed in Bedussi’s experiments between injection of microspheres and sacrifice of the animal, perhaps not enough for tracer to reach the lateral and ventral surfaces of the brain. Bedussi et al. propose that either (1) the 1 μm microspheres were excluded from the PVS of penetrating arteries, or (2) CSF flows along PVS on the brain surface, and instead of penetrating the brain tissue, simply moves toward the front of the brain and exits the skull.
Mestre et al. found fixation, required for ex vivo studies, to collapse the perivascular space and disrupt perivascular tracer distribution [39]. Upon chemical fixation, the PVS cross-sectional area was shown to decrease by a factor of 10, with tracer moving vigorously towards the cisterna magna, in the retrograde direction, and into the basement membrane. This result calls into question ex vivo studies of perivascular flow, and provides a potential explanation for intramural periarterial flow observations.
A recently published study on the human brain suggests changes in cerebral blood volume coordinated with changes in CSF production may be a driver of fluid flow through brain tissue. Fultz et al. demonstrated the following coordinated sequence [91]
- slow neural waves that occur during non-rapid eye movement (NREM) sleep;
- followed by a decrease in cerebral blood flow;
- followed by an increase in CSF production.
The low-frequency oscillatory dynamics associated with NREM are an indicator of oscillating suppression of neural activity. The decrease in neural activity results in a decrease in blood demand. The decrease in blood flow decreases cerebral blood volume in the fixed cranial volume. CSF flow increases to fill the space previously occupied by blood, expanding the CSF and ISF-filled volumes of brain tissue. This coordinated sequence was observed to oscillate with a period of approximately 20 s, and therefore is not coordinated with cardiac cycle or respiration. The results are in agreement with observed increases in extracellular volume during sleep [37]. As this was a study of whole-brain dynamics, it leaves open several questions about the microscopic details. Is periarterial and/or extracellular volume increased? What are the routes of perivascular influx and efflux? How is pressure affected in the CSF and throughout the brain tissue? However, it provides evidence of an additional driver of perivascular flow—CSF production and cerebral blood flow dynamics.
In summary, periarterial flow has been measured and independently verified in surface arteries at a velocity of 17–19 μm/sec [39,40], about 1000 times faster than diffusion. Although it would be ideal to measure periarterial flow in penetrating arteries, a significant body of data supports faster-than-diffusion movement of tracers into the brain along periarterial routes [5,25,27,37,62,65,72,77]. Antegrade flow has also been well demonstrated, although the few observations of retrograde periarterial flow have not yet been explained. Work remains to understand the driving force of perivascular flow, although there is good support for arterial wall pulsation. Recent results suggest coordinated changes in cerebral blood volume and CSF production, especially during sleep, may also contribute to fluid flow through the brain.
3.6.2. Interstitial Flow
Several groups have concluded that diffusion alone describes transport in the interstitium [25,30,41,44,45,55,62], implying interstitial flow is negligible. However, others have found evidence of a slow interstitial flow [27,37,46,97]. For those who favor the glymphatic hypothesis, interstitial flow is necessary to bridge periarterial influx and the perivenous efflux [10,98], but it can be very slow, as interstitial volume is much greater than perivascular volume.
Interstitial flow velocity can be calculated using Darcy’s law (Equation (2)) if the hydraulic conductivity and the pressure gradient are known. Hydraulic conductivity of brain tissue has been reported in the literature ranging from 2 × 10⁻⁶ to 2 × 10⁻⁷ cm2 mmHg−1 s−1 (Table 2). Conductivities were calculated using experimental data from infusion of solutions into brain tissue, a process that might impact the tissue structure and hydraulic conductivity, resulting in overstated values. It is hypothesized that a small pressure difference exists between the periarterial and perivenous space [27,93], providing a driving force for bulk flow through the brain interstitium. The magnitude of the pressure differential is not known, but can be estimated using (1) hydrostatic pressure, originating from a maximum intracranial pressure of less than 10 mmHg, or (2) hydrodynamic pressure, generated by maximum arteriolar pulsation of 65–100 mmHg, translating through the elastic vascular walls and bounded by the more rigid perivascular walls [93]. The hydrodynamic pressure difference would be a small percentage of the arteriolar pressure on the periarterial side and the very low perivenular pressure (close to 0). Publications have investigated hydrodynamic pressure difference ranges of 0–10 mmHg [44,46].
Pressure gradient is equal to the pressure difference divided by the distance between pressures. The hydrostatic pressure gradient in the brain is probably quite small, with an estimated upper limit of 1 mmHg mm−1 [45]. The appropriate length for the hydrodynamic pressure gradient for interstitial flow is the distance between penetrating arterioles and penetrating venules. Vascular separation in the brain is thought to range from 120 to 255 μm [27,44,45,99]. This range of vascular separation, combined with hydrodynamic pressure differences, gives pressure gradients of 0–80 mmHg mm−1, significantly higher than hydrostatic pressure gradients. In addition to pressure gradients, interstitial bulk flow could be generated by normal CSF production and transport, osmotic gradients, changes in interstitial space volume, and the state of arousal [10,33]
Three groups, including the authors of this review, have investigated interstitial flow via computational modeling (see Table 5). Jin et al. [44] and Holter et al. [45] developed finite-element fluid-dynamic models of interstitial flow through an extracellular matrix based on the electron microscopy (EM) work of Kinney (for rat hippocampal tissue) [2] and the Navier–Stokes equation. Each adjusted the EM in different ways to increase the void volume of the ECS to match experimental values of around 20% (volume changes are known to occur during tissue preparation, fixation, and embedding for EM). Holter claims a more realistic model due to refinement, allowing for smaller, more numerous obstacles like cell bodies and processes, while Jin et al. used obstacles the size of cell bodies. Jin calculated a hydraulic conductivity of 1.2 × 10⁻⁶ cm2 mmHg−1 s−1 and Holter a hydraulic conductivity of 2 × 10⁻⁸ cm2 mmHg−1 s−1. Jin et al.’s value agrees with experimental measurements, while Holter et al.’s value is an order of magnitude lower than the lowest experimental measurement.
Ray et al. used published RTI experimental data from three research groups to verify a 3-dimensional porous-media finite-element model of interstitial transport, based on Equations (4)–(6). Using the full range of hydraulic conductivities reported in the literature and the range of pressure differences described above, Ray et al. calculated average superficial velocities of 0.05–250 μm min−1 (Table 6). Quantitative comparison of tracer transport simulation results to RTI experimental data for anesthetized subjects gave best agreement at a superficial velocity of order = 10 μm min−1 [46], comparable to interstitial velocity measure in other tissues (Figure 3) [20,21].
Substantial experimental evidence supports interstitial transport that is molecular-size dependent [25,27,62,71]. Even Iliff’s original study observed faster transport of a smaller molecule (3 kDa) into the interstitium, compared to a larger molecule (40 kDa) [27]. However, this is not necessarily evidence against interstitial flow, as the effect of advection is relative [46]. Transport only becomes molecular-size independent when advection dominates, such as in the case of perivascular flow. When both mechanisms contribute, as is the expected case for transport of many molecules in the interstitium, a molecular-size dependence will exist. Recall the Peclet number, which equals the relative rate of advection to diffusion (Equation (3)). For a Dextran-3 kDa, , while for Dex 40 kDa. Therefore, diffusion and advection are nearly equal at a molecular size of 3 kDa and transport is expected to be molecular-size dependent. As molecular size increases to 40 kDa, advection starts to become dominant and less molecular-size dependence is expected. Further, the characteristic diffusion time for Dex 40 kDa is about 200 min, while the characteristic advection time is around 20 min. Slow flows that are not significant to the transport of small molecules can be hugely impactful for large, slow-to-diffuse molecules.
Abbott argues that interstitial advection would lead to disruption of the delicate chemical micro-environment required for brain function, and suggests the possibility of perivascular flow to the capillary level as an alternative to interstitial flow [29] (the glymphatic hypothesis states perivascular flow to the arteriole level, where the PVS terminates, truncating flow). This idea follows from the work of Hannock et al. who used cellular markers to identify the perivascular space and observed two molecularly distinct basement membranes through to the level of capillaries, hence a potential complete perivascular route from arterioles through capillaries to venules [26]. Capillaries are separated by approximately 10–20 μm, resulting in a short diffusional path through the interstitium. If this pericapillary theory were correct, given current experimental resolutions, observations would be similar to those for interstitial flow.
In summary, it remains unclear if transport in the interstitium is diffusion-only transport or a combination of advective and diffusive transport. Molecular-size dependent transport does not exclude slow interstitial flow, which could have a significant impact on transport of large, slow-to-diffuse molecules. By conservation of mass, the periarterial influx must go somewhere. A method for direct measurement of interstitial flow would be very useful. In the absence of direct measurement, quantitative transport analysis and modeling, inclusive of anatomical details, using existing tracer data can provide useful insight and supplement currently available experimental approaches.
3.6.3. Transport between Perivascular Space (PVS) and Interstitium
To move from the periarterial space into the interstitium (or the interstitium to the perivascular space), fluid and solutes must pass across a barrier—the perivascular wall. Recall that the PVW consists of a sheath of astrocytic endfeet with gaps between the endfeet, allowing access to the interstitium. In addition, the cell walls contain protein channels that facilitate transport of specific molecules, such as the transport of water by AQP4. Therefore, molecules must pass through either the gaps between the endfeet or protein channels to access the ECS.
Conflicting evidence exists for both the size of the gaps and the coverage of the wall by astrocytic endfeet. Mathiisen et al. analyzed rat EM images of the perivascular astroglial-sheath prepared by chemical fixation, measuring the gaps at 24 nm in a 1.5 μm thick (on average) wall and calculating 99.7% coverage of the PVW surface of capillaries [47]. In comparison, the ECS comprises 20% of brain tissue and typical channels are 40–60 nm in width [7,29]. Korogod et al. found the coverage to be 94.4% using chemical fixation and 62.9% using cryo fixation [48]. The cryo fixation result of 37% extracellular space of the PVW is even greater than the ECS void volume, suggesting that the PVW may present no barrier to transport of molecules. Ray et al. tested solute transport using these two descriptions of the perivascular wall and found the tighter gaps and higher coverage observed by Mathiisen to give better agreement between RTI data and simulations [46].
Although strong evidence correlates AQP4 to interstitial flow and clearance, its mechanism of facilitating transport in the brain is less clear. Mestre’s meta-analysis demonstrates a clear positive correlation between AQP4 and both ISF tracer clearance and CSF influx [70,100]. Studies in KO mice show AQP4 modulates ECS void volume [102], interstitial solute transport [103], and clearance of interstitial fluid [104]. Plog et al. observed the increased resistance to fluid flow between the perivascular and interstitial spaces due to AQP4 deletion has a more profound suppressive effect on glymphatic flow than does wakefulness-related contraction of the interstitial space [77]. In addition, altered AQP4 expression is evident in brain tissue from Alzheimer’s patients [10]. However, the mode of action by which AQP4 effects ISF flow and clearance has not been demonstrated.
Iliff et al. proposed perivascular, astrocytic AQP4 as a low-resistance pathway for water flow into the interstitium, completing the flow circuit from the periarterial to the perivenous space [27]. This theory is silent on how the solutes present in the ISF cross the perivascular wall, as AQP4 is incapable of transporting most ISF solutes, including macromolecules [29]. However, most solutes are able to pass through the gaps between astrocytic endfeet. AQP4 is known to play critical roles in the transport of water between compartments [29]. Perhaps the role of AQP4 in the glymphatic system is less direct. AQP4 channels move water between local PVS and the astrocyte cell/endfoot, swelling or shrinking the endfoot and adjusting the gap size and therefore promote or restricting flow. Asgari et al. tested solute transport for 20 nm and 14 nm astrocytic endfeet gaps, with the smaller gap leading to a significant reduction in transport [41].
Improved understanding of the elements affecting transport of water and solutes across the “perivascular wall” is an area of great opportunity. EM data of the wall structure are variable; in vivo observation would likely improve knowledge. Experimental observations of tracer movement demonstrate a marked decrease in PVW transport in the absence of AQP4 [27]. AQP4 presence is strongly correlated with glymphatic function, but its mechanism is not understood.
3.6.4. Perivascular Flow: Efflux
Specific data is more limited for fluid and solute efflux from the cranium, partly because tracers become diffuse by the time they reach this end of the transport pathway. To date, there are no computational models focused solely on the perivenous efflux mechanisms of the glymphatic hypothesis. As a result, less is known about routes and drivers of perivascular efflux. In Section 3.6.1, two theories for efflux were described
- Perivenous efflux to the CSF, but subsequent exit through a proximal route (glymphatic hypothesis); or
- Efflux via an intramural periarterial route that passes through the subarachnoid space, but remains physically separated from the CSF, and ultimately connects to the cervical lymph.
Below, we discuss static pressure and arterial pulsation driving forces for each theory. Refer to Section 3.6.1. for the discussion of flow driven by CSF production and cerebral blood flow dynamics.
No pulsation occurs in the veins, therefore, for perivenous efflux pressure driving force may come from static pressure or pressure generated by periarterial pulsation. Faghih et al. calculated a very low required pressure difference for hypothesized flow through the perivenous (called paravenous in their paper) tree of 0.00023 mmHg [60]. Although, as discussed in Section 3.6.1, static pressure variations in the CSF are not sufficient to drive the entire glymphatic flow circuit, arterial pulsation will result in intermittent elevated pressure at the periarterial wall [95]. Such pressure may provide the difference required to drive fluid across the interstitial space and still deliver the pressure difference (0.00023 mmHg) needed to propel fluid along the perivenous tree to the SAS.
Intramural periarterial efflux offers a substantial pressure differential for driving fluid efflux, which was a major motivation for the theory. Lymph vessels are at very low or even negative pressure. Therefore, a significantly higher pressure differential exists between the parenchyma and the lymph, than the parenchyma and the CSF (CSF pressure is 7–15 mmHg; pressure inside a lymph vessel is typically 1 mmHg). In addition, reflection waves from arterial pulsation on the periarterial walls have been hypothesized to also drive periarterial efflux [59]. Calculations by Asgari et al. [105] and Faghih et al. [60] show the resistance to flow of the basement membrane is far too great to allow the estimated physiological flows.
In summary, intramural periarterial efflux is unlikely due to the high resistance of the basement membrane. Perivenous efflux (following the glymphatic hypothesis) would require a small pressure difference (0.00023 mmHg) that may be generated by periarterial pulsation driven flow and translated across the porous interstitial space to the perivenous space.
3.7. Glymphatic Debate Is Focussing
Although evidence is building in support of a glymphatic system, much is still left to be understood and refinements are likely to be made. Strong experimental evidence supports antegrade perivascular advection. Although observations of periarterial efflux and beta-amyloid deposition on arteries but not veins have yet to be satisfactorily explained. Experimental results also show periarterial flow is strongly correlated with arterial pulsation, which is proposed to be the driver of said flow. However, current computational models indicate arterial pulsation is unlikely to be the sole driving force for fluid transport into and out of the parenchyma via perivascular routes. Further, mechanisms driving perivenous efflux have been limitedly investigated. To date, models have failed to support fluid flow mechanisms to explain observed perivenous tracer clearance, or intramural periarterial efflux. New evidence shows how changes in cerebral blood volume coordinated with changes in CSF production may be a driver of fluid flow through brain tissue. The results of these whole-brain (macroscopic) studies are likely to inspire studies with finer resolution that may shed light on mechanisms of fluid transport within brain tissue.
Many researchers have concluded that transport in the interstitium is by diffusion only. However, some show evidence of a slow interstitial flow that may have a significant effect on transport of large molecules implicated in neurodegenerative diseases. There is currently no experimental method for direct measurement of interstitial advection. As is demonstrated through calculations in the following section (Section 4.2), a small interstitial bulk flow is required, by conservation of mass, to complete the flow circuit between periarterial and perivenous flow proposed by the glymphatic hypothesis.
The “perivascular wall” looks to be an important regulating mechanism for interstitial transport. The presence of AQP4 channels in the astrocytic endfeet comprising the PVW is strongly correlated with glymphatic function, but the mechanism by which AQP4 facilitates bulk fluid flow is not understood.
3.8. Early Human Results
Although much work remains to be done towards demonstrating the comprehensive glymphatic system in humans, several studies show evidence of its components. A research group at Oslo University in Norway (Ringstad group) received permission to perform clinical DCE MRI studies on patients with idiopathic normal-pressure hydrocephalus (iNPH) along with controls, and has published/is publishing a series of papers on their results. (Intrathecal contrast injection is minimally invasive; therefore, studies are only performed on patients with a clinical indication for the procedure.) In a study of 15 iNPH and 8 healthy controls, Ringstad et al. revealed CSF transport from the SAS along large cerebral arteries [64], resembling the antegrade flow observed in rodents. A further study of 9 iNPH and 8 healthy controls showed significant signal enhancement across all brain regions spreading centripetally from the cortex inward to the deeper brain [106] (in humans, arteries surround the brain on all sides, while mice and rats have a higher concentration of arteries on the ventral side). These results demonstrate “flow patterns in the human brain resembling that of the glymphatic pathway in rodents” [10]. In addition, vascular pulsations seem to play an important role for tracer entry into the parenchyma [106], and human post mortem studies have documented the presence of meningeal lymphatic vessels [107]. Functionally, CSF clearance is reduced in patients with Alzheimer’s disease and iNPH [106].
Contrast uptake and clearance are slower in humans as compared to rodents, but are still faster than would be expected due to only passive diffusion [74,106]. Likely reasons for slower rates in humans are “differences in vascular pulsatility, cerebral metabolic rate, total brain mass, and expression pattern of AQP4” [5].
Another difference is the human brain has a significantly higher proportion of “white matter” than the rodent, about 50% and 10% respectively. White matter is composed of nerve fibers, or myelinated axons, highly organized into directional fiber tracts where resistance to movement is low along the fiber bundles. Therefore, white matter exhibits anisotropic transport properties [108] and fluid can move more rapidly along the bundles, making perineural routes. Grey matter is primarily composed of cell bodies and non-myelinated cell processes. These cell components are spatially disorganized, and therefore grey matter behaves in an isotropic way. White matter is found in the deeper regions of the brain, with grey matter making up the majority of the outer brain, or cortex.
On the subject of sleep and glymphatic function, increases in CSF beta amyloid concentrations, measured via PET, were reported after one night of total sleep deprivation [75,109] and following the disruption of slow wave sleep [110]. DTI MRI studies have reported changes in ADCw as a function of sleep or arousal indicative of dynamic changes in void volume [111]. A recently published study on the human brain shows slow-wave oscillations in neural activity during NREM sleep induce changes in cerebral blood volume coordinated with changes in CSF production that may be a driver of increased fluid flow through brain tissue during sleep [91].
4. Discussion
Two calculations, grounded in the observations and data reported above, are discussed below. These calculations are preliminary, requiring assumptions to complete, but none-the-less provide perspective about transport processes occurring in the brain, especially with respect to how transport is affected by molecular size.
4.1. Transport Time-Scale Analysis
In the most efficient, optimized design of a continuous transport system, the characteristic times for each step will be nearly equivalent [112,113], such that no step is “waiting on another”. To help illustrate this idea, let us consider traffic in a city where cars move on highways, surface streets and neighborhood streets. The different road types have different characteristic lengths and speeds (1) on highways, vehicles move fast over long distances, (2) on surface streets vehicles move intermediate distances at intermediate speeds, and (3) on neighborhood streets vehicles move short distances at slow speeds. If the city has too few highways, they will fill up with cars and the surface streets will be empty, waiting for vehicles to exit the highway. Eventually the city will decide to build more highways, and then the surface streets will get clogged. These adjustments will continue until, in an ideal world, there are no bottlenecks—all the characteristic transport times are balanced.
A natural system, like the human body, has been evolving for very long time. It has been found that many systems in the body are optimized as described above: air passages, lungs, and the circulatory system [112]. Therefore, we make the assumption that transport in the brain has also been optimized by evolution, and investigate characteristic transport times for periarterial transport and interstitial transport, which are expected to be similar (Figure 6a).
Using the equations for characteristic time (Equations (1) and (2)) and results from the literature, characteristic transport times are given in Table 7. The perivascular space is like the highway, where molecules move a long distance at a fast rate. Since periarterial advection is quite fast, diffusion is insignificant to overall transport within the PVS. The characteristic time for periarterial transport is about 9 min. The interstitial spaces between cells are like the neighborhood streets, where molecules move slowly over a short distance. Since interstitial flow is likely slow, characteristic interstitial transport time will be a combination of diffusion and advection, where the characteristic time for diffusion varies with molecular size.
The dominant mechanism of interstitial transport depends on molecular size. For small molecules, interstitial diffusion alone has a similar characteristic time to periarterial transport. Interstitial advective flow is not needed to optimize the system. However, for larger molecules, diffusion across the interstitial space is slower than periarterial transport, and interstitial advection likely plays an important (or dominant) role in augmenting diffusion to achieve an optimal transport time. For Dextran 3 kDa, of similar size to beta amyloid, the characteristic times for interstitial advection and diffusion are nearly equal—both processes work together to achieve an optimal interstitial transport time of around 7 min. A very large molecule, like IgG (150 kDa), has a characteristic diffusion time of over 500 min in interstitial space. Without interstitial advection, its transport would be extremely slow. Slow interstitial advection may be a significant factor for transport of large molecules, and particularly protein aggregates implicated in neurodegenerative diseases.
This same idea applies to concerns over interstitial flow “upsetting” the chemical microenvironment required for proper neural function. For small molecules, like the ions active in neural processes, diffusive transport is happening so much faster than potential advection that small molecules will quickly diffuse to maintain concentrations. For example, the potassium ion (K+) has a characteristic diffusion time of about 1 min in interstitial space, while characteristic advection time is around 19 min. By comparison, neural activities occur on a time scale of msec.
4.2. Mass/Volumetric Flow Balance
The law of conservation of mass provides an excellent tool for assessing fluid and species flow. Whenever possible, an engineer will perform a mass balance on the physical situation with the available data. The mass balance enables assessment of which variables are important in a particular system, what information needs to be improved, and what is the level of agreement between reported values for various flows and concentrations. Despite the idealizations, assumptions, and estimates required to perform a mass balance in a disorganized natural tissue, and the inherent error introduced as a result, mass balance is a useful tool for comparing reported flow rates and considering system organization. The tool can be improved as new data come to light and give direction for areas of future study.
Here, a volumetric flow balance replaces the mass balance, because
- Flow rates for transport in tissues are most frequently reported as either velocity or volumetric flow rate per gram of tissue, known as rate of perfusion, and
- Fluids in the brain are incompressible and at nearly constant temperature, making mass and volume equivalent.
For overall transport in the brain, we equate total flow into the brain along perivascular routes of penetrating cerebral arteries with total flow across the interstitium (see dotted lines in Figure 6b). Equating these two flow streams makes an inherent assumption that any sources or sinks of fluid in the interstitium are small compared to the overall flow. (Metabolic production of water by cells is a small percentage of CSF production (0.03/0.3 μL g−1 min−1 = 10% [12]), and we assume a net zero flow of fluid across the BBB). Volumetric flow rate (Q) is given by
where is cross-sectional area. Proposed values for perivascular and interstitial velocity are available from experimental measurements and simulations. The key assumptions are made in estimating the cross-sectional area to calculate a volumetric flow rate. Results are reported in Table 8.
For periarterial flow, the calculation is made for the perivascular space of all penetrating arteries entering the brain tissue (Figure 6b). Detailed knowledge of mouse anatomy [117] and the shape of a periarterial cross section [39] were used to estimate a total periarterial cross-sectional area of about 0.2 mm2. Assuming a constant average periarterial velocity of 18 μm/sec [39,40], gives a total periarterial volumetric flow rate of about 0.2 μL min−1, or 0.5 μL g−1 min−1 for a 0.4 g mouse brain. Possible sources of error include (1) exclusion of transport across the pial surface (outer surface of the brain) and perineural routes that would add to periarterial flow and may result in a higher total inflow, and (2) every branch of the major arteries may not have been included, resulting in a low value for periarterial flow. The estimated periarterial perfusion rate agrees with the lower end of reported ranges based on clearance rate of endogenous substances from the brains of mice and rats [37,116].
For interstitial flow, a representative cross-sectional area for all the interstitial space is needed, “perpendicular” to the superficial interstitial flow. First let us consider an appropriate “control volume” for the smallest representative vascular arrangement. The control volume proposed by Jin et al. [44] (Figure 6c) and the range of vascular separation reported in Section 3.6.2 are used to calculate a cross-sectional area per vascular volume. Having an ISF cross-sectional area per vascular volume, we multiply by the vessel volume fraction in the mouse brain (0.6–0.9% of the total volume [117]) to get a total cross-sectional area of approximately 200–500 mm2, 1000 times greater than the periarterial cross-sectional area. Multiplying by an average interstitial velocity of 10 μm/min [46], gives a total interstitial volumetric flow rate of 5–15 μL g−1 min−1. Interstitial cross-sectional area may be overestimated due to possible overlap of the idealized cross sections in real tissue, resulting in a high value for total interstitial flow.
Recall that interstitial advection is believed to increase with sleep, and the interstitial perfusion range calculated above is for an anesthetized state shown to be similar to sleep. Xie et al. measured a clearance rate for inulin, eliminated by a perivascular route, in sleeping and anesthetized mice of 2.8–5.5 μL g−1 min−1 [37], which agrees with the low end of the range calculated here. Based on the decrease in void volume from sleep to wakefulness measured by Xie et al., Ray et al. estimated a decrease in interstitial flow of 93% [46]. Estimated interstitial perfusion range adjusted for wakefulness would be 0.4–1 μL g−1 min−1. Groothius et al. and Xie et al. report waking clearance rates of 0.2–0.5 [116] and 0.3–1.5 [37] μL g−1 min−1, respectively.
4.3. Discussion Summary
Reported perivascular and interstitial velocities result in characteristic transport times that are “optimized” for both small and large molecules. Interstitial advection is insignificant for small molecules over the distances considered here, but critical for efficient transport of large molecules. Periarterial and interstitial perfusion rates calculated from the mass balance are in agreement with clearance rates reported for endogenous substances lacking BBB efflux routes. Calculated perfusion rates for sleep/anesthetized interstitial flow agree with the high end of reported ranges. Calculated periarterial perfusion rates agree with reported ranges for the awake state. A mass balance also shows estimated anesthetized interstitial flow exceeds periarterial flow. Errors inherent to the calculations may account for this difference.
5. Conclusions and Areas of Future Work
In the brain, molecular transport and waste removal appears to occur by a unique-to-the-brain, ordered, physiological system facilitated by bulk flow. Fluid and molecules move from the cerebrospinal fluid surrounding the brain, into the brain tissue via periarterial spaces found solely in the brain, across the interstitium of the brain tissue, and exit the brain to systemic circulation through perivenous and cerebrospinal fluid efflux routes. The details of this system are being elucidated through extensive, cross-disciplinary research. It has been named the glymphatic system, and also the perivascular circulation. Although several endogenous molecules possess additional routes of entry to and exit from the brain via specific channels in the blood brain barrier of cerebral vessels, for many molecules, especially protein aggregates characteristic of neurodegenerative disease, this is the only clearance route. Dysfunction of this system has been linked with numerous disease states: Alzheimer’s disease, dementia, small vessel disease, stroke, TBI, diabetes, depression, migraines, and multiple sclerosis. Its function is correlated with (1) sleep, (2) AQP4, a protein channel known to play a critical role in the transport of water between compartments, and (3) other factors driving or resisting the flow circuit.
Given the delicate nature of the perivascular spaces and the low pressures predicted for this flow circuit, the glymphatic system is best observed in vivo, using non-invasive techniques. Experimentation combined with fundamental modeling is likely to provide the best interpretation of results. Rich areas of future work with respect to transport include (1) quantifying flow in the interstitial space and perivascular space of penetrating vessels, (2) clearly demonstrating the driving force of periarterial flow, and (3) improving understanding of characteristics and function of the barrier between the perivascular and interstitial space.
First, a direct measurement technique for interstitial and penetrating periarterial flow would be ideal, but is currently not possible. The method needs to be in vivo and minimally invasive, at a tissue depth currently achievable by MRI and a resolution achievable by microscopy. An alternative approach is to investigate a wider range of molecular-size tracers (e.g., 1, 10, 20, 50, 100 kDa) by DCE-MRI or PET. When combined with fundamental transport models that incorporate anatomical details, such data would enable solid estimates of interstitial and penetrating periarterial flow. Improved resolution for DCE MRI or PET, may enable identification of specific influx routes correlated with anatomy, and also investigation of periarterial and interstitial transport separately.
Second, direct measurement of periarterial pressures, possibly by an injected device, would provide useful information for understanding mechanisms of periarterial flow and the origin of interstitial flow. This is a challenging measurement as the periarterial space is small (30 um thick at most) and delicate, the pressure is low (<10 mmHg) and likely to be oscillating rapidly (1 Hz), and it is adjacent to a much higher oscillating pressure in the artery. Surgical insertion of a device to measure pressure, would be quite difficult requiring the guidance of microscopy and fluorescence to identify the periarterial space. A computational fluid dynamic model, verified with recent measurements of periarterial flow, is likely to provide pressure estimates and more insight into drivers of flow. Such a model is feasible, although the moving boundary adds complexity. Additionally, further research is needed to definitively demonstrate the causality between arterial pulsation and periarterial flow, perhaps monitoring during cardiac arrest and revitalization.
Finally, aspects controlling transport across the “barrier” between the perivascular space and the interstitium need to be better understood. Currently a large range in astrocytic endfoot gap size and coverage of the barrier is reported. Verification of EM measurements using different fixation methods (chemical and cryo) by other labs would be helpful. In vivo measurement is ideal as water content and movement is integral to wall structure and the PVS is shown to collapse upon fixation, likely distorting structure, although not possible with EM. Further questions include the following: Does gap size change with state of alertness or other factors? By what mechanism does AQP4 affect transport from periarterial to interstitial space? Such research is outside our breadth of knowledge, but many neuroscientists are actively seeking this answer.
Fundamental knowledge of fluid flow and mass transfer in brain tissue described here and continuing to be discovered can ultimately be applied to the development and delivery of therapeutic solutions for the numerous disease states affected by glymphatic dysfunction.
Author Contributions
L.A.R. wrote the article. J.J.H. reviewed and edited the article.
Funding
This research was partially funded by the National Science Foundation, grant number DMS-1361240.
Acknowledgments
Roderick J. Ray provided valuable editorial input, and improved ease of reading.
Conflicts of Interest
The authors declare no conflict of interest.
References
- Lundgaard, I.; Li, B.; Xie, L.; Kang, H.; Sanggaard, S.; Haswell, J.D.R.; Sun, W.; Goldman, S.; Blekot, S.; Nielsen, M.; et al. Direct neuronal glucose uptake heralds activity-dependent increases in cerebral metabolism. Nat. Commun. 2015, 6, 6807. [Google Scholar] [CrossRef] [PubMed]
- Kinney, J.P.; Spacek, J.; Bartol, T.M.; Bajaj, C.L.; Harris, K.M.; Sejnowski, T.J. Extracellular sheets and tunnels modulate glutamate diffusion in hippocampal neuropil. J. Comp. Neurol. 2013, 521, 448–464. [Google Scholar] [CrossRef] [PubMed]
- Kullmann, D.M.; Min, M.Y.; Asztely, F.; Rusakov, D.A. Extracellular glutamate diffusion determines the occupancy of glutamate receptors at CA1 synapses in the hippocampus. Philos. Tran. R. Soc. Lond. Ser. B Biol. Sci. 1999, 354, 395–402. [Google Scholar] [CrossRef]
- Plog, B.A.; Nedergaard, M. The Glymphatic System in Central Nervous System Health and Disease: Past, Present, and Future. Annu. Rev. Pathol. Mech. Dis. 2018, 13, 379–394. [Google Scholar] [CrossRef]
- Benveniste, H.; Heerdt, P.M.; Fontes, M.; Rothman, D.L.; Volkow, N.D. Glymphatic System Function in Relation to Anesthesia and Sleep States. Anesth. Analg. 2019, 128, 747–758. [Google Scholar] [CrossRef]
- Maneshi, M.M.; Maki, B.; Gnanasambandam, R.; Belin, S.; Popescu, G.K.; Sachs, F.; Hua, S.Z. Mechanical stress activates NMDA receptors in the absence of agonists. Sci. Rep. 2017, 7, 39610. [Google Scholar] [CrossRef]
- Wolak, D.J.; Thorne, R.G. Diffusion of Macromolecules in the Brain: Implications for Drug Delivery. Mol. Pharm. 2013, 10, 1492–1504. [Google Scholar] [CrossRef]
- Iliff, J.J.; Chen, M.J.; Plog, B.A.; Zeppenfeld, D.M.; Soltero, M.; Yang, L.J.; Singh, I.; Deane, R.; Nedergaard, M. Impairment of Glymphatic Pathway Function Promotes Tau Pathology after Traumatic Brain Injury. J. Neurosci. 2014, 34, 16180–16193. [Google Scholar] [CrossRef]
- Piantino, J.; Lim, M.M.; Newgard, C.D.; Iliff, J. Linking Traumatic Brain Injury, Sleep Disruption and Post-Traumatic Headache: A Potential Role for Glymphatic Pathway Dysfunction. Curr. Pain Headache Rep. 2019, 23, 62. [Google Scholar] [CrossRef]
- Rasmussen, M.K.; Mestre, H.; Nedergaard, M. The glymphatic pathway in neurological disorders. Lancet Neurol. 2018, 17, 1016–1024. [Google Scholar] [CrossRef]
- Labbadia, J.; Morimoto, R.I. The Biology of Proteostasis in Aging and Disease. Annu. Rev. Biochem. 2015, 84, 435–464. [Google Scholar] [CrossRef] [PubMed]
- Hladky, S.B.; Barrand, M.A. Elimination of substances from the brain parenchyma: Efflux via perivascular pathways and via the blood-brain barrier. Fluids Barriers CNS 2018, 15, 30. [Google Scholar] [CrossRef] [PubMed]
- Tarasoff-Conway, J.M.; Carare, R.O.; Osorio, R.S.; Glodzik, L.; Butler, T.; Fieremans, E.; Axel, L.; Rusinek, H.; Nicholson, C.; Zlokovic, B.V.; et al. Clearance systems in the brain-implications for Alzheimer disease. Nat. Rev. Neurol. 2015, 11, 457–470. [Google Scholar] [CrossRef] [PubMed]
- Goulay, R.; Flament, J.; Gauberti, M.; Naveau, M.; Pasquet, N.; Gakuba, C.; Emery, E.; Hantraye, P.; Vivien, D.; Aron-Badin, R.; et al. Subarachnoid Hemorrhage Severely Impairs Brain Parenchymal Cerebrospinal Fluid Circulation in Nonhuman Primate. Stroke 2017, 48, 2301–2305. [Google Scholar] [CrossRef]
- Jiang, Q.; Zhang, L.; Ding, G.L.; Davoodi-Bojd, E.; Li, Q.J.; Li, L.; Sadry, N.; Nedergaard, M.; Chopp, M.; Zhang, Z.G. Impairment of the glymphatic system after diabetes. J. Cereb. Blood Flow Metab. 2017, 37, 1326–1337. [Google Scholar] [CrossRef]
- Xia, M.S.; Yang, L.; Sun, G.F.; Qi, S.; Li, B.M. Mechanism of depression as a risk factor in the development of Alzheimer's disease: The function of AQP4 and the glymphatic system. Psychopharmacology 2017, 234, 365–379. [Google Scholar] [CrossRef]
- Fournier, A.P.; Gauberti, M.; Quenault, A.; Vivien, D.; Macrez, R.; Docagne, F. Reduced spinal cord parenchymal cerebrospinal fluid circulation in experimental autoimmune encephalomyelitis. J. Cereb. Blood Flow Metab. 2019, 39, 1258–1265. [Google Scholar] [CrossRef]
- Lundgaard, I.; Wang, W.; Eberhardt, A.; Vinitsky, H.S.; Reeves, B.C.; Peng, S.S.; Lou, N.H.; Hussain, R.; Nedergaard, M. Beneficial effects of low alcohol exposure, but adverse effects of high alcohol intake on glymphatic function. Sci. Rep. 2018, 8, 2246. [Google Scholar] [CrossRef]
- Schain, A.J.; Melo-Carrillo, A.; Strassman, A.M.; Burstein, R. Cortical Spreading Depression Closes Paravascular Space and Impairs Glymphatic Flow: Implications for Migraine Headache. J. Neurosci. 2017, 37, 2904–2915. [Google Scholar] [CrossRef]
- Chary, S.R.; Jain, R.K. Direct Measurement of Interstitial Convection and Diffusion of Albumin in Normal and Neoplastic Tissues by Fluorescence Photobleaching. Proc. Natl. Acad. Sci. USA 1989, 86, 5385–5389. [Google Scholar] [CrossRef]
- Swartz, M.A.; Fleury, M.E. Interstitial flow and its effects in soft tissues. Annu. Rev. Biomed. Eng. 2007, 9, 229–256. [Google Scholar] [CrossRef] [PubMed]
- Cserr, H.F.; Cooper, D.N.; Suri, P.K.; Patlak, C.S. Efflux of radiolabeled polyethylene glycols and albumin from rat-brain. Am. J. Physiol. 1981, 240, F319–F328. [Google Scholar] [CrossRef] [PubMed]
- Hladky, S.B.; Barrand, M.A. Mechanisms of fluid movement into, through and out of the brain: Evaluation of the evidence. Fluids Barriers CNS 2014, 11, 26. [Google Scholar] [CrossRef] [PubMed]
- Woollam, D.H.M.; Millen, J.W. Perivascular spaces of the mammalian central nervous system. Biol. Rev. 1954, 29, 251–283. [Google Scholar] [CrossRef]
- Pizzo, M.E.; Wolak, D.J.; Kumar, N.N.; Brunette, E.; Brunnquell, C.L.; Hannocks, M.-J.; Abbott, N.J.; Meyerand, M.E.; Sorokin, L.; Stanimirovic, D.B.; et al. Intrathecal antibody distribution in the rat brain: Surface diffusion, perivascular transport and osmotic enhancement of delivery. J. Physiol. Lond. 2018, 596, 445–475. [Google Scholar] [CrossRef]
- Hannocks, M.J.; Pizzo, M.E.; Huppert, J.; Deshpande, T.; Abbott, N.J.; Thorne, R.G.; Sorokin, L. Molecular characterization of perivascular drainage pathways in the murine brain. J. Cereb. Blood Flow Metab. 2018, 38, 669–686. [Google Scholar] [CrossRef]
- Iliff, J.J.; Wang, M.; Liao, Y.; Plogg, B.A.; Peng, W.; Gundersen, G.A.; Benveniste, H.; Vates, G.E.; Deane, R.; Goldman, S.A.; et al. A Paravascular Pathway Facilitates CSF Flow Through the Brain Parenchyma and the Clearance of Interstitial Solutes, Including Amyloid beta. Sci. Transl. Med. 2012, 4, 147ra111. [Google Scholar] [CrossRef]
- Raper, D.; Louveau, A.; Kipnis, J. How Do Meningeal Lymhatic Vessels Drain the CNS? Trends Neurosci. 2016, 39, 581–586. [Google Scholar] [CrossRef]
- Abbott, N.J.; Pizzo, M.E.; Preston, J.E.; Janigro, D.; Thorne, R.G. The role of brain barriers in fluid movement in the CNS: Is there a 'glymphatic' system? Acta Neuropathol. 2018, 135, 387–407. [Google Scholar] [CrossRef]
- Sykova, E.; Nicholson, C. Diffusion in brain extracellular space. Physiol. Rev. 2008, 88, 1277–1340. [Google Scholar] [CrossRef]
- Bloomfield, I.G.; Johnston, I.H.; Bilston, L.E. Effects of proteins, blood cells and glucose on the viscosity of cerebrospinal fluid. Pediatr. Neurosurg. 1998, 28, 246–251. [Google Scholar] [CrossRef] [PubMed]
- Dixon, J.B.; Greiner, S.T.; Gashev, A.A.; Cote, G.L.; Moore, J.E.; Zawieja, D.C. Lymph flow, shear stress, and lymphocyte velocity in rat mesenteric prenodal lymphatics. Microcirculation 2006, 13, 597–610. [Google Scholar] [CrossRef] [PubMed]
- Benveniste, H.; Liu, X.; Koundal, S.; Sanggaard, S.; Lee, H.; Wardlaw, J. The Glymphatic System and Waste Clearance with Brain Aging: A Review. Gerontology 2019, 65, 106–119. [Google Scholar] [CrossRef] [PubMed]
- Khaled, A.R.A.; Vafai, K. The role of porous media in modeling flow and heat transfer in biological tissues. Int. J. Heat Mass Transf. 2003, 46, 4989–5003. [Google Scholar] [CrossRef]
- Brinkman, H.C. A calculation of the viscous force exerted by a flowing fluid on a dense swarm of particles. Appl. Sci. Res. Sect. A Mech. Heat Chem. Eng. Math. Methods 1947, 1, 27–34. [Google Scholar] [CrossRef]
- Nicholson, C.; Hrabetova, S. Brain Extracellular Space: The Final Frontier of Neuroscience. Biophys. J. 2017, 113, 2133–2142. [Google Scholar] [CrossRef]
- Xie, L.; Kang, H.; Xu, Q.; Chen, M.J.; Liao, Y.; Thiyagarajan, M.; O'Donnell, J.; Christensen, D.J.; Nicholson, C.; Iliff, J.J.; et al. Sleep Drives Metabolite Clearance from the Adult Brain. Science 2013, 342, 373–377. [Google Scholar] [CrossRef] [Green Version]
- Nicholson, C. Diffusion and related transport mechanisms in brain tissue. Rep. Prog. Phys. 2001, 64, 815–884. [Google Scholar] [CrossRef]
- Mestre, H.; Tithof, J.; Du, T.; Song, W.; Peng, W.G.; Sweeney, A.M.; Olyeda, G.; Thomas, J.H.; Nedergaard, M.; Kelley, D.H. Flow of cerebrospinal fluid is driven by arterial pulsations and is reduced in hypertension. Nat. Commun. 2018, 9, 4878. [Google Scholar] [CrossRef]
- Bedussi, B.; Almasian, M.; de Vos, J.; VanBavel, E.; Bakker, E. Paravascular spaces at the brain surface: Low resistance pathways for cerebrospinal fluid flow. J. Cereb. Blood Flow Metab. 2018, 38, 719–726. [Google Scholar] [CrossRef] [Green Version]
- Asgari, M.; de Zelicourt, D.; Kurtcuoglu, V. Glymphatic solute transport does not require bulk flow. Sci. Rep. 2016, 6, 38635. [Google Scholar] [CrossRef] [Green Version]
- Basser, P.J. Interstitial pressure, volume, and flow during infusion into brain-tissue. Microvasc. Res. 1992, 44, 143–165. [Google Scholar] [CrossRef]
- Smith, J.H.; Humphrey, J.A.C. Interstitial transport and transvascular fluid exchange during infusion into brain and tumor tissue. Microvasc. Res. 2007, 73, 58–73. [Google Scholar] [CrossRef] [PubMed]
- Jin, B.-J.; Smith, A.J.; Verkman, A.S. Spatial model of convective solute transport in brain extracellular space does not support a “glymphatic” mechanism. J. Gen. Physiol. 2016, 148, 489–501. [Google Scholar] [CrossRef] [PubMed] [Green Version]
- Holter, K.E.; Kehlet, B.; Devor, A.; Sejnowski, T.J.; Dale, A.M.; Omholt, S.W.; Ottersen, O.P.; Nagelhus, E.A.; Mardal, K.A.; Pettersen, K.H. Interstitial solute transport in 3D reconstructed neuropil occurs by diffusion rather than bulk flow. Proc. Natl. Acad. Sci. USA 2017, 114, 9894–9899. [Google Scholar] [CrossRef] [Green Version]
- Ray, L.; Iliff, J.J.; Heys, J.J. Analysis of convective and diffusive transport in the brain interstitium. Fluids Barriers CNS 2019, 16, 6. [Google Scholar] [CrossRef] [Green Version]
- Mathiisen, T.M.; Lehre, K.P.; Danbolt, N.C.; Ottersen, O.P. The Perivascular Astroglial Sheath Provides a Complete Covering of the Brain Microvessels: An Electron Microscopic 3D Reconstruction. Glia 2010, 58, 1094–1103. [Google Scholar] [CrossRef]
- Korogod, N.; Petersen, C.C.H.; Knott, G.W. Ultrastructural analysis of adult mouse neocortex comparing aldehyde perfusion with cryo fixation. Elife 2015, 4, e05793. [Google Scholar] [CrossRef]
- Cserr, H.F.; Ostrach, L.H. Bulk flow of interstitial fluid after intracranial injection of blue dextran 2000. Exp. Neurol. 1974, 45, 50–60. [Google Scholar] [CrossRef]
- Rennels, M.L.; Gregory, T.F.; Blaumanis, O.R.; Fujimoto, K.; Grady, P.A. Evidence for a paravascular fluid circulation in the mammalian central nervous-system, provided by the rapid distribution of tracer protein throughout the brain from the subarachnoid space. Brain Res. 1985, 326, 47–63. [Google Scholar] [CrossRef]
- Wisniewski, H.M.; Wegiel, J. Beta-Amyloid Formation by Myocytes of Leptomeningeal Vessels. Acta Neuropathol. 1994, 87, 233–241. [Google Scholar] [CrossRef] [PubMed]
- Weller, R.O.; Massey, A.; Newman, T.A.; Hutchings, M.; Kuo, Y.M.; Roher, A.E. Cerebral amyloid angiopathy: Amyloid beta accumulates in putative interstitial fluid drainage pathways in Alzheimer’s disease. Am. J. Pathol. 1998, 153, 725–733. [Google Scholar] [CrossRef]
- Preston, S.D.; Steart, P.V.; Wilkinson, A.; Nicoll, J.A.R.; Weller, R.O. Capillary and arterial cerebral amyloid angiopathy in Alzheimer's disease: Defining the perivascular route for the elimination of amyloid beta from the human brain. Neuropathol. Appl. Neurobiol. 2003, 29, 106–117. [Google Scholar] [CrossRef] [PubMed]
- Serrano-Pozo, A.; Frosch, M.P.; Masliah, E.; Hyman, B.T. Neuropathological Alterations in Alzheimer Disease. Cold Spring Harb. Perspect. Med. 2011, 1, a006189. [Google Scholar] [CrossRef] [PubMed]
- Carare, R.O.; Bernardes-Silva, M.; Newman, T.A.; Page, A.M.; Nicoll, J.A.R.; Perry, V.H.; Weller, R.O. Solutes, but not cells, drain from the brain parenchyma along basement membranes of capillaries and arteries: Significance for cerebral amyloid angiopathy and neuroimmunology. Neuropathol. Appl. Neurobiol. 2008, 34, 131–144. [Google Scholar] [CrossRef] [PubMed]
- Schley, D.; Carare-Nnadi, R.; Please, C.P.; Perry, V.H.; Weller, R.O. Mechanisms to explain the reverse perivascular transport of solutes out of the brain. J. Theor. Biol. 2006, 238, 962–974. [Google Scholar] [CrossRef]
- Weller, R.O.; Djuanda, E.; Yow, H.Y.; Carare, R.O. Lymphatic drainage of the brain and the pathophysiology of neurological disease. Acta Neuropathol. 2009, 117, 1–14. [Google Scholar] [CrossRef]
- Sharp, M.K.; Diem, A.K.; Weller, R.O.; Carare, R.O. Peristalsis with Oscillating Flow Resistance: A Mechanism for Periarterial Clearance of Amyloid Beta from the Brain. Ann. Biomed. Eng. 2016, 44, 1553–1565. [Google Scholar] [CrossRef]
- Coloma, M.; Schaffer, J.D.; Carare, R.O.; Chiarot, P.R.; Huang, P. Pulsations with reflected boundary waves: A hydrodynamic reverse transport mechanism for perivascular drainage in the brain. J. Math. Biol. 2016, 73, 469–490. [Google Scholar] [CrossRef]
- Faghih, M.M.; Sharp, M.K. Is bulk flow plausible in perivascular, paravascular and paravenous channels? Fluids Barriers CNS 2018, 15, 17. [Google Scholar] [CrossRef]
- Nielsen, S.; Nagelhus, E.A.; AmiryMoghaddam, M.; Bourque, C.; Agre, P.; Ottersen, O.P. Specialized membrane domains for water transport in glial cells: High-resolution immunogold cytochemistry of aquaporin-4 in rat brain. J. Neurosci. 1997, 17, 171–180. [Google Scholar] [CrossRef] [PubMed] [Green Version]
- Smith, A.J.; Yao, X.M.; Dix, J.A.; Jin, B.J.; Verkman, A.S. Test of the 'glymphatic' hypothesis demonstrates diffusive and aquaporin-4-independent solute transport in rodent brain parenchyma. Elife 2017, 6, e27679. [Google Scholar] [CrossRef] [PubMed]
- Aspelund, A.; Antila, S.; Proulx, S.T.; Karlsen, T.V.; Karaman, S.; Detmar, M.; Wiig, H.; Alitalo, K. A dural lymphatic vascular system that drains brain interstitial fluid and macromolecules. J. Exp. Med. 2015, 212, 991–999. [Google Scholar] [CrossRef] [PubMed]
- Ringstad, G.; Vatnehol, S.A.S.; Eide, P.K. Glymphatic MRI in idiopathic normal pressure hydrocephalus. Brain 2017, 140, 2691–2705. [Google Scholar] [CrossRef] [Green Version]
- Bedussi, B.; van der Wel, N.N.; de Vos, J.; van Veen, H.; Siebes, M.; VanBavel, E.; Bakker, E. Paravascular channels, cisterns, and the subarachnoid space in the rat brain: A single compartment with preferential pathways. J. Cereb. Blood Flow Metab. 2017, 37, 1374–1385. [Google Scholar] [CrossRef] [Green Version]
- Trumbore, C.N. Shear-Induced Amyloid Formation in the Brain: III. The Roles of Shear Energy and Seeding in a Proposed Shear Model. J. Alzheimers Dis. 2018, 65, 47–70. [Google Scholar] [CrossRef] [Green Version]
- Albargothy, N.J.; Johnston, D.A.; MacGregor-Sharp, M.; Weller, R.O.; Verma, A.; Hawkes, C.A.; Carare, R.O. Convective influx/glymphatic system: Tracers injected into the CSF enter and leave the brain along separate periarterial basement membrane pathways. Acta Neuropathol. 2018, 136, 139–152. [Google Scholar] [CrossRef] [Green Version]
- Arbel-Ornath, M.; Hudry, E.; Eikermann-Haerter, K.; Hou, S.; Gregory, J.L.; Zhao, L.Z.; Betensky, R.A.; Frosch, M.P.; Greenberg, S.M.; Bacskai, B.J. Interstitial fluid drainage is impaired in ischemic stroke and Alzheimer's disease mouse models. Acta Neuropathol. 2013, 126, 353–364. [Google Scholar] [CrossRef] [Green Version]
- Bradbury, M.W.B.; Cserr, H.F.; Westrop, R.J. Drainage of cerebral interstitial fluid into deep cervical lymph of the rabbit. Am. J. Physiol. 1981, 240, F329–F336. [Google Scholar] [CrossRef]
- Mestre, H.; Hablitz, L.M.; Xavier, A.L.; Feng, W.; Zou, W.; Pu, T.; Monai, H.; Murlidharan, G.; Castellanos Rivera, R.M.; Simon, M.J.; et al. Aquaporin-4-dependent glymphatic solute transport in the rodent brain. Elife 2018, 7, e40070. [Google Scholar] [CrossRef]
- Iliff, J.J.; Lee, H.; Yu, M.; Feng, T.; Logan, J.; Nedergaard, M.; Benveniste, H. Brain-wide pathway for waste clearance captured by contrast-enhanced MRI. J. Clin. Investig. 2013, 123, 1299–1309. [Google Scholar] [CrossRef] [PubMed] [Green Version]
- Gakuba, C.; Gaberel, T.; Goursaud, S.; Bourges, J.; Di Palma, C.; Quenault, A.; de Lizarrondo, S.M.; Vivien, D.; Gauberti, M. General Anesthesia Inhibits the Activity of the “Glymphatic System”. Theranostics 2018, 8, 710–722. [Google Scholar] [CrossRef] [PubMed]
- Dobson, H.; Sharp, M.M.; Cumpsty, R.; Criswell, T.P.; Wellman, T.; Finucane, C.; Sullivan, J.M.; Weller, R.O.; Verma, A.; Carare, R.O. The perivascular pathways for influx of cerebrospinal fluid are most efficient in the midbrain. Clin. Sci. 2017, 131, 2745–2752. [Google Scholar] [CrossRef] [PubMed]
- Watts, R.; Stemklein, J.M.; Waldman, L.; Zhou, X.; Filippi, C.G. Measuring Glymphatic Flow in Man Using Quantitative Contrast-Enhanced MRI. Am. J. Neuroradiol. 2019, 40, 648–651. [Google Scholar] [CrossRef] [PubMed] [Green Version]
- Shokri-Kojori, E.; Wang, G.J.; Wiers, C.E.; Demiral, S.B.; Guo, M.; Kim, S.W.; Lindgren, E.; Ramirez, V.; Zehra, A.; Freeman, C.; et al. Beta-Amyloid accumulation in the human brain after one night of sleep deprivation. Proc. Natl. Acad. Sci. USA 2018, 115, 4483–4488. [Google Scholar] [CrossRef] [Green Version]
- de Leon, M.J.; Li, Y.; Okamura, N.; Tsui, W.H.; Saint-Louis, L.A.; Glodzik, L.; Osorio, R.S.; Fortea, J.; Butler, T.; Pirraglia, E.; et al. Cerebrospinal Fluid Clearance in Alzheimer Disease Measured with Dynamic PET. J. Nucl. Med. 2017, 58, 1471–1476. [Google Scholar] [CrossRef] [Green Version]
- Plog, B.A.; Mestre, H.; Olveda, G.E.; Sweeney, A.M.; Kenney, H.M.; Cove, A.; Dholakia, K.Y.; Tithof, J.; Nevins, T.D.; Lundgaard, I.; et al. Transcranial optical imaging reveals a pathway for optimizing the delivery of immunotherapeutics to the brain. JCI Insight 2018, 3. [Google Scholar] [CrossRef] [Green Version]
- Pizzo, M.E.; Thorne, R.G. The Extracellular and Perivascular Spaces of the Brain. In Brain Edema: From Molecular Mechanisms to Clinical Practice; Badaut, J., Plesnila, N., Eds.; Academic Press: Cambridge, MA, USA, 2017; pp. 105–127. [Google Scholar]
- Louveau, A.; Plog, B.A.; Antila, S.; Alitalo, K.; Nedergaard, M.; Kipnis, J. Understanding the functions and relationships of the glymphatic system and meningeal lymphatics. J. Clin. Investig. 2017, 127, 3210–3219. [Google Scholar] [CrossRef] [Green Version]
- Koh, L.; Zakharov, A.; Johnston, M. Integration of the subarachnoid space and lymphatics: Is it time to embrace a new concept of cerebrospinal fluid absorption? Fluids Barriers CNS 2005, 2, 6. [Google Scholar] [CrossRef] [Green Version]
- Kida, S.; Pantazis, A.; Weller, R.O. CSF drains directly from the subarachnoid space into nasal lymphatics in the rat. Anatomy, histology and immunological significance. Neuropathol. Appl. Neurobiol. 1993, 19, 480–488. [Google Scholar] [CrossRef]
- Kaminski, M.; Bechmann, I.; Pohland, M.; Kiwit, J.; Nitsch, R.; Glumm, J. Migration of monocytes after intracerebral injection at entorhinal cortex lesion site. J. Leukoc. Biol. 2012, 92, 31–39. [Google Scholar] [CrossRef]
- Louveau, A.; Smirnov, I.; Keyes, T.J.; Eccles, J.D.; Rouhani, S.J.; Peske, J.D.; Derecki, N.C.; Castle, D.; Mandell, J.W.; Lee, K.S.; et al. Structural and functional features of central nervous system lymphatic vessels. Nature 2015, 523, 337–341. [Google Scholar] [CrossRef]
- Hawkes, C.A.; Jayakody, N.; Johnston, D.A.; Bechmann, I.; Carare, R.O. Failure of Perivascular Drainage of beta-amyloid in Cerebral Amyloid Angiopathy. Brain Pathol. 2014, 24, 396–403. [Google Scholar] [CrossRef]
- Zhang, E.T.; Inman, C.B.E.; Weller, R.O. Interrelationships of the pia mater and the perivascular (Virchow-Robin) spaces in the human cerebrum. J. Anat. 1990, 170, 111–123. [Google Scholar]
- Cserr, H.F.; Harlingberg, C.J.; Knopf, P.M. Drainage of brain extracellular fluid into blood and deep cervical lymph and its immunological significance. Brain Pathol. 1992, 2, 269–276. [Google Scholar] [CrossRef]
- Cserr, H.F.; Knopf, P.M. Cervical lymphatics, the blood-brain-barrier and the immunoreactivity of the brain: A new view. Immunol. Today 1992, 13, 507–512. [Google Scholar] [CrossRef]
- Antila, S.; Karaman, S.; Nurmi, H.; Airavaara, M.; Voutilainen, M.H.; Mathivet, T.; Chilov, D.; Li, Z.L.; Koppinen, T.; Park, J.H.; et al. Development and plasticity of meningeal lymphatic vessels. J. Exp. Med. 2017, 214, 3645–3667. [Google Scholar] [CrossRef]
- Nedergaard, M.; Goldman, S.A. Brain Drain (vol 314, pg 44, 2016). Sci. Am. 2016, 315, 6. [Google Scholar]
- Vorisek, I.; Sykova, E. Measuring diffusion parameters in the brain: Comparing the real-time iontophoretic method and diffusion-weighted magnetic resonance. Acta Physiol. 2009, 195, 101–110. [Google Scholar] [CrossRef]
- Fultz, N.E.; Bonmassar, G.; Setsompop, K.; Stickgold, R.A.; Rosen, B.R.; Polimeni, J.R.; Lewis, L.D. Coupled electrophysiological, hemodynamic, and cerebrospinal fluid oscillations in human sleep. Science 2019, 366, 628–631. [Google Scholar] [CrossRef]
- Sweetman, B.; Xenos, M.; Zitella, L.; Linninger, A.A. Three-dimensional computational prediction of cerebrospinal fluid flow in the human brain. Comput. Biol. Med. 2011, 41, 67–75. [Google Scholar] [CrossRef] [Green Version]
- Iliff, J.J.; Wang, M.; Zeppenfeld, D.M.; Venkataraman, A.; Plog, B.A.; Liao, Y.; Deane, R.; Nedergaard, M. Cerebral Arterial Pulsation Drives Paravascular CSF-Interstitial Fluid Exchange in the Murine Brain. J. Neurosci. 2013, 33, 18190–18199. [Google Scholar] [CrossRef] [Green Version]
- Shapiro, A.H.; Jaffrin, M.Y.; Weinberg, S.L. Peristaltic pumping with long wavelengths at low reynolds number. J. Fluid Mech. 1969, 37, 799–825. [Google Scholar] [CrossRef]
- Bilston, L.E.; Fletcher, D.F.; Brodbelt, A.R.; Stoodley, M.A. Arterial Pulsation-driven Cerecrospinal Fluid Flow in the Perivascular Space: A Computational Model. Comput. Methods Biomech. Biomed. Eng. 2003, 6, 235–241. [Google Scholar] [CrossRef]
- Mitchell, G.F.; van Buchem, M.A.; Sigurdsson, S.; Gotal, J.D.; Jonsdottir, M.K.; Kjartansson, O.; Garcia, M.; Aspelund, T.; Harris, T.B.; Gudnason, V.; et al. Arterial stiffness, pressure and flow pulsatility and brain structure and function: The Age, Gene/Environment Susceptibility-Reykjavik Study. Brain 2011, 134, 3398–3407. [Google Scholar] [CrossRef]
- Croci, M.; Vinje, V.; Rognes, M.E. Uncertainty quantification of parenchymal tracer distribution using random diffusion and convective velocity fields. Fluids Barriers CNS 2019, 16. [Google Scholar] [CrossRef] [Green Version]
- Mestre, H.; Kostrikov, S.; Mehta, R.I.; Nedergaard, M. Perivascular spaces, glymphatic dysfunction, and small vessel disease. Clin. Sci. 2017, 131, 2257–2274. [Google Scholar] [CrossRef] [Green Version]
- Thorne, R.G.; Nicholson, C. In vivo diffusion analysis with quantum dots and dextrans predicts the width of brain extracellular space. Proc. Natl. Acad. Sci. USA 2006, 103, 5567–5572. [Google Scholar] [CrossRef] [Green Version]
- Kress, B.T.; Iliff, J.J.; Xia, M.; Wang, M.; Wei, H.S.; Zeppenfeld, D.; Xie, L.; Kang, H.; Xu, Q.; Liew, J.A.; et al. Impairment of Paravascular Clearance Pathways in the Aging Brain. Ann. Neurol. 2014, 76, 845–861. [Google Scholar] [CrossRef]
- Cserr, H.F.; Depasquale, M.; Nicholson, C.; Patlak, C.S.; Pettigrew, K.D.; Rice, M.E. Extracellular volume decreases while cell volume is maintained by ion uptake in rat brain during acute hypernatremia. J. Physiol. Lond. 1991, 442, 277–295. [Google Scholar] [CrossRef] [Green Version]
- Yao, X.; Hrabetova, S.; Nicholson, C.; Manley, G.T. Aquaporin-4-deficient mice have increased extracellular space without tortuosity change. J. Neurosci. 2008, 28, 5460–5464. [Google Scholar] [CrossRef] [Green Version]
- Binder, D.K.; Papadopoulos, M.C.; Haggie, P.M.; Verkman, A.S. In vivo measurement of brain extracellular space diffusion by cortical surface photobleaching. J. Neurosci. 2004, 24, 8049–8056. [Google Scholar] [CrossRef]
- Papadopoulos, M.C.; Manley, G.T.; Krishna, S.; Verkman, A.S. Aquaporin-4 facilitates reabsorption of excess fluid in vasogenic brain edema. FASEB J. 2004, 18, 1291–1293. [Google Scholar] [CrossRef]
- Asgari, M.; de Zelicourt, D.; Kurtcuoglu, V. How astrocyte networks may contribute to cerebral metabolite clearance. Sci. Rep. 2015, 5, 15024. [Google Scholar] [CrossRef] [Green Version]
- Ringstad, G.; Valnes, L.M.; Dale, A.M.; Pripp, A.H.; Vatnehol, S.A.S.; Emblem, K.E.; Mardal, K.A.; Eide, P.K. Brain-wide glymphatic enhancement and clearance in humans assessed with MRI. JCI Insight 2018, 3. [Google Scholar] [CrossRef] [Green Version]
- Absinta, M.; Ha, S.K.; Nair, G.; Sati, P.; Luciano, N.J.; Palisoc, M.; Louveau, A.; Zaghloul, K.A.; Pittaluga, S.; Kipnis, J.; et al. Human and nonhuman primate meninges harbor lymphatic vessels that can be visualized noninvasively by MRI. Elife 2017, 6, e29738. [Google Scholar] [CrossRef]
- Mazel, T.; Simonova, Z.; Sykova, E. Diffusion heterogeneity and anisotropy in rat hippocampus. Neuroreport 1998, 9, 1299–1304. [Google Scholar] [CrossRef]
- Ooms, S.; Overeem, S.; Besse, K.; Rikkert, M.O.; Verbeek, M.; Claassen, J. Effect of 1 Night of Total Sleep Deprivation on Cerebrospinal Fluid beta-Amyloid 42 in Healthy Middle-Aged Men A Randomized Clinical Trial. Jama Neurol. 2014, 71, 971–977. [Google Scholar] [CrossRef]
- Ju, Y.E.; Ooms, S.J.; Sutphen, C.; Macauley, S.L.; Zangrilli, M.A.; Jerome, G.; Fagan, A.M.; Mignot, E.; Zempel, J.M.; Claassen, J.; et al. Slow wave sleep disruption increases cerebrospinal fluid amyloid-beta levels. Brain 2017, 140, 2104–2111. [Google Scholar] [CrossRef]
- Nakamura, K.; Brown, R.A.; Narayanan, S.; Collins, D.L.; Arnold, D.L.; Alzheimer’s Dis, N. Diurnal fluctuations in brain volume: Statistical analyses of MRI from large populations. Neuroimage 2015, 118, 126–132. [Google Scholar] [CrossRef]
- Bejan, A. Shape and Structure, from Engineering to Nature; Cambridge University Press: New York, NY, USA, 2000. [Google Scholar]
- Levenspiel, O.; (Oregon State University, Corvallis, OR, USA). Personal communication, 1979.
- Cieslicki, K. Experimental and Numerical Modeling of flow in the Human Cerebral Arteries. J. Med. Informat. Technol. 2004, 7, 17–26. [Google Scholar]
- Kamath, S. Observations on the length and diameter of vessels forming the circle of Willis. J. Anat. 1981, 133, 419–423. [Google Scholar]
- Groothuis, D.R.; Vavra, M.W.; Schlageter, K.E.; Kang, E.W.Y.; Itskovich, A.C.; Hertzler, S.; Allen, C.V.; Lipton, H.L. Efflux of drugs and solutes from brain: The interactive roles of diffusional transcapillary transport, bulk flow and capillary transporters. J. Cereb. Blood Flow Metab. 2007, 27, 43–56. [Google Scholar] [CrossRef]
- Xiong, B.; Li, A.; Lou, Y.; Chen, S.; Long, B.; Peng, J.; Yang, Z.; Xu, T.; Yang, X.; Li, X.; et al. Precise Cerebral Vascular Atlas in Stereotaxic Coordinates of Whole Mouse Brain. Front. Neuroanat. 2017, 11, 128. [Google Scholar] [CrossRef] [Green Version]
Figure 1.
Production and Circulation of Cerebrospinal Fluid (CSF). Schematic representation of the pattern of intracranial CSF flow. (A) CSF is produced by the choroid plexus of the lateral and fourth ventricles. CSF flows through the ventricles to the cisterna magna at the lower back of the brain and into the subarachnoid space (SAS) that surrounds the brain and spinal cord. CSF efflux is via arachnoid granulations and along the olfactory nerves through the cribriform plate. (B) Schematic representation of CSF–interstitial flow from and to the subarachnoid space. CSF can move in and out of the brain parenchyma along the perivascular space. CSF can also exit through the meninges to the dural lymphatics. Reprinted from Ref [28] Copyright 2016 with permission from Elsevier.

Figure 2.
Illustration of details within Brain Tissue. Arterioles and venules penetrate the tissue, each surrounded by perivascular space (PVS). The blood-vessel wall forms the inner barrier of the PVS, note the tight junctions between cells. Astrocytic endfeet form the outer barrier of the PVS, with looser gaps between cells allowing transport into the interstitium. The interstitium is crowded with cells where both fluid and solutes move along a tortuous path in a restricted extracellular liquid volume that comprises approximately 20% of the total volume (see insert). Green arrows indicate fluid transport, by advection and diffusion. In the glymphatic hypothesis, fluid moves along the periarterial space into the interstitium and out along the perivenous space. Purple indicates interstitial solutes; solutes exit the interstitial space through gaps in the astrocytic endfeet to the perivenous space, where they are cleared to primary peri-venous drainage pathways or the CSF.

Figure 3.
Characteristic transport time in the interstitial space of tissues as a function of molecular size. For small molecules, diffusion is much faster than advection. However, as molecular size increases, even the slow advective velocities present in interstitial tissue have a significant impact on transport rate.

Figure 4.
Hypothetical perivascular (called intramural periarterial in the text) and paravascular (called extramural periarterial in the text) flow pathways in an artery. Paravascular flow moves inward from the SAS to the brain tissue between astrocyte end feet and pia mater. Perivascular flow moves outward from the brain tissue in basement membranes between smooth muscle cells, ultimately to cervical lymph vessels. Reprinted from Ref [60]. Copyright 2018 Biomedical Central.

Figure 5.
Comparison of RTI experimental data [37] (orange) and finite-element simulation [46] (blue) using parameters from Table 3 for asleep and awake states. Curves report tracer concentration versus time. Simulations agree well with experimental data, supporting the hypothesis of an increase in hydraulic conductivity and bulk flow during sleep. Reprinted from Ref [46]. Copyright 2019 Biomedical Central.

Figure 6.
Illustrations for characteristic time and mass balance calculations. (a) A cerebral penetrating artery and vein with perivascular space. Fluid (green arrows) moves into the brain along periarterial space, branching into arteriole PVS. Characteristic length for periarterial transport is the entire path from penetrating artery to terminating arteriole (drawing not to scale). From periarterial space, fluid enters the interstitium and moves to perivenous space. In an optimized system, . (b) Whole-brain mass balance. Flow in through periarterial space, measured at the dotted line for branches of major cerebral arteries, equals flow out across the interstitium, represented by dotted line between arterioles and venules. (c) Control volume: one venule surrounded by six arterioles [44]. Fluid flow is from periarteriole to perivenule space (green arrows). Cross-sectional area (XCIS) is a cylinder surrounding the venule at the midpoint between the arterioles and the venule.
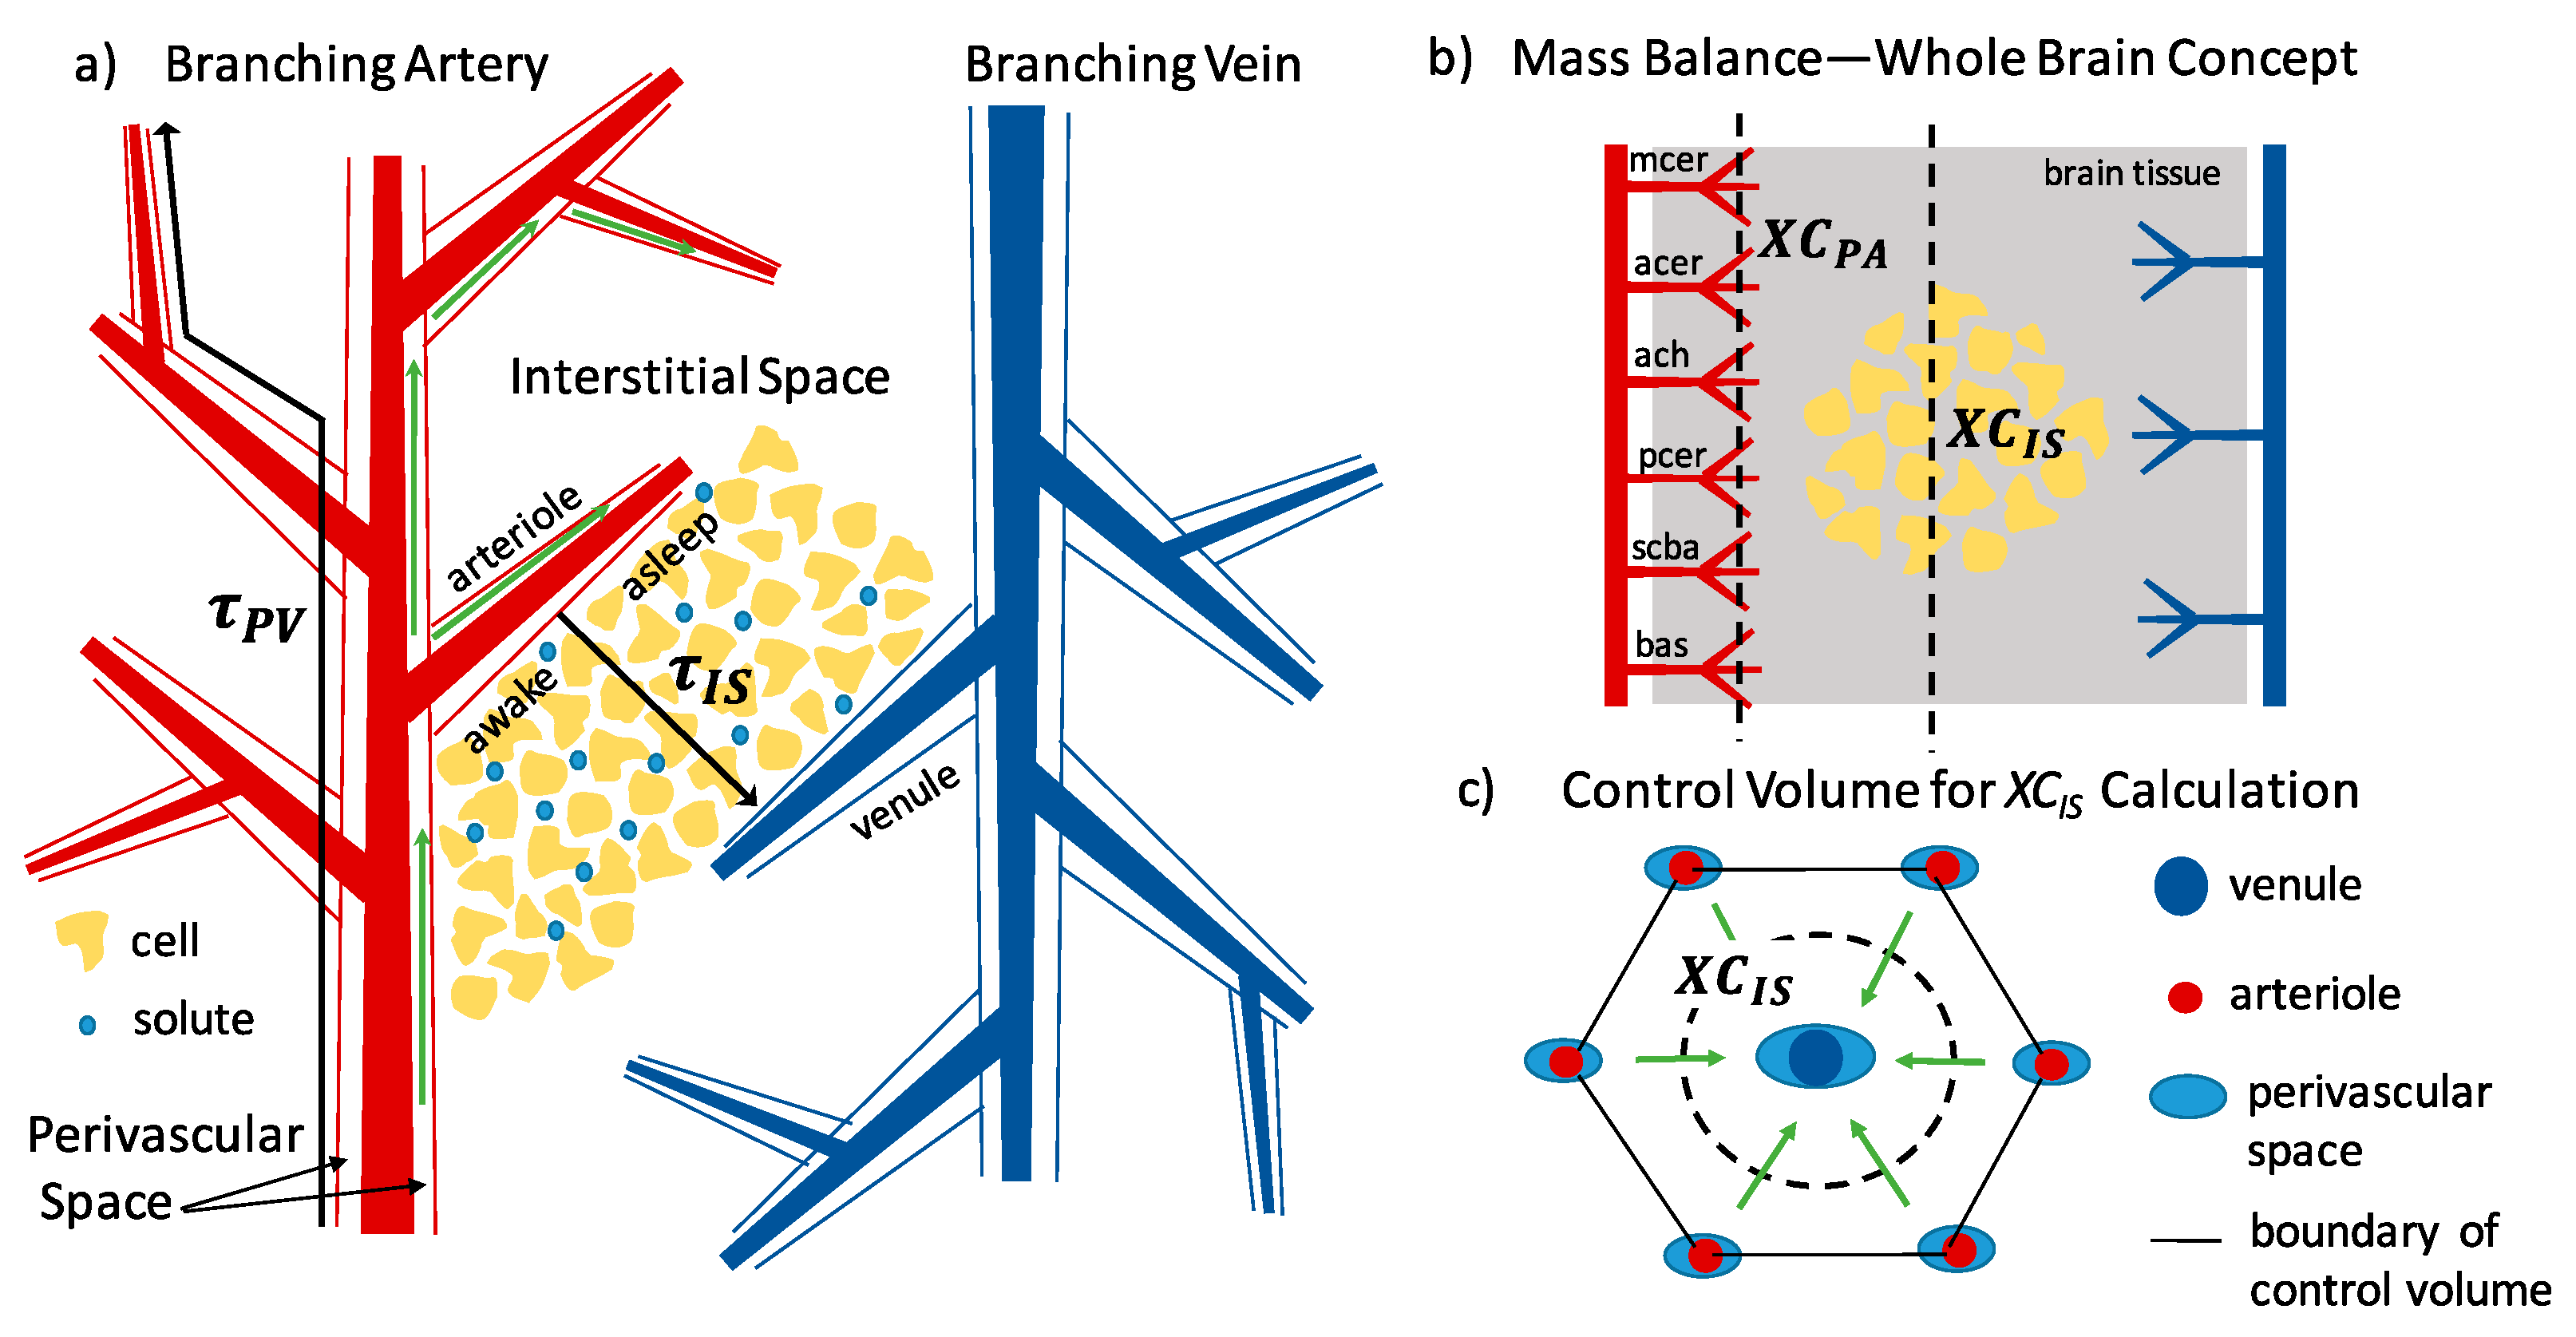

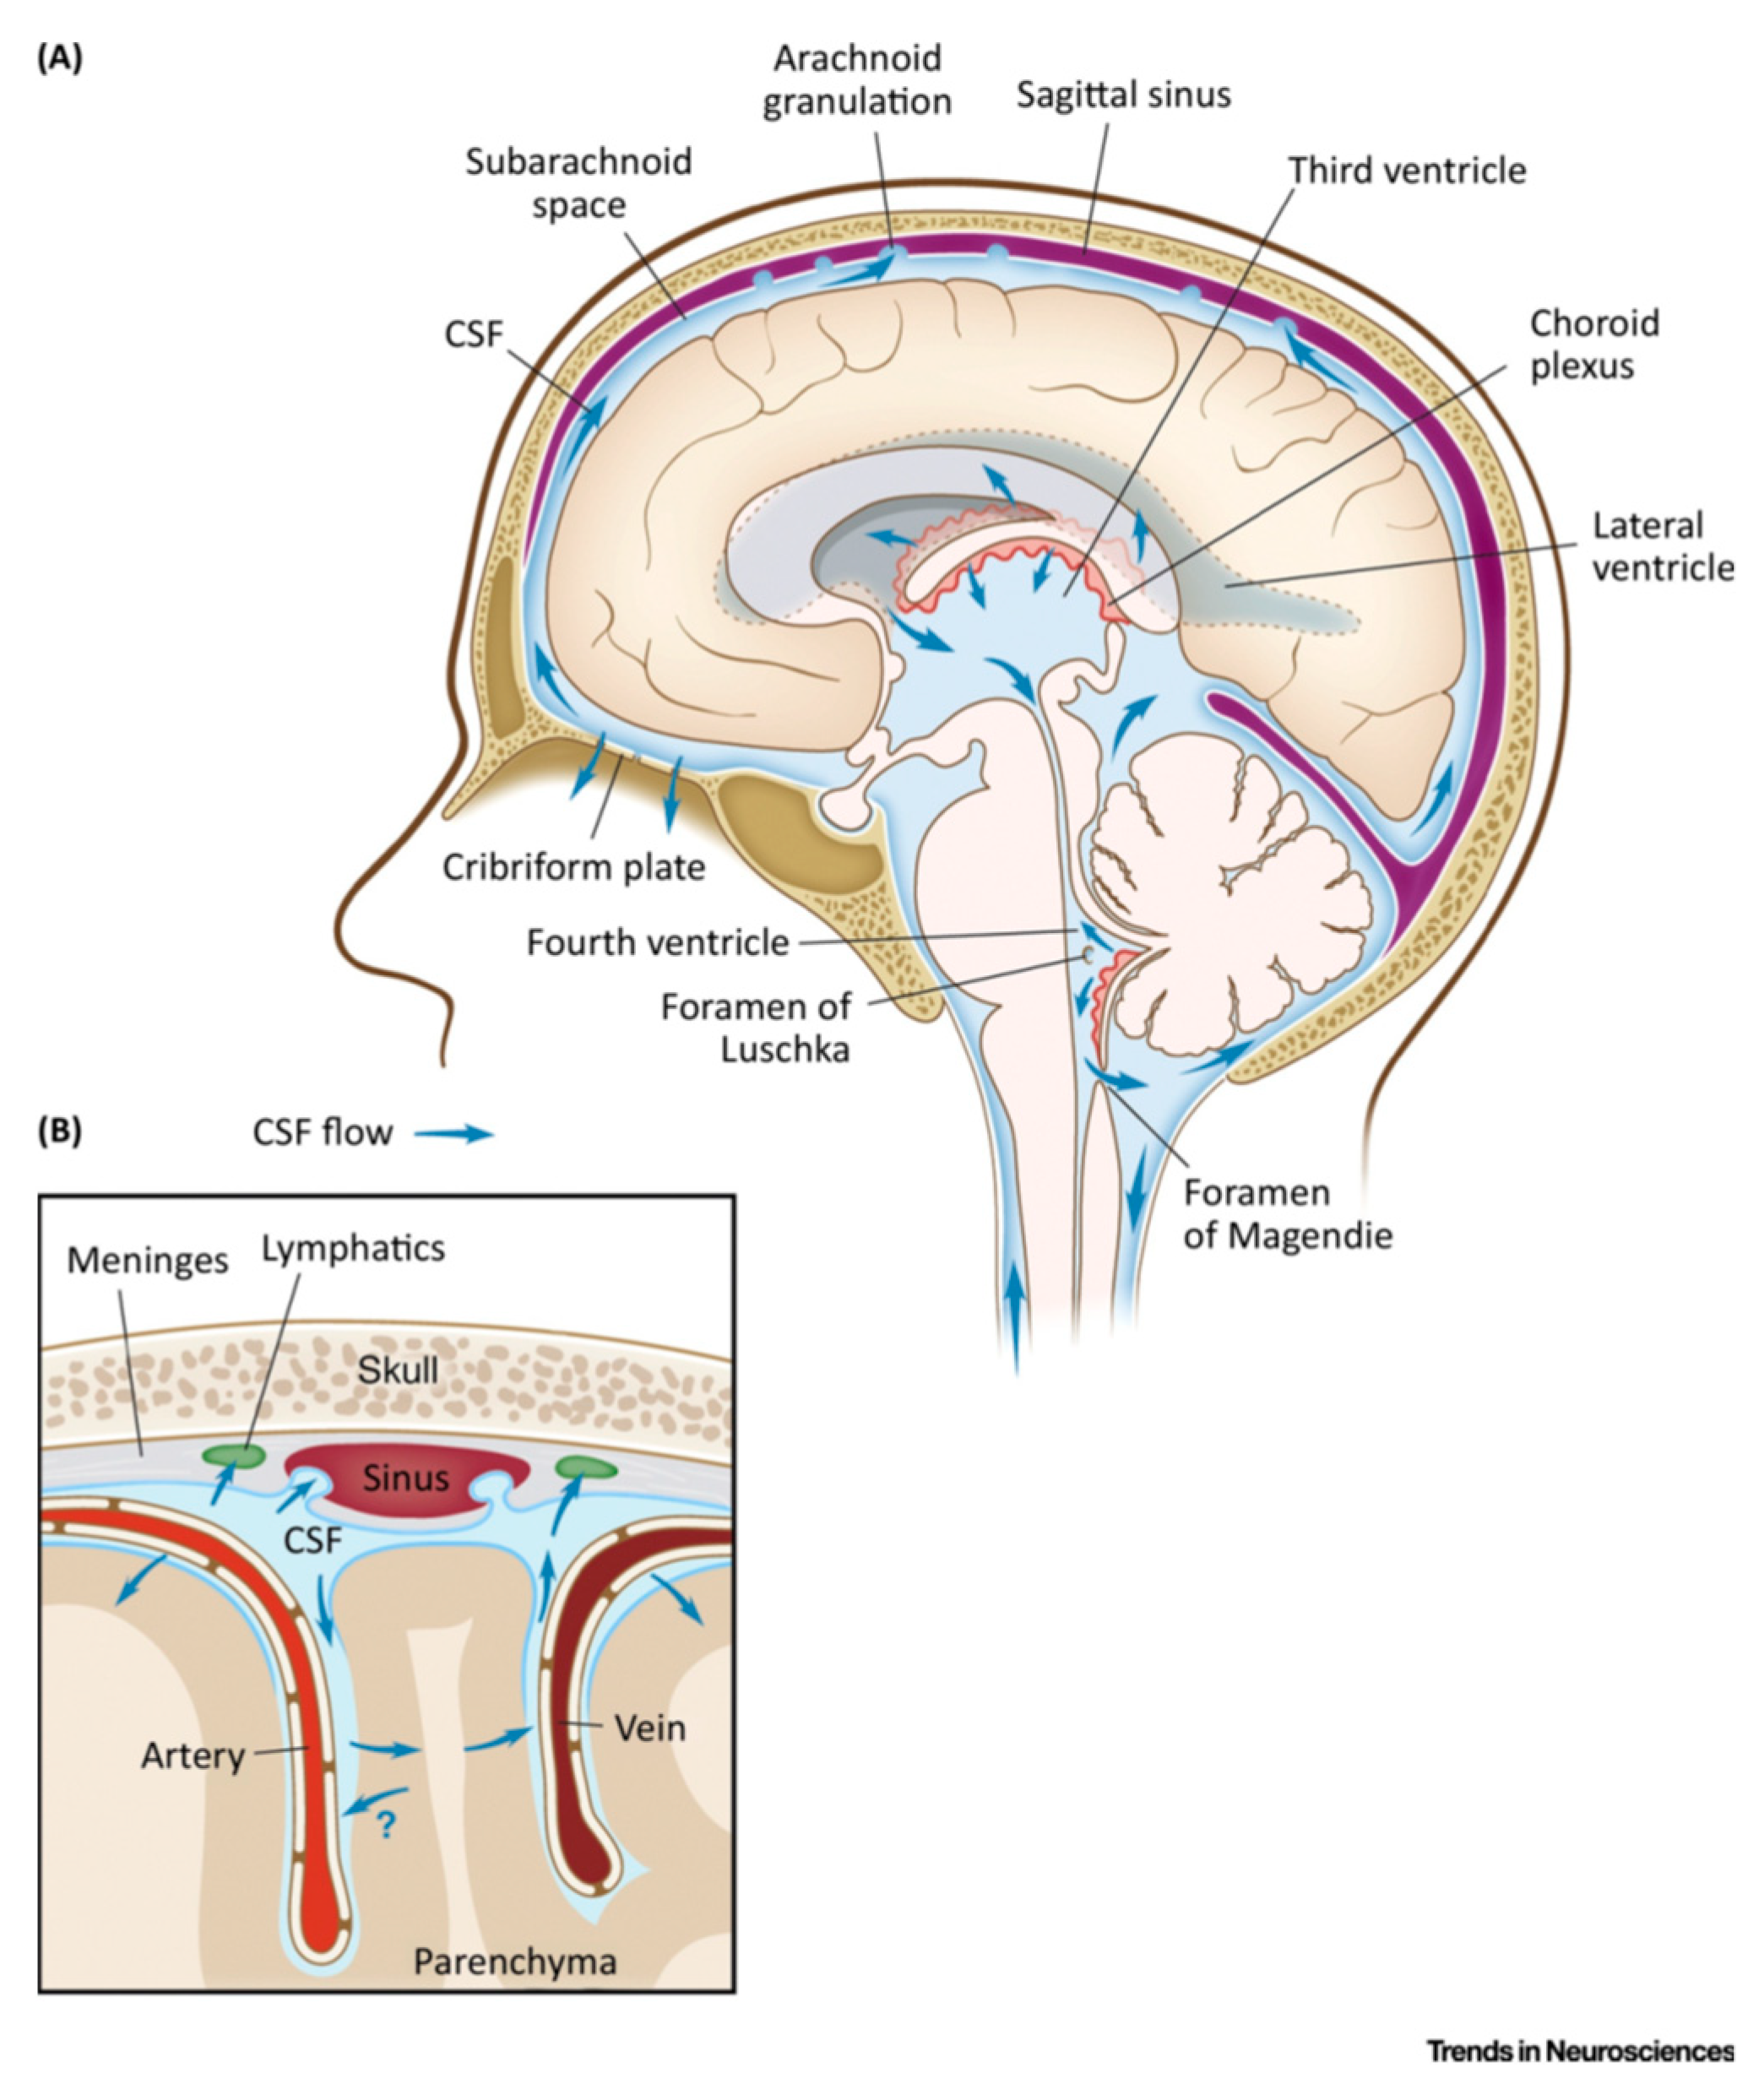
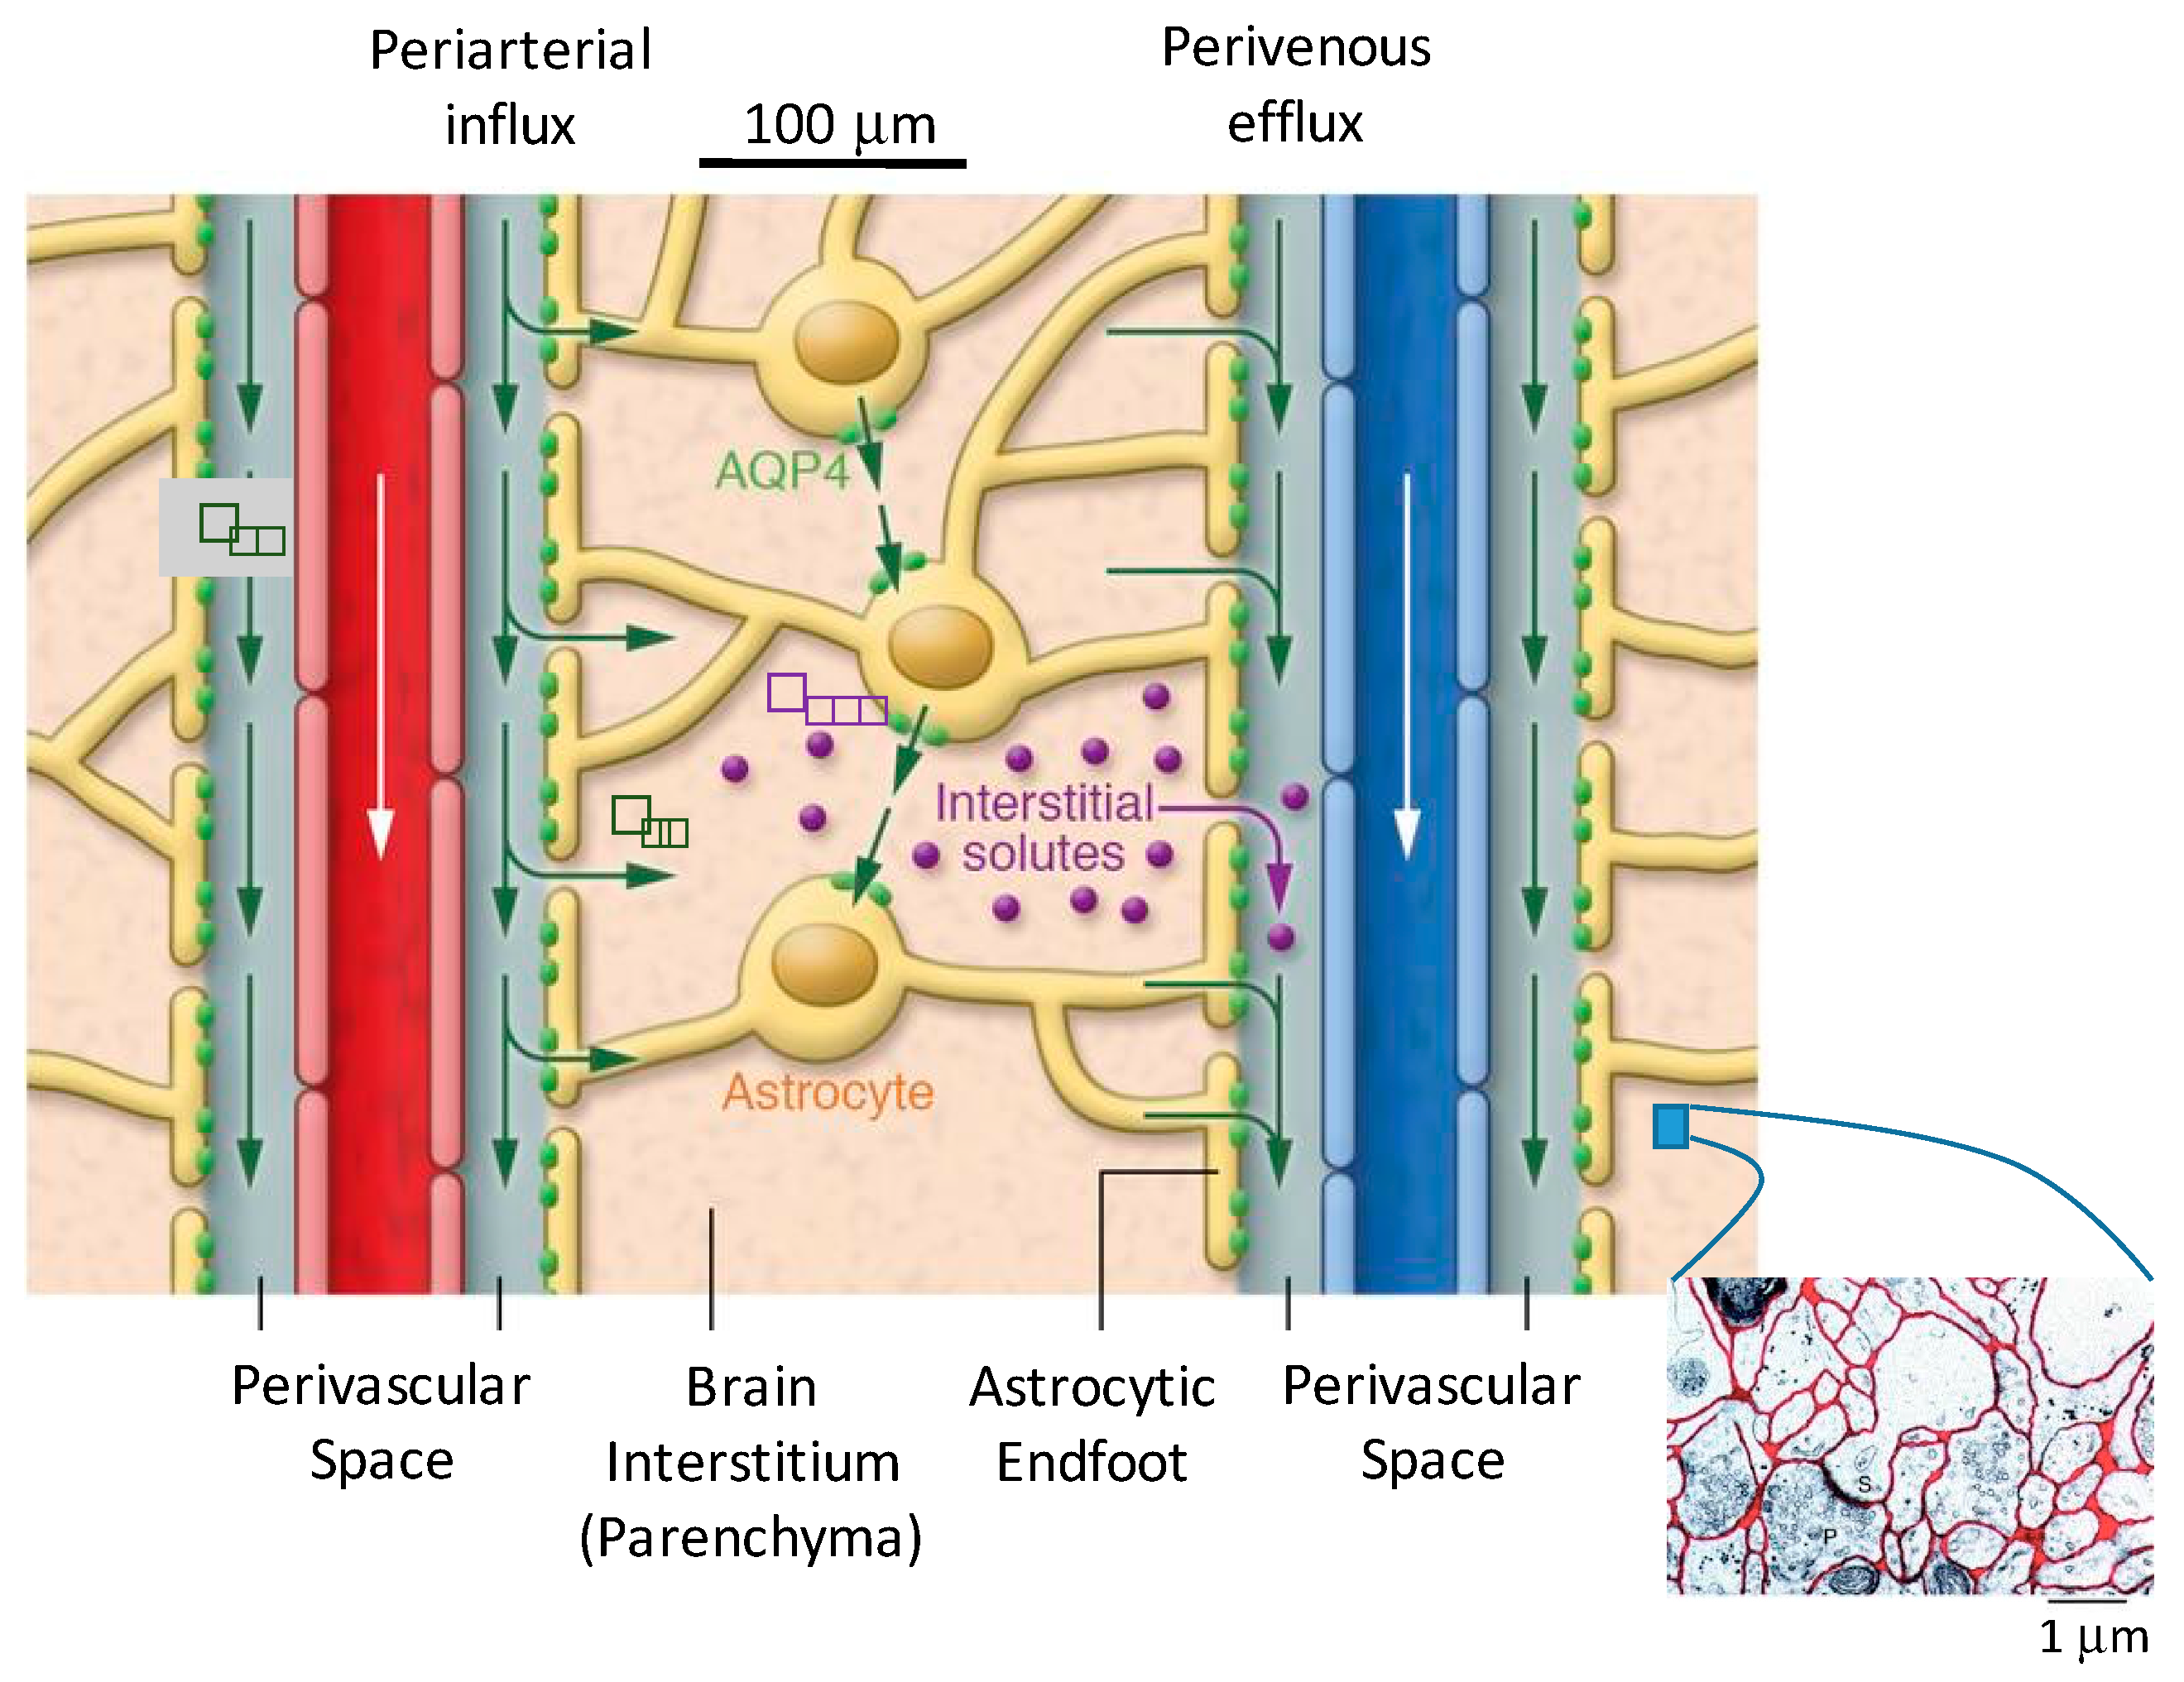
Table 1.
Acronyms.
| Acronym | Description | Acronym | Description |
|---|---|---|---|
| ADCw | apparent diffusion coefficient of water, as measured by MRI | iNHP | idiopathic normal-pressure hydrocephalus |
| AQP | aquaporin, protein channel for water transport | IOI | integrated optical imaging |
| AQP4 | aquaporin-4 | ISF | interstitial fluid |
| BBB | blood–brain barrier | KO | knock-out, genetically altered animal model |
| CSF | cerebrospinal fluid | NREM | non-rapid eye movement sleep |
| DCE MRI | dynamic contrast-enhanced MRI | Pe | Peclet number, advective rate divided by diffusive rate |
| DTI MRI | diffusion tensor imaging MRI | PET | positron emission tomography |
| ECM | extracellular matrix | PVS | perivascular space |
| ECoG | electrocorticography | PVW | perivascular wall |
| ECS | extracellular space | Re | Reynolds number, inertial forces divided by viscous forces |
| EM | electron micrograph | RTI | real-time iontophoresis |
| EMG | electromyography | SAS | sub-arachnoid space |
| GAG | glycosaminoglycans | TBI | traumatic brain injury |
| ICP | intracranial pressure | WT | wild-type, unaltered animal model |
Table 2.
Key Parameters describing Transport in the Brain and their Values.
| Parameter | Symbol | Description | Values, References |
|---|---|---|---|
| Void Volume | Percentage of tissue volume that is extracellular | 20% (anesthetized) [36] 14% (awake) [37] | |
| Tortuosity | λ | Degree to which molecular transport is slowed by the porous medium | 1.6 (small molecules) [36] 1.5–2.5 (large molecules) [38] |
| Perivascular Velocity | Average fluid velocity in the perivascular space | 17–19 μm s−1 (experiment) [39,40] ≈0 μm s−1 (computation) [41] | |
| Hydraulic Conductivity (Interstitial) | Ease with which a fluid can move through a porous media. Equation (2). | 2 × 10⁻⁶–2 × 10⁻⁸ cm2 mmHg−1 s−1 [42,43,44,45] | |
| Perivascular Wall Permeability | Quality of a material that allows liquids or gases to pass through it. | 0.6% [46,47] [46,48] 3 × 10⁻⁵ − 5 × 10⁻³ cm s−1 for Dex 3 kDa |
Table 3.
Estimated interstitial velocity for awake state based on measured changes in void volume from Xie et al. and proposed interstitial velocity in the anesthetized state for mice.
Table 3.
Estimated interstitial velocity for awake state based on measured changes in void volume from Xie et al. and proposed interstitial velocity in the anesthetized state for mice.
| State | Void Volume | Hydraulic Conductivity (cm2 mmHg−1 s−1) | Pavg (mmHg) | |
|---|---|---|---|---|
| Asleep | 0.23 [37] | 2 × 10⁻⁶ [43,44] | 0.5 | 15 [46] |
| Awake | 0.14 [37] | 2 × 10⁻⁷ | 0.5 | <1 [46] |
Table 4.
Summary of Computational Models and Measurements of Periarterial Flow.
| Bilston et al. [95] (Computational Model) | Asgari et al. [41] (Computational Model) | Mestre et al. [39] (Experimental Observations) | |
|---|---|---|---|
| Model Dimensions | 2-D | 3-D axisymmetric | - |
| Theoretical Equation | Navier–Stokes | Navier–Stokes with porous media term | - |
| Solution Method | Finite-volume, moving mesh (CFX4) | Finite-volume (OpenFOAM) | Particle tracking of fluorescent microspheres |
| Boundary Conditions | Inlet pressure set | Zero net flow | Pressure not measured |
| Perivascular Geometry | Shape = Annular PV Width = 25 μm 100 μm | Shape = Annular PV Width = 10 μm 23 μm | Shape = Annular, with an elliptical outer surface with a high eccentricity PV Width = 40 μm 40 μm |
| Arterial Pulse Wave | Amplitude = 10% of arterial radius; Speed = 5 m/s; Wavelength = 100 μm; Shape = sinusoidal | Amplitude = 4% of arterial radius; Frequency = 10/s; Speed = 1 m/s; Wavelength = 0.1 m; Shape = sinusoidal | Amplitude = 2% of arterial radius; Frequency = 5/s; Shape = fast increase during systole and slow decrease during diastole (not sinusoidal) |
| Results | - | - | - |
| Flow Rate and Velocity | Q = 1.35 mm3 s−1 1.4 × 105 μm s−1 | Q = 3.7 × 10⁻¹⁰ mm3 s−1 = negligible | Q = 0.005 mm3 s−1 = 18.7 1 μm s−1 |
| Conclusions | Arterial pulsations are able to drive perivascular flow (for a much shorter than observed wavelength). | Arterial pulsation unlikely to drive perivascular flow; Dispersion may accelerate transport beyond diffusion only. | Measured periarterial flow was pulsatile, correlated with the cardiac cycle, parabolic (laminar), and net antegrade (in the direction of blood flow). |
Table 5.
Summary of Computational Models of interstitial Flow and Mass Transport. No measurements have been reported to date for interstitial flow.
Table 5.
Summary of Computational Models of interstitial Flow and Mass Transport. No measurements have been reported to date for interstitial flow.
| Jin et al. [44] | Holter et al. [45] | Ray et al. [46] | |
|---|---|---|---|
| Model Dimensions | 2-D | 3-D | 3-D |
| Theoretical Equation | Navier–Stokes in reconstructed ECS | Navier–Stokes in reconstructed ECS | Darcy’s Law, combined with Mass Transfer in porous media |
| Solution Method | Finite-element (COMSOL) | Finite-element (FEniCS) | Finite-element (FEniCS) |
| Boundary Conditions | Pressure Gradient = 1 mmHg mm−1 | Pressure Difference = 0–8 mmHg | Pressure Difference = 0–10 mmHg |
| Interstitial Geometry | For flow: EM of Kinney et al. [2] adjusted to increase void volume to around 20% For mass: vascular separation = 280 μm (center-to-center) = 30 μm | For flow: EM of Kinney et al. [2] adjusted to increase void volume to around 20% For mass: vascular separation = 285 μm (center-to-center) 30 μm 40 μm 24 nm | For flow and mass: vascular separation = 255–305 μm (center-to-center) 30 μm 30 μm 24 nm 18–23% (depending on experimental data) = 2 × 10⁻⁶ − 2 × 10⁻⁸ cm2 mmHg−1 s−1 |
| Validation | Comparison to experimental values of , which were found to be significantly higher. Mass transport results compatible with Xie et al. [37] tracer studies. | Mass transport results compatible with Iliff et al. [71] tracer studies and Thorne et al. [99] IOI experiments. | Quantitative comparison to published experimental RTI curve replicates [37,100,101]. |
| Results | - | - | - |
| Hydraulic Conductivity | = 2 × 10⁻⁸ cm2 mmHg−1 s−1 | = 1.2 × 10⁻⁶ cm2 mmHg−1 s−1 | - |
| Interstitial Velocity | 0.1 μm min−1 | - | 10 μm min−1 |
| Conclusions | Interstitial transport is dominated by diffusion. | Interstitial transport observations adequately explained by diffusion. | RTI experimental data range is consistent with simulations for velocities of order 10 μm min−1. |
Table 6.
Interstitial superficial-velocity simulation results for various authors. A range of hydraulic conductivity values and a range of periarterial wall pressures were used (further described in the text). Velocity reference is Ray et al. [46] unless otherwise noted.
Table 6.
Interstitial superficial-velocity simulation results for various authors. A range of hydraulic conductivity values and a range of periarterial wall pressures were used (further described in the text). Velocity reference is Ray et al. [46] unless otherwise noted.
| Hydraulic Conductivity (cm2 mmHg−1 s−1) | For Pavg = 0.2 mmHg | For Pavg = 0.8 mmHg | For Pavg = 2.4 mmHg | For Pavg = 8 mmHg |
|---|---|---|---|---|
| 2 × 10⁻⁶ [43,44] 1 | 5 [44], 5 | 22 [44], 25 | 65 [44], 75 | 220 [44], 250 |
| 2 × 10⁻⁷ [42] | 0.5 | 2.5 | 7.5 | 25 |
| 2 × 10⁻⁸ [45] | 0.1 [45], 0.05 | 0.25 | 0.75 | 2.5 |
1 reports value of 1.2 × 10⁻⁶ cm2 mmHg−1 s−1, for parenchyma only based on simulation.
Table 7.
Characteristic Transport Times in the Mouse Brain. In an optimized continuous system, characteristic times for each step will be nearly equivalent. Periarterial transport is dominated by advection, therefore its overall transport time is equal to the characteristic time for advection. Interstitial transport is by diffusion and advection, with the relative importance of each depending on molecular size. For the overall interstitial characteristic time, diffusion is augmented by advection, with .
| Description | Periarterial Advection | Interstitial Advection | Interstitial Diffusion |
|---|---|---|---|
| Length (mm) | 9.5 1 | 0.2 | 0.2 |
| Velocity (μm s−1) | 18 [39,40] | 0.2 [46] | |
| Apparent Diffusivity (cm2 s−1) | 10−8–10−5 | ||
| Characteristic time (τ) (min) | 9 | 19 | 1–10 small molecules 10–1000 large molecules |
1 Length of the periarterial route once it enters the parenchyma, from the beginning of the penetrating artery to the conclusion of the penetrating arteriole (just prior to the capillary bed). Estimated at twice the height of a mouse brain. A median human cerebral artery length (35 mm [114,115]) multiplied by the weight ratio of mouse to human brain gives about 10 mm.
Table 8.
Volumetric flow balance comparisons for periarterial and interstitial flow in the mouse brain, compared with published clearance rates estimating overall clearance by a perivascular route.
Table 8.
Volumetric flow balance comparisons for periarterial and interstitial flow in the mouse brain, compared with published clearance rates estimating overall clearance by a perivascular route.
| Description | Periarterial | Interstitial—Anesthetized/Asleep | Interstitial—Awake |
|---|---|---|---|
| Total Cross-Sectional Area (mm2) | 0.2 | 200–500 | 200–500 |
| Velocity (um/sec) | 18 [39,40] | 0.2 [46] | 0.01 [46] |
| Total Volumetric Flow Rate (μL min−1) | 0.2 | 2–6 | 0.2–0.4 |
| Calculated Perfusion 1 Rate (μL g−1 min−1) | 0.5 | 5–15 | 0.4–1 |
| Literature Perfusion Rate1 (μL g−1 min−1) | 0.3–5.5 [37] 0.2–1.2 [116] | 2.8–5.5 [37] 0.8–1.2 [116] | 0.3–1.5 [37] 0.2–0.5 [116] |
1 Based on clearance of normally occurring molecules lacking a BBB transport route from the mouse or rate brain (e.g., sucrose, inulin, albumin).
© 2019 by the authors. Licensee MDPI, Basel, Switzerland. This article is an open access article distributed under the terms and conditions of the Creative Commons Attribution (CC BY) license (http://creativecommons.org/licenses/by/4.0/).
Share and Cite
MDPI and ACS Style
Ray, L.A.; Heys, J.J. Fluid Flow and Mass Transport in Brain Tissue. Fluids 2019, 4, 196. https://doi.org/10.3390/fluids4040196
AMA Style
Ray LA, Heys JJ. Fluid Flow and Mass Transport in Brain Tissue. Fluids. 2019; 4(4):196. https://doi.org/10.3390/fluids4040196
Chicago/Turabian StyleRay, Lori A., and Jeffrey J. Heys. 2019. "Fluid Flow and Mass Transport in Brain Tissue" Fluids 4, no. 4: 196. https://doi.org/10.3390/fluids4040196