3D Printed Structured Porous Treatments for Flow Control around a Circular Cylinder †


Department of Mechanical and Manufacturing Engineering, Trinity College Dublin, D02 PN40 Dublin, Ireland
*
Author to whom correspondence should be addressed.
†
This paper is an extended version of our paper published in Vibroengineering PROCEDIA, 2020; Volume 31, pp. 80–85.
Fluids 2020, 5(3), 136; https://doi.org/10.3390/fluids5030136
Submission received: 21 July 2020
/
Revised: 10 August 2020
/
Accepted: 12 August 2020
/
Published: 14 August 2020
(This article belongs to the Special Issue Models and Applications of Acoustic for Fluids)
Abstract
:The use of porous coatings is one of the passive flow control methods used to reduce turbulence, noise and vibrations generated due to fluid flow. Porous coatings for flow stabilization have potential for a light-weight, cost-effective, and customizable solution. The design and performance of a structured porous coating depend on multiple control parameters like lattice size, strut thickness, lattice structure/geometry, etc. This study investigated the suitability of MSLA 3D printers to manufacture porous coatings based on unit cell designs to optimize porous lattices for flow control behind a cylinder. The Reynolds number used was – and the flow measurements were taken using a hotwire probe. Different experiment sets were conducted for single cylinder with varying control parameters to achieve best performing lattice designs. It was found that lattice structures with higher porosity produced lower turbulence intensity in the wake of the cylinder. However, for constant porosity lattice structures, there was negligible difference in turbulence and mean wake velocity levels. Coating thickness did not have a linear relationship with turbulence reduction, suggesting an optimal thickness value. For constant porosity coatings, cell count in coating thickness did not influence the turbulence or mean wake velocity. Partial coating designs like helical and spaced coatings had comparable performance to that of a full coating. MSLA printers were found capable of manufacturing thin and complex porous lattices.
1. Introduction
A direct relation between environmental noise and the quality of life has been found by researchers [1,2]. Long exposure to loud noise levels can lead to adverse short-term and long-term effects such as anxiety, hearing impairment, sleep disturbance, annoyance, cardiovascular, and heart problems. Research from WHO estimated a loss of nearly 1.6 million lives per year in Western Europe due to environmental noise [3]. One of the primary contributors to environmental noise is aerodynamic noise, which is largely produced by high-speed trains, aircrafts, fans, etc. The acoustic power of sound is proportional to 6th–8th power of velocity [4,5] and this leads to an intense increase in noise levels with a relatively small increase in velocity. This has led to a demand for flow control methods with an aim for noise reduction.
Flow around a cylinder is widely studied due to its presence in a large number of day to day applications (chimneys, exhausts, pipes, electricity poles, etc.). A cylinder system in a flow produces aerodynamic noise and thus is a focus for noise reduction. The flow becomes more complex in the case of tandem cylinder systems like aircraft landing gears, heat exchangers, parallel bridges, pantographs, etc. In the case of applications of flow around a cylinder that do not generate high noise levels, there can still be strong vortices that can affect the mechanical and structural integrity of the components that lie in the wake region of the cylinder.
This study focused on porous coatings as a passive flow control method for flow regularisation with an aim for noise and vibration reduction. Porous materials have proved to affect the flow field near a bluff body and reduce aerodynamic noise by depriving momentum of the wake and thereby suppressing vortices [6]. They also offer various advantages by combining the properties such as being lightweight, cost-effective, easier to implement, wide absorption frequency range and high sound absorption ability into a single material [7]. Noise reduction can also affect energy conservation, damping of oscillations, material fatigue of construction elements, preventing destructive resonance, etc. [8].
As the flow moves past a cylinder, the presence of viscous stresses and skin friction results in the formation of the boundary layer. Moving along the circumference of the cylinder, the boundary layer thickness increases and leads to a decrease in velocity gradient and shear stresses [9]. On achieving a turbulent boundary layer, shear stresses are no longer able to hold the layer and cause the flow to separate. There is also an increase of pressure gradient in the boundary layer which forces fluid particles to move against the increasing pressure force and further assists in boundary layer separation [10]. The separation leads to wake formation and the length of this wake region depends on the velocity of the incoming flow and diameter of the cylinder. The pressure is maximum at the stagnation point and then decreases along the front half of the cylinder but, then starts to increase in the rear half. The turbulence in the near wake is the result of this pressure difference.
The flow inside the wake region tends to roll up into eddies that detach themselves from the top and bottom of the body to form ‘von Kármán vortex street’. These vortices generate vibration, noise, and turbulence. Flow analysis at Reynolds number (Re) = 10 by [11] revealed that apart from the primary alternate eddies, there is also a formation of pronounced secondary vortices in the vicinity of each primary eddy. Pairs of secondary eddies merge to contribute to the wake. This study also stated that at higher Re values, the turbulence is generated due to steep pressure and velocity gradients in separated-mixing-layer zones rather than from alternating eddies.
The Reynolds number of the incoming flow is one of the key factors in determining the flow pattern in wake region, vortex formation and its length, the noise produced, boundary layer separation point, etc. The Re range used for this study was – depending on the outer diameter of the porous coated cylinder. However, for high porosity, i.e., low airflow resistivity coatings, it is reasonable to assume that the core cylinder diameter is more important [12]. In the range 150 < Re < 300, the vortex street achieves transition range and with a further increase from 300 up to , the vortex street shows complete turbulent behavior. Moreover, in this range, the boundary layer is still laminar and the vortex street is periodic [13]. In the subcritical range of flow, i.e., 300 < Re < , the flow can be accurately visualized in two-dimensions and the effect of three-dimensional vortices can be neglected [9].
When the cylinder is covered with a porous coating the air flow not only goes around the cylinder but also through the porous coating. Flow analysis of a porous coated cylinder by [14] revealed that for a circumferential angle of up to 90°, streamlines follow an internal path, and each pore in the medium generates a small wake, resulting in turbulent kinetic energy within each pore. The flow travels amongst adjacent pores from 90° to 135°. From 90° to the rear of the cylinder, the streamlines converge downstream to form a regular wide cylinder wake.
As the air flows through the channels of the porous media, it loses velocity due to skin friction (thermal loss) and fluid viscosity (viscous loss) [7]. This is also confirmed by [15], which states that vorticity diffuses into both the external and internal flow fields when a porous cylinder is considered.
As the airflow now takes place both inside and outside the porous medium, a noise reduction (tonal and broadband) is seen, due to:
- Deprivation of flow momentum in the wake region, leading to suppression of vortices [6].
- An upstream shift of the flow separation point and a reduction in vortex strength [12].
- Regularization of the flow around the cylinder [16].
- Reduction in pressure fluctuations [12].
- Absorption of some of the energy contained in the boundary layer [12].
Research has shown that the use of a porous coating alters the flow field around the cylinder. For a rigid cylinder, vortices are initially strong and compact. With an increase in time, they cover a larger area in the wake and slowly disperse due to vortex growth. However, for a porous coated cylinder, the vorticity does not show noticeable variation over time and result in the reduction of turbulence intensity in the wake of the cylinder [6]. Similar conclusions are drawn by [17], which found that the use of a porous coating simplified vortex interactions to yield almost a Kármán street behind the cylinder. It also verified that the vortices are larger and the diffusive effects are more prominent.
A porous coating impacts both turbulence and mean wake velocity levels. Vibration and noise are directly related to turbulence levels and the strength of vortices depends on mean wake velocity. Conclusions from [18] stated that porous surface reduces the kinetic energy (dependent on velocity) of vortices that collide with it, without generating intense near-wall vorticity. Hot-wire measurements performed by [19] showed that porous coatings give noise reduction along with a reduction in velocity fluctuations. Numerical results from [20] confirmed that flow regularization in the wake can be achieved by porous covers. The main cause for flow regularization is the reduction in pressure fluctuations due to porous coating [8], which is in accordance with findings from [21,22]. Numerical simulations by [23] deduced that the effect of porous coating to suppress the velocity and pressure fluctuations is more profound at higher Reynolds number.
The performance of a porous coating depends on several parameters that affect the regularisation of flow and suppression of vortices. Design and control parameters chosen for this study are discussed in Section 2.2 and Section 3. Commonly studied parameters for porous coating are the thickness of the porous coating and its porosity.
According to findings in [16], thin coatings are not effective for flow control as they do not provide sufficient space inside the porous media for airflow to lose momentum and kinetic energy. With thick coatings, a reduction in broadband noise of up to 15 dB is seen [16]. A maximum noise reduction of 25 dB using a porous coating of thickness 10 mm was also reported by [20].
The porosity of the coating affects the airflow resistivity. Generally, materials with low airflow resistivities lead to higher noise reduction. For high airflow resistivity coatings, there is no noise reduction at all for low Reynolds number [12]. This is because the coatings with lower porosity are not permeable to the flow and act as a rigid body. A reduction in wake length is also observed with an increase in porosity of the medium [15].
Study [6] tested a rigid cylinder and a porous coated cylinder with the same outer diameter and found that the sound pressure level for the rigid cylinder was higher than the porous coated cylinder. It concluded that the reduction of the sound pressure level is unattainable by the same outside diameter of the cylinder with porous materials. Similar result was also reached by [20] which stated that the reduction in noise level cannot be achieved by only increasing the diameter of bare cylinder without porous layer. Multiple studies also found that macro-level surface roughness does not impact the generation of aerodynamic sound [6,12]. For the same surface roughness, open and closed cell-type porous material did not have a difference in sound reduction [6]. Aerodynamic sound is also not affected by surface hardness [6]; therefore, this study performed using 3D printed polymer resin porous coatings will also be valid for applications where a metal powder bed fusion process will be used to create the porous material.
Noise reduction is often related to drag, which is of importance in high-speed travel applications. In case of porous coatings, it is found that a porous coated cylinder has higher drag in comparison to a rigid cylinder [8,24]. Another study found that drag reduction of up to 30% can be achieved for lower Re values, however, for Re values in the range of 10, there is a significant increase in the drag coefficient, and flow regularization and drag reduction are not correlated to each other [17].
As porous coatings show a promising future for flow control, it is critical to study their manufacturing and factors affecting their operation. Thus, the purpose of this study was to:
- Investigate the suitability of MSLA 3D printers to manufacture porous coatings;
- Investigate various control parameters that affect the performance of porous coatings;
- Design and identify high performance porous lattices for flow control based on unit cell definitions.
2. Experimental Setup
2.1. Experimental Facility
All tests were conducted in a subsonic open-jet wind tunnel system in the Fluids, Acoustics, and Vibration Lab at Trinity College. The subsonic open-jet wind tunnel was used to supply the ambient crossflow. The wind tunnel is powered by a 5.5 kW centrifugal blower, which is linked to a cubic plenum. The size of the plenum is 800 mm × 800 mm × 800 mm. Since the quality of the crossflow can be greatly affected by the blower, a series of honeycomb layers and two layers of mesh plate were installed within the plenum. This uncouples the crossflow from the blower, thereby reducing the turbulence intensity of the crossflow and improving the evenness of the velocity profile of the nozzle outlet. A nozzle with length 1000 mm and a square outlet size of 75 mm × 75 mm is connected to the plenum from which the crossflow is ejected. Similar to the current work, recent investigations in this facility include single and dual air curtains used for noise reduction of cylinders in a crossflow [25,26,27].
The rig used in this study is schematically illustrated in Figure 1. For the setup shown, the incoming flow velocity from the wind tunnel was 60 m/s and the turbulent intensity of the potential core of the crossflow was below 1%. The dynamic viscosity of air used for Re calculations was 1.81 × 10 N s/m.
2.2. Porous Coating Design and Manufacturing
The design parameters for porous coatings used in this study were:
- Lattice type/structure
- Lattice size/dimensions
- Lattice thickness or strut diameter
- Coating thickness (h/D) (where h is the coating thickness (mm) and D is the diameter of the core rigid cylinder (mm))
- Cell count in coating thickness
- Coating shape/geometry
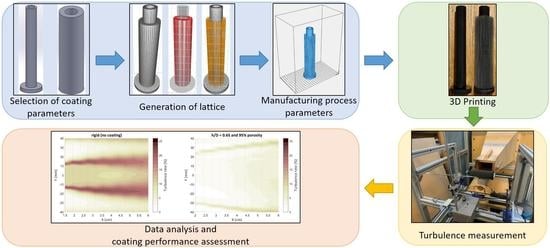
The design and manufacturing of a porous coating was a multi-step process. The first step was to create rigid/solid cylinders and coatings in SolidWorks. The .stl file from SolidWorks was then imported into nTopology Element software, which is used to generate and modify porous lattices. The software can modify the lattice type, lattice size, and strut diameter and perform operations such as boolean, meshing, conversion to CAD, etc. Subsequently, the output file from this was imported into a slicing software that was compatible with the chosen MSLA 3D printer. Printers used in this study were the Anycubic Photon and the Prusa SL1. Both these printers use a high-resolution LCD panel and a UV LED to cure thin layers of resin to give a high level of detail in the final part. They offer a minimum layer height of 0.01 mm and a resolution of 47 m in XY axes [28,29,30]. The success rate and quality of final print depended on several slicing parameters that had to be adjusted as per the design requirements and the resin used. Slicing parameters were optimized using the trial and error method until the required print quality was achieved. The chosen values for the majority of coatings were:
- Layer thickness = 0.025 mm
- Normal exposure time = 8 s
- Bottom exposure time = 80 s
- Off time = 3.5 s
- Bottom layers = 8
The sliced model was then 3D printed, washed with isopropyl alcohol, and cured using UV light. The workflow is shown in Figure 2. All cylinders with a porous coating were designed with a core rigid cylinder of diameter D = 15 mm. The dimensions of the cylinder were at the finest scale possible with the additive manufacturing techniques. In this case, the core cylinder has a blockage ratio of 0.2 when compared to the nozzle of the open jet facility. While this is a high value, it is comparable to several studies in the literature which focus on turbulence properties in the wake of single cylinders [31,32,33].
2.2.1. Lattice Type
Cell type/structure/geometry has an important role in deciding the coating porosity. Every cell structure has a different packing fraction which affects the airflow resistivity of its lattice. Therefore, a cell structure with a high airflow resistivity and packing fraction will result in a low porosity coating. The type of lattice used also affects the surface smoothness and irregularity on the outermost coating layer.
For instance, Figure 3 shows a cubic and a diamond cubic cell of identical lattice size and lattice thickness. Due to a difference in their packing fraction, the porosity for cubic and diamond cubic cells was found to be 78.96% and 60.89%, respectively.
The porosity calculation method for a designed porous coating has been discussed in Section 2.3.
2.2.2. Lattice Porosity
Along with lattice type, the porosity of a coating is also controlled by lattice size and lattice thickness. For instance, a cubic coating of lattice cell size = 1.5 mm and lattice thickness = 0.49 mm has a porosity of 80%, whereas a cubic coating of lattice cell size = 2 mm and lattice thickness = 0.3 mm has a porosity of 95%.
Therefore, porosity can be altered by changing either lattice size, or lattice thickness, or both. Figure 4 shows three different porous coatings with constant lattice size = (2) mm but variable porosity. The difference in porosity exists due to difference in strut diameter, which is 0.3 mm, 0.45 mm, and 0.55 mm for Figure 4a–c, respectively.
2.2.3. Coating Thickness
As found in the literature, coating thickness is a key parameter that affects the performance of porous coatings. Changes in coating thickness were simply made by changing the thickness of the initial CAD model prior to the lattice generation.
2.2.4. Cell Count in Coating Thickness
For different porous coatings of constant thickness, it was possible to vary the number of cells generated between the inner and outer diameter of the coating. Figure 5 shows that for constant coating thickness (6 mm in this case), the number of cells can be varied by varying the lattice size. For instance, a cell dimension of 3 mm produced 2 cells across the coating thickness, whereas a cell dimension of 1 mm produced 6 cells. Adjustment of the strut diameter was used to maintain constant porosity in-spite of different lattice size.
2.2.5. Coating Geometry
It is well known that the flow field/pattern around a bluff body is affected by its shape/geometry. The changes in coating shape were made in the first step of the design process, i.e., CAD modeling. If a partial coating has the same flow control performance as a full coating, it provides added benefits including reduced material used, cost, weight, etc. The partial coatings investigated in this study were helical and spaced coating (seen in Figure 6). These partial coating shapes were chosen based on the concept of vortex generators. Separation is generally undesirable as it increases drag. As changing the fluid viscosity is not possible, delaying separation using vortex generators helps reduce drag [34].
2.3. Porosity Calculation
Previous studies on porous materials state that porosity is a critical parameter for noise reduction and flow control [6,8,12,16,20]. Therefore, it was essential to accurately measure and manipulate porosity for porous coatings used in this study. In Element, increasing the lattice thickness causes the thickened cell to exceed the original cell dimensions (seen in Figure 7), which affects the porosity. In this study it was desirable to specify global coating parameters at the unit cell level based on the following procedure.
The thickened cell was converted into a CAD model and trimmed in SolidWorks (seen in Figure 8). The trimmed cell was of the original cell dimensions and was used to measure porosity with high accuracy.
Porosity (%) was calculated using:
2.4. Data Acquisition and Uncertainty
Data acquisition was done using a Dantec P13 hotwire probe which worked along with StreamWare Pro, Matlab, and Arduino software. The probe movement was controlled using an Adafruit motor shield and NEMA-17 stepper motors and the whole process was fully automated. NEMA-17 motor has a step size of 200 steps/rev, i.e., a minimum step size of 1.8° and is highly precise.
StreamLine Pro is a constant temperature anemometer system for turbulence investigations. The Matlab code in conjunction with StreamWare allowed to take mean measurements for turbulence intensity and wake velocity at each data point. This was done with an acquisition time of 5 s at 40 kHz for each point. These parameters were selected following initial investigations which determined converged estimates for turbulence statistics were achieved by 5 s and to keep total measurement time to a minimum. Repeatability was assessed through repeat measurements of a sample cylinder and comparison of the measured profiles. The standard error of the turbulence intensity estimations was 0.25.
The initial probe calibration calculated five calibration coefficients ( and ) which were used to define the relation between bridge voltage (E) and flow velocity (U) as follows:
For turbulence intensity to be calculated, following variables were defined: = single data scan at an acquisition point, including conversion of voltage into flow velocity via Equation (2). = average of 200,000 data scans at an acquisition point for mean velocity component.
Turbulence intensity for different porous coated cylinders was plotted for data analysis.
Figure 9 shows that the probe moved in a specified path in the wake region, starting close to the cylinder at vertical profile x/D = 1 and moved towards x/D = 4. The same core rigid cylinder design was used for all 3D printed porous cylinders to allow using the same rig for all samples.
3. Results
A total of six experiment sets were performed with varying control parameters based on the unit cell definition.
3.1. Set 1: Influence of Lattice Structure (Variable Porosity)
Cylinders used in experiment set 1 are shown in Table 1. Cylinder 1 was a rigid cylinder of 15 mm diameter with no porous coating. Cylinders 2–4 had a core rigid cylinder of 15 mm diameter and a porous coating of 3.75 mm. For each porous coating, the lattice size was (1.5) mm and the lattice thickness was 0.5 mm. The only variable was the porosity of the lattice that occurred due to different structure types. The porosities of cubic, diamond cubic, and Kelvin cell (or tetrakaidecahedron) coatings were calculated as 78.96%, 60.89%, and 53.78%, respectively.
Figure 10 compares the effect of different lattice structure coatings and a rigid cylinder. Both rigid and porous coated cylinders result in distinct turbulence intensity peaks, which occur due to the flow separation from the top and bottom of the cylinder. Just behind the cylinder at x/D = 1, the cubic coating provides a nearly 30% reduction in turbulence intensity. This reduction is not as compelling at x/D = 2 but still exists. However, in the case of diamond cubic and Kelvin cell coatings, there is no notable turbulence reduction at any position in the wake region. This is due to differences in the porosity of different lattice structures. Since the cubic lattice has higher porosity, it provides lower airflow resistivity and enables airflow to lose momentum and energy when traveling through the porous medium. In the case of diamond cubic and Kelvin cell coatings which have lower porosities, they act as a rigid coating due to high airflow resistivities. This can be confirmed by their turbulence profiles which are similar to the profile of a rigid cylinder. Their poor performance is aided by the application of thin porous coatings in this set, which diminishes the distance in the wake to which the coatings have an impact. All cylinders behave similarly further away from the cylinder as the wake disperses.
The cubic lattice is better suited to low porosity coatings however it presented manufacturing challenges due to unsupported overhangs. The self-supporting geometries of diamond cubic and Kelvin cell coatings are better suited for additive manufacturing. For cubic lattice, the horizontal struts lack support structures and tended to collapse or bend under the gravitational forces. Despite these challenges the cubic lattice was chosen as the best performing lattice for further experiments.
3.2. Set 2: Influence of Porosity
Cylinders used in experiment set 2 are shown in Table 2. Based on results obtained from set 1, all cylinders (except cylinder 1) used for set 2 had a porous coating of a cubic lattice. Porous coatings had a constant lattice size of (2) mm and a coating thickness of 4 mm. By keeping the lattice size constant, porosity was varied by adjusting the lattice thickness or strut diameter (as discussed in Section 2.2.2). Strut diameter used for cylinder 5, 6, 7, and 8 was 0.3 mm, 0.45 mm, 0.55 mm, and 0.65 mm, respectively. As per the literature, porous coatings are more effective at higher porosity in reducing turbulence and noise. Based on this, the porosities for set 2 were varied between 80–95%.
Figure 11 clearly shows reduction in turbulence intensity with an increase in porosity. Just behind the cylinder at x/D = 1, the turbulence intensity for cylinder 8 (80% porosity) is at 15%, whereas, for cylinder 5 (95% porosity), it is at a considerably low value of 6–7%. Similar observations can be made at x/D = 2. While the turbulence intensity is higher than what it is at x/D = 1, high porosity still provides a reduction in comparison to low porosity coatings. Interestingly, at x/D = 3, the only cylinder which has noticeable reduction is cylinder 5 with 95% porosity. Even with different porosities, the other 3 cylinders behave similarly at this position with comparable turbulence peaks. Once the wake disperses and loses its momentum, i.e., at x/D = 4, all 4 cylinders have similar turbulence intensities despite their difference in porosities. Based on these results, cubic lattice with 95% porosity was chosen as the best performing lattice for further experiments.
Another observation is that with an increase in porosity, the width of the wake defined as the distance between the turbulence intensity peaks decreases. Coatings with lower porosity force the air flow to go around the coating rather than through it. This results in a wider wake profile.
Figure 12 compares the rigid cylinder with cylinder 5 (95% porosity). It reveals the extent to which a high porosity coating can reduce the turbulence as compared to a cylinder with no coating. Just behind the cylinder at x/D = 1, the improvement is nearly 70% reduction in turbulence intensity with the use of a porous coating. This reduction slightly drops from 70% to 60% at x/D = 2, which is still effective. Further downstream at x/D = 3, with the expansion of wake flow, the performance of the porous coating further deteriorates but, it still provides about a 25% reduction in turbulence intensity. On account of effective turbulence intensity reduction by high porosity coatings and previously conducted studies on porous coverings [6,8,12,16,20], noise reduction can be expected in real-life applications. For non-noise related applications, regularization of flow and a reduction in flow induced vibrations can be achieved.
Figure 13 shows the velocity profile for cylinders 1 and 5. It is evident that the use of a porous coating not only decreases turbulence intensity but also reduces the mean velocity behind the cylinder. As stated in Section 1, the length of wake depends on the velocity of the incoming flow. Mean wake velocity also affects the wake dissipation rate. With nearly 70% reduction in mean velocity at x/D = 1 and 50% at x/D = 2, vortices from cylinder 5 will dissipate faster due to lack of momentum and kinetic energy and will have a lower destructive impact on any bluff bodies in the wake of the porous cylinder. The use of high porosity coatings is also supported by [17], which states that larger values of porosity are needed to control the drag at high Reynolds numbers.
The manufacturing of high porosity coatings using MSLA 3D printers presents additional challenges in terms of print failures as compared to low porosity coatings. As the porosity in this set was controlled by varying the strut diameter, a high porosity coating required a small strut diameter. For industrial applications using the metal powder bed fusion process, this issue may not be prominent due to the supporting nature of the powder feedstock.
3.3. Set 3: Influence of (h/D) Coating Thickness
Cylinders used in experiment set 3 are shown in Table 3. After porosity, coating thickness has a strong impact on the effectiveness of a porous coating. For this experiment set, the coating thickness ratio was defined as ‘h/D’, where D = 15 mm and ‘h’ is the thickness of the porous coating. For cylinders used in this set, the coatings had a cubic lattice of 95% porosity to provide the best reduction in turbulence levels (as per the results from experiment sets 1 and 2). The only variable was the thickness of the porous coating, which was varied from h/D = 0.267 to h/D = 0.75. The minimum thickness was chosen as h/D = 0.267 and not h/D = 0.25 since with h/D = 0.267 and D = 15 mm → h = 0.267 × 15 = 4 mm. Moreover, since the lattice cell size was 2 mm, the number of cells between the inner and outer diameter of the coating equals 2 cells.
Figure 14 shows that with an increase in coating thickness from 0.267 to 0.45, there is a reduction in the turbulence intensity. At positions x/D = 1 and x/D = 2, all 3 coatings provide a substantial reduction in peak turbulence levels when compared to the rigid cylinder. Cylinder 10, i.e., h/D = 0.45 outperforms the other 2 cylinders at x/D = 3 and x/D = 4. As expected, cylinder 5 with the thinnest coating out of 3 porous coated cylinders loses its effectiveness at positions away from the cylinder. At x/D = 3, cylinder 10 still provides an almost 50% reduction in turbulence intensity. Even at x/D = 4, where cylinder 5 and cylinder 9 reach the same turbulence levels as the rigid cylinder, cylinder 10 reduces the peak turbulence by 15%. With an increase in coating thickness, the distance between the top and bottom flow separation regions across the cylinder increases, which enlarges the distance between the turbulent intensity peaks.
Figure 15 shows the turbulence levels for relatively thicker coatings as compared to those in Figure 14. Interestingly, the trend seen in Figure 14 that turbulence levels reduce with an increase in coating thickness, is not repeated for thicker coatings. From x/D = 1 to x/D = 4, the worst performing coating is clearly the thickest coating in the experiment set i.e., h/D = 0.75. The performance of h/D = 0.55 and h/D = 0.65 is quite comparable at the first 3 positions behind the cylinder, with h/D = 0.65 providing nearly 75% reduction in turbulence at x/D = 1. While the peak turbulence levels for h/D = 0.55 and h/D = 0.65 are similar, h/D = 0.65 has a lower average turbulence intensity between the peaks of the profile. Cylinder 12 outperforms cylinder 11 at x/D = 4 where it is still able to reduce peak turbulence by nearly 30% as compared to about 10% reduction by cylinder 11. It should also be noted that from x/D = 2 to x/D = 3 and x/D = 4, the turbulence intensity for the rigid cylinder decreases, whereas it increases for cylinders with a porous coating due to wake velocity reaching free stream velocity for all cylinders.
Figure 14 and Figure 15 indicate that the best results are provided by cylinder 10 and cylinder 12 with h/D = 0.45 and h/D = 0.65, respectively. To compare them, Figure 16 shows their turbulence intensity contour plots and it is evident that both the cylinders provide similar turbulence reduction in the wake region. Large white/light-pink zone in cylinder 10 and cylinder 12 contours indicates negligible turbulence as compared to dark-pink zones of high turbulence for cylinder 1. Due to a thick porous coating, air traveling through the channels of the coating has more time and space to lose its kinetic energy. At the same time, the wake region widens and dissipates quickly due to lower momentum. It was found that cylinder 12 also had slightly lower mean wake velocity than cylinder 10, which assists in the dissipation process.
The trend of maximum turbulence intensity vs coating thickness can be seen in Figure 17. All coatings provide a reduction in turbulence but, h/D = 0.45 and h/D = 0.65 give the best results. The trend shows that turbulence reduction cannot be attenuated indefinitely through increasing coating thickness. Depending on other design parameters, an optimal coating thickness exists. h/D = 0.65 corresponds to h/R = 1.3, which can be considered quite high for real-life applications where the mass and cost of components play a key role in the design and manufacturing process. For 100 mm long cylindrical coatings used in this study, h/D = 0.65 used almost 63% higher material volume as compared to h/D = 0.45. As the results from both these coatings are comparably good, h/D = 0.45 coating (corresponding to h/R = 0.9) will provide similar levels of wake stabilization at a lower material utilization.
Its use is also supported by the fact that thin coatings provide greater ease of additive manufacturing as thicker coatings are more prone to print failures and structural deformations.
3.4. Set 4: Influence of Cell Count in Coating Thickness
Cylinders used in experiment set 4 are shown in Table 4. In this set, the coating thickness was kept constant at 6 mm, coating porosity at 80%, and lattice type as cubic. The same coating can have a varied number of cells depending on the lattice size (as discussed in Section 2.2.4). Cylinder 14 had 6 cells of 1 mm lattice and 0.33 mm lattice thickness, cylinder 15 had 4 cells of 1.5 mm lattice and 0.49 mm lattice thickness, cylinder 16 had 3 cells of 2 mm lattice and 0.65 mm lattice thickness, and cylinder 17 had 2 cells of 3 mm lattice cell size and 0.965 mm lattice thickness. These coatings can be seen in Figure 5.
Figure 18 shows that at positions close to the cylinder i.e., x/D = 1 and x/D = 2, cylinder 17 (2 cells) has slightly better performance as compared to cylinders with 4 or 6 cells in their coating. This is because cylinder 17 with only 2 cells in its coating has larger openings on the outer surface (due to larger lattice size) and lower hindrance for air to enter the porous coating and lose energy. While the porosity inside the coating is constant for all 4 cylinders, larger lattice size allows the air to enter the coating more easily. A coating with a very high number of cells can start behaving similar to a rigid coating due to increased obstruction to airflow. Closer to the cylinder, cylinder 17 gives 15–20% better turbulence reduction than cylinders with a higher number of cells. Further downstream at x/D = 3 and x/D = 4, all cylinders show similar turbulence intensities and the variation is quite negligible.
As seen in Figure 19, there is no clear deviation in mean wake velocity at different positions behind the cylinder. All 4 cylinders have similar levels and show that the number of cells is not a significant variable in coating design. Based on Figure 18 and Figure 19, although having a lower number of cells in a coating gives slightly better turbulence intensity close to the cylinder, overall, the cell count in coating thickness does not significantly affect the performance of a porous coating as long as the porosity and coating thickness is kept constant. This is an important finding as this can drive the design decisions for industrial components. In regards to previous experiment sets which encountered the problem of high lattice size to strut diameter ratio, and consequently elevated probability of print failures, this experiment set did not detect this complication due to constant porosity and a proportional increase in both the strut diameter and the lattice size. This was confirmed by their print quality, which was consistent with all coatings. However, the material utilization was not the same for all coatings. The coating with 2 cells required 22% and 18% more material volume than coating with 6 and 4 cells respectively.
Overall, the cell count in coating thickness is not a key governing design factor, and thus manufacturing and flow control optimization can focus on controlling the porosity and the coating thickness.
3.5. Set 5: Influence of Lattice Structure (Constant Porosity)
Cylinders used in experiment set 5 are shown in Table 5. Based on the results from experiment set 2 and set 4 which indicate that porosity plays a critical role in deciding the performance of a coating, this experiment set re-tests different lattice structures (as done in set 1). In contrast to set 1 where different lattice structures had variable porosity, this experiment set maintained constant porosity (at 80%) by varying lattice thickness but keeping the lattice cell size constant (at 2 mm). Coating thickness was also kept constant at 6 mm for all cylinders. This experiment set focused on whether the lattice geometry had an impact on performance when other variables are controlled.
In addition to lattices used in set 1, this set also included tet oct edge lattice type. Turbulence profiles in set 1 (seen in Figure 10) clearly show that various lattices result in different turbulence intensities based on their porosity. However, this was not the case in set 5. As porosity was set constant for all lattices, the turbulence profiles (seen in Figure 20) are similar for all lattices. This similarity is consistent across all x/D positions. On closer investigation of the turbulence profiles, it can be seen that the cubic coating has a slightly lower turbulence intensity than the other 3 coatings.
The reason for a slight variation for cubic coating is due to the open area of lattice cells on the surface of porous coatings (seen in Figure 21a,c). For a constant lattice size, the cubic coating has the simplest structure with no part of lattice inside the original lattice dimensions (i.e., lattice of (2) mm). However, the other lattice cells may have additional turbulence generation around the lattice struts. Despite the constant porosity that exists inside the porous coatings, the flow effects at a micro level due to lattice complexity may increases the airflow resistivity in the outermost coating layer. Figure 21b,d show that cubic lattice has an even and leveled outer surface whereas tet oct edge lattice has an irregular surface, which also contributes to marginally better performance for cubic coating. Similar surface irregularities also exist in the case of diamond cubic and Kelvin cell lattices that affect the flow field. Complex cell structures and surface irregularities result in a slight increase in the turbulence intensities for the tested coatings.
For velocity profiles shown in Figure 22, the results are similar to Figure 20, and no notable difference in the mean velocity levels is seen for different lattice coatings. As previously mentioned, a cubic cell’s unsupported geometry can suffer deformation during MSLA manufacturing. This makes the results of this experiment as an important finding. For instance, Kelvin cell coating can be better suited for additive manufacturing as its geometry is known to be an ideal foam structure because it provides the lowest surface area. It is also well adapted to lying against a flat surface [35]. As the variation in turbulence and wake velocity for different geometries is negligible, the lattice type for industrial applications should be chosen based on other factors such as manufacturing ease, ability to handle different types of loading, aesthetics of the part/component, material utilization, etc.
3.6. Set 6: Influence of Coating Geometry
Cylinders used in experiment set 6 are shown in Table 6. Changing the shape of the porous coating can lead to a change in the flow field around the cylinder. The purpose of this experiment set was to find whether it is possible to partially cover a cylinder with a porous coating, and still achieve the same turbulence intensity reduction as provided by a full coating. Different coating shapes tested in this experiment were spaced coating and a helical coating (seen in Figure 6).
All 3 cylinders used in this experiment had porous coatings of cubic lattice, constant lattice cell size of 2 mm, lattice thickness of 0.45 mm, coating thickness of 6 mm, and porosity of 80%.
‘Rigid start’ and ‘porous start’ in Figure 23 and Figure 25 refer to cases when the hotwire probe moves behind the rigid part and the porous part of the partially coated cylinder, respectively, at various x/D positions. This can be seen in Figure 24.
Figure 23 shows that directly behind the cylinder at x/D = 1, a full coating provides nearly 35% more reduction in turbulence intensity as compared to the spaced coating. Individual discs in the spaced coating act as separate cylindrical coatings and generate a wake of their own. As the flow moves past these discs, those individual wakes create a high turbulence intensity inter-mixing zone and merge to form the primary wake, thus resulting in higher turbulence intensity than full coating. The peak turbulence reaches similar levels at x/D = 2. However, in the case of x/D = 3 and x/D = 4, the performance of the coatings inverts and the spaced coating produces a lower turbulence intensity than a full coating. Spaced coating gives 15% and 5% better reduction at x/D = 3 and x/D = 4, respectively, as compared to a full coating.
Figure 25 shows equivalent results for the helical coating. At x/D = 1, the full coating gives a better reduction in turbulence intensity than the helical coating. Asymmetric peaks in the profiles of the helical coating are due to the twisted design. At an x/D vertical profile in the wake of a helical coating, the probe moves in front of both the rigid and porous parts of the cylinder. If the leeward and bottom parts of the cylinder are rigid, then the top and windward parts will have a porous coating and vice versa. This can be seen in Figure 26. Similar to spaced coating, the helical coating also reaches similar turbulence levels to that of a full coating at x/D = 2. The effect of the twisted design of the helical coating decreases at positions far away from the cylinder, and result in more symmetric turbulence profile. At x/D = 3, the helical coating gives 10–15% better turbulence intensity reduction than a full coating.
As per Figure 23 and Figure 25, a full coating performs better at positions closer to the cylinder. However, further away from the cylinder, spaced and helical coatings give a better reduction in turbulence intensities. It should be noted that across all x/D positions combined, the maximum turbulence intensity for a full coating (about 20%) is higher than that of a spaced or helical coating. Away from the cylinder, the average turbulence in between the peaks for partial coatings is also lower by up to 47%. This indicates that a partially covered cylinder has the potential to provide the same (if not better) turbulence reduction than a fully covered cylinder. However, the figures also show that the wake width (representing the top and bottom flow separation regions) is larger for full coating, which will affect the dissipation rate. Therefore, further research is needed into the effectiveness of partial coatings for noise and drag reduction. If successful, it also comes with additional benefits. For porous coatings used in this experiment set, volume calculated were: Full coating: 4595.98 mm, helical coating: 2529.97 mm and spaced coating: 2419.29 mm. Therefore, the helical and spaced coating used 45% and 47.3% less material, respectively, than the full coating. For real-life applications of porous coating (especially aviation), where the porous coatings can be manufactured from high strength steel or titanium-steel alloys (density in a range of 4500–8500 kg/m), a significant reduction in material utilization and cost, along with better fuel economy and takeoff weight can be expected.
For partial coatings in this set, the print quality of helical coating surpassed the spaced coating. This was due to the design limitation in spaced coating, where each cylindrical disc was an unsupported structure. Thus, initial porous layers for each disc tended to collapse and at times, deform the whole disc.
4. Conclusions
This study experimentally investigated the suitability of MSLA 3D printers to manufacture porous coatings, various control parameters impacting the performance of porous coatings, and identified best performing porous lattices for flow control. The main findings of this study are:
- Porous coatings with controlled parameters can be successfully designed from a unit cell definition and manufactured with low cost additive manufacturing technologies.
- Self-supporting lattices are less prone to print failures. Thus, Kelvin cell coatings and helical coatings are easier to manufacture than cubic coatings and spaced coatings, respectively.
- Lattices with a high ratio of lattice size to lattice thickness are more prone to print failures. Therefore, lower porosity coatings are generally easier to manufacture.
- Cell structures with higher porosity (i.e., lower airflow resistivity) result in lower turbulence intensities. For instance, a thin cubic lattice coating ( = 78.96%) gave up to 30% greater reduction in turbulence than a rigid cylinder, while kelvin cell coating ( = 53.78%) gave no improvement.
- High porosity coatings ( 90%) give a notable reduction in turbulence and mean wake velocity. A coating with 95% porosity gave a nearly 70% reduction in turbulence than a rigid cylinder. Low porosity coatings behave as rigid cylinders and do not provide turbulence reduction.
- Wake width decreases with an increase in coating porosity.
- Coating thickness h/D does not have a linear relationship with turbulence intensity reduction. Instead, there is an optimal thickness at which the turbulence is minimum. Best results were obtained at h/D = 0.65 but, h/D = 0.45 gave just slightly higher turbulence than h/D = 0.65 while providing benefits of reduced mass and cost.
- Cell count in coating thickness does not have a major impact on turbulence and mean wake velocity as long as the porosity is constant. Slight variation exists due to the amount of open area on the outermost coating surface.
- In case of constant porosity, different cell structures give similar turbulence intensity and mean wake velocity. The slight variation is usually due to complexity of cell structures, surface irregularities, and airflow resistance in the outermost coating layer.
- Partial coatings like spaced and helix can provide either equal or better turbulence intensity reduction than a full coating (except at positions very close to the cylinder). They also allow considerable reduction in material utilization.
Author Contributions
P.B.: Conceptualization, Methodology, Software, Validation, Formal analysis, Investigation, Writing—Original Draft, Project administration. J.K.: Conceptualization, Validation, Resources, Writing—Review & Editing, Supervision, Project administration, Funding acquisition. All authors have read and agreed to the published version of the manuscript.
Funding
This research received no external funding.
Acknowledgments
The authors would like to acknowledge the support of nTopology through their Element software platform (https://ntopology.com/).
Conflicts of Interest
The authors declare that they have no known competing financial interests or personal relationships that could have appeared to influence the work reported in this paper.
Abbreviations
The following abbreviations are used in this manuscript:
| MSLA | Mask Stereolithography |
| WHO | World Health Organization |
| CAD | Computer-Aided Design |
| LCD | Liquid Crystal Display |
| UV | Ultraviolet |
| LED | Light Emitting Diode |
References
- Nitschke, M.; Tucker, G.; Simon, D.L.; Hansen, A.L.; Pisaniello, D.L. The link between noise perception and quality of life in South Australia. In Noise and Health; Medknow Publications and Media Pvt. Ltd.: Mumbai, India, 2014; Volume 16. [Google Scholar] [CrossRef]
- Seidman, M.D.; Standring, R.T. Noise and Quality of Life. Int. J. Environ. Res. Public Health 2010, 7, 3730–3738. [Google Scholar] [CrossRef] [PubMed] [Green Version]
- World Health Organization. Environmental Noise Guidelines for the European Region; Technical Report; WHO: København, Denmark, 2018. [Google Scholar]
- Curle, N.; Lighthill, M.J. The influence of solid boundaries upon aerodynamic sound. Proc. R. Soc. Lond. Ser. A Math. Phys. Sci. 1955, 231, 505–514. [Google Scholar] [CrossRef]
- Lighthill, M.J.; Newman, M.H.A. On sound generated aerodynamically I. General theory. Proc. R. Soc. Lond. Ser. A Math. Phys. Sci. 1952, 211, 564–587. [Google Scholar] [CrossRef]
- Sueki, T.; Takaishi, T.; Ikeda, M.; Arai, N. Application of porous material to reduce aerodynamic sound from bluff bodies. Fluid Dyn. Res. 2010, 42, 015004. [Google Scholar] [CrossRef]
- Cao, L.; Fu, Q.; Si, Y.; Ding, B.; Yu, J. Porous materials for sound absorption. Compos. Commun. 2018, 10, 25–35. [Google Scholar] [CrossRef]
- Klausmann, K.; Ruck, B. Drag reduction of circular cylinders by porous coating on the leeward side. J. Fluid Mech. 2017, 813, 382–411. [Google Scholar] [CrossRef]
- Paduano, C.; Meskell, C. Numerical Investigation of Reynolds Number Effect on Lock in Ability of an Aeroacoustic Field in Ducted Flows. In Proceedings of the 18th AIAA/CEAS Aeroacoustics Conference (33rd AIAA Aeroacoustics Conference), Colorado Springs, CO, USA, 4–6 June 2012. [Google Scholar] [CrossRef]
- Shih, C. Turbulent Wake Flow Behind Circular Cylinder. Available online: http://www.eng.fsu.edu/~shih/succeed/cylinder/cylinder.htm (accessed on 29 September 2019).
- Braza, M.; Chassaing, P.; Minh, H.H. Numerical study and physical analysis of the pressure and velocity fields in the near wake of a circular cylinder. J. Fluid Mech. 1986, 165, 79–130. [Google Scholar] [CrossRef]
- Geyer, T.F.; Sarradj, E.; Herold, G. Flow Noise Generation of Cylinders with Soft Porous Cover. In Proceedings of the 21st AIAA/CEAS Aeroacoustics Conference, Dallas, TX, USA, 22–26 June 2015. [Google Scholar] [CrossRef]
- Lienhard, J.H. Synopsis of Lift, Drag, and Vortex Frequency Data for Rigid Circular Cylinders; Technical Extension Service; Washington State University: Pullman, WA, USA, 1966. [Google Scholar]
- Arcondoulis, E.J.G.; Liu, Y.; Li, Z.; Yang, Y.; Wang, Y. Structured Porous Material Design for Passive Flow and Noise Control of Cylinders in Uniform Flow. Materials 2019, 12, 2905. [Google Scholar] [CrossRef]
- Bhattacharyya, S.; Dhinakaran, S.; Khalili, A. Fluid motion around and through a porous cylinder. Chem. Eng. Sci. 2006, 61, 4451–4461. [Google Scholar] [CrossRef]
- Liu, H.; Azarpeyvand, M.; Wei, J.; Qu, Z. Tandem cylinder aerodynamic sound control using porous coating. J. Sound Vib. 2015, 334, 190–201. [Google Scholar] [CrossRef] [Green Version]
- Bruneau, C.H.; Mortazavi, I. Passive control of the flow around a square cylinder using porous media. Int. J. Numer. Methods Fluids 2004, 46, 415–433. [Google Scholar] [CrossRef]
- Nishimura, M.; Kudo, T.; Nishioka, M. Aerodynamic noise reducing techniques by using pile-fabrics. In Proceedings of the 5th AIAA/CEAS Aeroacoustics Conference and Exhibit, Bellview, WA, USA, 10–12 May 1999. [Google Scholar] [CrossRef]
- Yahathugoda, I.; Akishita, S. Experimental Investigation on Surface Impedance Effect of Sound Radiation from Low Mach Number Flow around a Circular Cylinder. JSME Int. J. Ser. B Fluids Therm. Eng. 2005, 48, 342–349. [Google Scholar] [CrossRef]
- Liu, H.; Wei, J.; Qu, Z. Prediction of aerodynamic noise reduction by using open-cell metal foam. J. Sound Vib. 2012, 331, 1483–1497. [Google Scholar] [CrossRef]
- Price, P. Suppression of the Fluid-Induced Vibration of Circular Cylinders. J. Eng. Mech. Div. 1956, 82, 1–22. [Google Scholar]
- Wong, H.Y. A means of controlling bluff body flow separation. J. Wind Eng. Ind. Aerodyn. 1979, 4, 183–201. [Google Scholar] [CrossRef]
- Naito, H.; Fukagata, K. Numerical simulation of flow around a circular cylinder having porous surface. Phys. Fluids 2012, 24, 117102. [Google Scholar] [CrossRef]
- Bani-Hani, E.H.; Khanafer, K.; Lopez, J.; Mohanan, G. Experimental Study on the Air Flow Past a Vertical Circular Cylinder Coated with a Porous Material. Spec. Top. Rev. Porous Media Int. J. 2019, 10. [Google Scholar] [CrossRef]
- Zhao, K.; Okolo, P.N.; Kennedy, J.; Bennett, G.J. 2D PIV measurement on the interaction zone between two parallel planar jets in a crossflow. AIP Adv. 2017, 7, 105104. [Google Scholar] [CrossRef] [Green Version]
- Zhao, K.; Alimohammadi, S.; Okolo, P.N.; Kennedy, J.; Bennett, G.J. Aerodynamic noise reduction using dual-jet planar air curtains. J. Sound Vib. 2018, 432, 192–212. [Google Scholar] [CrossRef]
- Zhao, K.; Okolo, P.N.; Wang, Y.; Kennedy, J.; Bennett, G.J. An Experimental Characterization of the Interaction Between Two Tandem Planar Jets in a Crossflow. J. Fluids Eng. 2018, 140. [Google Scholar] [CrossRef]
- Anycubic. Photon. Available online: https://www.anycubic.com/products/anycubic-photon-3d-printer (accessed on 22 March 2020).
- Anycubic. Anycubic Photon Slicer—A Simple Guide. Available online: https://all3dp.com/2/anycubic-photon-slicer-all-you-need-to-know/ (accessed on 22 March 2020).
- Research, P. Original Prusa SL1 3D Printer. Available online: https://shop.prusa3d.com/en/3d-printers/717-original-prusa-sl1.html (accessed on 22 March 2020).
- Braza, M.; Perrin, R.; Hoarau, Y. Turbulence properties in the cylinder wake at high Reynolds numbers. J. Fluids Struct. 2006, 22, 757–771. [Google Scholar] [CrossRef] [Green Version]
- Lim, H.C.; Lee, S.J. PIV measurements of near wake behind a U-grooved cylinder. J. Fluids Struct. 2003, 18, 119–130. [Google Scholar] [CrossRef]
- Gao, Y.; Yang, K.; Ren, X.; Zhang, B.; Tan, S.K. Flow behavior behind a clockwise-and-counterclockwise rotational oscillating cylinder. Ocean. Eng. 2018, 159, 410–421. [Google Scholar] [CrossRef]
- Groh, R. Boundary Layer Separation and Pressure Drag. Available online: https://aerospaceengineeringblog.com/boundary-layer-separation-and-pressure-drag/ (accessed on 21 May 2020).
- Weaire, D. Kelvin’s foam structure: A commentary. Philos. Mag. Lett. 2008, 88, 91–102. [Google Scholar] [CrossRef]
Figure 1.
Schematic of experiment set up. Rig was made out of aluminium beams to withstand the force from wind tunnel and hold the porous coated cylinder.
Figure 1.
Schematic of experiment set up. Rig was made out of aluminium beams to withstand the force from wind tunnel and hold the porous coated cylinder.

Figure 2.
Process of design and manufacturing a porous coating.

Figure 3.
(a) Cubic cell; (b) diamond cubic cell of lattice size = (1.5)3 mm3 and lattice thickness = 0.5 mm.
Figure 3.
(a) Cubic cell; (b) diamond cubic cell of lattice size = (1.5)3 mm3 and lattice thickness = 0.5 mm.

Figure 4.
Porous coatings with constant lattice size and variable porosity.

Figure 5.
Porous coatings with constant porosity and variable number of cells.

Figure 6.
Design of (a) spaced, (b) helical, (c) full coating in element software.

Figure 7.
Thickened cubic cell entering neighbour cells.

Figure 8.
(a) Untrimmed cell; (b) trimmed cell.

Figure 9.
Probe movement path behind the cylinder.

Figure 10.
Turbulence intensity graph for cylinders 1–4.

Figure 11.
Turbulence intensity graph for cylinders 5–8.

Figure 12.
Turbulence intensity graph for cylinders 1 and 5.

Figure 13.
Velocity profiles for cylinders 1 and 5.

Figure 14.
Turbulence intensity graph for cylinders 1, 5, 9, and 10.

Figure 15.
Turbulence intensity graph for cylinder 1 and 11–13.

Figure 16.
Contour plot of turbulence intensity for cylinders 1, 10, and 12.

Figure 17.
Turbulence intensity vs coating thickness trend for single cylinder.

Figure 18.
Turbulence intensity graph for cylinders 14–17.

Figure 19.
Velocity profiles for cylinders 14–17.

Figure 20.
Turbulence intensity graph for cylinders 16 and 18–20.

Figure 21.
(a) Cubic cell; (b) cubic lattice; (c) tet oct edge cell; (d) tet oct edge lattice.

Figure 22.
Velocity profiles for cylinder 16 and 18–20.

Figure 23.
Turbulence intensity graph for cylinders 21 and 23.

Figure 24.
Probe movement behind the cylinder for spaced and helical coatings.

Figure 25.
Turbulence intensity graph for cylinders 22 and 23.

Figure 26.
Porous and rigid part in the same vertical profile due to twisted design of the helical coating.
Figure 26.
Porous and rigid part in the same vertical profile due to twisted design of the helical coating.


Table 1.
Cylinders for experiment set 1.
| Set 1 | Lattice Structure (Variable Porosity) |
|---|---|
| Cylinder 1 | Rigid |
| Cylinder 2 | Cubic coating |
| Cylinder 3 | Diamond cubic coating |
| Cylinder 4 | Kelvin cell coating |
| Constant h/D, lattice size, lattice thickness | |
| Variable porosity, lattice type | |
Table 2.
Cylinders for experiment set 2.
| Set 2 | Porosity |
|---|---|
| Cylinder 1 | Rigid |
| Cylinder 5 | 95% porosity |
| Cylinder 6 | 90% porosity |
| Cylinder 7 | 85% porosity |
| Cylinder 8 | 80% porosity |
| Constant lattice type, lattice size, h/D | |
| Variable porosity, lattice thickness | |
Table 3.
Cylinders for experiment set 3.
| Set 3 | (h/D) Coating Thickness |
|---|---|
| Cylinder 1 | 0.00 |
| Cylinder 5 | 0.267 |
| Cylinder 9 | 0.35 |
| Cylinder 10 | 0.45 |
| Cylinder 11 | 0.55 |
| Cylinder 12 | 0.65 |
| Cylinder 13 | 0.75 |
| Constant porosity, lattice thickness, | |
| lattice size, lattice type | |
| Variable h/D | |
Table 4.
Cylinders for experiment set 4.
| Set 4 | Cell Count in Coating Thickness |
|---|---|
| Cylinder 14 | 6 cells |
| Cylinder 15 | 4 cells |
| Cylinder 16 | 3 cells |
| Cylinder 17 | 2 cells |
| Constant porosity, h/D, lattice type | |
| Variable lattice size, lattice thickness | |
Table 5.
Cylinders for experiment set 5.
| Set 5 | Lattice Structure (Constant Porosity) |
|---|---|
| Cylinder 16 | Cubic coating |
| Cylinder 18 | Diamond cubic coating |
| Cylinder 19 | Kelvin cell coating |
| Cylinder 20 | Tet oct edge coating |
| Constant porosity, h/D, lattice size | |
| Variable lattice thickness, lattice type | |
Table 6.
Cylinders for experiment set 6.
| Set 6 | Coating Geometry |
|---|---|
| Cylinder 21 | Spaced coating |
| Cylinder 22 | Helical coating |
| Cylinder 23 | Full coating |
| Constant h/D, lattice size, | |
| lattice thickness, porosity, lattice type | |
| Variable coating shape | |
© 2020 by the authors. Licensee MDPI, Basel, Switzerland. This article is an open access article distributed under the terms and conditions of the Creative Commons Attribution (CC BY) license (http://creativecommons.org/licenses/by/4.0/).
Share and Cite
MDPI and ACS Style
Bathla, P.; Kennedy, J. 3D Printed Structured Porous Treatments for Flow Control around a Circular Cylinder. Fluids 2020, 5, 136. https://doi.org/10.3390/fluids5030136
AMA Style
Bathla P, Kennedy J. 3D Printed Structured Porous Treatments for Flow Control around a Circular Cylinder. Fluids. 2020; 5(3):136. https://doi.org/10.3390/fluids5030136
Chicago/Turabian StyleBathla, Pranjal, and John Kennedy. 2020. "3D Printed Structured Porous Treatments for Flow Control around a Circular Cylinder" Fluids 5, no. 3: 136. https://doi.org/10.3390/fluids5030136