
Neural Network-Based Model Reduction of Hydrodynamics Forces on an Airfoil


1
Center for Advanced Studies in Pure and Applied Mathematics (CASPAM), Bahauddin Zakariya University (BZU), Multan 60800, Pakistan
2
Department of Mechanical Engineering, NUST College of Electrical & Mechanical Engineering, National University of Sciences & Technology, Islamabad 44000, Pakistan
*
Author to whom correspondence should be addressed.
†
Both authors are the main contributors under the supervision of the other authors.
Fluids 2021, 6(9), 332; https://doi.org/10.3390/fluids6090332
Submission received: 29 June 2021
/
Revised: 19 August 2021
/
Accepted: 23 August 2021
/
Published: 15 September 2021
(This article belongs to the Special Issue Reduced Order Models for Computational Fluid Dynamics)
Abstract
:In this paper, an artificial neural network (ANN)-based reduced order model (ROM) is developed for the hydrodynamics forces on an airfoil immersed in the flow field at different angles of attack. The proper orthogonal decomposition (POD) of the flow field data is employed to obtain pressure modes and the temporal coefficients. These temporal pressure coefficients are used to train the ANN using data from three different angles of attack. The trained network then takes the value of angle of attack (AOA) and past POD coefficients as an input and predicts the future temporal coefficients. We also decompose the surface pressure modes into lift and drag components. These surface pressure modes are then employed to calculate the pressure component of lift and drag coefficients. The train model is then tested on the in-sample data and out-of-sample data. The results show good agreement with the true numerical data, thus validating the neural network based model.
1. Introduction
Airfoils are cross sectional curved surfaces which give required ratio of hydrodynamic forces (i.e., lift and drag). Flow separation is an active area of research in airfoils due to stall phenomenon when the angle of attack goes beyond a certain limit. In response, there is vivid decrease in the hydrodynamic forces (i.e., lift and drag) [1,2], so there is a need to control flow separation.
Computational fluid dynamics (CFD) is widely used for numerical solution of complex, nonlinear, and transient flows to study the flow separation phenomenon. To further develop flow control strategies, reduced-order models (ROM) are often developed. Proper orthogonal decomposition (POD) [3] is mostly used to project these transient flows on the low dimensional subspace where these flows behave linearly. POD was first used for reduced-order modeling of turbulence by projecting the Navier–Stokes equations onto the low dimensional space [4]. Different model reduction techniques have been developed in recent years to reduce the dimensionality of dataset, such as POD, dynamic mode decomposition (DMD) [5,6], and its variants [7,8,9], spectral proper orthogonal decomposition (SPOD) [10,11] and machine learning-based methods, such as autoencoders [12], etc. Taira et al. [13,14] did the detail review of such methods and techniques in their paper. POD/Galerkin models can work well but often require careful tuning to give satisfactory results. In addition, POD-based models representing complex (nonlinear) dynamics are known to be inaccurate for long-time integration [15], and different closure model strategies were employed in literature [15,16,17,18,19,20] which were aimed at modeling small-scale dynamics. In addition, if DMD is used for system identification, it results in a linear system [13,14]. For nonlinear systems, the Koopman operator, its eigenfunctions, and corresponding Koopman modes may be computed using a version of DMD [7,8,9,21]. These eigenfunctions can then be used to determine coordinates [22,23], in which the system is linear, and the resulting Koopman modes may be used to understand coherent structures that occur at a particular temporal frequency.
Reduced order models are broadly used for modeling of fluid systems [14] as they reduce the CPU time to achieve the desired results and preserve the physics of interest. There are mainly three approaches which are used to develop reduce order models: (a) The first is Phenomenon-based [24,25]. (b) The second is Direct approach, which is the intrusive way of modeling the fluid systems. This approach is dependent on the source code of the governing equations. POD-Galerkin-based models suffer from instability and efficiency issues [15,18,19,26,27,28,29,30]. Other intrusive models which show promising results can be seen in references [31,32,33,34]. (c) The third is Non-intrusive ROM which do not require modification of the source code rather these are purely data-driven. Xiao et al. presented such reduced order models for Navier–Stokes equations [30,35]. Machine learning has also been explored to infer POD coefficients in non-intrusive parametric ROMs which can be seen in references [36,37,38,39]. San and Maulik [40], San et al. [41] used artificial neural networks (ANN) to predict the temporal coefficients of POD in non-intrusive way. Wang et al. [42] used long-short term memory networks (LSTM) to predict the future time steps of POD coefficients. ANN and LSTM have also been explored for developing the closure for truncated POD modes [40,43]. Murata et al. [44], Fukami et al. [45] used convolutional neural networks (CNN) for data compression and reconstruction of high dimensional flow fields. These models require a large amount of data for training, which also increases the computational expense [44,45,46,47,48,49].
Nonetheless, most ROM based on POD employs velocity field information for modeling [41,50], whereas pressure specifically on the surface also plays an important role in the accuracy of POD-based ROMs [51]. Many studies have been done on the ROM based on pressure mode decomposition (PMD) that also enables accurate reproduction of lift and drag forces (hydrodynamic forces) [15,52].
To understand the flow physics over an airfoil under unsteady motion, it is better to have a fundamental knowledge of physics under steady conditions. Flows at a low Reynolds number over the static airfoil at different angles of attack can also be used to understand the flapping phenomenon [53]. In this study, we simulate the flow past a NACA-0012 airfoil at Re = 1000 at different angles of attack (AOA = 10°, 15°, 20°). Since the pressure plays an important role in the development of the hydrodynamic forces [15,52] and the wake of the vortex street behind the structure, we numerically calculate the pressure field in the present study. We then perform the POD analysis and investigate the pressure distribution over NACA0012 airfoil. Using these surface POD modes, we calculate the hydrodynamic forces. In literature, many researchers used “National Advisory Committee for Aeronautics (NACA)” airfoils for investigation of aerodynamic/hydrodynamic forces. For the validation purpose of our DNS technique, we also considered the NACA 0012. However, the proposed neural network model depends on the input data which are the POD temporal coefficients but not on the airfoil shape. The same neural network setting can be employed to the data of other NACA airfoils.
The procedure to perform the pressure mode decomposition (PMD) analysis consists of the following steps: First, the direct numerical simulation (DNS) of the incompressible flow field data over the airfoil is calculated for a long enough duration to mitigate the effects of the transient phase. Second, the snapshots of the pressure field at different time steps are assembled in a matrix that characterizes the coherent structures in the flow field. Third, the finite numbers of dominant modes or eigenfunctions, that optimally spanned the low-dimensional solution space of the pressure field, are extracted on the airfoil surface and decomposed into lift and drag components.
2. Computational Methodology
2.1. Governing Equations
The flow under consideration is a two-dimensional incompressible unsteady flow over NACA0012 airfoil at different AOA in the flow field. The governing equations include the continuity and momentum (Navier–Stokes) equations. The two-dimensional nondimensional form of these governing equations are shown in Equations (1) and (2), as follows:
where the , p, and represent the Cartesian components of velocity, pressure, and density of the fluid, respectively. We use the length of the foil, denoted as c, and uniform velocity, labeled as , as the reference scales for the length and velocity, respectively, in order to define the Reynolds number (), where is dynamic viscosity of the fluid.
In this study, we used a non-staggered O-type grid to simulate the flow around the airfoil, as shown in Figure 1 with the representation of inflow and outflow boundaries. All the state variables u,v,p are defined at the cell centers; however, the volume fluxes are defined at the midpoint of the corresponding faces. To handle the curved form of the physical domain, we transform Equations (1) and (2) from the Cartesian coordinate system into a curvilinear coordinate system to accurately handle curved grid lines. Consequently, these equations takes the following forms:
where the terms for fluxes and geometric matrices are defined as:
2.2. Discretization Scheme
A fractional step method is used by splitting the momentum equations into an advection-diffusion equations (by omitting the pressure term) and the pressure Poisson equation. The pressure Poisson equation is then obtained by taking the divergence of the momentum equations and subjected to satisfy the continuity equation. This splitting method leads to a three-step predictor-corrector method. First, the intermediate or predicted velocity field is computed by solving the advection-diffusion equations without satisfying the continuity equation. Secondly, the pressure Poisson equation is solved to determine the pressure field, which satisfies the continuity equation. Finally, the divergence-free velocity field is computed by correcting the predicted velocity field.
The differential operators involved in the governing equations are discretized using the finite-difference approximation. A second-order accurate centered difference scheme is employed to discretize all the spatial derivatives, except the convective terms. The convective terms are discretized using a variation of QUICK method [55]. The velocity variables are calculated at the faces from the nodal values using quadratic upwinding interpolation. The positive and negative fluxes and , respectively, are computed, and a generic stencil is used to perform upwinding of the QUICK method. For marching in time, a semi-implicit scheme is used in which the diagonal viscous terms are advanced using the second-order accurate Crank-Nicolson method, and all the other terms are advanced using the second-order accurate Adams-Bashforth method. The Adams-Bashforth scheme is chosen because of its computational efficiency when coupled with the fractional step method. This methodology is similar to that employed by Zang [56]. The only difference is that we employed the line successive over-relaxation (LSOR) scheme to solve the advection-diffusion equation and the bi-conjugate gradient stabilized (BiCGStab) method to solve the pressure Poisson equation.
2.3. Grid Generation
A two-dimensional orthogonal grid around the symmetric airfoil is generated using a body-fitted grid generation technique as proposed by Thompson et al. [57]. A finite-difference method is used to solve the system of coupled elliptic partial differential equations [54,57,58,59,60,61,62]. The governing equations for the generation of the two-dimensional orthogonal body-fitted grid, as used by Ryskin and Leal [54], are given by
where x and y are the coordinates in the physical plane, and are the coordinates in the transformed plane (see Figure 2), and f is the distortion function which is the ratio of scale factors in the -direction to that of the -direction, i.e.,
The scale factors are defined as follows:
A central-difference scheme at the interior points is employed to discretize the partial differential equations. All the scalar factors and the distortion function are calculated from the previous approximation of the solution, leading to a system of linear algebraic equations. The tri-diagonal matrix algorithm (TDMA), which is an iterative technique, is used to obtain the solution until the relative error of the distortion function converges to the desired accuracy [63].
3. Validation & Verification
3.1. Hydrodynamic Forces
The pressure and shear stresses are the two main stimuli through which a fluid exerts forces on a body immersed in it. These forces can be decomposed into lift and drag components. We use the free-stream dynamic pressure and the length of the foil to define the dimensionless lift and drag coefficients, which are expressed as:
where is the spanwise vorticity component. Note that the terms for shear stress in Equation (14) diminish as the Reynolds number increases; therefore, the pressure is considered as the main source in the development of and . Figure 3 shows the time histories of pressure and viscous shear stresses components of hydrodynamic forces lift and drag at AOA = 20°. It is noted that approximately 98% of the lift and 88% of the drag are generated because of the pressure forces.
3.2. Validation of the Numerical Simulation
To validate the solution methodology, NACA0012 airfoil subjected to the incompressible flow field at different angles of incidence is investigated at . A mesh of size is used in this study having 257 mesh points on the airfoil surface and 361 mesh points in the radial direction with an outer domain diameter of . We simulate the flow for long enough time to reach the steady-state solution. Figure 4 shows the time-averaged lift coefficient () distribution versus angle of attack () obtained in the present study, along with the results computed at the same Reynolds number by Kurtulus [64] for 0° < α ≤ 90°, Liu et al. [65] and Khalid and Akhtar [66] for α < 30°, Suzuki et al. [67] at α = 15°, HOARAU et al. [68] at α = 20°, and Mittal and Tezduyar [69] at α = 10°. The numerical results are in good agreement with the published data, hence validating the present simulations. The time histories of Cl and Cd at α = 20° are shown in Figure 5a, and the power spectrum of Cl is shown in Figure 5b, along with the results of Khalid and Akhtar [66]. The fast Fourier transformation (FFT) algorithm is used to calculate the amplitude spectrum for the lift coefficient. Figure 5b shows that the lift spectrum has a dominant peak at fs = 0.541, and it contains both the odd and even harmonics, which indicates the existence of a quadratic, as well as a cubic, nonlinearity in the system, as observed by Khalid and Akhtar [66].
4. Parallel Implementation
CFD of the fluid-structure problems on large mesh sizes generally involves several million degrees of freedom within each time loop to simulate the unsteady flow behavior. The demand for high-order accuracy and dealing with complex geometries increases the computational workload. Therefore, to reduce the overall computational time, we employ parallel computing of the incompressible flow over the airfoils. In the parallel implementation, the problem domain is partitioned to allocate its regions to different processing units to reduce overall execution time. These processing units simultaneously compute the results on their assigned part of the domain. For inter-process communication among the processors, we utilize the Massage Passing Interface (MPI) library. In Figure 6, a computational domain decomposed in 8 processing units is shown. The different colors represent the part of the domain to be assigned to different processing units. For a detailed implementation of the parallel algorithm, the interested readers are referred to Reference [70].
5. Artificial Neural Network
In the current work, feed forward neural network has been employed to map the past time steps to future time steps. The inputs to the neural network are the POD temporal coefficients of the pressure and velocity fields of airfoils along with the angle of attack. The basic architecture used is shown in Figure 7. The inputs are then passed through two hidden layers, and each layer has 512 neurons followed by relu activation function. For simplicity, only five neurons are shown in Figure 7. Tensorflow [71] is used for the training of neural network, which minimizes the error between predicted and the target quantities of interest (i.e., temporal coefficients) to determine the best fit parameters (weights and biases). For optimization of neural network a stochastic optimization algorithm, Adam [72] was employed. Autokeras [73] was used to find the best possible ANN architecture (number of hidden layers and neurons), which uses the Bayesian Optimization [74]. Here, 370 time steps from each case of AOA = 10°, 15°, 20° have been used to train the network, and 80 time steps were set aside for the testing purpose. Time coefficients for the case of AOA = 12° are not used for the training, but these are predicted by trained ANN. After training, the network can be used as a function, which takes AOA and past time steps to predict the future time steps, as shown in Equation (16).
where is the input matrix that contains the temporal coefficients and angles of attack (AOA) values. It has one column per coefficient. The weight matrix contains all the weights, except for the ones from the bias neuron. The bias vector contains all the connection weights between the bias neuron and the artificial neurons. It has one bias term per artificial neuron. The function is called the activation function, which is ‘relu’ in this study.
6. Proper Orthogonal Decomposition (POD)
POD modes can be computed through either Singular Value Decomposition (SVD) or the method of snapshots [75,76]. In this study, we employ the latter technique since it is computationally inexpensive as compared to SVD for large mesh sizes used in high-fidelity simulations. The set , , , where S represents the number of snapshots of time discrete snapshots and is used as the input for POD of the state vector = over one time-period T of vortex shedding. The unknown, , is decomposed into its mean part, , and fluctuating part. Next, is expanded in terms of the linear combination of temporal coefficients, which need to be determined, and POD bases as:
where M represents the finite number of modes in the expansion, denotes POD-modes or simple modes of , and are temporal coefficients. Moreover, , where and are the u and v velocity modes, respectively, and are the pressure modes. In addition, we have = , where , , and are the temporal coefficients for u, v, and p, respectively.
The decomposition of the pressure field in terms of its mean and the fluctuating parts is carried out by:
The instantaneous solutions at time of U are stored in matrix P of size , where and N denotes the number of grid points. The objective is to seek a low dimensional basis that satisfies the following optimization problem.
subject to the condition of orthogonality, = , where is the Kronecker delta function, and is a real Hilbert space, such that . In order to solve Equation (19), we consider the following eigenvalue problem:
where for k = 1, 2,⋯, S are eigenvectors, are eigenvalues, and = is the correlation matrix that can be defined as:
For our present work, we utilize 50 snapshots of flow fields captured in one time-period () and assemble them in P. For a pressure field, the correlation matrix of the snapshots is defined as:
7. Results & Discussion
Using the pressure POD data, the surface mean pressure () and the surface pressure modes () are extracted from the pressure modes . Symbolically, the sine and cosine components of over the airfoil surface are, respectively, denoted by and , which contribute in the lift and drag coefficients, respectively. Likewise, the distribution of the mean pressure over the airfoil surface contributes to the mean lift and drag coefficients denoted by and , respectively.
7.1. Hydrodynamics Forces and Wake
In Figure 8a, instantaneous lift coefficient is shown at AOA = 10°, 15°, and 20°. The lift coefficient at AOA = 20° is relatively higher in magnitude but oscillating about its nonzero mean value with low frequency as compared to that of the other two cases. The power spectra of Cl of the simulated cases are shown in Figure 8b. A snapshot of vorticity pattern in the wake of the inclined airfoils is shown in Figure 9. The shear layer for the case AOA = 10° is close to the surface, while, for the cases 15° and AOA = 20°, the shear layer is clearly separated.
7.2. PMD Analysis
Figure 10a shows normalized eigenvalues () of pressure modes. The eigenvalues represent a measure of the weight corresponding to each pressure mode. In each case, the eigenvalues do not exhibit similarity, and there exists no significantly visible pairing structures for stronger pressure modes, as is usually observed in eigenvalues of velocity modes (not discussed here). Furthermore, the values of vary significantly (in the range of 40–90%) for different values of AOA, which are increasing with AOA. Most importantly, we find that the first four pressure modes constitute over 95% of the total contribution of the system (see Figure 10b). This observation demonstrates the effectiveness of the modal decomposition based on pressure data of flow fields around the airfoil.
We present the mean mode (Mode 0), defined as the average of the snapshots, in Figure 11 (left column), along with the data on the airfoil surface. The decomposition of in its sine and cosine components is also depicted. Here, we represent the upper and lower surfaces of the airfoil by chord length from 1 to 0 and 0 to 1, respectively. For plots in the right column of Figure 11, the represents the trailing edge, whereas 0 represents the leading edge of the airfoil. In each case, we observed higher pressure near the edges of the airfoil and its magnitude increases with AOA. The pressure distribution over the upper surface and near vicinity of the lower leading edge is the main source to the generation of mean lift coefficient, while the pressure at the edges of the airfoil contributes to the mean drag coefficient.
Similar to the mean mode, we plot the distribution of first four pressure modes, , and their decomposition into sine, and cosine, , components in Figure 12, since first four modes are enough to capture the physics of force on the airfoil surface. It can be seen that the pressure modes distribution near the vicinity of edges is dominant. The overall contribution of pressure modes into the lift and drag coefficients can be inferred by integrating the components and , respectively, over the airfoil surface.
7.3. Lift and Drag Models
The ROM for the lift and drag coefficients can be obtained by replacing the pressure term (p) in Equation (14) with the pressure modal expansion given in Equation (18) over the airfoil surface (). As mentioned earlier, the viscous contribution is neglected because of its insignificance at high Reynolds numbers. The resulting forms of the lift and drag decomposition models are given as:
where is the temporal coefficient for both lift and drag models, and M is the number of modes in the expansion. The terms and are scalars called lift decomposition coefficient (LDC) and drag decomposition coefficient (DDC), respectively, and contribute, respectively, to the lift and drag coefficients as the weight of the temporal coefficient. Thus, the decomposition models are independent of any spatial distribution, unlike in a typical POD-ROM framework. The LDC and DDC are defined as the integral of sine and cosine components of surface pressure modes:
here, the subscripts ∘ and k represent the decomposition of and , respectively.
The LDC and DDC of mean and the first ten modes of each simulated case are plotted in Figure 13. It can be seen that contribution of the mean mode is significant to the lift and drag, and its significance in terms of magnitude increased with AOA. Figure 13a,b show that mean plus first modes are enough to model the lift and drag coefficients of AOA = 10° using model (24b). In the case of AOA = 15°, the mean plus the first four modes are sufficient for lift and drag models, while, in the case of AOA = 20°, as we can infer from Figure 13c,d, the LDC and DDC of first eight modes are significant, which would contribute to lift and drag models.
7.4. ANN-Based ROM Using PMD
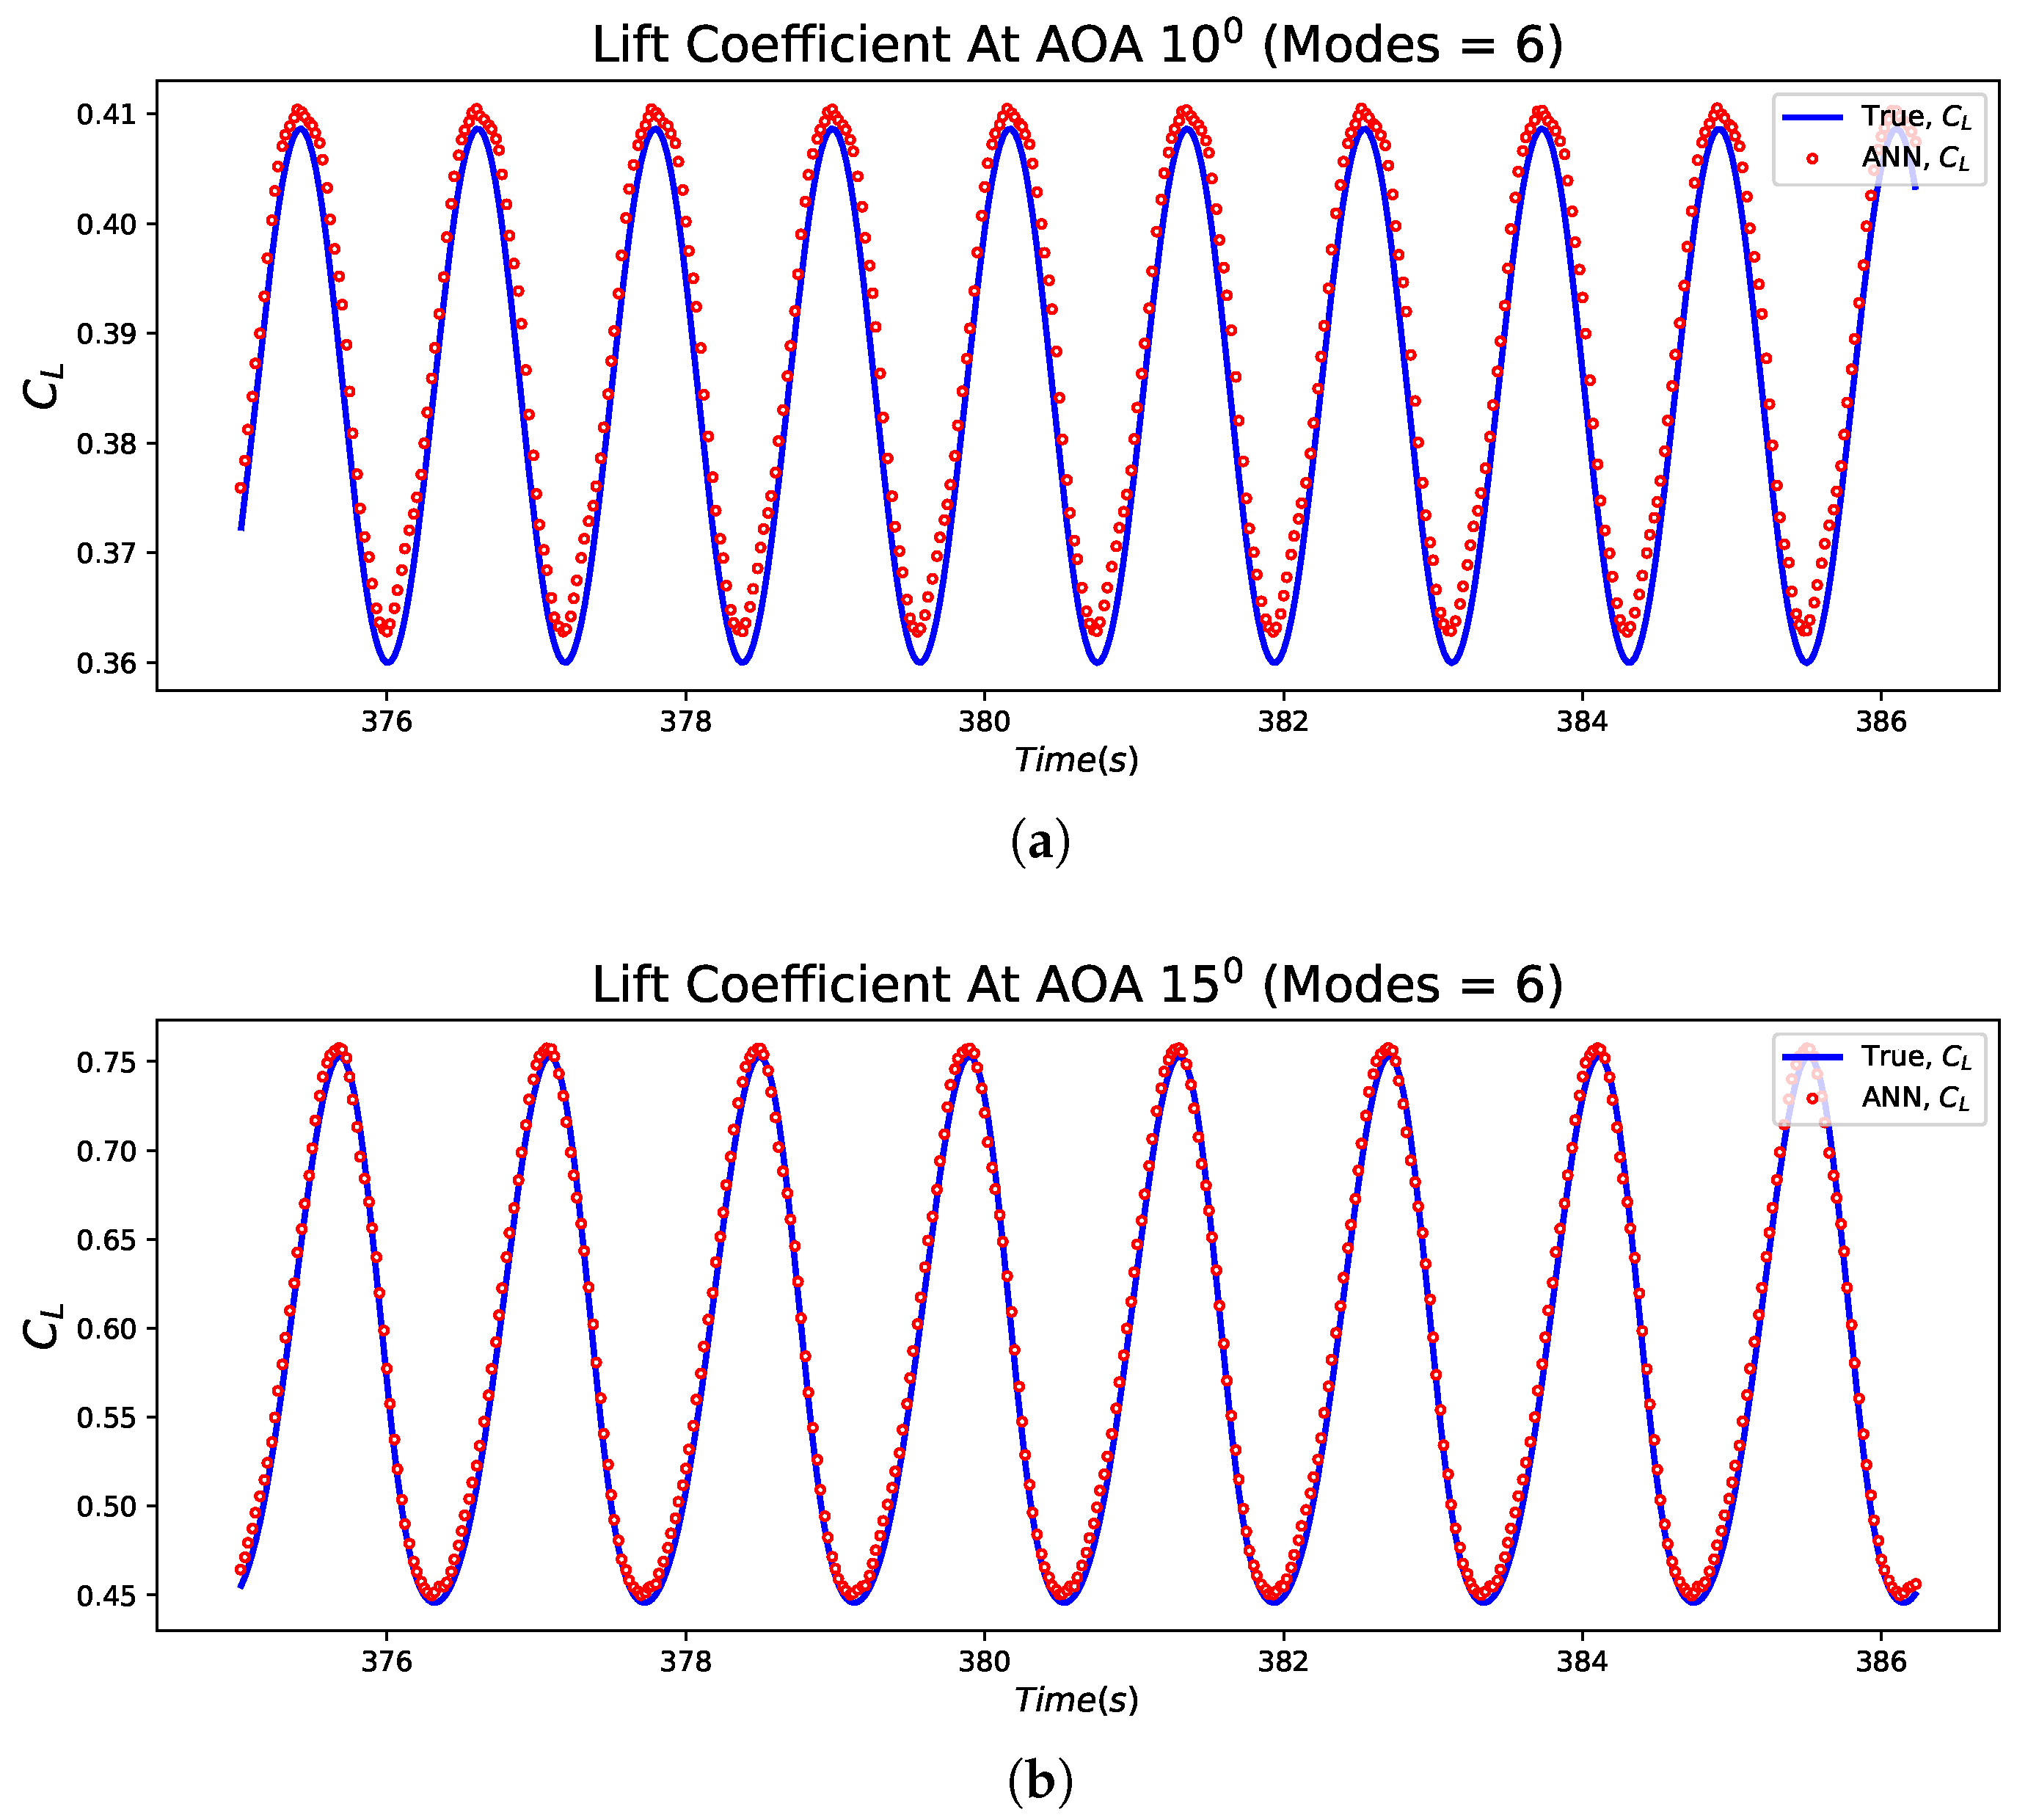
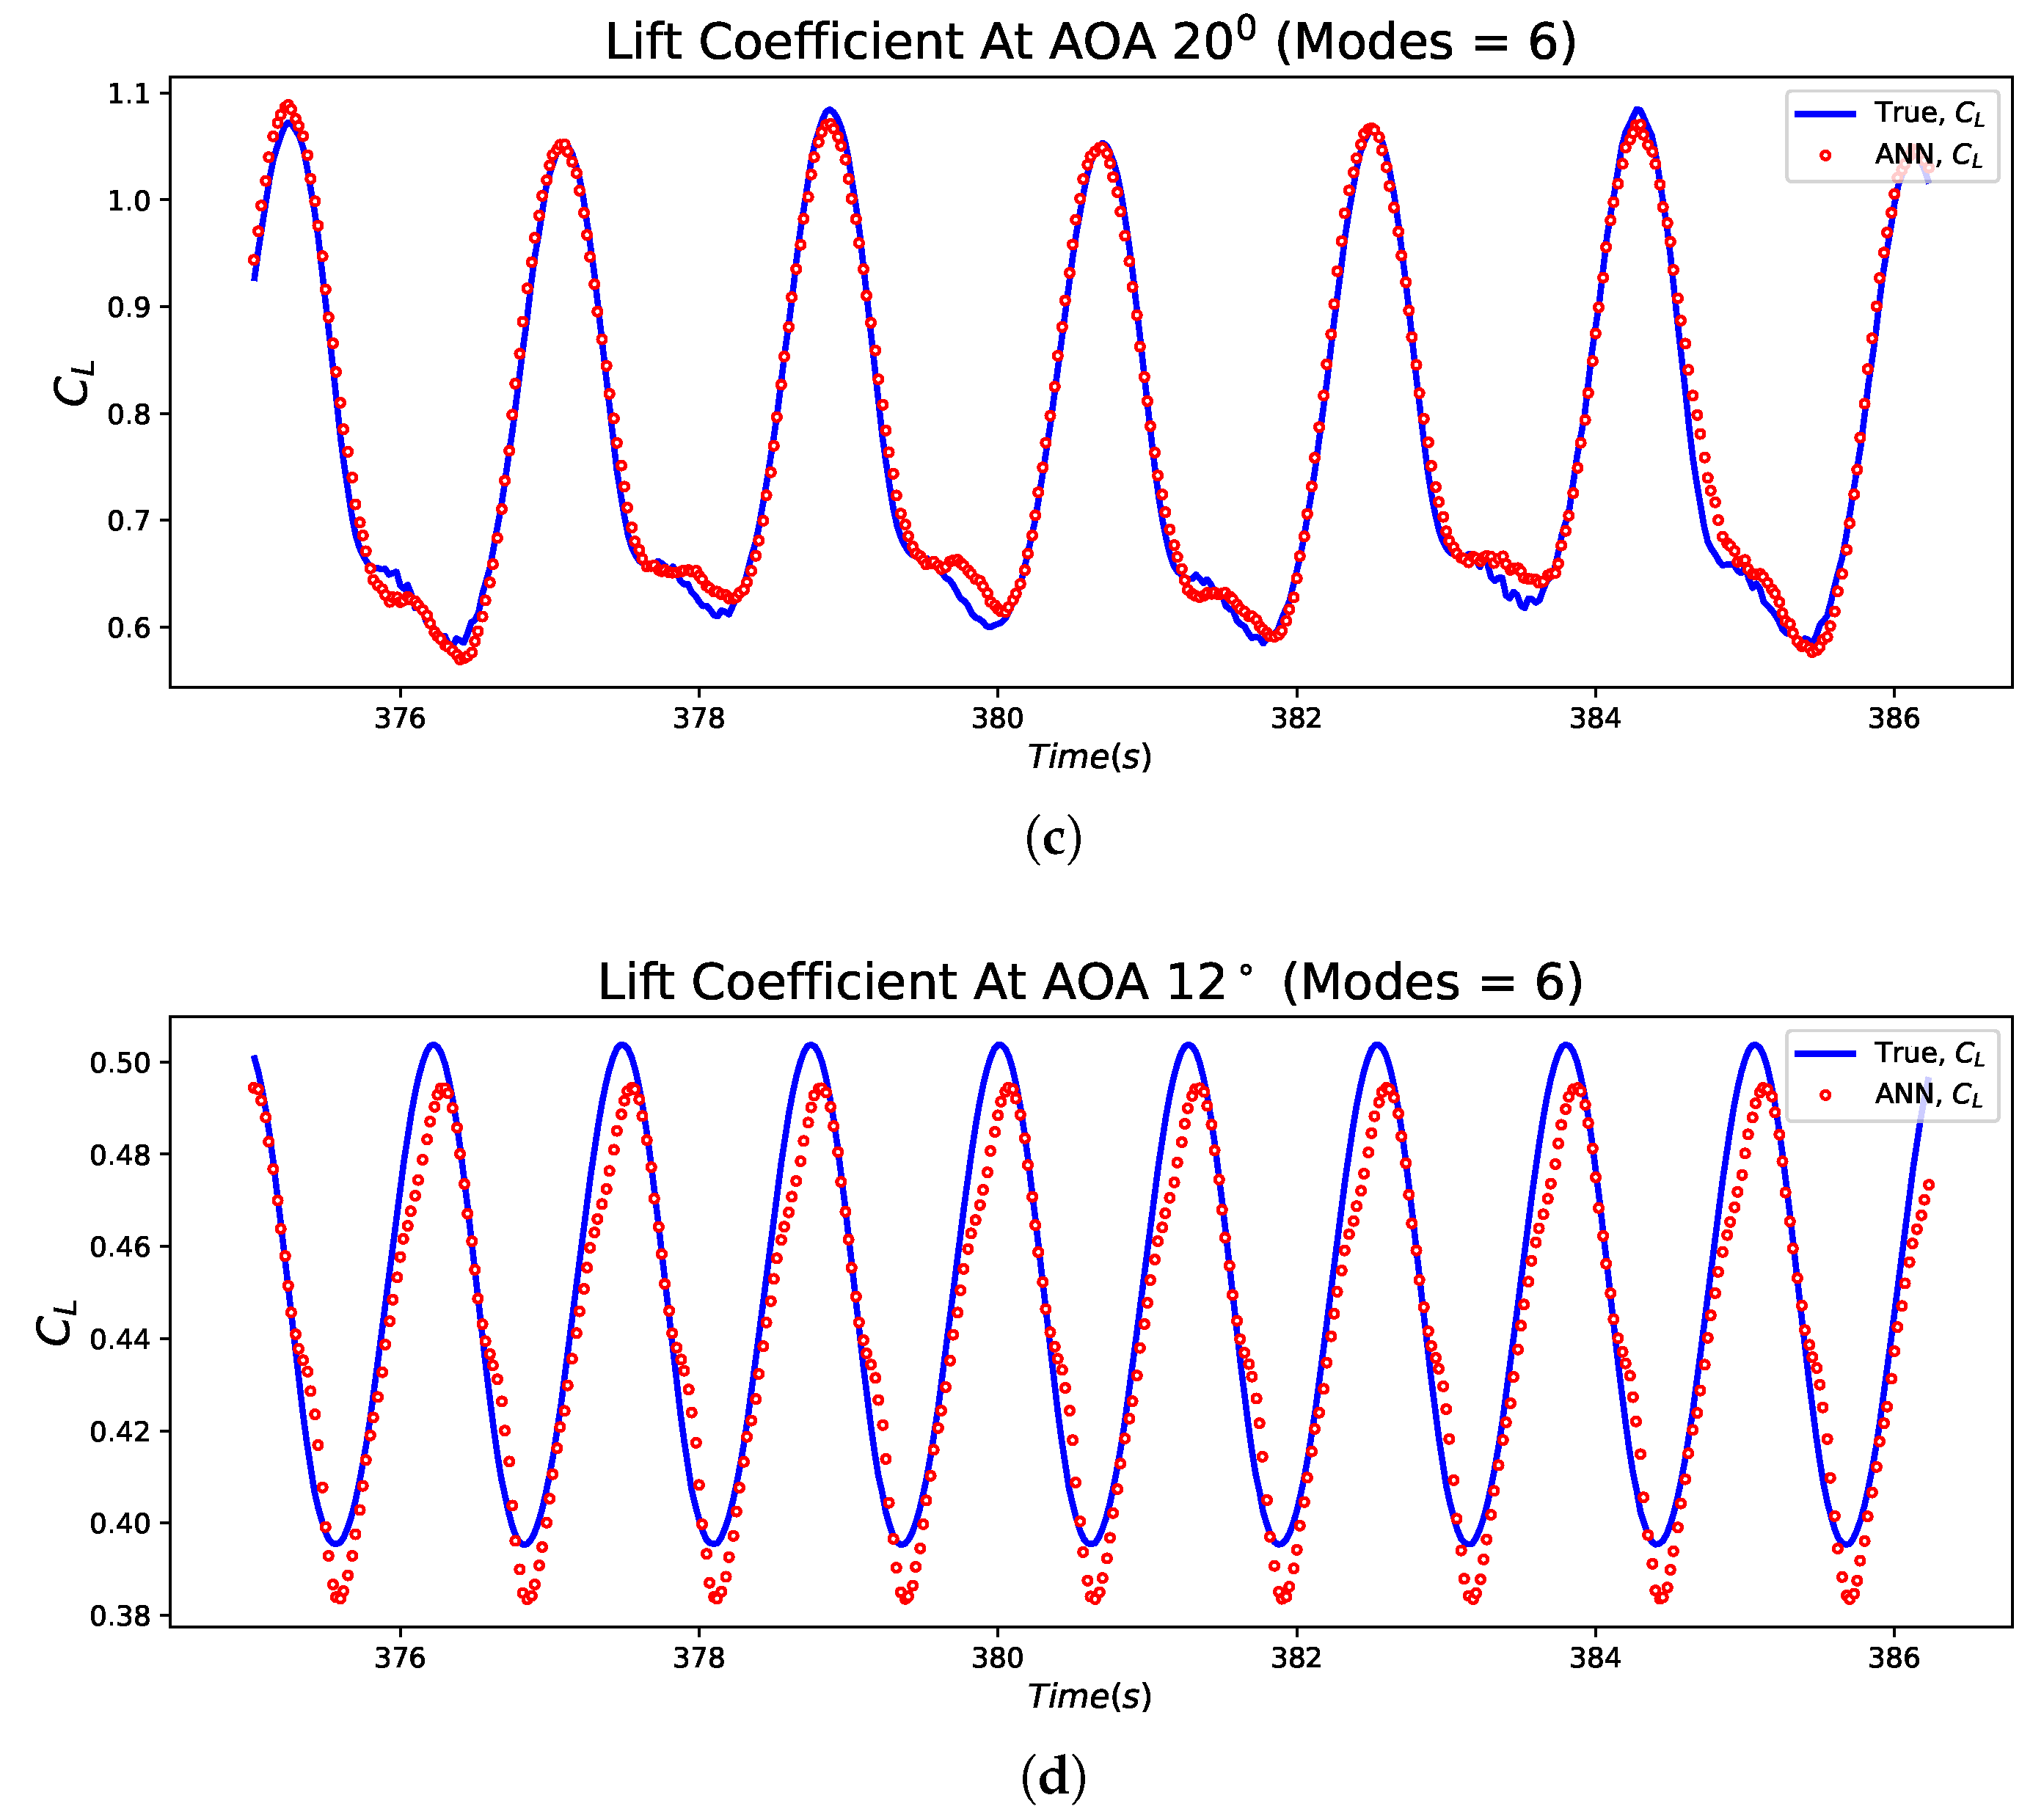
ANN is trained on the POD coefficients obtained at three AOA = (10°, 15°, 20°), and out of sample POD coefficients of AOA = 12° are predicted. The first four pressure POD coefficients are shown in Figure 14, indicating good agreement with the true data. We then perform the PMD analysis and predict the lift coefficients for both training data and out of sample case. Figure 15 shows the predicted and true lift coefficients for all AOA (10°, 15°, 20°, 12°).
8. Conclusions
In this study, we simulated the incompressible flow over a stationary airfoil NACA0012 at different AOA. The main objective of the study was to develop the ROM for hydrodynamic forces acting on the airfoil surface using machine learning tools. Unlike the traditional POD-ROM-based models, we developed the ANN-ROM using POD temporal coefficients and PMD. We took flow field snapshot data at AOA = 10°, 15°, 20°. We then performed POD to obtain optimal modes and temporal coefficients. Then, we trained the neural network using these temporal coefficients. ANN was used as a function which takes past time steps and angle of attack to predict the future time steps. We also performed interpolation of out of sample data at angle of attack 12°. We used these predicted temporal coefficients to calculate lift coefficients using PMD. We employed pressure in this study because it plays an important role in the accuracy of POD-based ROM, as indicated by References [15,51,52]. The results show that the ANN model is more accurate than the traditional POD-ROM in terms of predicting in-sample and out-of-sample POD coefficients. Furthermore, the pressure component of lift is reconstructed using PMD analysis and shows excellent agreement, which is found with the true data.
Author Contributions
Conceptualization, I.A. and Z.B.; methodology, H.F.; software, I.A.; validation, A.S., H.F.; formal analysis, A.S.; investigation, I.A.; resources, I.A., H.F.; data curation, A.S.; writing—original draft preparation, A.S., H.F.; writing—review and editing, A.S., H.F.; visualization, A.S., H.F.; supervision, I.A.; project administration, I.A.; funding acquisition, I.A. All authors have read and agreed to the published version of the manuscript.
Funding
The research is supported by the National Center of Big Data and Cloud Computing under Higher Education Commission, Pakistan.
Institutional Review Board Statement
Not applicable.
Informed Consent Statement
Not applicable.
Data Availability Statement
Data used in this study is available on reasonable request.
Acknowledgments
The research work is supported by Digital Pakistan Lab under the National Center for Big Data and Cloud Computing funded by Higher Education Commission, Pakistan. The first author is thankful to the Computing Research and Development Center (CRDC) at the Institute of Computing, Bahauddin Zakariya University, Multan, Pakistan, for providing access to the SMP/multicore machine.
Conflicts of Interest
The authors declare no conflict of interest.
References
- Gault, D.E. An Experimental Investigation of Regions of Separated Laminar Flow; Number 3505; National Advisory Committee for Aeronautics: Moffett Field, CA, USA, 1955. [Google Scholar]
- Tani, I. Low-speed flows involving bubble separations. Prog. Aerosp. Sci. 1964, 5, 70–103. [Google Scholar] [CrossRef]
- Berkooz, G.; Holmes, P.; Lumley, J.L. The Proper Orthogonal Decomposition in the Analysis of Turbulent Flows. Annu. Rev. Fluid Mech. 1993, 25, 539–575. [Google Scholar] [CrossRef]
- Bakewell, H.P.; Lumley, J.L. Viscous Sublayer and Adjacent Wall Region in Turbulent Pipe Flow. Phys. Fluids 1967, 10, 1880–1889. [Google Scholar] [CrossRef]
- Mezić, I. Spectral Properties of Dynamical Systems, Model Reduction and Decompositions. Nonlinear Dyn. 2005, 41, 309–325. [Google Scholar] [CrossRef]
- Rowley, C.W.; Mezic, I.; Bagheri, S.; Schlatter, P.; Henningson, D.S. Spectral analysis of nonlinear flows. J. Fluid Mech. 2009, 641, 115–127. [Google Scholar] [CrossRef] [Green Version]
- Kutz, J.N.; Brunton, S.L.; Brunton, B.W.; Proctor, J.L. Dynamic Mode Decomposition: Data-Driven Modeling of Complex Systems; SIAM: Philadelphia, PA, USA, 2016. [Google Scholar]
- Hemati, M.; Deem, E.; Williams, M.; Rowley, C.W.; Cattafesta, L.N. Improving separation control with noise-robust variants of dynamic mode decomposition. In Proceedings of the 54th AIAA Aerospace Sciences Meeting, San Diego, CA, USA, 4–8 January 2016; p. 1103. [Google Scholar]
- Dawson, S.T.; Hemati, M.S.; Williams, M.O.; Rowley, C.W. Characterizing and correcting for the effect of sensor noise in the dynamic mode decomposition. Exp. Fluids 2016, 57, 42. [Google Scholar] [CrossRef] [Green Version]
- Towne, A.; Schmidt, O.T.; Colonius, T. Spectral proper orthogonal decomposition and its relationship to dynamic mode decomposition and resolvent analysis. J. Fluid Mech. 2018, 847, 821–867. [Google Scholar] [CrossRef] [Green Version]
- Sieber, M.; Paschereit, C.O.; Oberleithner, K. Spectral proper orthogonal decomposition. J. Fluid Mech. 2016, 792, 798–828. [Google Scholar] [CrossRef] [Green Version]
- Agostini, L. Exploration and prediction of fluid dynamical systems using auto-encoder technology. Phys. Fluids 2020, 32, 67103. [Google Scholar] [CrossRef]
- Taira, K.; Brunton, S.L.; Dawson, S.T.; Rowley, C.W.; Colonius, T.; McKeon, B.J.; Schmidt, O.T.; Gordeyev, S.; Theofilis, V.; Ukeiley, L.S. Modal analysis of fluid flows: An overview. AIAA J. 2017, 55, 4013–4041. [Google Scholar] [CrossRef] [Green Version]
- Taira, K.; Hemati, M.S.; Brunton, S.L.; Sun, Y.; Duraisamy, K.; Bagheri, S.; Dawson, S.T.; Yeh, C.A. Modal analysis of fluid flows: Applications and outlook. AIAA J. 2020, 58, 998–1022. [Google Scholar] [CrossRef]
- Akhtar, I.; Nayfeh, A.H.; Ribbens, C.J. On the stability and extension of reduced-order Galerkin models in incompressible flows. Theor. Comput. Fluid Dyn. 2009, 23, 213–237. [Google Scholar] [CrossRef]
- Imtiaz, H.; Akhtar, I. Closure modeling of low dimensional models using LES analogy. In Proceedings of the 2014 11th International Bhurban Conference on Applied Sciences & Technology (IBCAST), Islamabad, Pakistan, 14–18 January 2014; pp. 243–250. [Google Scholar]
- Wang, Z.; Akhtar, I.; Borggaard, J.; Iliescu, T. Proper orthogonal decomposition closure models for turbulent flows: A numerical comparison. Comput. Methods Appl. Mech. Eng. 2012, 237, 10–26. [Google Scholar] [CrossRef] [Green Version]
- Imtiaz, H.; Akhtar, I. Closure modeling in reduced-order model of Burgers’ equation for control applications. Proc. Inst. Mech. Eng. Part G J. Aerosp. Eng. 2017, 231, 642–656. [Google Scholar] [CrossRef]
- Imtiaz, H.; Akhtar, I. Nonlinear closure modeling in reduced order models for turbulent flows: A dynamical system approach. Nonlinear Dyn. 2020, 99, 479–494. [Google Scholar] [CrossRef]
- Lucia, D.J.; Beran, P.S.; Silva, W.A. Reduced-order modeling: New approaches for computational physics. Prog. Aerosp. Sci. 2004, 40, 51–117. [Google Scholar] [CrossRef] [Green Version]
- Rowley, C.W.; Dawson, S.T. Model Reduction for Flow Analysis and Control. Annu. Rev. Fluid Mech. 2017, 49, 387–417. [Google Scholar] [CrossRef] [Green Version]
- Champion, K.; Lusch, B.; Kutz, J.N.; Brunton, S.L. Data-driven discovery of coordinates and governing equations. Proc. Natl. Acad. Sci. USA 2019, 116, 22445–22451. [Google Scholar] [CrossRef] [Green Version]
- Lusch, B.; Kutz, J.N.; Brunton, S.L. Deep learning for universal linear embeddings of nonlinear dynamics. Nat. Commun. 2018, 9, 1–10. [Google Scholar]
- Akhtar, I.; Marzouk, O.A.; Nayfeh, A.H. A van der Pol–Duffing oscillator model of hydrodynamic forces on canonical structures. J. Comput. Nonlinear Dyn. 2009, 4, 041006. [Google Scholar] [CrossRef]
- Hajj, M.R.; Mehmood, A.; Akhtar, I. Single-degree-of-freedom model of displacement in vortex-induced vibrations. Nonlinear Dyn. 2021, 103, 1305–1320. [Google Scholar] [CrossRef]
- Schlegel, M.; Noack, B.R. On long-term boundedness of Galerkin models. J. Fluid Mech. 2015, 765, 325–352. [Google Scholar] [CrossRef] [Green Version]
- Östh, J.; Noack, B.R.; Krajnović, S.; Barros, D.; Borée, J. On the need for a nonlinear subscale turbulence term in POD models as exemplified for a high-Reynolds-number flow over an Ahmed body. J. Fluid Mech. 2014, 747, 518–544. [Google Scholar] [CrossRef] [Green Version]
- Chaturantabut, S.; Sorensen, D.C. Nonlinear model reduction via discrete empirical interpolation. SIAM J. Sci. Comput. 2010, 32, 2737–2764. [Google Scholar] [CrossRef]
- Sabetghadam, F.; Jafarpour, A. α regularization of the POD-Galerkin dynamical systems of the Kuramoto–Sivashinsky equation. Appl. Math. Comput. 2012, 218, 6012–6026. [Google Scholar] [CrossRef]
- Xiao, D.; Fang, F.; Buchan, A.G.; Pain, C.C.; Navon, I.M.; Du, J.; Hu, G. Non-linear model reduction for the Navier–Stokes equations using residual DEIM method. J. Comput. Phys. 2014, 263, 1–18. [Google Scholar] [CrossRef] [Green Version]
- Huang, C.; Wentland, C.R.; Duraisamy, K.; Merkle, C. Model reduction for multi-scale transport problems using structure-preserving least-squares projections with variable transformation. arXiv 2020, arXiv:2011.02072. [Google Scholar]
- Grimberg, S.; Farhat, C.; Youkilis, N. On the stability of projection-based model order reduction for convection-dominated laminar and turbulent flows. J. Comput. Phys. 2020, 419, 109681. [Google Scholar] [CrossRef]
- Lee, K.; Carlberg, K.T. Model reduction of dynamical systems on nonlinear manifolds using deep convolutional autoencoders. J. Comput. Phys. 2020, 404, 108973. [Google Scholar] [CrossRef] [Green Version]
- Peherstorfer, B. Model reduction for transport-dominated problems via online adaptive bases and adaptive sampling. SIAM J. Sci. Comput. 2020, 42, A2803–A2836. [Google Scholar] [CrossRef]
- Xiao, D.; Fang, F.; Pain, C.; Hu, G. Non-intrusive reduced-order modelling of the Navier–Stokes equations based on RBF interpolation. Int. J. Numer. Methods Fluids 2015, 79, 580–595. [Google Scholar] [CrossRef]
- Bui-Thanh, T.; Damodaran, M.; Willcox, K. Aerodynamic data reconstruction and inverse design using proper orthogonal decomposition. AIAA J. 2004, 42, 1505–1516. [Google Scholar] [CrossRef] [Green Version]
- Audouze, C.; De Vuyst, F.; Nair, P. Reduced-order modeling of parameterized PDEs using time–space-parameter principal component analysis. Int. J. Numer. Methods Eng. 2009, 80, 1025–1057. [Google Scholar] [CrossRef]
- Ly, H.V.; Tran, H.T. Modeling and control of physical processes using proper orthogonal decomposition. Math. Comput. Model. 2001, 33, 223–236. [Google Scholar] [CrossRef] [Green Version]
- Swischuk, R.; Mainini, L.; Peherstorfer, B.; Willcox, K. Projection-based model reduction: Formulations for physics-based machine learning. Comput. Fluids 2019, 179, 704–717. [Google Scholar] [CrossRef]
- San, O.; Maulik, R. Neural network closures for nonlinear model order reduction. Adv. Comput. Math. 2018, 44, 1717–1750. [Google Scholar] [CrossRef] [Green Version]
- San, O.; Maulik, R.; Ahmed, M. An artificial neural network framework for reduced order modeling of transient flows. Commun. Nonlinear Sci. Numer. Simul. 2019, 77, 271–287. [Google Scholar] [CrossRef] [Green Version]
- Wang, Z.; Xiao, D.; Fang, F.; Govindan, R.; Pain, C.C.; Guo, Y. Model identification of reduced order fluid dynamics systems using deep learning. Int. J. Numer. Methods Fluids 2018, 86, 255–268. [Google Scholar] [CrossRef] [Green Version]
- Ahmed, S.E.; San, O.; Rasheed, A.; Iliescu, T. A long short-term memory embedding for hybrid uplifted reduced order models. Phys. D Nonlinear Phenom. 2020, 409, 132471. [Google Scholar] [CrossRef] [Green Version]
- Murata, T.; Fukami, K.; Fukagata, K. Nonlinear mode decomposition with convolutional neural networks for fluid dynamics. J. Fluid Mech. 2020, 882. [Google Scholar] [CrossRef] [Green Version]
- Fukami, K.; Fukagata, K.; Taira, K. Super-resolution reconstruction of turbulent flows with machine learning. J. Fluid Mech. 2019, 870, 106–120. [Google Scholar] [CrossRef] [Green Version]
- Fukami, K.; Fukagata, K.; Taira, K. Machine-learning-based spatio-temporal super resolution reconstruction of turbulent flows. J. Fluid Mech. 2021, 909. [Google Scholar] [CrossRef]
- Hasegawa, K.; Fukami, K.; Murata, T.; Fukagata, K. CNN-LSTM based reduced order modeling of two-dimensional unsteady flows around a circular cylinder at different Reynolds numbers. Fluid Dyn. Res. 2020, 52, 065501. [Google Scholar] [CrossRef]
- Raissi, M.; Perdikaris, P.; Karniadakis, G.E. Physics-informed neural networks: A deep learning framework for solving forward and inverse problems involving nonlinear partial differential equations. J. Comput. Phys. 2019, 378, 686–707. [Google Scholar] [CrossRef]
- Raissi, M.; Karniadakis, G.E. Hidden physics models: Machine learning of nonlinear partial differential equations. J. Comput. Phys. 2018, 357, 125–141. [Google Scholar] [CrossRef] [Green Version]
- San, O.; Iliescu, T. Proper orthogonal decomposition closure models for fluid flows: Burgers equation. arXiv 2013, arXiv:1308.3276. [Google Scholar]
- Noack, B.R.; Papas, P.; Monkewitz, P.A. The need for a pressure-term representation in empirical Galerkin models of incompressible shear flows. J. Fluid Mech. 2005, 523, 339. [Google Scholar] [CrossRef] [Green Version]
- Imtiaz, H.; Akhtar, I. On lift and drag decomposition coefficients in a model reduction framework using pressure-mode decomposition (PMD) analysis. J. Fluids Struct. 2017, 75, 174–192. [Google Scholar] [CrossRef]
- Platzer, M.F.; Jones, K.D.; Young, J.; Lai, J.C. Flapping wing aerodynamics: Progress and challenges. AIAA J. 2008, 46, 2136–2149. [Google Scholar] [CrossRef]
- Ryskin, G.; Leal, L. Orthogonal mapping. J. Comput. Phys. 1983, 50, 71–100. [Google Scholar] [CrossRef]
- Leonard, B.P. A stable and accurate convective modelling procedure based on quadratic upstream interpolation. Comput. Methods Appl. Mech. Eng. 1979, 19, 59–98. [Google Scholar] [CrossRef]
- Zang, Y. On the Development of Tools for the Simulation of Geophysical Flows. Ph.D. Thesis, Stanford University, Stanford, CA, USA, 1994. [Google Scholar]
- Thompson, J.F.; Thames, F.C.; Mastin, C.W. Automatic numerical generation of body-fitted curvilinear coordinate system for field containing any number of arbitrary two-dimensional bodies. J. Comput. Phys. 1974, 15, 299–319. [Google Scholar] [CrossRef]
- Arina, R. Orthogonal grids with adaptive control. Numer. Grid Gener. Comput. Fluid Dyn. 1986, 113–124. Available online: https://iris.polito.it/handle/11583/1416918?mode=simple.6163#.YTBUud8RWUl (accessed on 5 April 2021).
- Albert, M.R. Orthogonal curvilinear coordinate generation for internal flows. Numer. Grid Gener. Comput. Fluid Mech. 1988, 88, 425–433. [Google Scholar]
- Eça, L. 2D orthogonal grid generation with boundary point distribution control. J. Comput. Phys. 1996, 125, 440–453. [Google Scholar] [CrossRef]
- Hong, H.; Jian-ren, F.; Ke-fa, C. A numerical method for orthogonal grid generation by Laplace system. J. Zhejiang Univ. Sci. A 2000, 1, 125–128. [Google Scholar]
- Liu, Y.; Bai, K.; Wang, X.; Liu, M.Q. Two-Dimensional Orthogonal Grid Generation. In Advanced Materials Research; Trans Tech Publications Ltd.: Freienbach, Switzerland, 2012; Volume 468, pp. 2668–2671. [Google Scholar]
- Ohmi, K.; Coutanceau, M.; Loc, T.P.; Dulieu, A. Vortex formation around an oscillating and translating airfoil at large incidences. J. Fluid Mech. 1990, 211, 37–60. [Google Scholar] [CrossRef]
- Kurtulus, D.F. On the unsteady behavior of the flow around NACA 0012 airfoil with steady external conditions at Re = 1000. Int. J. Micro Air Veh. 2015, 7, 301–326. [Google Scholar] [CrossRef]
- Liu, Y.; Li, K.; Zhang, J.; Wang, H.; Liu, L. Numerical bifurcation analysis of static stall of airfoil and dynamic stall under unsteady perturbation. Commun. Nonlinear Sci. Numer. Simul. 2012, 17, 3427–3434. [Google Scholar] [CrossRef]
- Khalid, M.; Akhtar, I. Characteristics of flow past a symmetric airfoil at low Reynolds number: A nonlinear perspective. In Proceedings of the ASME 2012 International Mechanical Engineering Congress and Exposition, Houston, TX, USA, 9–15 November 2012; pp. 167–175. [Google Scholar]
- Suzuki, T.; Ji, H.; Yamamoto, F. Unsteady PTV velocity field past an airfoil solved with DNS: Part 1. Algorithm of hybrid simulation and hybrid velocity field at Re = 1000. Exp. Fluids 2009, 47, 957. [Google Scholar] [CrossRef]
- HOARAU, Y.; BRAZA, M.; Ventikos, Y.; Faghani, D.; Tzabiras, G. Organized modes and the three-dimensional transition to turbulence in the incompressible flow around a NACA0012 wing. J. Fluid Mech. 2003, 496, 63–72. [Google Scholar] [CrossRef] [Green Version]
- Mittal, S.; Tezduyar, T.E. Massively parallel finite element computation of incompressible flows involving fluid-body interactions. Comput. Methods Appl. Mech. Eng. 1994, 112, 253–282. [Google Scholar] [CrossRef]
- Akhtar, I. Parallel Simulations, Reduced-Order Modeling, and Feedback Control of Vortex Shedding Using Fluidic Actuators. Ph.D. Thesis, Virginia Tech, Blacksburg, VA, USA, 2008. [Google Scholar]
- Abadi, M.; Agarwal, A.; Barham, P.; Brevdo, E.; Chen, Z.; Citro, C.; Corrado, G.S.; Davis, A.; Dean, J.; Devin, M.; et al. TensorFlow: Large-Scale Machine Learning on Heterogeneous Systems. 2015. Available online: tensorflow.org (accessed on 5 April 2021).
- Kingma, D.P.; Ba, J. Adam: A Method for Stochastic Optimization. arXiv 2017, arXiv:1412.6980. [Google Scholar]
- Jin, H.; Song, Q.; Hu, X. Auto-Keras: An Efficient Neural Architecture Search System. In Proceedings of the 25th ACM SIGKDD International Conference on Knowledge Discovery & Data Mining, Anchorage, AK, USA, 4–8 August 2019; pp. 1946–1956. [Google Scholar]
- Wu, J.; Chen, X.Y.; Zhang, H.; Xiong, L.D.; Lei, H.; Deng, S.H. Hyperparameter optimization for machine learning models based on Bayesian optimization. J. Electron. Sci. Technol. 2019, 17, 26–40. [Google Scholar]
- Sirovich, L. Chaotic dynamics of coherent structures. Phys. D Nonlinear Phenom. 1989, 37, 126–145. [Google Scholar] [CrossRef]
- Sirovich, L.; Kirby, M. Low-dimensional procedure for the characterization of human faces. JOSA A 1987, 4, 519–524. [Google Scholar] [CrossRef]
Figure 1.
Two-dimensional layout of an ‘O’-type body-fitted grid over the NACA0012 airfoil. The grid-resolution close to the airfoil is shown in the upper row: (a) leading edge, (b) full airfoil, (c) circular trailing edge. Note that we generate the orthogonal grid between the airfoil and circular outer domain of radius 30c. We numerically solved the elliptic equations as used by Ryskin and Leal [54] to compute the grid nodes.
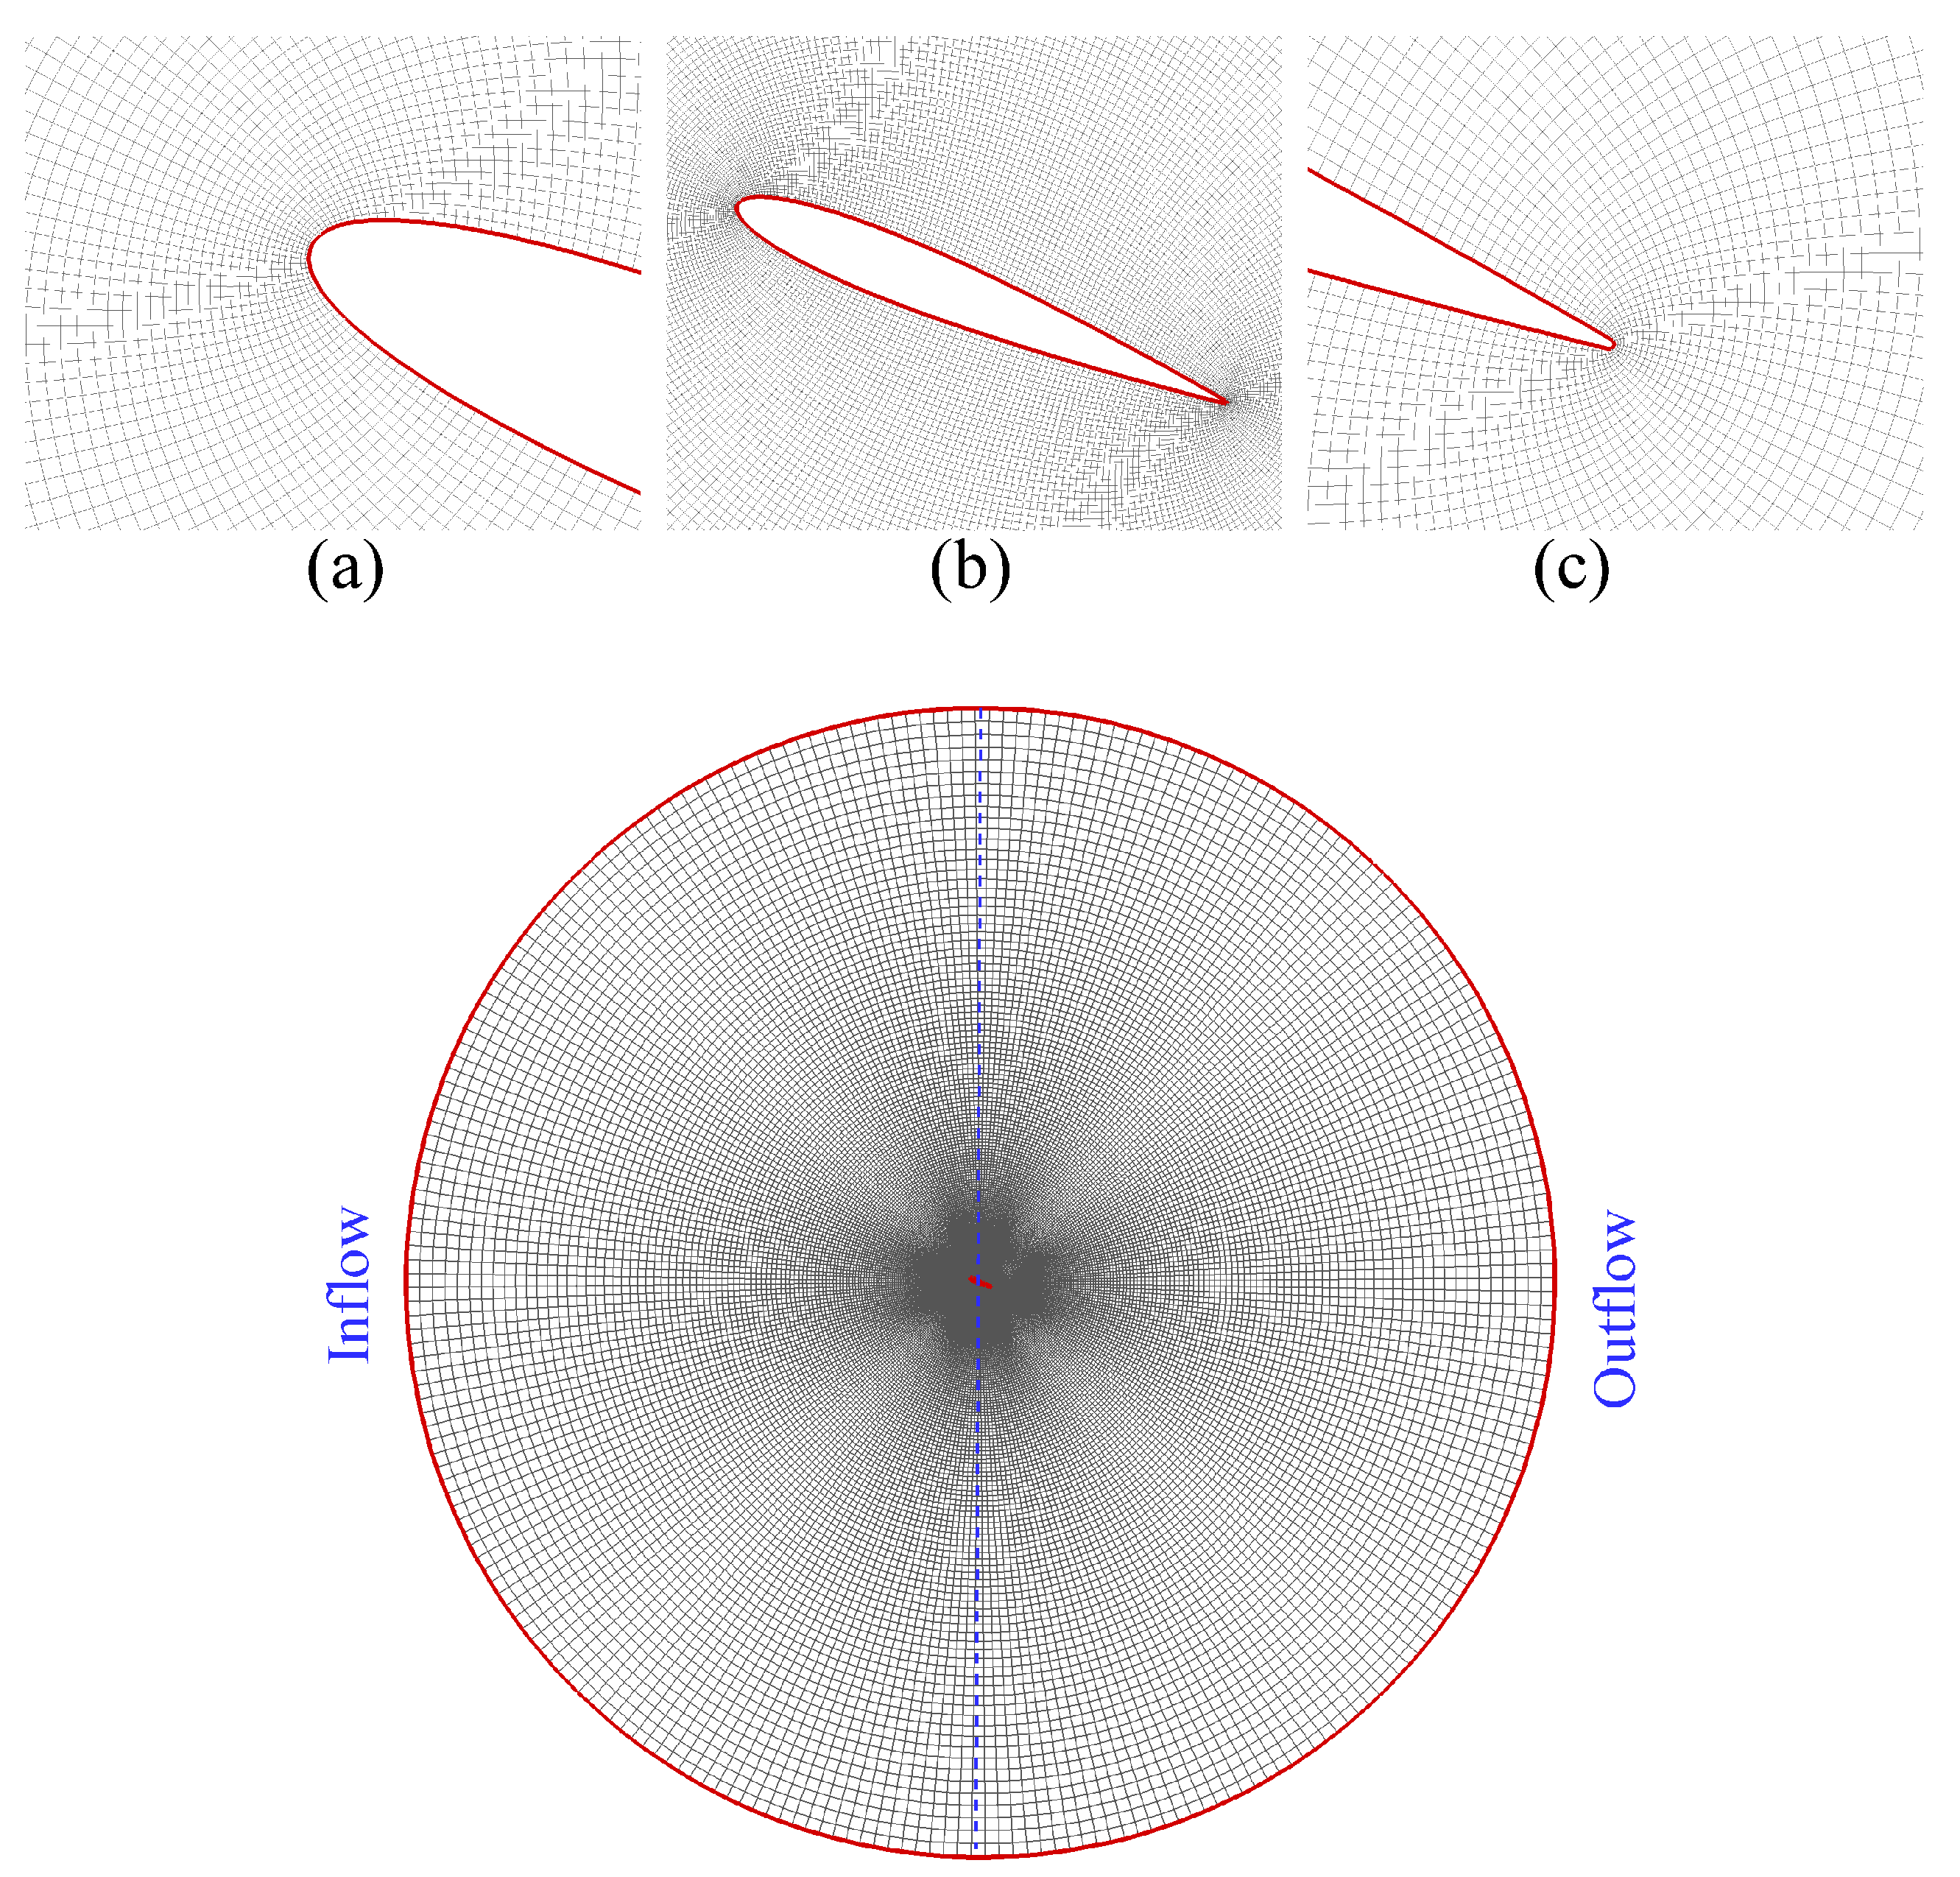
Figure 2.
Mapping between parametric region E and physical region X.
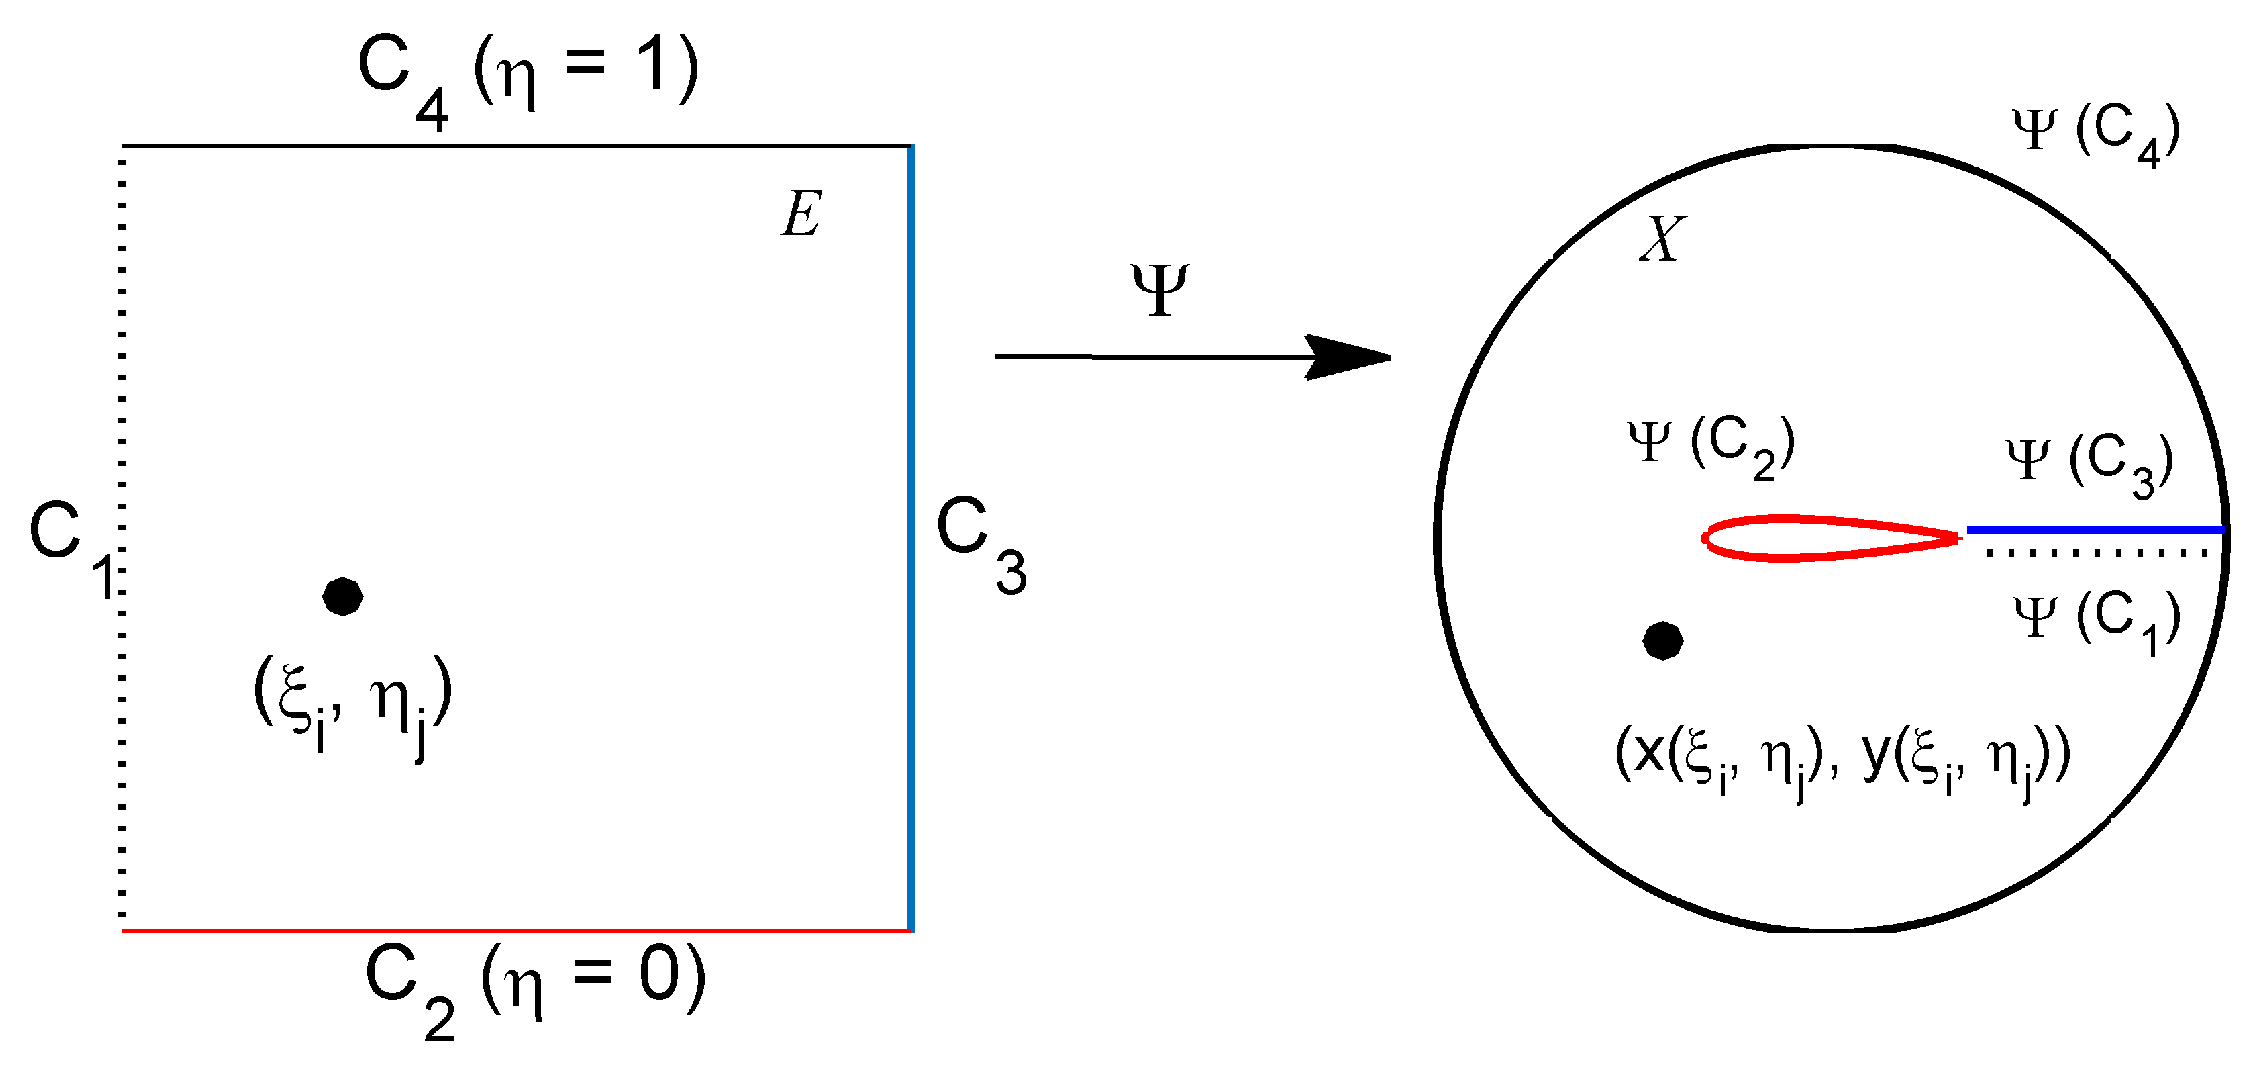
Figure 3.
Time histories of the lift and drag coefficients because of the pressure and viscous stresses acting on the airfoil surface at Re = 1000.
Figure 3.
Time histories of the lift and drag coefficients because of the pressure and viscous stresses acting on the airfoil surface at Re = 1000.
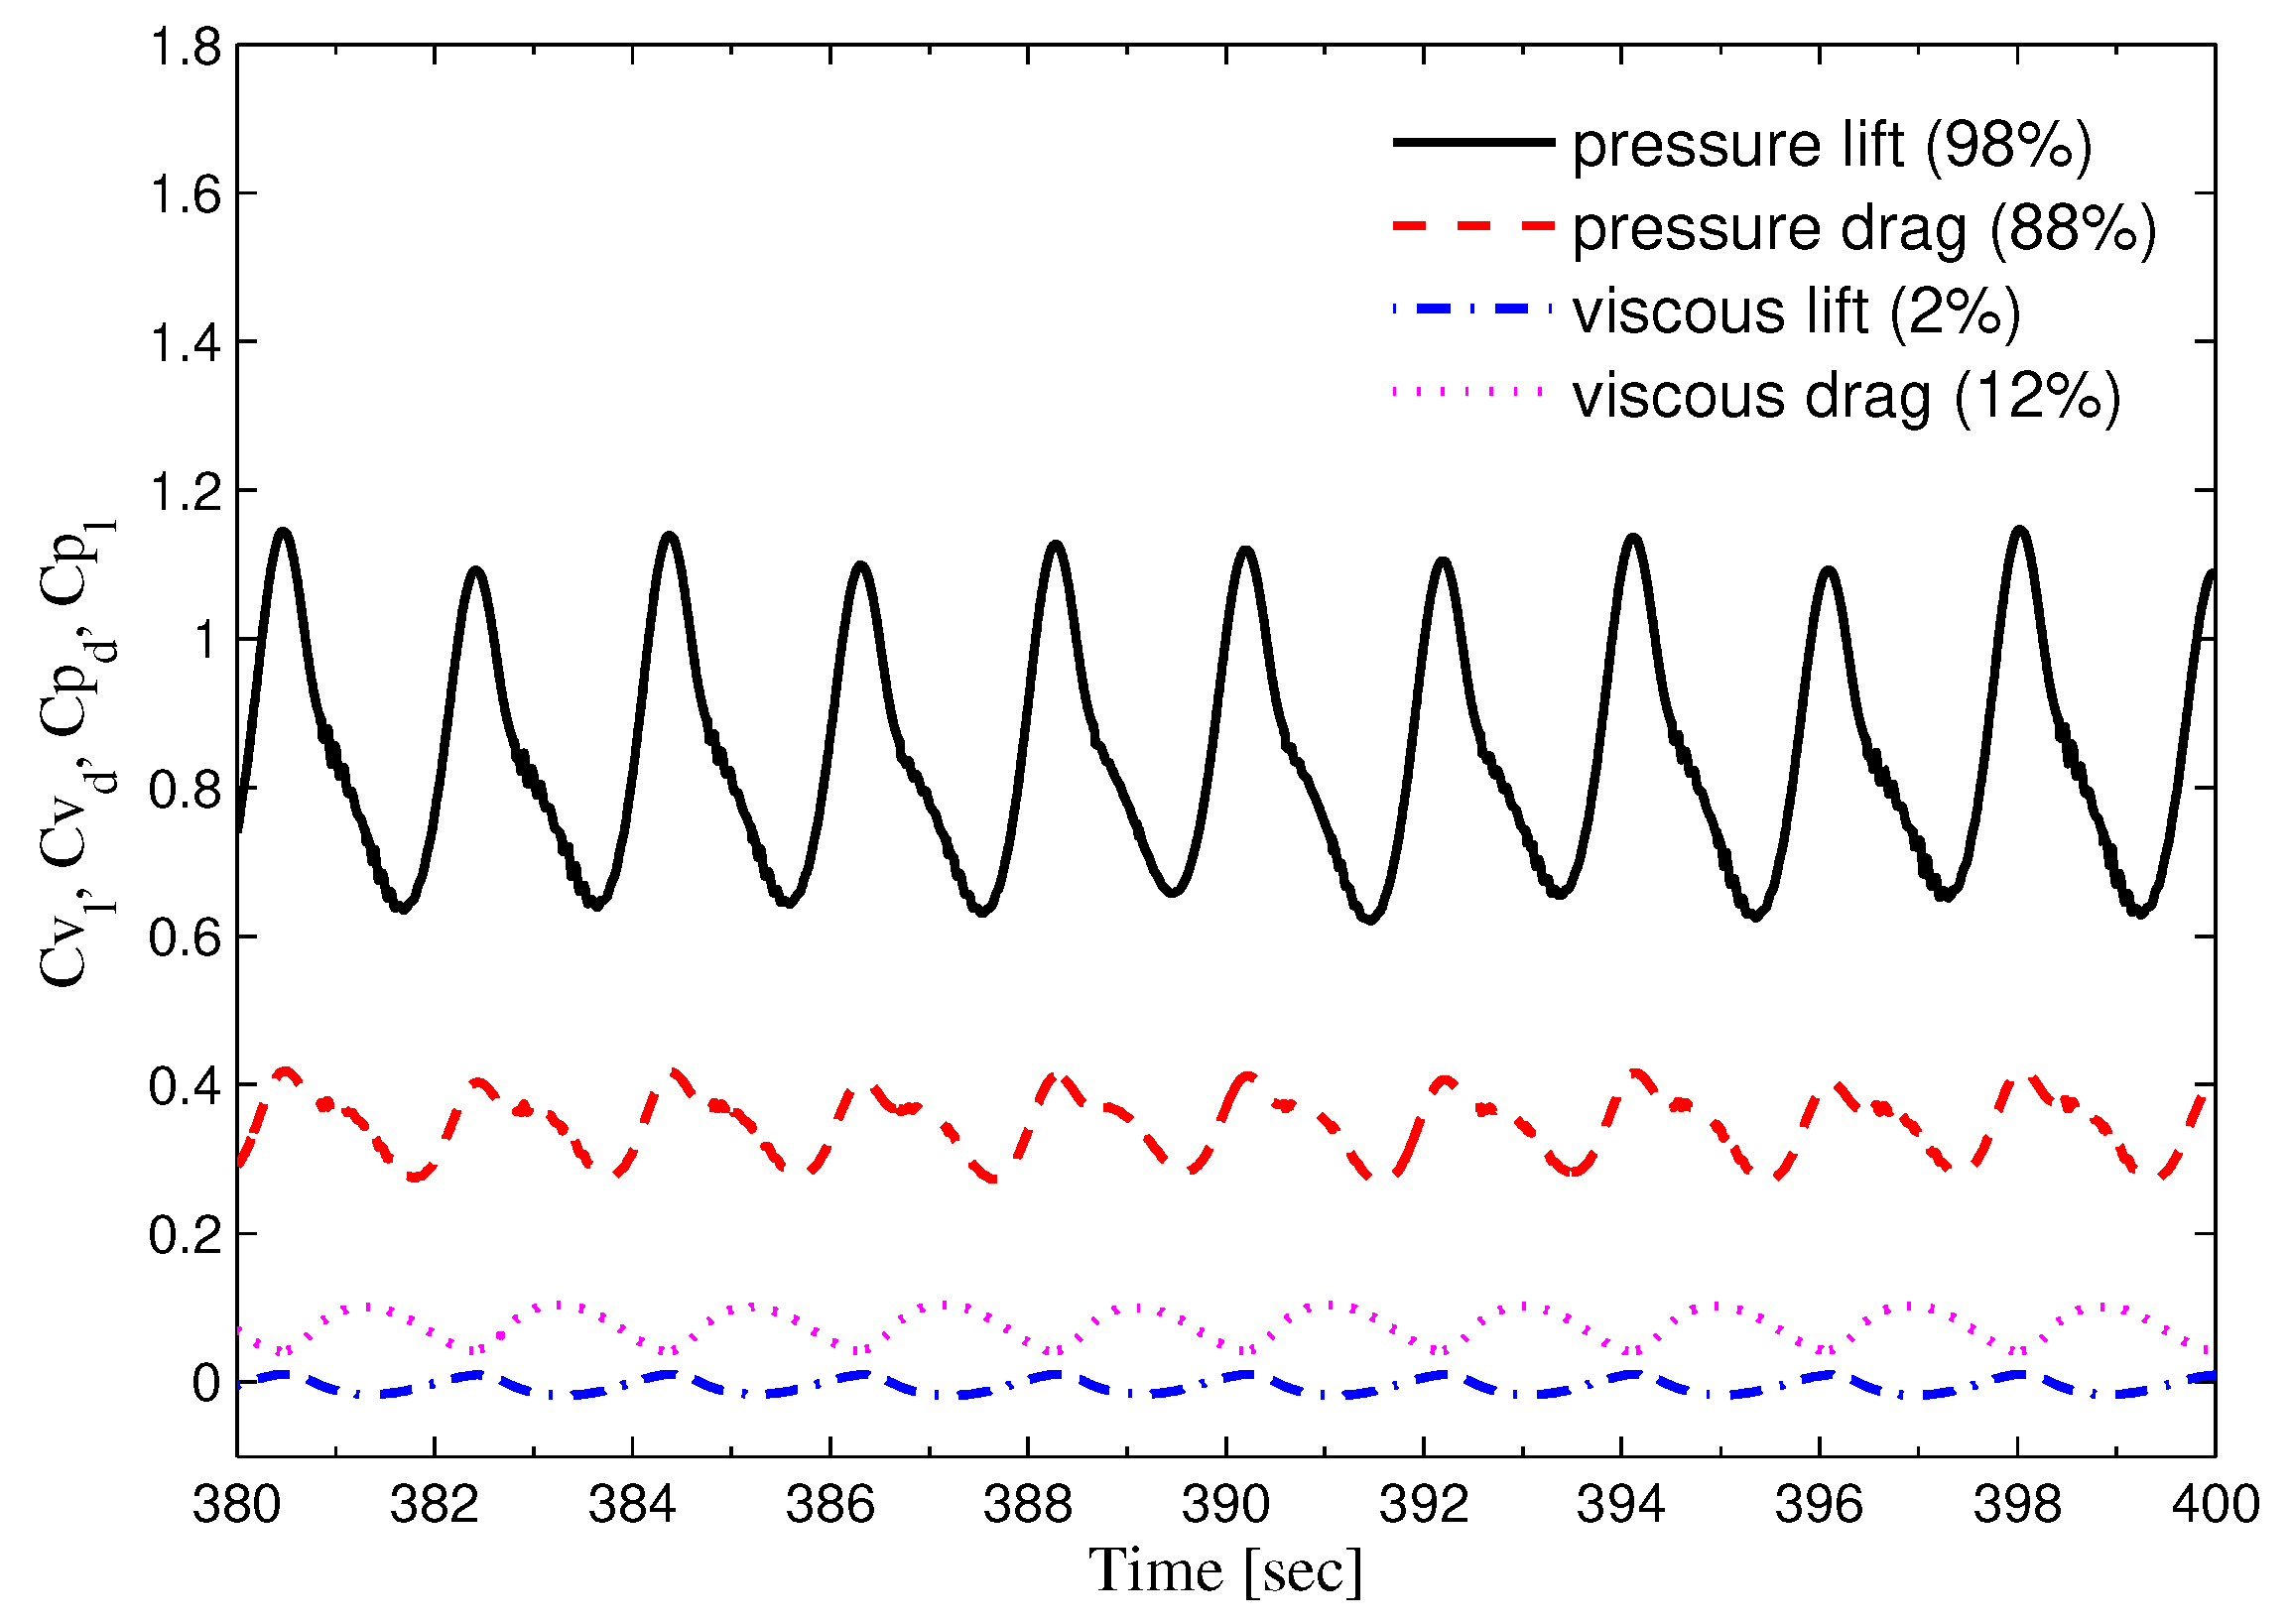
Figure 4.
Comparison of time-averaged lift coefficients at different angles of attack with data in literature.
Figure 4.
Comparison of time-averaged lift coefficients at different angles of attack with data in literature.

Figure 5.
(a) Time histories of lift and drag coefficients. (b) Amplitude spectrum of lift coefficient.
Figure 5.
(a) Time histories of lift and drag coefficients. (b) Amplitude spectrum of lift coefficient.
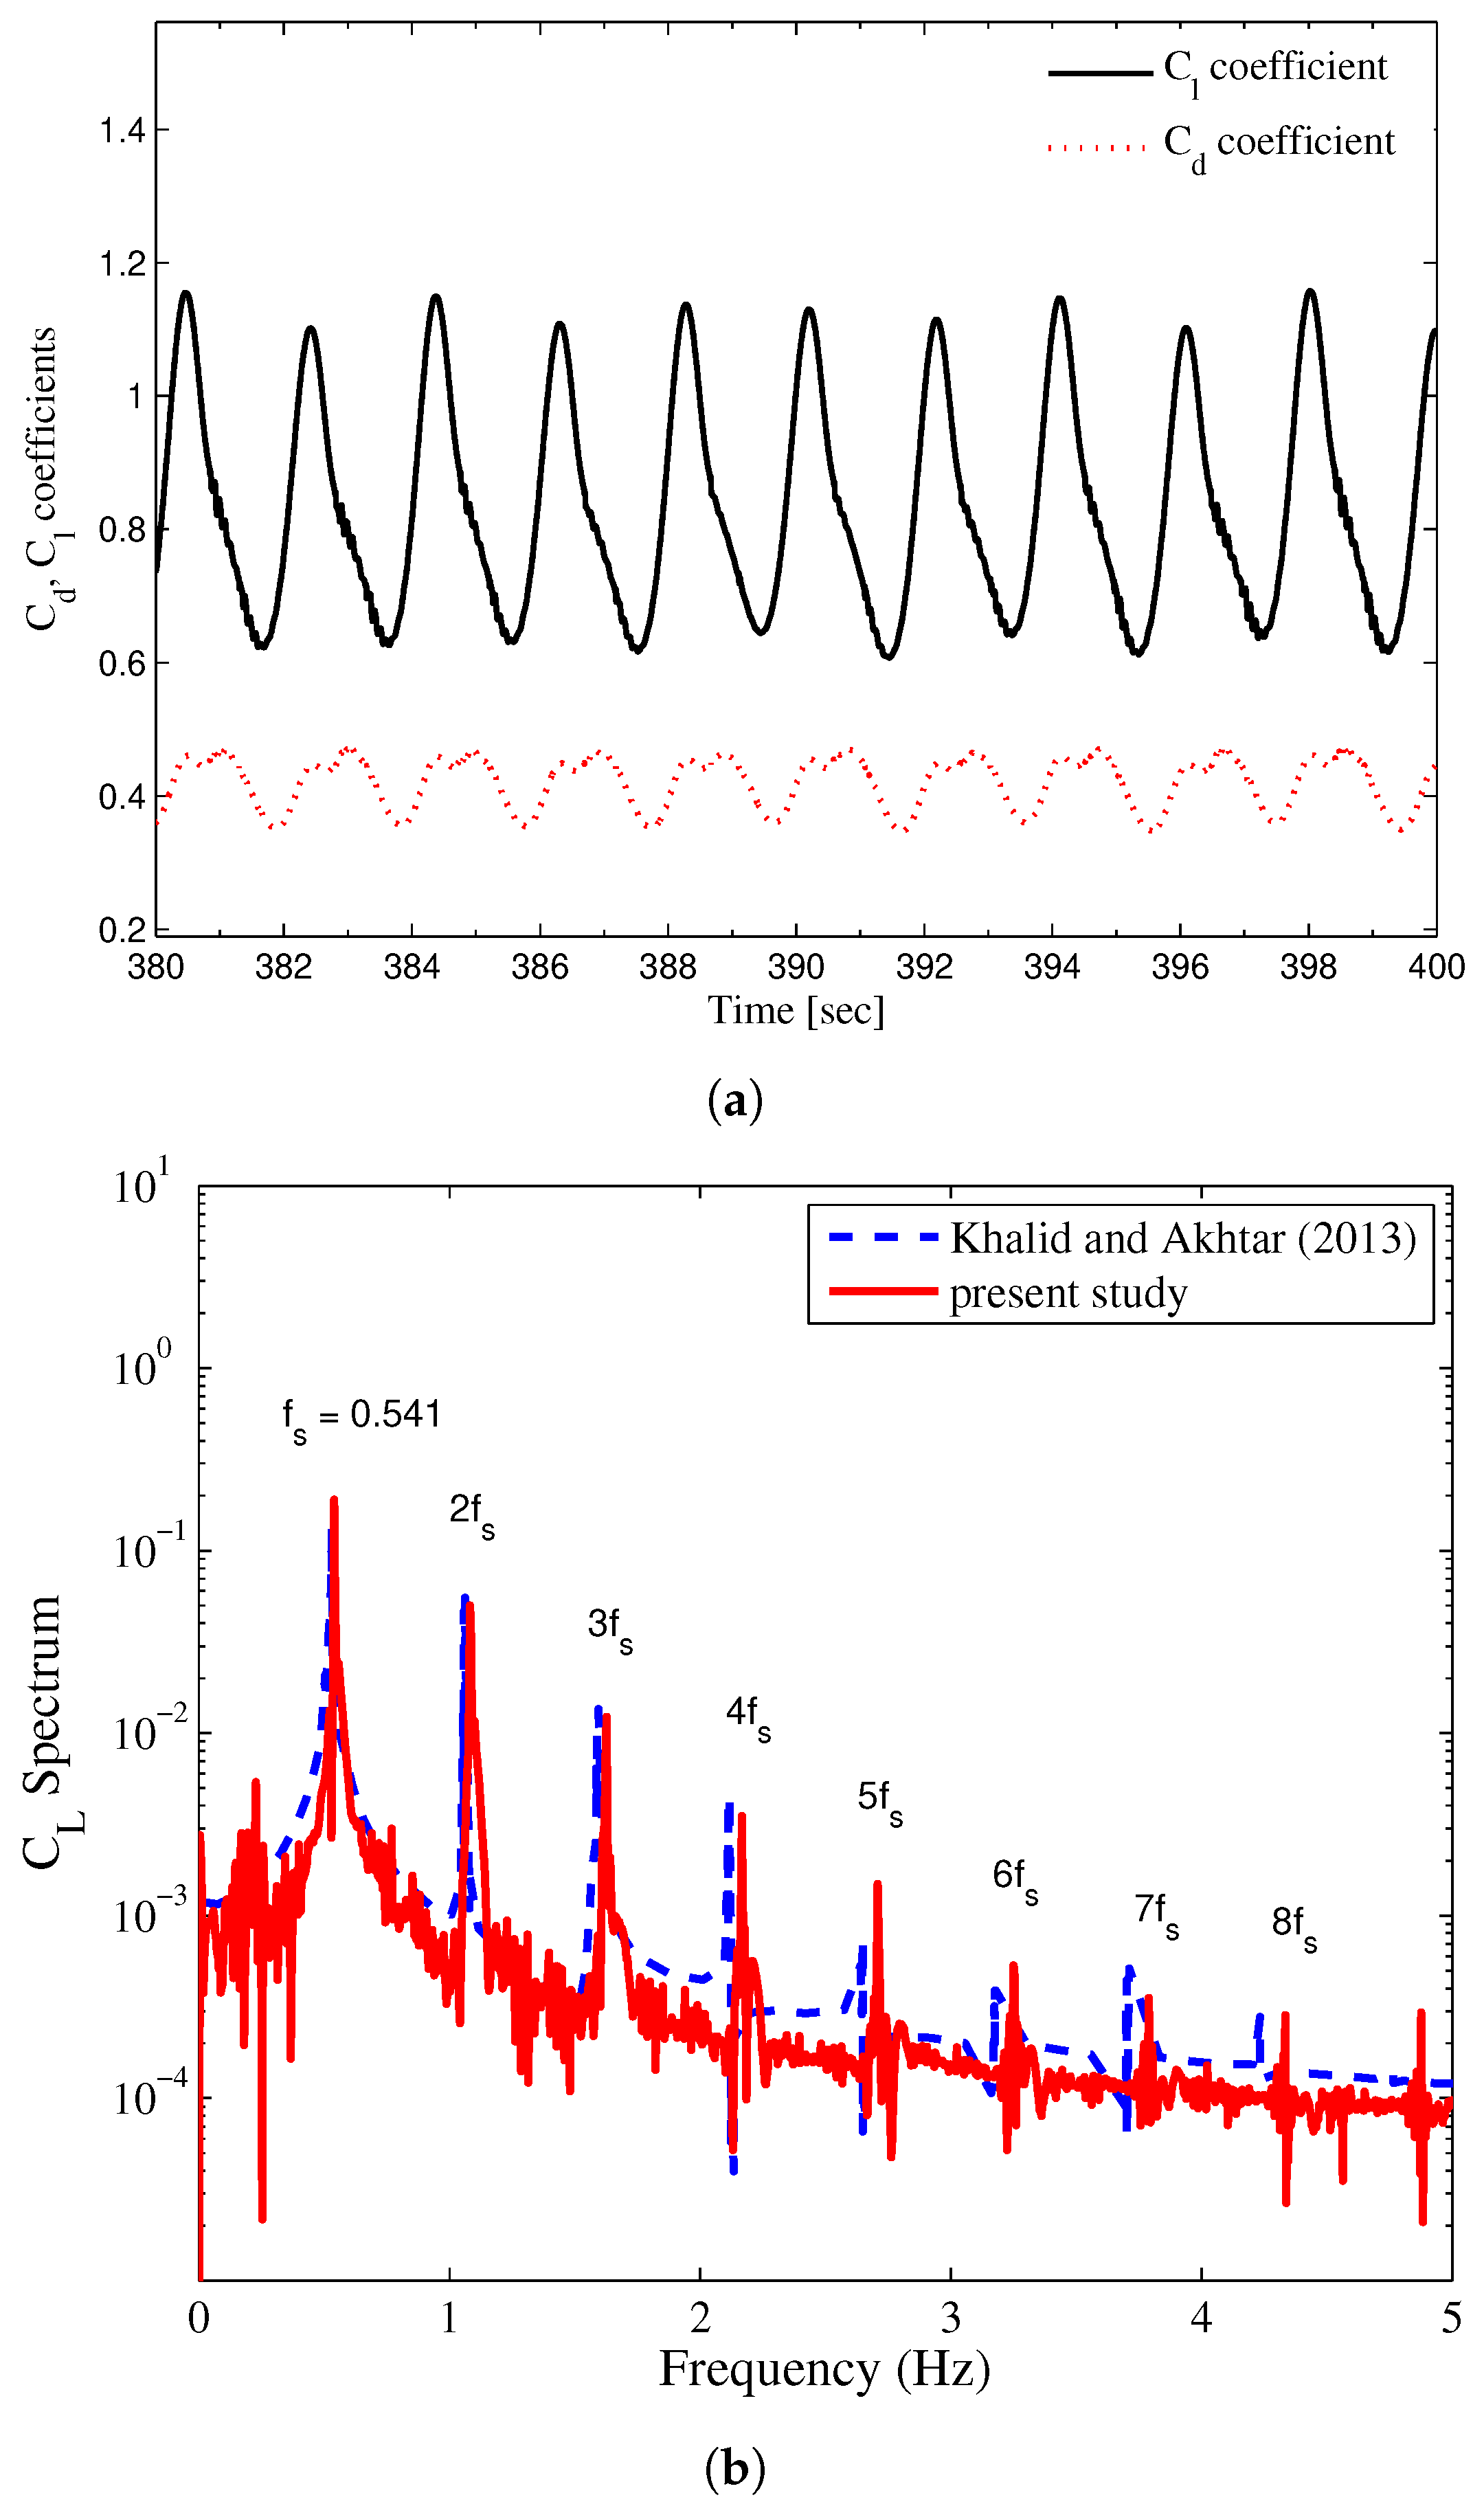
Figure 6.
The computational domain partitioned in 8 parts; the different colors show the different parts of the domain to be assigned to different processing units.
Figure 6.
The computational domain partitioned in 8 parts; the different colors show the different parts of the domain to be assigned to different processing units.

Figure 7.
Feed Forward neural network architecture.
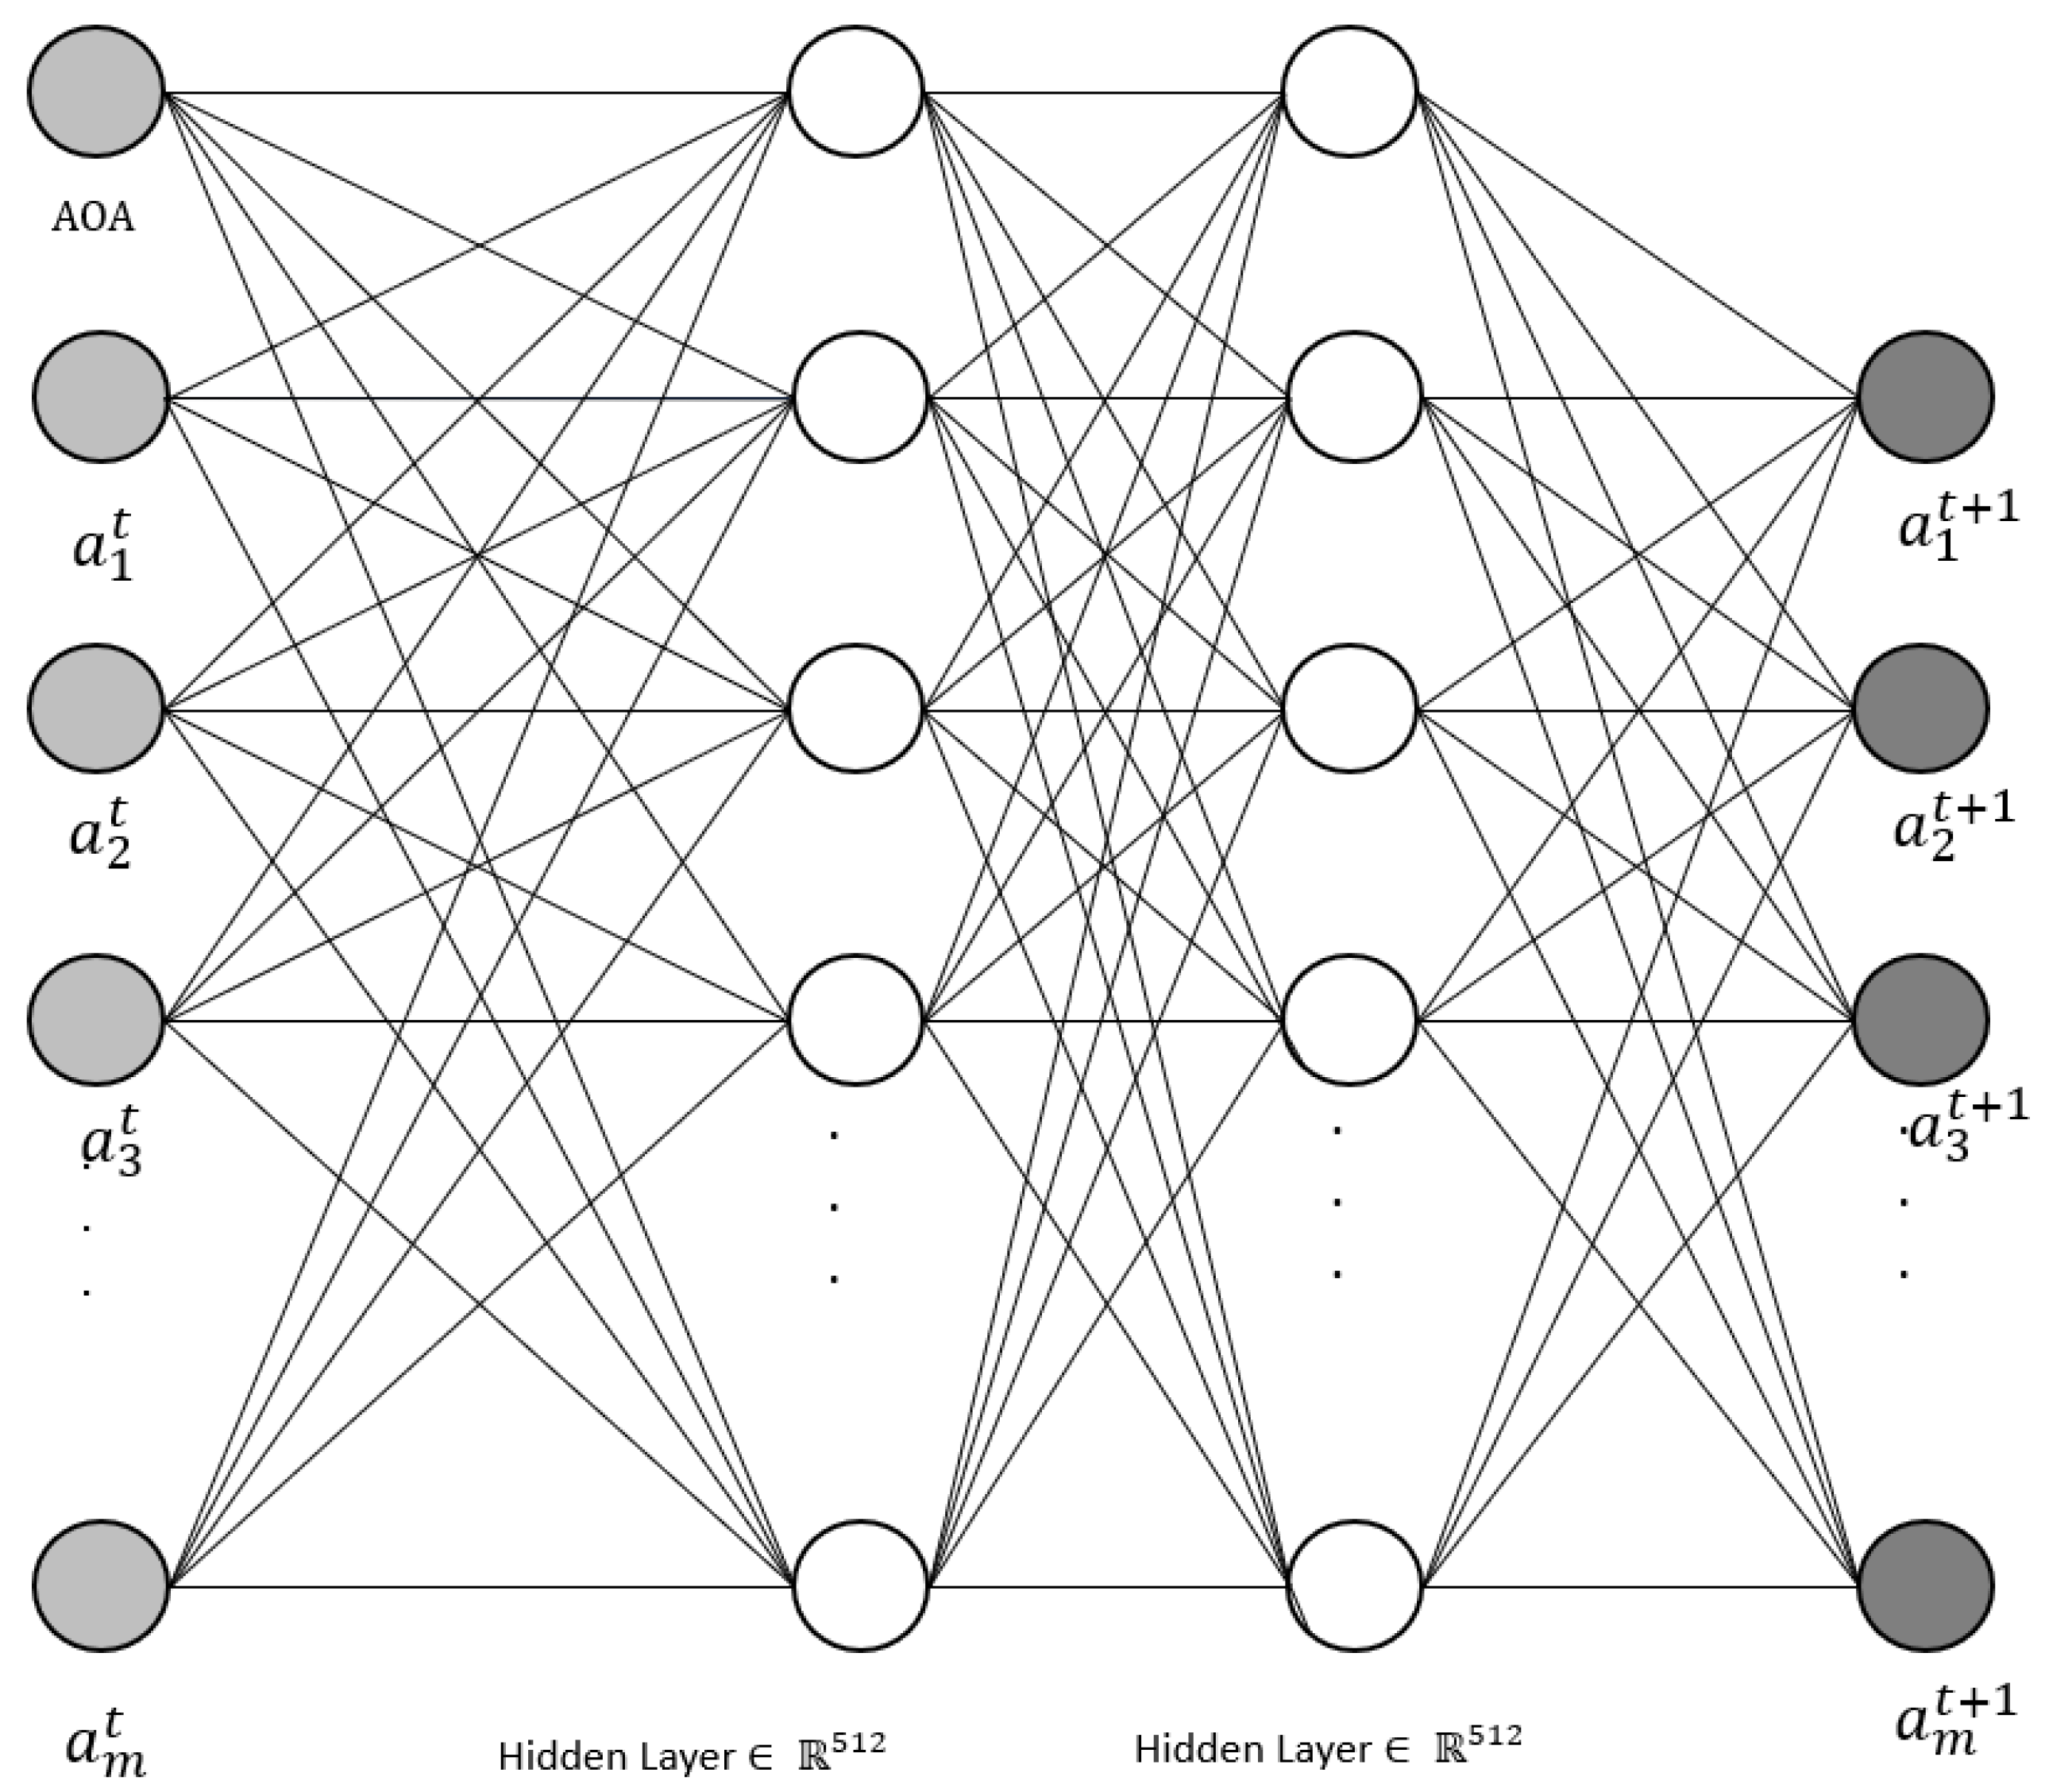
Figure 8.
(a) Time histories of Cl, (b) Power spectra of Cl at AOA = 10°, 15°, and 20°.

Figure 9.
Snapshots of spanwise vorticity contours, (a) AOA = 10°, (b) AOA = 15°, and (c) AOA = 20°.
Figure 9.
Snapshots of spanwise vorticity contours, (a) AOA = 10°, (b) AOA = 15°, and (c) AOA = 20°.
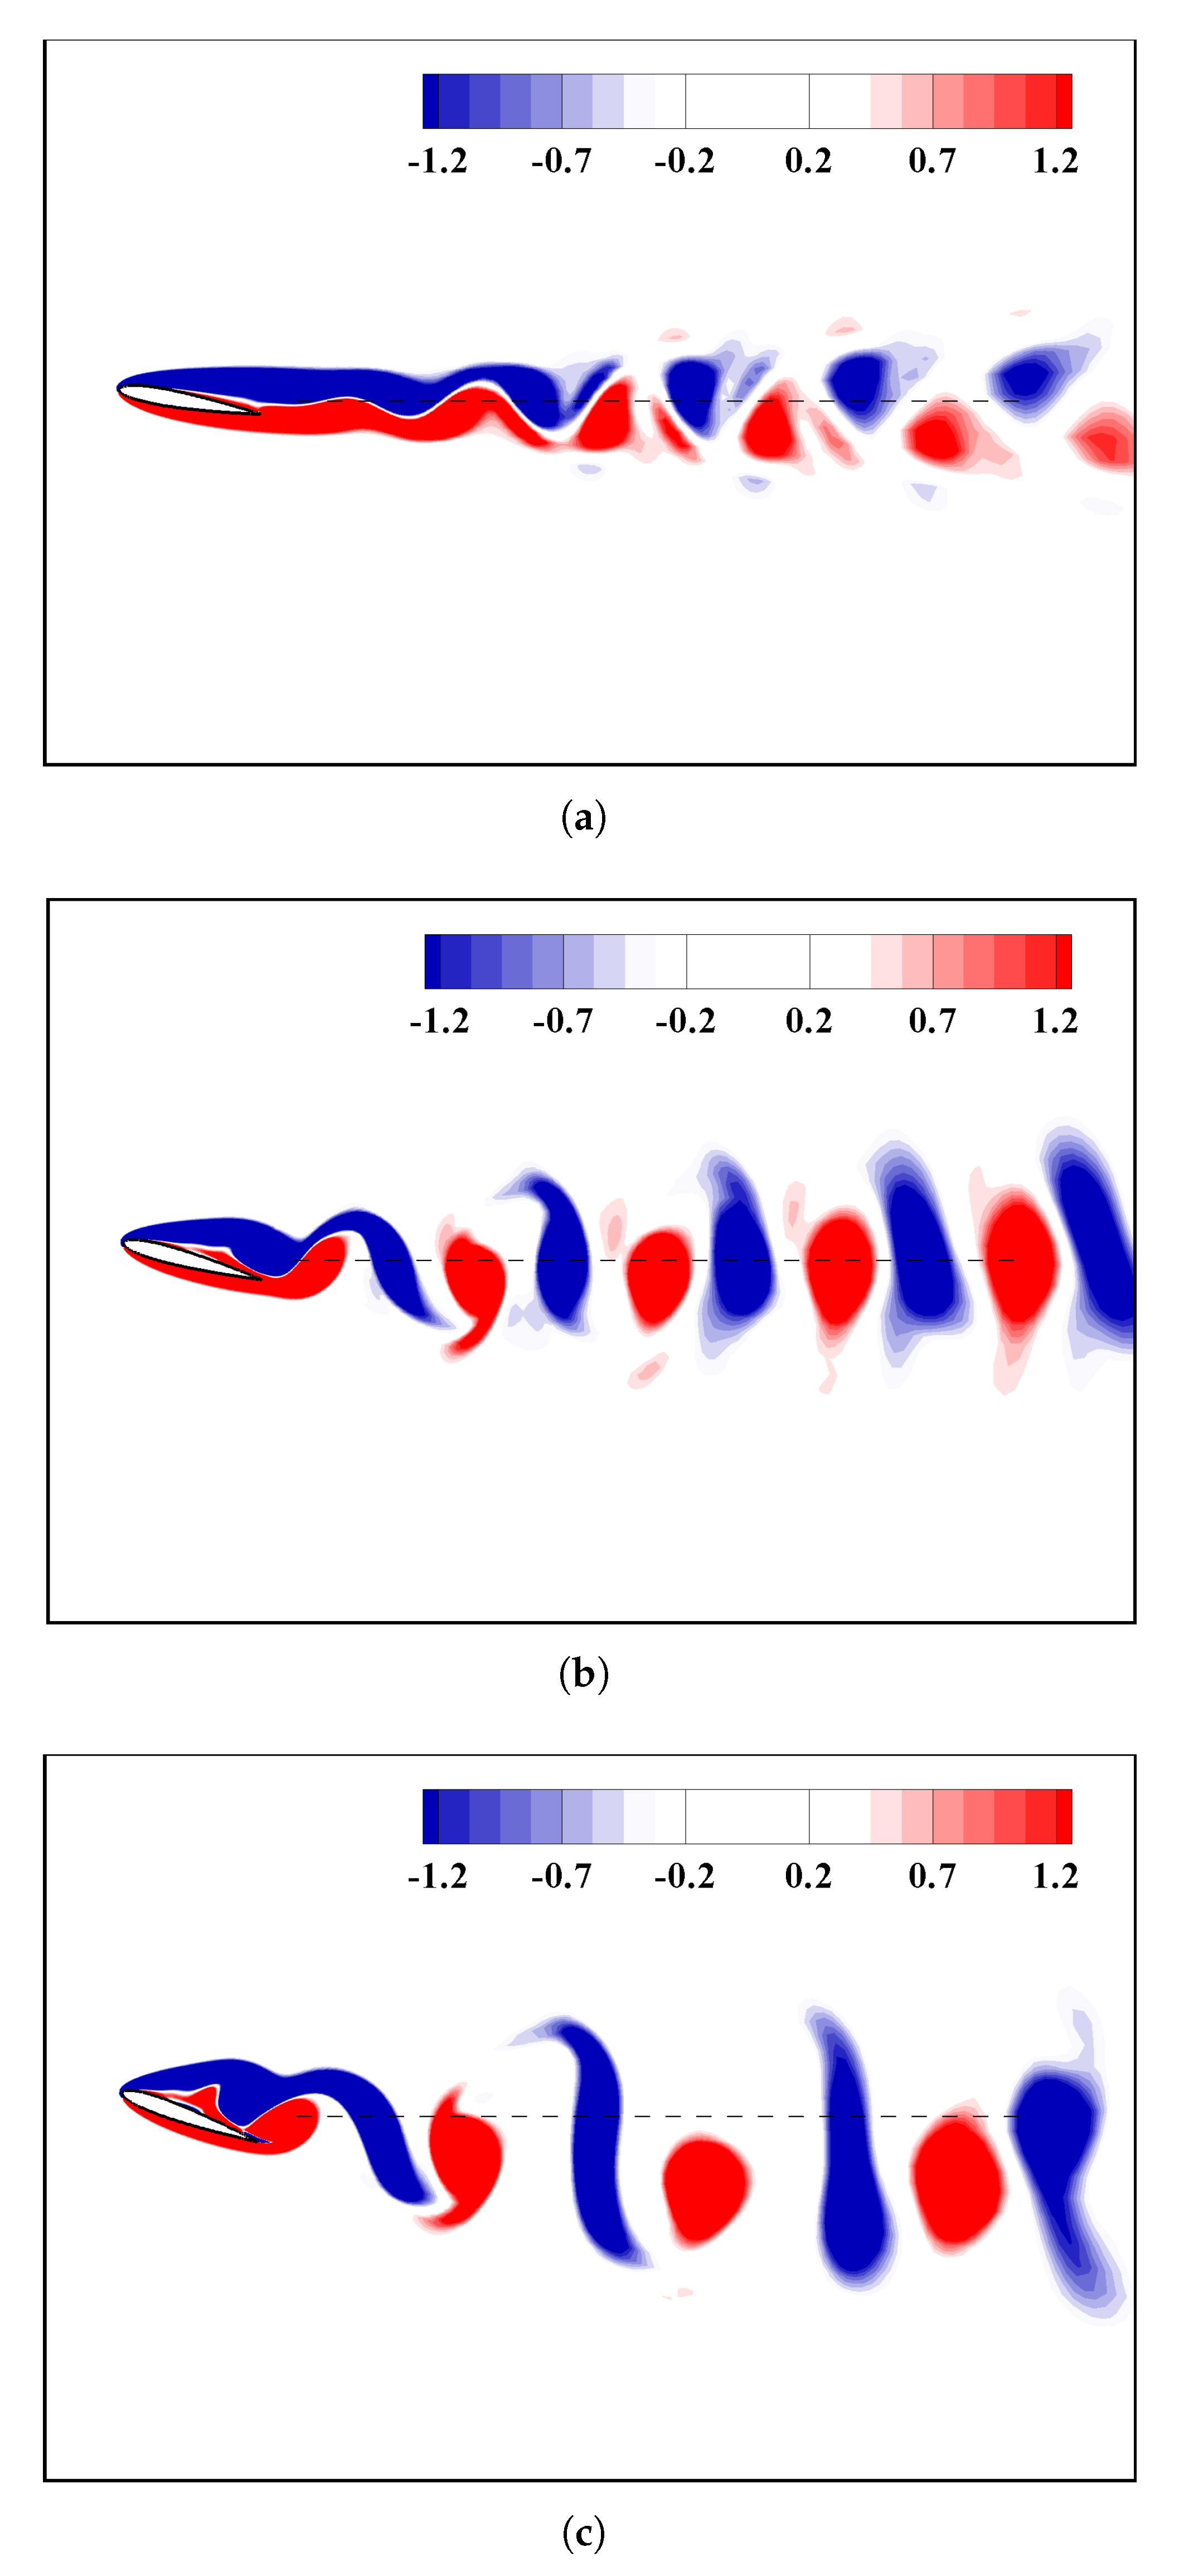
Figure 10.
(a) Normalized eigenvalues of pressure modes, (b) Cumulative effects of pressure eigenvalues.
Figure 10.
(a) Normalized eigenvalues of pressure modes, (b) Cumulative effects of pressure eigenvalues.

Figure 11.
(a,c,e) Mean pressure modes , (b,d,f) Surface modes ( ![Fluids 06 00332 i001]() ), along with dissection into (
), along with dissection into ( ![Fluids 06 00332 i002]() ) and (
) and ( ![Fluids 06 00332 i003]() ): AOA = 10°, 15°, and 20°, top to bottom.
): AOA = 10°, 15°, and 20°, top to bottom.
 ), along with dissection into (
  ) and (
  ): AOA = 10°, 15°, and 20°, top to bottom.
Figure 11.
(a,c,e) Mean pressure modes , (b,d,f) Surface modes ( ![Fluids 06 00332 i001]() ), along with dissection into (
), along with dissection into ( ![Fluids 06 00332 i002]() ) and (
) and ( ![Fluids 06 00332 i003]() ): AOA = 10°, 15°, and 20°, top to bottom.
): AOA = 10°, 15°, and 20°, top to bottom.
), along with dissection into ( ) and ( ): AOA = 10°, 15°, and 20°, top to bottom.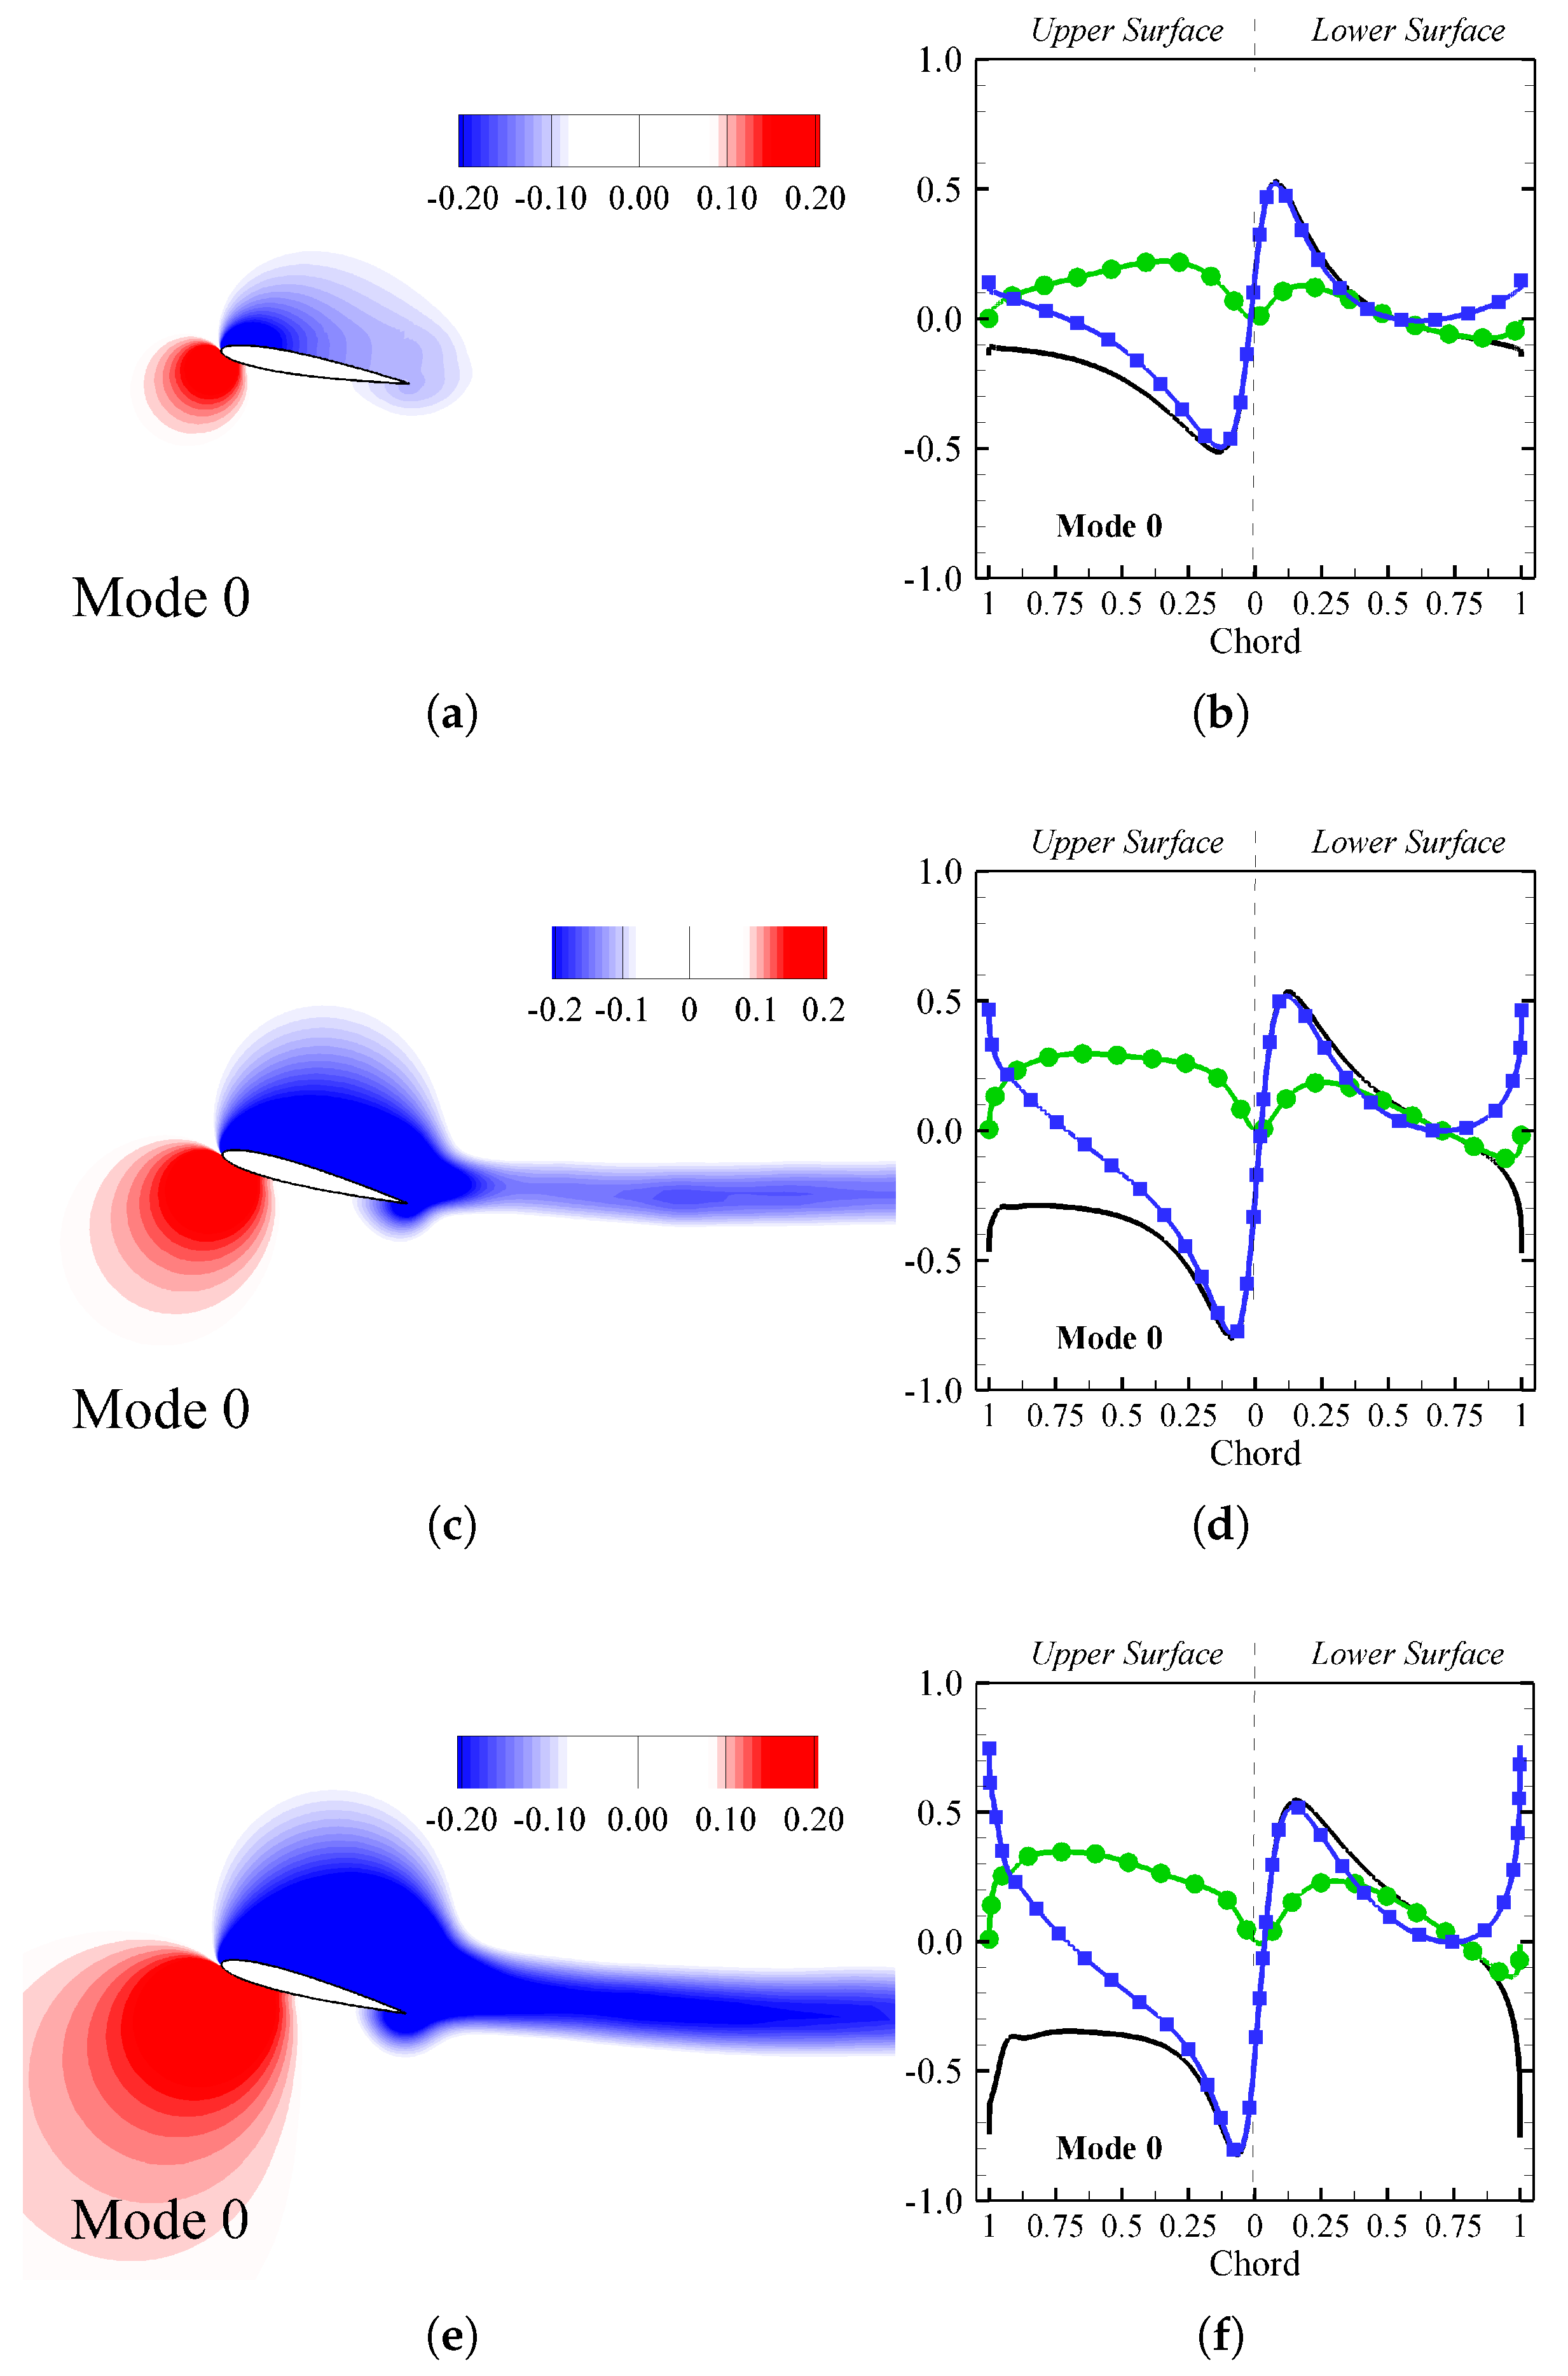
Figure 12.
First four surface pressure modes ( ![Fluids 06 00332 i001]() ), along with dissection into (
), along with dissection into ( ![Fluids 06 00332 i003]() ) and (
) and ( ![Fluids 06 00332 i002]() ): (
): ( ![Fluids 06 00332 i001]() AOA = 10°), (
AOA = 10°), ( ![Fluids 06 00332 i004]() AOA = 15°), and (
AOA = 15°), and ( ![Fluids 06 00332 i005]() AOA = 20°).
AOA = 20°).
), along with dissection into ( ) and ( ): ( AOA = 10°), (  AOA = 15°), and (
  AOA = 20°).
Figure 12.
First four surface pressure modes ( ![Fluids 06 00332 i001]() ), along with dissection into (
), along with dissection into ( ![Fluids 06 00332 i003]() ) and (
) and ( ![Fluids 06 00332 i002]() ): (
): ( ![Fluids 06 00332 i001]() AOA = 10°), (
AOA = 10°), ( ![Fluids 06 00332 i004]() AOA = 15°), and (
AOA = 15°), and ( ![Fluids 06 00332 i005]() AOA = 20°).
AOA = 20°).
), along with dissection into ( ) and ( ): ( AOA = 10°), ( AOA = 15°), and ( AOA = 20°).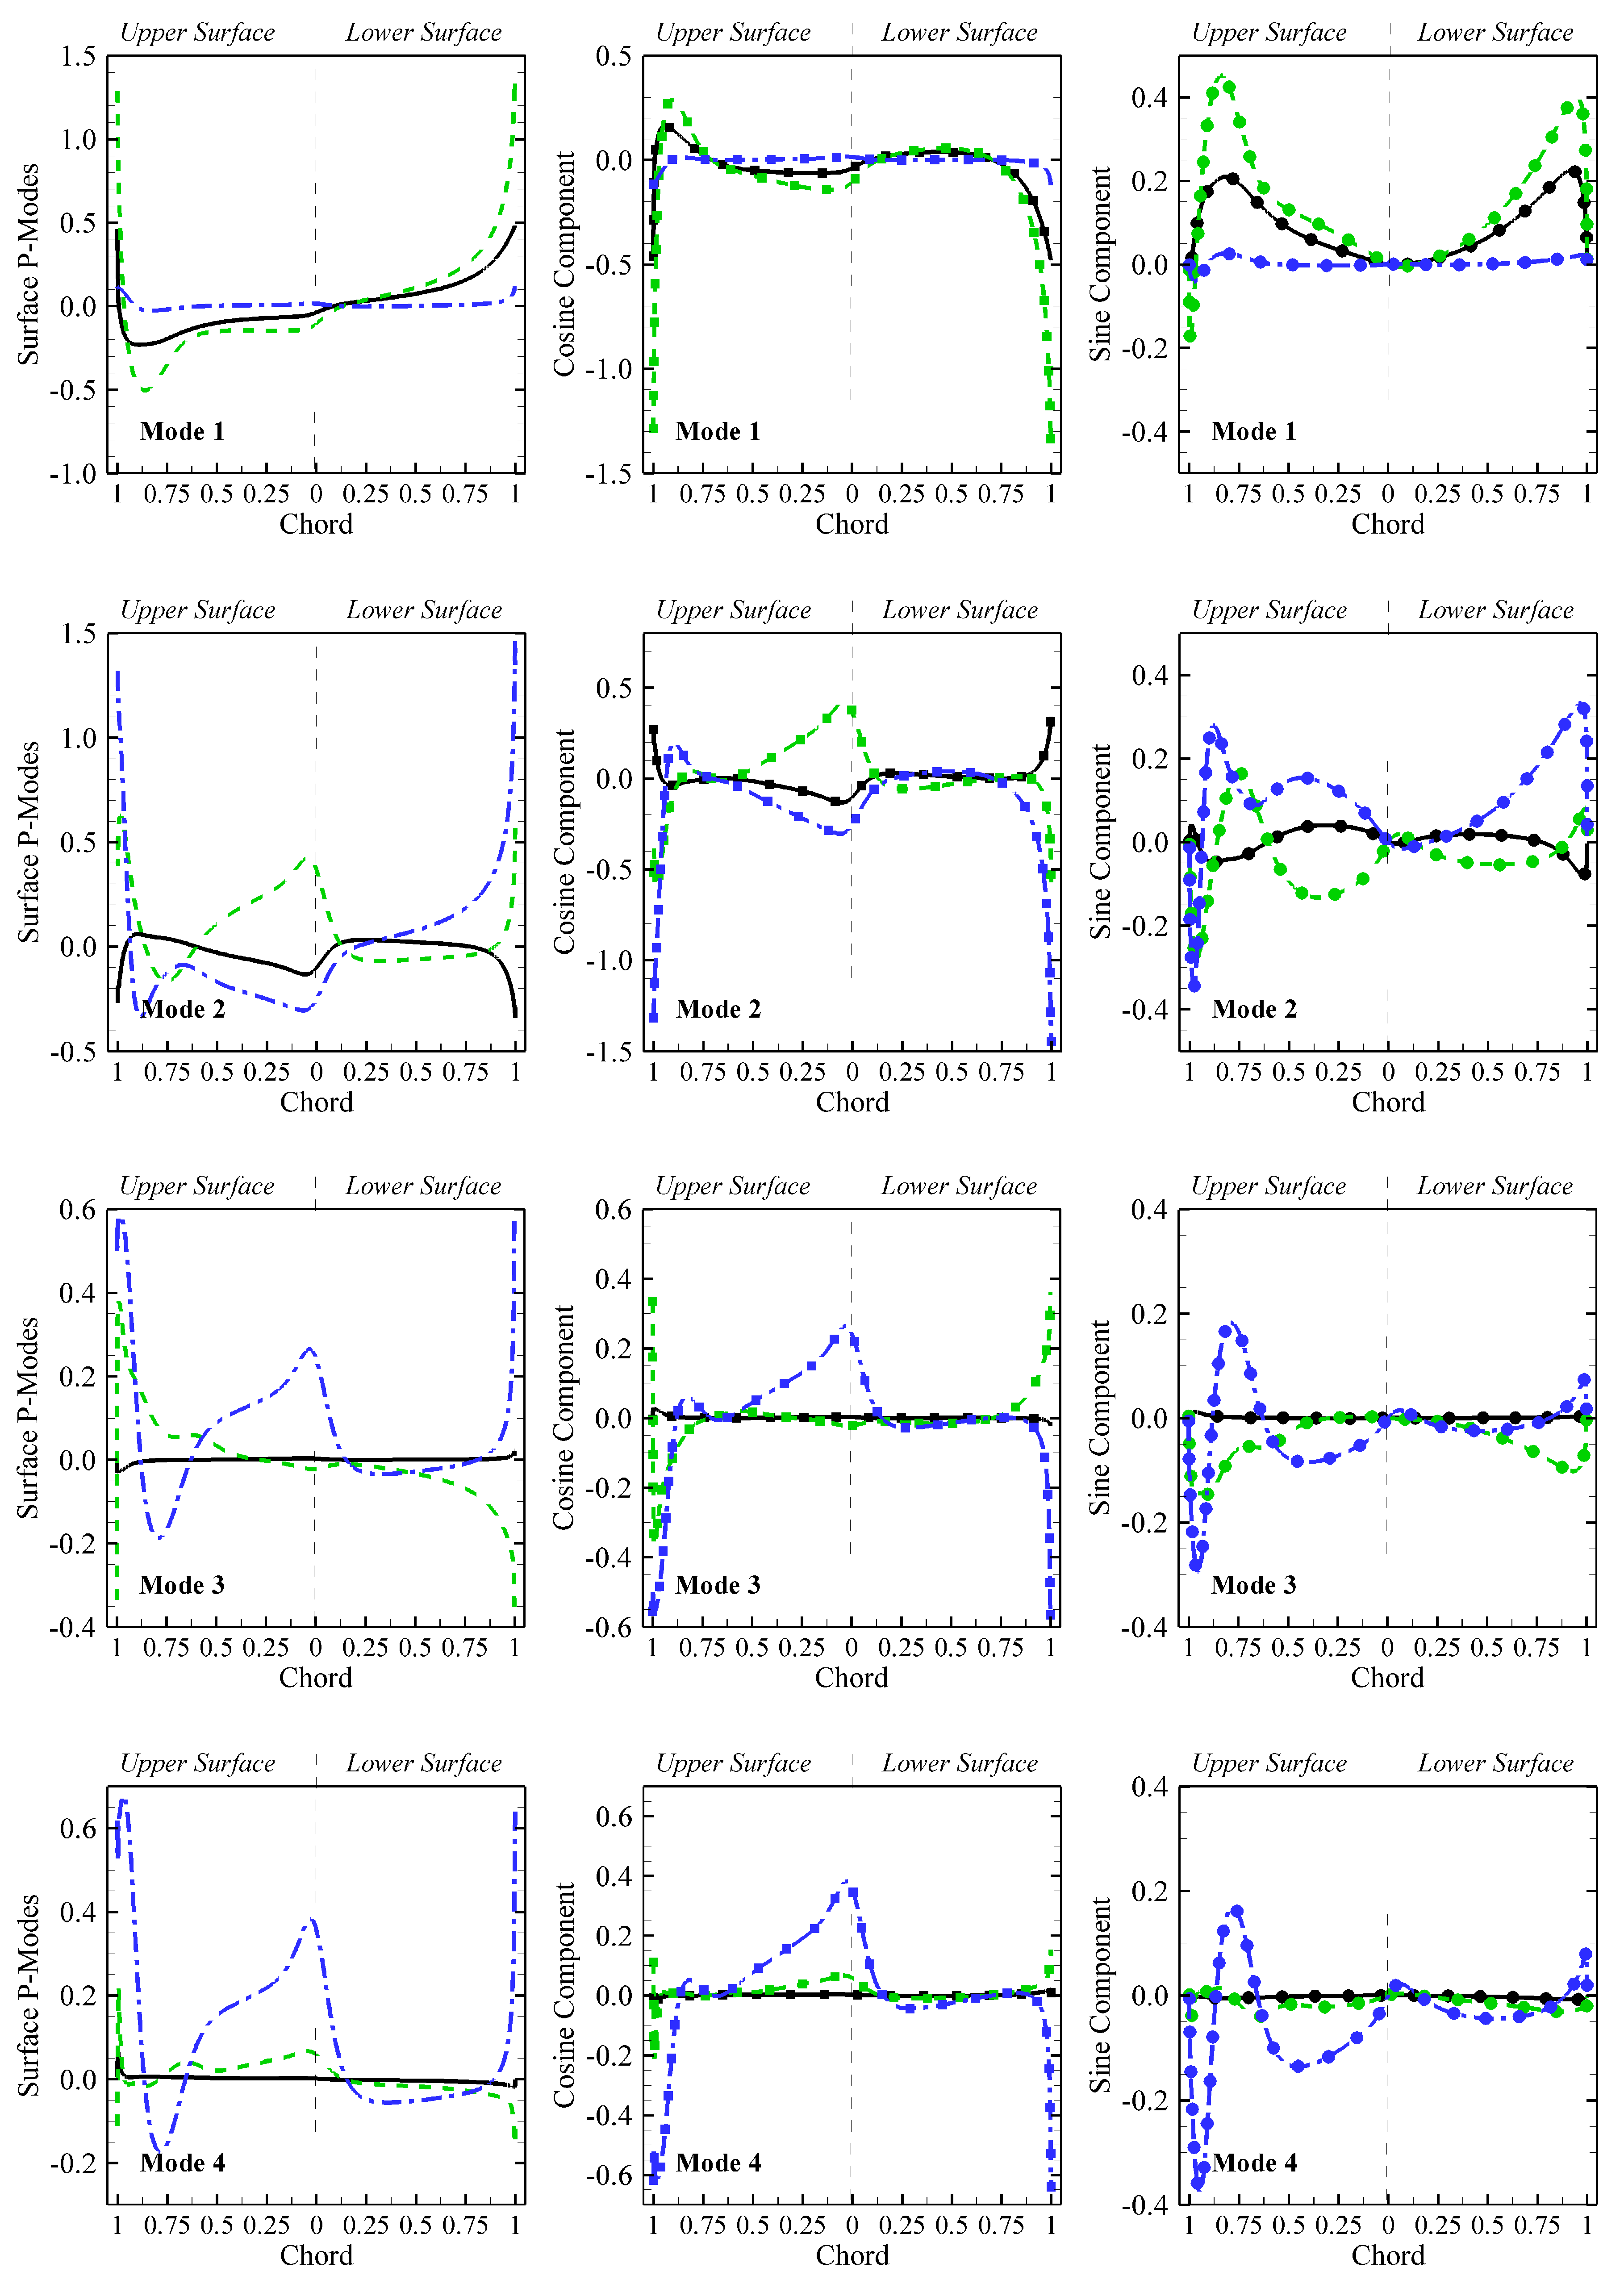
Figure 13.
(a,c,e) Magnitude of mean and the first ten LDC, (b,d,f) Magnitude of mean and the first ten DDC: AOA = 10°, 15°, and 20°, top to bottom.
Figure 13.
(a,c,e) Magnitude of mean and the first ten LDC, (b,d,f) Magnitude of mean and the first ten DDC: AOA = 10°, 15°, and 20°, top to bottom.
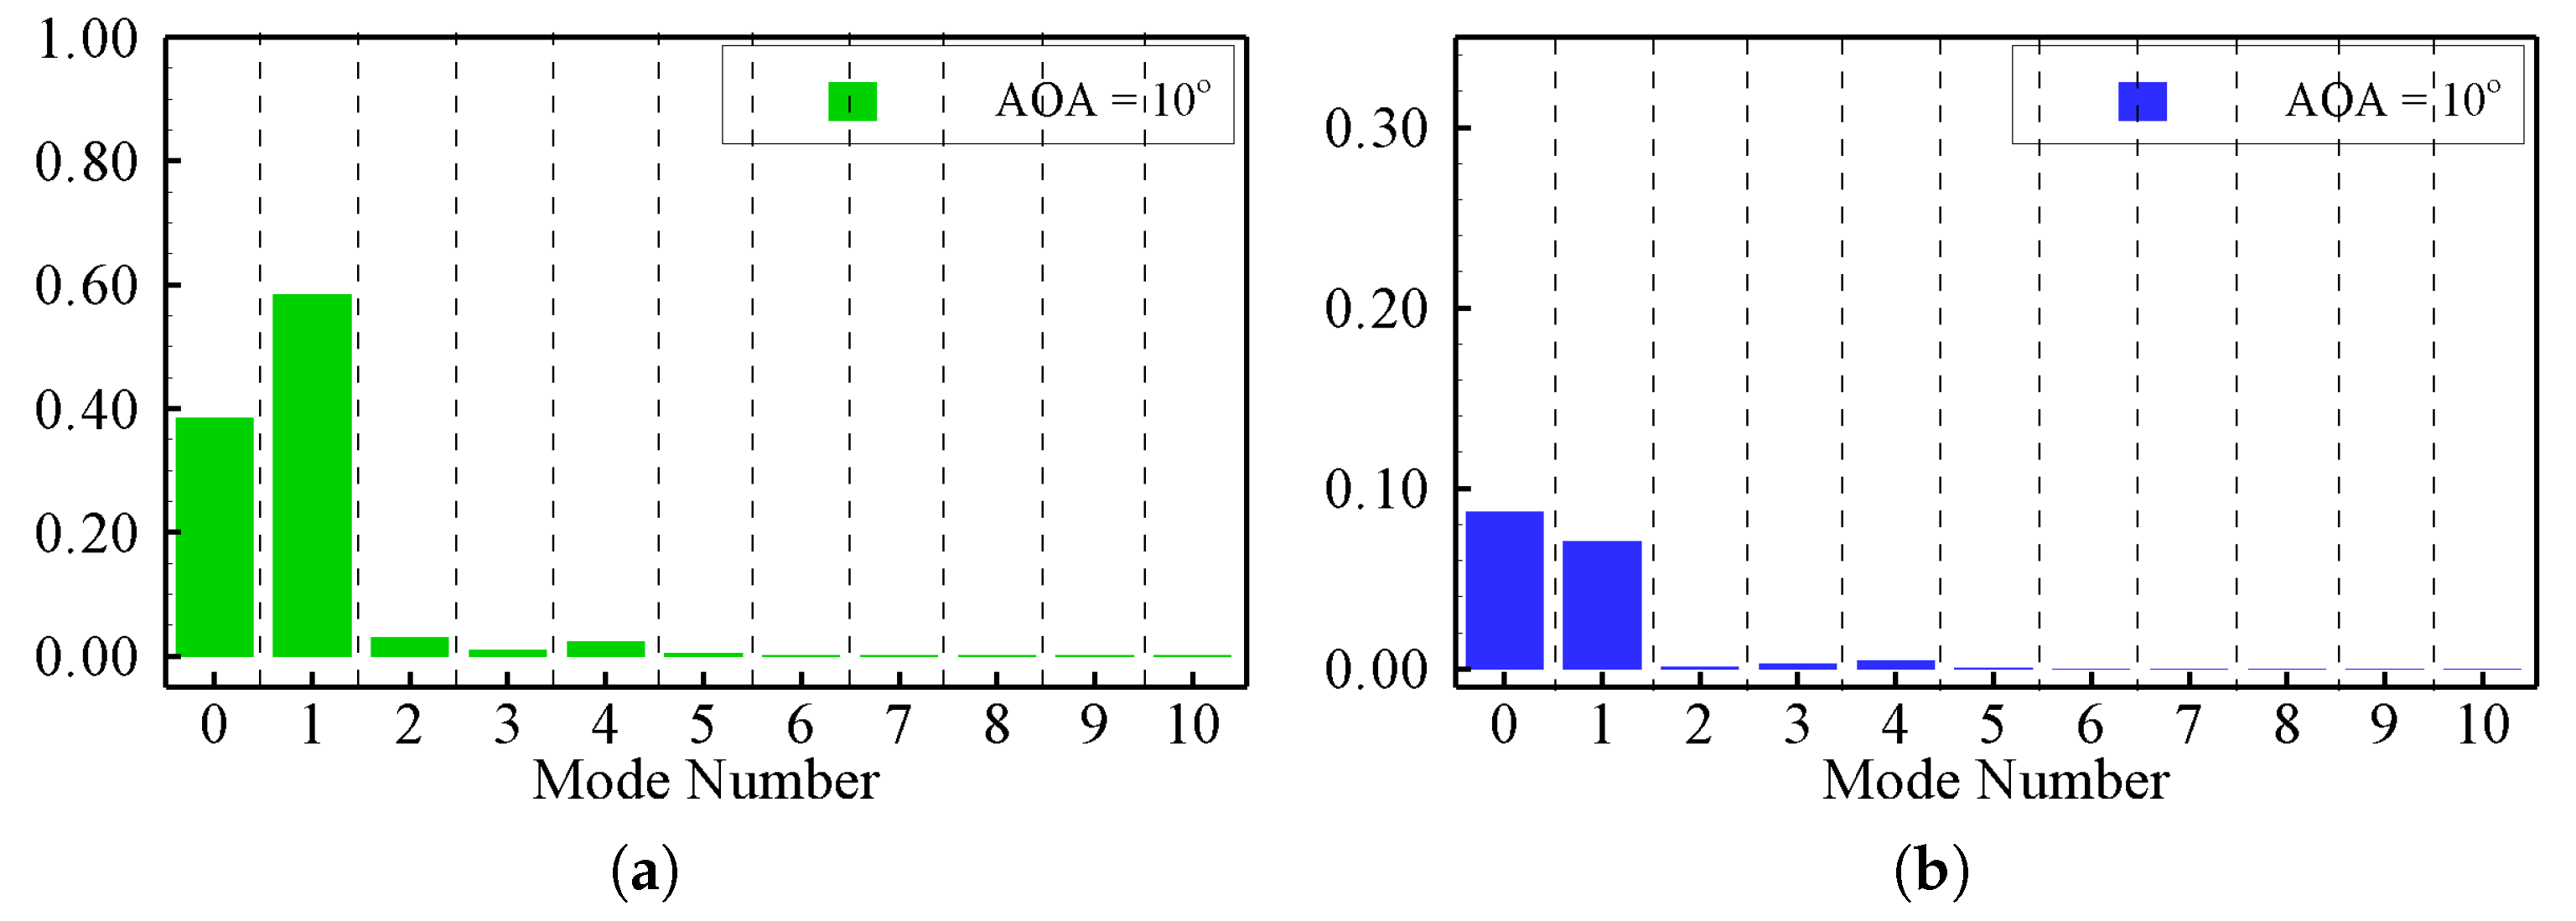
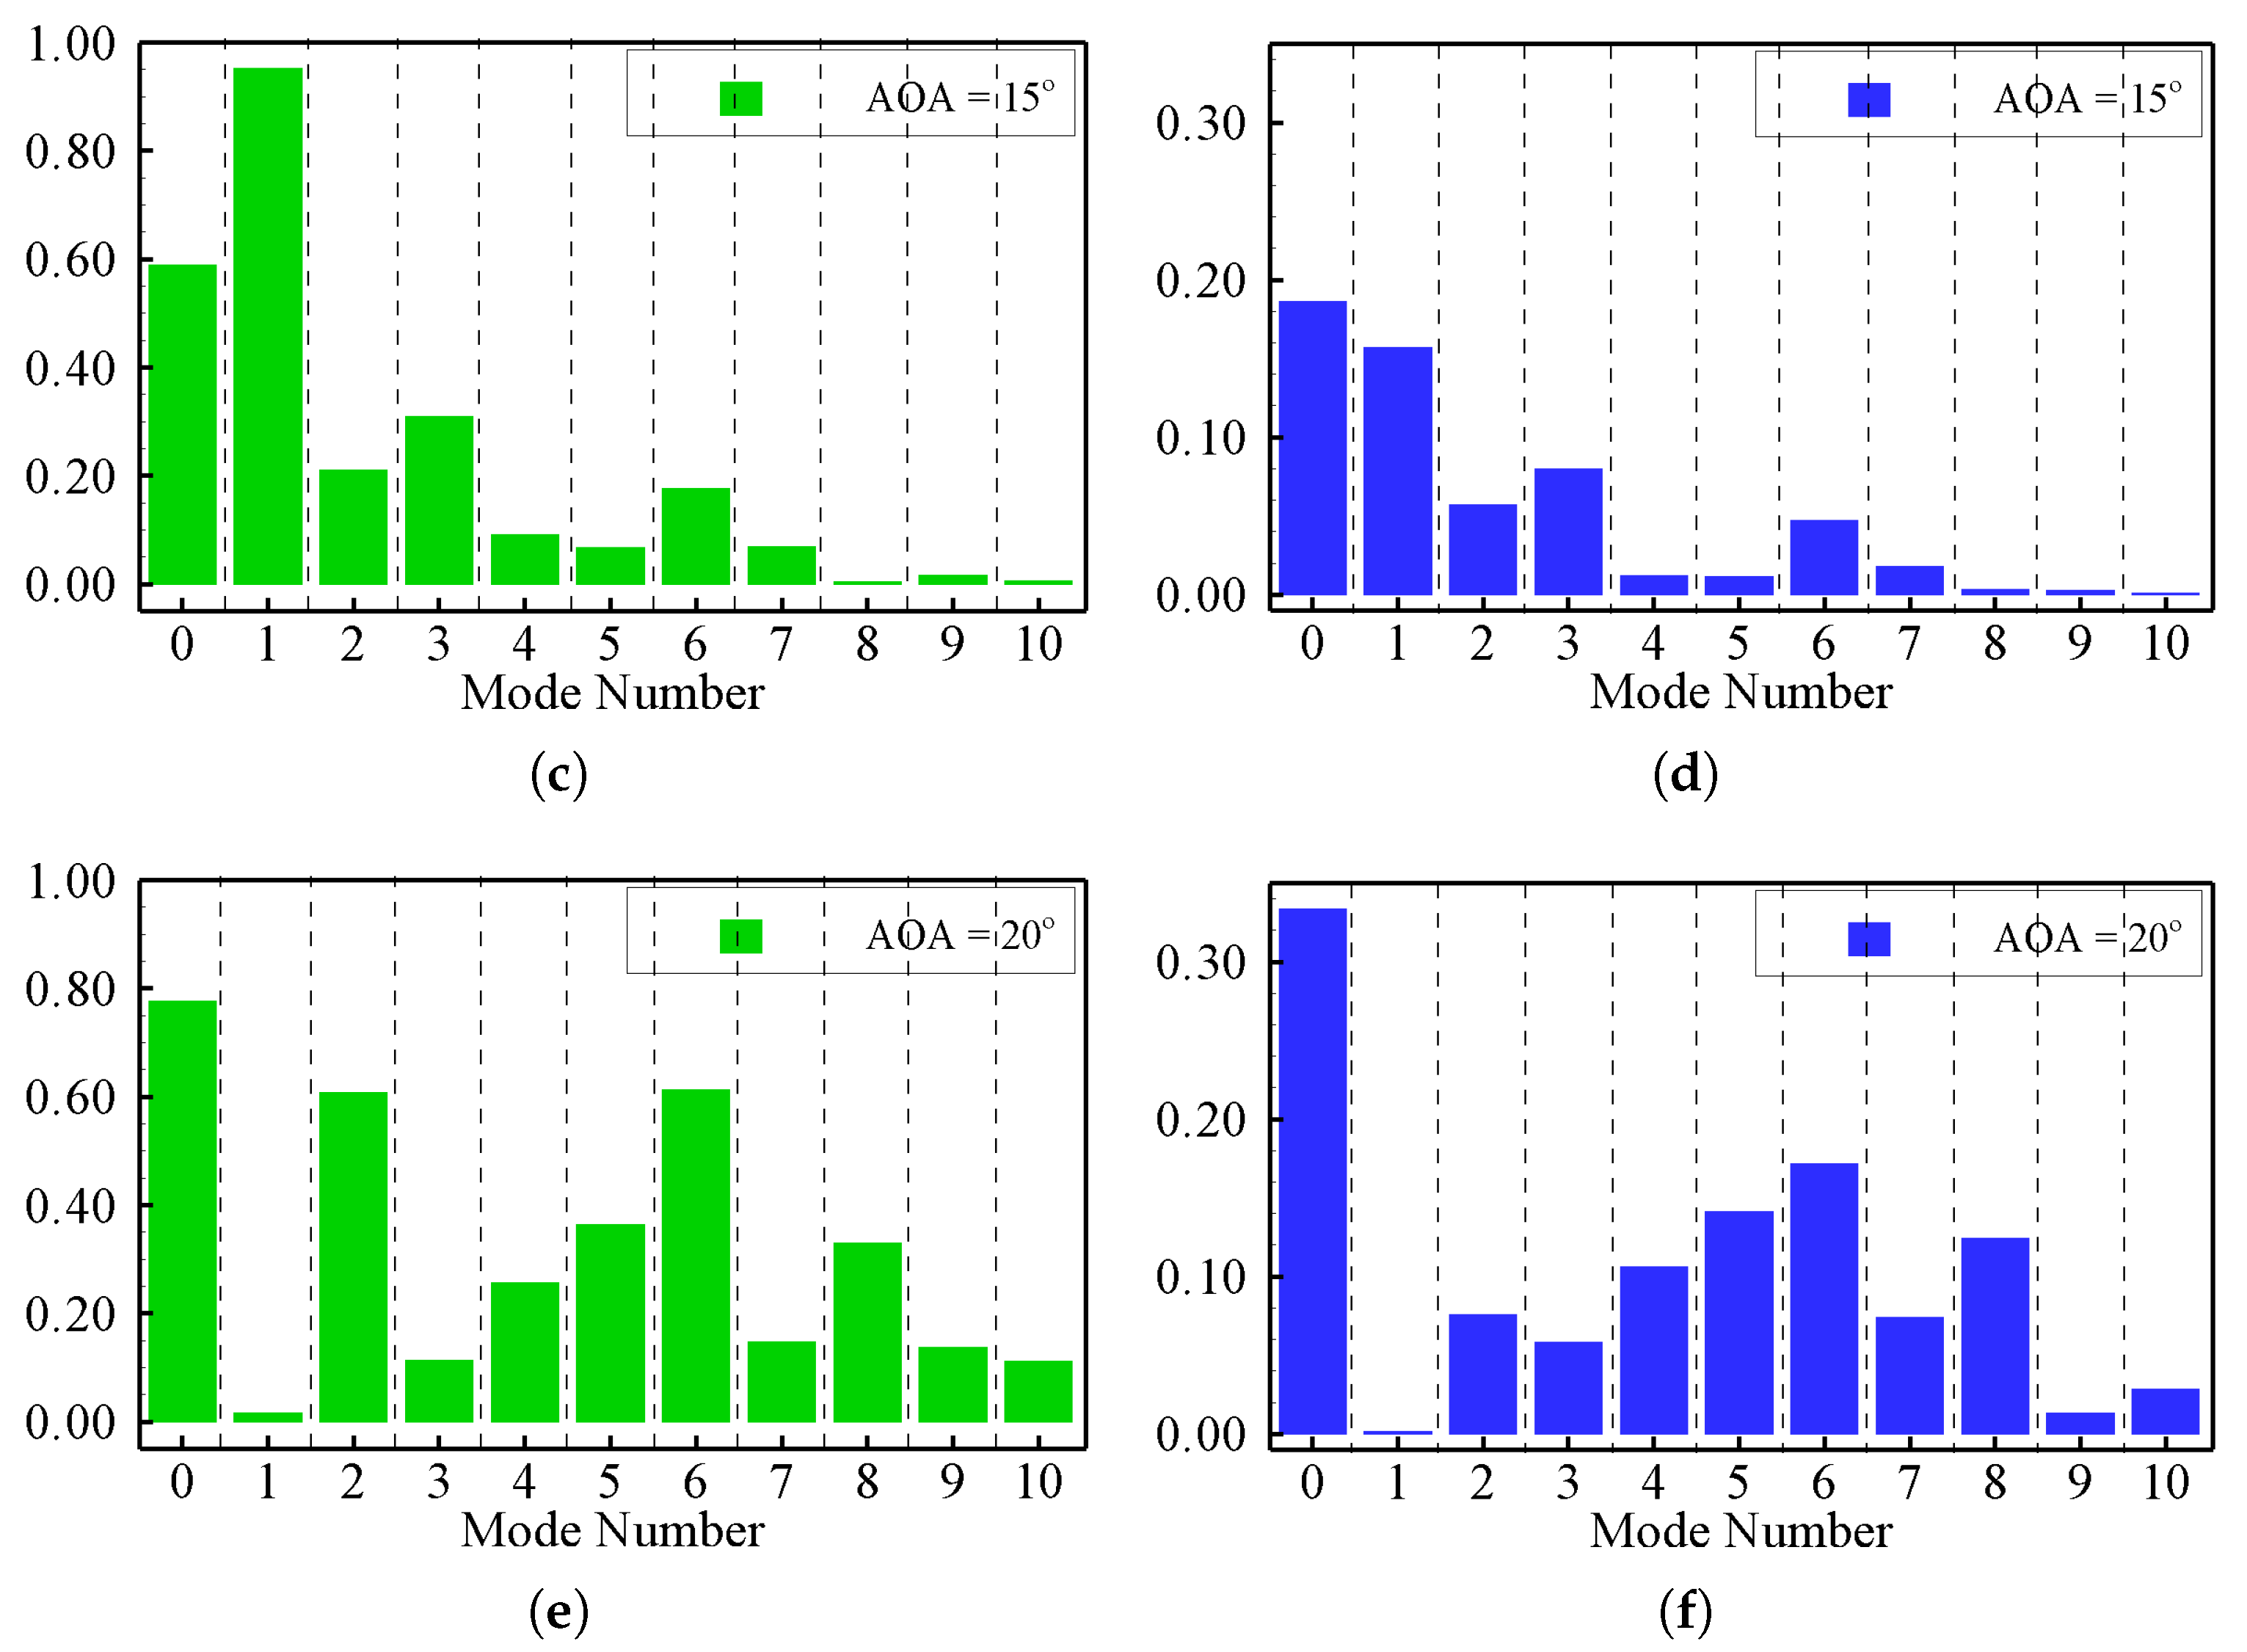
Figure 14.
(a) the first four pressure coefficient at AOA 10° (vertical black line indicates the train test split). (b) The first four pressure coefficients at AOA 15°. (c) The first four pressure coefficients at AOA 20°. (d) The first four pressure coefficients at AOA 12°.
Figure 14.
(a) the first four pressure coefficient at AOA 10° (vertical black line indicates the train test split). (b) The first four pressure coefficients at AOA 15°. (c) The first four pressure coefficients at AOA 20°. (d) The first four pressure coefficients at AOA 12°.

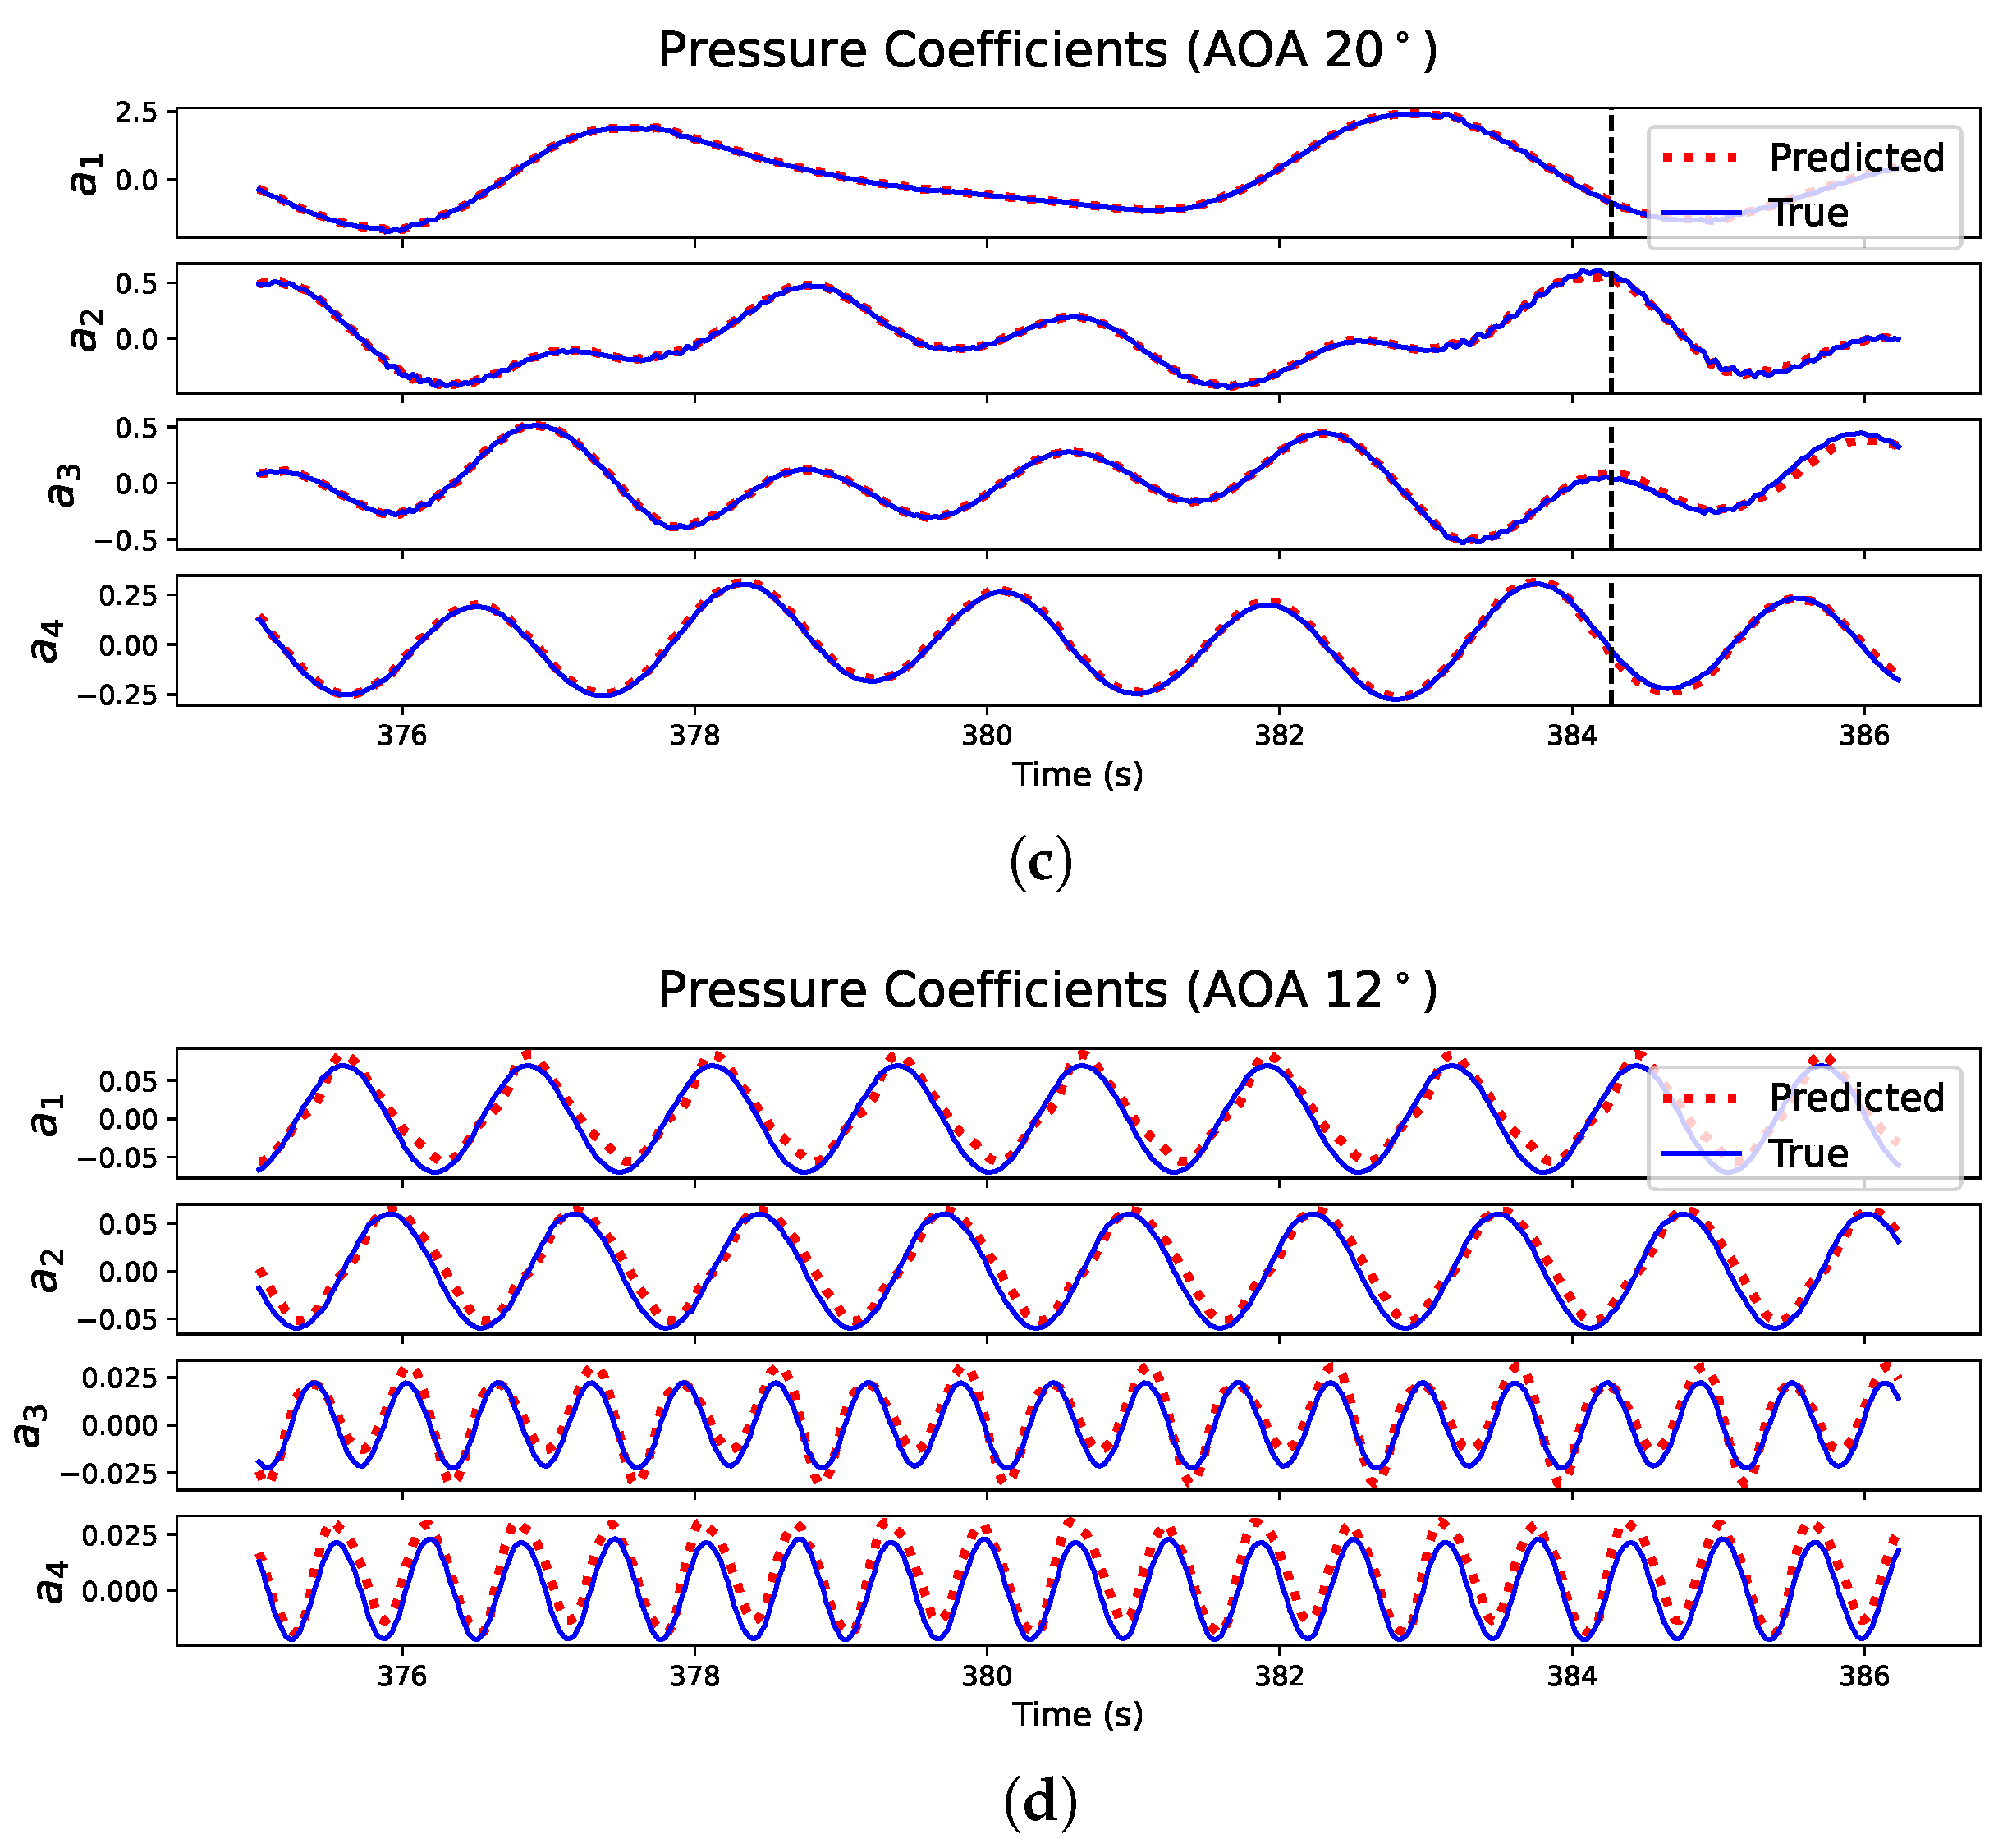
Figure 15.
(a) Lift coefficient prediction at AOA 10° using six modes. (b) Lift coefficient prediction at AOA 15° using six modes. (c) Lift coefficient prediction at AOA 20° using six modes. (d) Lift coefficient prediction at AOA 12° (out of sample data) using six modes.
Figure 15.
(a) Lift coefficient prediction at AOA 10° using six modes. (b) Lift coefficient prediction at AOA 15° using six modes. (c) Lift coefficient prediction at AOA 20° using six modes. (d) Lift coefficient prediction at AOA 12° (out of sample data) using six modes.
Publisher’s Note: MDPI stays neutral with regard to jurisdictional claims in published maps and institutional affiliations. |
© 2021 by the authors. Licensee MDPI, Basel, Switzerland. This article is an open access article distributed under the terms and conditions of the Creative Commons Attribution (CC BY) license (https://creativecommons.org/licenses/by/4.0/).
Share and Cite
MDPI and ACS Style
Farooq, H.; Saeed, A.; Akhtar, I.; Bangash, Z. Neural Network-Based Model Reduction of Hydrodynamics Forces on an Airfoil. Fluids 2021, 6, 332. https://doi.org/10.3390/fluids6090332
AMA Style
Farooq H, Saeed A, Akhtar I, Bangash Z. Neural Network-Based Model Reduction of Hydrodynamics Forces on an Airfoil. Fluids. 2021; 6(9):332. https://doi.org/10.3390/fluids6090332
Chicago/Turabian StyleFarooq, Hamayun, Ahmad Saeed, Imran Akhtar, and Zafar Bangash. 2021. "Neural Network-Based Model Reduction of Hydrodynamics Forces on an Airfoil" Fluids 6, no. 9: 332. https://doi.org/10.3390/fluids6090332