
Research Progress of Air Lubrication Drag Reduction Technology for Ships
College of Aerospace and Civil Engineering, Harbin Engineering University, Harbin 150001, China
*
Author to whom correspondence should be addressed.
Fluids 2022, 7(10), 319; https://doi.org/10.3390/fluids7100319
Submission received: 25 August 2022
/
Revised: 23 September 2022
/
Accepted: 29 September 2022
/
Published: 2 October 2022
(This article belongs to the Special Issue Aerodynamics and Aeroacoustics of Vehicles, Volume II)
Abstract
:Air lubrication is a promising drag reduction technology for ships because it is considered to reduce the skin-friction resistance of ships by changing the energy of turbulent boundary layers. Air lubrication drag reduction can be classified into: microbubble drag reduction (injection of microbubbles along the hull), air film drag reduction (using a larger film of air to cover the ship bottom), and air cavity drag reduction (recesses underneath the hull are filled with air). In this paper, the research progress of the air lubrication drag reduction technology is reviewed from experimental and numerical aspects. For these three drag reduction methods, based on the aspect of experimental research, the main research focus is the analysis and evaluation of the influencing factors such as the gas injection form and drag reduction rate; in terms of theoretical research, the accuracy of the simulation calculation depends on the selection of the theoretical calculation model and the analysis of the drag reduction mechanism. The paper introduces, in detail, the typical experimental phenomena and the theoretical results of a numerical study of three types of drag reduction methods, revealing the essence of air lubrication technology to achieve drag reduction by changing the physical properties of the turbulent boundary layer.
1. Introduction
Ship drag mainly includes friction drag, wave drag, and viscous drag. For surface ships, the friction drag usually occurs at the main part. Frictional drag arises from the viscous action between the water and the surface of a ship as it moves. Estimated for cargo ships, it accounts for 60–70% of the total drag. In a tanker estimation, it accounts for about 80% of the overall drag [1]. Therefore, how to effectively reduce the surface friction drag of ships is a major concern of the shipping industry.
Skin friction has been studied in two ways. First, the laminar flow control is related to the delay of transition. This is usually achieved by “filling it out“ to make the boundary layer velocity profile more stable near the wall. For example, hydrophobic coatings [2], surfactants [3], and water heating or air cooling on hull surfaces [4] have been used with great success in the laboratory. However, implementing these methods in practical applications has proved more difficult. The second one is about reducing the skin-frictional drag of the turbulent boundary layer. The skin friction is reduced by intervening and changing the turbulent boundary layer. This seems easier to implement in a real system. We already know that it is possible to reduce skin-frictional drag in turbulent boundary layers. For example, polymer, fiber, and particle solutions are effective drag reduction agents.
In the present study, we review one of the most promising drag reduction fields, namely, air lubrication drag reduction technology. According to the principle and form of expression of air lubrication drag reduction technology, it can be divided into MBDR, ALDR, and ACDR. The drag reduction mechanism and influencing factors of the three types of air lubrication drag reduction methods are analyzed and compared from the two aspects of experimental and numerical investigations, and some experimental and theoretical results are summarized, whereas the prospect of air lubrication technology is forecasted. This paper is divided into five parts. The first part is the introduction. In the second part, the air lubrication drag reduction technology is classified. In the third part, the test methods of different kinds of air lubrication drag reduction technologies are introduced. The influencing factors of MBDR, ALDR, and ACDR are analyzed by means of ship model tests. In the fourth part, the numerical research models used in different types of air lubrication drag reduction technologies are introduced, and the drag reduction mechanism of MBDR, ALDR, and ACDR is analyzed by a numerical method. In the fifth part, the air lubrication drag reduction technology is summarized.
2. Classification of Drag Reduction Techniques for Air Lubrication
Air lubrication drag reduction technology can be divided into microbubble drag reduction (MBDR), air layer drag reduction (ALDR), and air cavity drag reduction (ACDR). In MBDR, microbubbles are introduced into the boundary layer at the bottom of the hull, which are considered to reduce the frictional drag by a reduction in bulk density and by modifying the momentum transport. In ALDR, a continuous gas film separates the liquid from the hull, thereby reducing friction. It is found that the film is always present far downstream of the gas injection point. In ACDR, a thick groove filled with gas separates the liquid from the hull, thus reducing friction in the groove area. The closed cavity is designed to minimize air loss. If the flow is high enough and there is a physical cavity boundary, an air cushion is formed and the air–water interface is considered horizontal.
Several modes of air lubrication drag reduction can be represented in Figure 1 (adapted from [4]), which includes MBDR (Figure 1a), the transition drag reduction between the microbubble and air layer (Figure 1b), ALDR (Figure 1c), and ACDR (Figure 1d). The regime is controlled by the energy flux injected into the air, which is determined by the flow and pressure relative to the bottom of the hull. In the MBDR and ALDR modes, the air is presented as discrete microbubbles or as an air film near the surface. Bubbles undergo an evolutionary process as they move downstream, including splitting, merging, vertical vibration, and shedding in different directions. In general, MBDR and ALDR can be generated by air injection through the same physical equipment. When the air flux is small, it is MBDR, and when the air flux is large, MBDR will convert to ALDR. Therefore, the formation of ALDR depends on the air flux. In MBDR mode, the air exists in the form of an individual bubble, which is typically on the order of microns or millimeters in diameter. In the ALDR mode, a continuous air film is formed near the surface. Both MBDR and ALDR can be called foam flow drag reduction, but there are real differences between them, such as the overall level of drag reduction and the distance of downstream drag reduction from the injection points. In general, the MBDR mode is considered when the total value of drag reduction is less than 0.25, and the ALDR mode is reached when the total value of drag reduction is greater than 0.80. There may be a transition state between the two, as shown in Figure 2 [5]. The local turbulent boundary layer can be completely changed by increasing air flux. Bubbles close to the surface of the hull merge into an intermittent air film due to buoyancy. After covering the hull with a local air film, the drag reduction level is significantly improved. Intermittent air bubbles are connected together to form continuous air films at higher air fluxes and convert MBDR to ALDR. ACDR has a distinct gas–water interface, which is not found in MBDR and ALDR modes. Due to the rear step design, the pressure inside the cavity is less than outside the cavity, which results in a water–air interface. Drag reduction is closely related to the local void fraction, which is determined by the volume flux of the air injection.
3. Experimental Study on Drag Reduction by Air Lubrication
This section is divided by subheadings. It provides a concise and precise description of the experimental results, their interpretation, as well as the experimental conclusions that can be drawn.
3.1. Air Injection Method
As early as 1973, McCormick and Bhattacharya [6] reported the first microbubble experiments to reduce drag. The gas injection method is a worthy study direction. For large ships operating at low speeds, such as a ship of 110 m long and at a speed of 18 Kn, the Froude number is about 0.15. In this case, the water frictional resistance accounts for 65–70% of the total resistance; thus, reducing friction is a key means of reducing the power required to drive the ship. When injecting air between the bottom of a ship and the water, there are three possibilities for reducing friction: 1. bubbles can be pumped from a set of nozzles or porous plates, or they can be generated using the Kelvin–Helmholtz instability; 2. air sheets are drawn from the slits to form a film; or 3. air can be pumped into the shallow cavity to form a thin air layer or cushion. For the three modes of air lubrication drag reduction, the air injection methods are also different.
3.1.1. Microbubble Method
Because of the small amount of air flux required, MBDR can be considered through various forms of bubble generation and air injection. In addition to artificial ventilation to generate bubbles, hydrogen generation by electrolysis of water is also a common way to generate bubbles. McCormick and Bhattacharya (1973) used an axisymmetric body with a maximum diameter of 127 mm and a length of 915 mm in their experiments. Total drag was measured by dragging the body through the tank at speeds ranging from 0.3 to 2.6 m/s. In the boundary layer, hydrogen was produced by passing an electric current through copper wires that wrap around the hull. The number of coils, their position relative to the body’s nose, and the surface area they extend were all varied. It was estimated that the volume flow rate of the gas varied from 1.35 to 4 × 10⁻⁴ m3/s. A common form of air injection for MBDR is to install nozzle ventilation on a porous plate. This method has been used in a large number of experiments and has been applied to real ships. The Mitsubishi Heavy Industries (MHI) Air Lubrication System [7] used nozzles to create a bubble-like air layer that persists along the bottom of the hull. The forms of air vents are shown in Figure 3 (adapted from [11]). Air is delivered to a rectangular plenum mounted inside the hull’s bottom plate, which has a series of staggered air delivery holes. They proposed that elongated holes can provide the necessary volume flow while minimizing the impact on the structural strength of the ship because they can be thinner in width than round holes.
The foreship also used similar methods for air injection [8], as shown in Figure 4 (adapted from [8]). The ventilation system consisted of a series of plenum chamber groups along the center line of the bottom of the hull, providing air through a specially shaped nozzle array on a bolted nozzle plate flush with the bottom of the hull, as shown in Figure 4a,b. Baffles were provided in the plenum chamber to ensure uniform flow through the nozzle array.
Another approach is to generate small diameter bubble flows by utilizing the Kelvin–Helmholtz instability. The MBDR of the Silverstream System [9] delivered bubbles to the underside of the hull through a longitudinal air transport chamber by utilizing the Kelvin–Helmholtz instability. Because of the draft, the air was fed into the delivery chamber at a pressure and volume that matches the pressure at the bottom of the ship. The geometry was arranged in such a way that as the vessel moves forward, the flow of water brings air into the boundary layer and, using the Kelvin–Helmholtz instability, vorticity produces a flow of bubbles with a small diameter. Silverstream’s research found that careful adjustment of flow and pressure to ensure interfacial mixing at the interface between the laminar and turbulent boundary layers can produce a continuous flow of very small bubbles in a layer with up to 1 mm thickness that can last the entire length of the ship. The air release devices were designed to avoid obstructing the air–water interface and to promote stable interactions between the water flowing over the hull surface and the air flowing into the boundary layer, supporting the Kelvin–Helmholtz instability effect and minimizing the energy required to produce the bubble carpet by using the boundary layer flow itself. Kumagi et al. [6] in Japan also studied the method of using Kelvin–Helmholtz instability to generate microbubbles. Slotted air release vents with aerofoils were placed below the slots to create conditions for bubble generation. The researchers called their device the Winged Air Sensor Tube (WAIP). The system principle is shown in Figure 5 [10]. The slots are mounted on the hull surface, with an aerofoil section NACA 653-618 mounted below the surface level at an angle of attack of 12°. When water flows past the hydrofoil and the slot, the water flow is redirected and the pressure above the foil is reduced, thereby pushing air into the bottom of the hull. As water flows slowly beneath the hydrofoil, the water above it speeds up and creates vortices downstream of the foil. Therefore, there are mechanisms that assist with bubble formation in the flow at both the gas–water interface and behind the trailing edge. Without the need for porous materials and overpressure to create bubbles, the air can flow with the small bubbles created by the instability.
Furthermore, the size and the flow rate of the injected bubbles also affects the drag reduction rate. The effect of the injection bubble size and flow rate was studied [11,12], and the experiment results showed that smaller bubble diameters (0.3–0.5 mm) have the best drag reduction effect. However, using MBDR to reduce hull friction is problematic because bubbles tend to migrate from the near-wall region of the hull under the influence of local shearing and mixing, and even when the air is injected below the horizontal surface, buoyancy tends to force the bubbles closer to the wall. As a result, the durability of the pure MBDR is poor and MBDR requires an excessive number of locations for gas injection on the hull.
In the study of MBDR, there are various gas injection methods, including the traditional air injection by a booster pump, an electrochemical reaction, or bubble generation by using the Kelvin–Helmholtz instability. Controlling the volume flow rate and energy flux is the key to reduce the skin-friction drag of the hull.
3.1.2. Air Layer and Air Cavity Method
Due to the high air flux required by ALDR and ACDR, it is very important to select appropriate air injection methods in order to maintain the shape of the air layer and air cavity. In the early study of air injection methods, Matveev et al. [13] and Abolfazls et al. [14] set a circular air injection hole at the bottom of the plate, so that the output air diffused naturally to both sides and covered the bottom of the plate. This method required large air flux, but limited air layer coverage. Kiharju et al. [15] and Kiharju et al. [16] studied the simultaneous injection of multiple circular jet holes (see Figure 6 [15]). The cavitation topology caused by the cross flow of the porous gas-injected liquid was examined. However, the presence of multiple holes resulted in complex interactions between injected cavitation, resulting in low jet efficiency.
With a deeper understanding of the research, Zverkhovskyi [17] changed the direction of the incident air through the baffle to form a slotted nozzle, which made the air injected at the same time more uniform and achieved a better airflow input effect, as shown in Figure 7 (adapted from [17]). Wu et al. [18] divided the jet hole into the left, middle, and right chambers to supply different gas flows, as shown in Figure 8 (adapted from [18]). This method of air injection can achieve higher gas-layer coverage. The air flow rate was controlled by a valve and measured by a Dwyer RMA-1 flowmeter [19]. Huang et al. [20] conducted a comparative study on orifice plates with different air injection diameters, orifice span spacings, and orifice numbers, and the results showed that the orifice plate with an orifice diameter of 2 mm, orifice span spacing of 10 mm, and orifice number of 75 had the best drag reduction effect.
By optimizing the air injection methods, the output air can be more uniform, the interference between the output air can be avoided, and the air injection efficiency can be improved. Jang et al. [21] proposed the method of multipoint injection. Air was injected through an array of holes on the base plate of each air injection unit according to the air supply chain, as shown in Figure 9 (adapted from [21]). Air compressed by an air compressor was stored in the air receivers on the deck of the model ship and the flow rate of the air supplied to the air injection units was adjusted by PC-controlled mass flow meters.
Sindagi et al. [22] conducted an experimental investigation on a 1:23 scaled model of an 8000 tonne deadweight bulk carrier with a Froude number range from 0.06 to 0.18. For each operating speed, the effects of different air injection rates from 0.5 to 3.0 cubic feet per minute (CFM) and different sizes of injection holes were studied in depth. Injection holes were 1 mm, and for selected hulls, Froude numbers ranging from 0.08 to 0.17 were considered appropriate to achieve considerable energy savings. For the Froude number of 0.09, in general, a jet hole of 2 mm in diameter typically reduced the drag and required more energy to run the model. At higher operating speeds, injecting bubbles through larger jet holes could have destroyed the favorable turbulence layer, thereby resulting in a reduction in the percentage of drag reduction. Lee [23] studied the influence of air flux distribution on the drag reduction rate. A model ship (scale ratio λ = 33.33) of a 50,000 ton medium tanker was fitted with an air lubrication system. The experiment was conducted in a 100 m-long towing tank facility at Pusan National University to study the effect of air injection on drag reduction rates. In the single injection scheme of the experiment, the nozzle types were: longitudinal slots, spanwise slots + air fences, porous plates, and porous plates + air fences. The test conditions included that the equivalent air film thickness was 0, 7, and 10 mm. Additionally, the flow distribution was 5:5, 7:3, and 3:7. The results showed that the scheme with the equivalent air layer thickness of 10 mm and the air flux distribution ratio of 3:7 had the best drag reduction effect, and the value was 8.95%. This series of experiments confirmed that air injection at multiple locations is more effective than a single injection. However, drag reduction and net energy saving effects are not obvious. This is partly due to the increased drag of the air fences used in this study. In most cases, using air fences can increase the stability of the air layer, but cannot achieve effective drag reduction.
In ALDR and ACDR, the optimization of air injection forms distributes the input air flow, and the air layer is distributed more reasonably and covers a large region, thus improving the efficiency of air injection. The optimization of the size of the injection hole can effectively reduce the sailing drag of the hull and the power consumption of the air lubrication system.
3.2. Ship Model Test
As a simplified ship model, the plate test is often used to study the influencing factors of microbubbles, the air layer, and the air cavity structure on the drag of the ship. According to the plate structure, researchers have studied the influence of the air flow rate, the flow velocity, the groove depth, and the air cavity number on drag reduction performance and the causes of related physical phenomena. Based on the results of the plate test, the researchers carried out more complex ship model tests to study the influence of the air cavity structure design, the air flux, and the incoming flow velocity on the drag of the ship.
3.2.1. Experimental Analysis Method for Drag Reduction Mechanism of Gas Lubrication
The drag reduction phenomenon caused by air injection can be directly observed and analyzed by the ship model test. Park et al. [24] studied the structural changes of vortex flows in the bubble flow turbulent boundary layer by using vortex structure imaging technology. It was found that injected bubble swarms consist of large bubbles at the front and small bubbles at the tail. The leading air films have a higher advection speed than the smaller bubbles, and the fluctuation of the local void fraction will occur even in the swarm after the film is broken into small bubbles. The vortex structure caused by bubbles changes the turbulent momentum transfer in the boundary layer, resulting in the reduction in turbulent frictional stress. Paik et al. [25] used particle image velocimetry (PIV) technology to study the turbulent boundary layer of microbubble flow under a two-dimensional flat plate and conducted a quantitative visualization of the bubble velocity field. The behaviors of the microbubbles were visualized quantitatively by using the conventional PIV technique with a field of view of 200 mm2. In the buffer layer and viscous sublayer, the local two-dimensional void fraction was about 3.5%, resulting in a reduction in friction resistance. The existence of microbubbles in the turbulent boundary layer could reduce the turbulence generated by the Reynolds stress. In addition, when the Reynolds number is close to 106, the fluctuating motions of bubbles in the vertical direction of the buffer layer can effectively reduce the friction drag. Park et al. [26] conducted a ship model towing test. Frictional drag reduction due to bubble lubrication was investigated by measuring liquid films creeping along a wall within a two-phase turbulent boundary layer. The results showed that the liquid film thickness ranges from 500 μm to 1200 μm, located at the buffer layer that borders the log-law region. With the increase in the air flow rate, the drag decreased and the average thickness of liquid film decreased. This measure technique studies the internal structure of BDR by observing liquid films that form above individual bubbles. Oishi and Murai [27] used PIV technology to study the flow field corrected by a single bubble in the turbulent boundary layer on the transition-state horizontal wall. The measurement results revealed that the bubble generates secondary flows around itself, including twin roll vortices, separation on the bubble surface, and a strong sweeping flow. For small, nearly spherical bubbles, a strong sweeping flow is provided to enhance turbulent momentum exchange, whereas a negative exchange is detected for large, flat bubbles. Due to the large bubble size or Weber number, the additional stress at the front of the bubble becomes negative, helping to reduce drag. Madavan et al. [28,29] conducted a series of experimental studies on the mechanism of “high-concentration microbubbles” in reducing surface friction. They measured the drag balance results using a surface hot-film probe in a flat-plate experiment. They found that bubble size is not primarily determined by the size of the pores used for injection. Additionally, and variables were used within the spectrum of scaling, as using microbubbles seems to be just as effective as not using the micro-air bubbles; therefore, the main effect of microbubbles in the turbulent boundary layer may be a local effective change of fluid viscosity and density, thus changing the local turbulent Reynolds number rather than “introducing a major restructuring of the turbulence”. The experiment of Madan Mohan Guin et al. [30] also confirmed this point. The energy flux of injected gas actually met the conditions required for gas-layer drag reduction. Therefore, they actually revealed the mechanism of ALDR.
3.2.2. Analysis of Influencing Factors for MBDR and ALDR
According to the characteristics of different air lubrication drag reduction methods, the influencing factors of the drag reduction rate can be quantitatively analyzed by ship model tests. In MBDR, Sanders et al. [31] studied MBDR in the turbulent boundary layer at a high Reynolds number through a plate test. It was found that at the two higher flow speeds, the liquid layer forms within 2 m of the injector, and the effect of the bubble drag reduction disappears further downstream. The frictional drag reduction rate depends largely on the void fraction near the wall surface and the effect of buoyancy on the bubbles. It was also observed that the shear-induced lift force in the flow field caused microbubbles to migrate from the wall, leading to the formation of the nearly bubble-free liquid layer. Observations of the size and shape of microbubbles showed that bubble splitting is not dominant in the downstream region of bubble flows, but bubble coalescence generally occurs. They also found that under certain favorable conditions, namely, at the lowest fluidity and maximum air injection, buoyancy pushes bubbles towards the surface of the plate, where they form an almost continuous gas layer that continues downstream of the plate, with a drag reduction of nearly 100%. The study reveals that the amount of drag reduction is closely related to the near-wall void fraction and bubble buoyancy, and the velocity interval of forming a continuous gas film on the surface of the model is given as 6–18 m/s. Cai [32] conducted MBDR experiments on ship models of two scales, and found that the drag reduction rate will be affected by a variety of factors, including the amount of air injected, the inlet flow velocity, the air injection area, the draft size, and the air injection mode. When the air injection volume is constant, the drag reduction rate increases with the inflow velocity. When the incoming flow velocity is constant, the relationship between the drag reduction rate and the amount of air injected becomes complicated and unstable, but the overall drag reduction rate increases with the increase in the air injection volume. It is pointed out that when the amount of air injected is too large, the shape drag of the ship model will be increased and the drag reduction effect will be reduced. Sayyaadi et al. [33] quantified the effect of injection rates of 0–1 on drag reduction by using the test results of a 70 cm catamaran model. The experiment results showed that the drag reduction effect is reduced by excessive air injection, and the total drag is reduced by about 5–8% by proper air injection. The test gives an optimal injection coefficient of between 0.4 and 0.6. Wu et al. [34] took the average flow speed as an indicator and studied several controllable factors affecting the drag reduction effect of microbubbles using Taguchi’s method. The controllable factors in this study were the amount of air injected, area of air injection, and microbubble size. For the condition of optimum parametric levels, the drag reduction effect can reach 21.6%. It is pointed out that the amount of air injected is the most important factor affecting robustness.
In addition, a large air injection area and the small, porous medium size holes are the best choice for drag reduction. Hiroharu Kato et al. [35] observed the formation of single-hole jet bubbles on flat plates with uniform flow velocities of 2–10 m/s, confirmed that bubble size is controlled by the incoming velocity and the air flow rate through a plate experiment, and detected three methods of small bubble generation, as shown in Figure 10 (adapted from [35]). Figure 10a shows a two-dimensional convex shape with an injection hole at the top. Figure 10b shows a two-dimensional convergent–divergent nozzle with an injection hole at the throat. Figure 10c shows a transverse wire, with a diameter of 200 μm, a little upstream of an ejection hole with a 1 mm diameter. It was found that the 2D convex shape is more effective in reducing the size of air bubbles. In order to study the frictional drag reduction effect on the inclination surface shape, such as the stern bottom inclined part, and the curved surface shape, such as the bilge circle part, with respect to the drag reduction effect, Kawakita and Hamada [36] carried out high-speed towing tests by adopting a 15 m-long flat model and a 7 m-long circular model simulating the round part of the bilge. It was observed that a large area of the local drag reduction effect appeared in the length range of about 1 m immediately after the base point of the stern bottom inclined part. This trend increased with the increase in the slope angle and equivalent air layer thickness. This phenomenon was thought to be caused by the accumulation of air bubbles in the low-pressure part near the starting point of the inclined part, forming an air film. The drag reduction effect of the bilge corner section decreased as it moved downstream. It was considered that the air bubbles are separated from the side of the ship at the bilge corner, which reduces the local void fraction in the vicinity of the wall and, thus, reduces the local friction resistance. The air lubrication method, which mixes millimeter bubbles into the flow around the hull to reduce friction, is expected to achieve significant energy savings among many marine energy saving technologies.
Different gas types also affect the drag reduction effect. Fontaine and Deutsch [37] measured the effect of five different gases—air, helium, carbon dioxide, argon, and sulfur hexafluoride—on reducing the skin-friction drag on an axisymmetric model. Helium was observed to have a better drag reduction effect than the other gases. The density of gases seems to play an important role in their suitability as drag reducers, and the effectiveness of most gases does not seem to depend on solubility. Song et al. [38] studied the influence of microbubbles and polymers on drag reduction characteristics of underwater vehicles based on the water tunnel experiment of axisymmetric bodies, and found that the drag reduction efficiency of polymer and microbubbles combined is greater than that of the single drag reduction method. When the flow velocity is small, the drag reduction rates of polymer solutions with different mass concentrations increases gradually with the increase in ventilation, but the difference in microbubble drag reduction rates between polymer solutions with different mass concentrations decreases gradually, and eventually tends to be consistent. When the flow velocity is large, the difference in drag reduction efficiency of microbubbles between polymers with different mass concentrations at the same flow rate decreases gradually. It is concluded that the drag reduction mechanism of microbubbles and polymers is very similar.
The formation thickness and covering area of the gas layer directly affect the drag reduction effect. Huang [20] found that the nominal thickness of the economical gas layer was about 7–8 mm, which was close to the economical thickness of the equivalent microbubble gas layer proposed by MHI [7]. Zhao [39] found that for the same air flow rate, a higher ship speed would lead to an increase in the area covered by the air layer and a smaller deformation of the air layer. Larger air coverage will result in higher drag reduction rates. Ye et al. [40] found that the increase in the amount of air injected will lead to the increase in the width and diffusion angle of the air layer, whereas on the contrary, the influence of the incoming flow velocity decreases. Sato et al. [41] proposed that the lateral baffle can effectively reduce the gas overflow and extend the air layer, and the length of the gas layer is positively correlated with the size of the gas flow. At present, installing a side baffle is an effective means to reduce the lateral air overflow.
3.2.3. Analysis of Influencing Factors for ACDR
In terms of ACDR, the drag reduction effect depends on the suitable air cavity size. In the study of cavity size, Makiharju et al. [42] and Arndt et al. [43] explored the minimum amount of air injected in the formation and maintenance stages of a lamellae cavity with a back step (closure) based on the cavity closure theory proposed by Matveev et al. [44] in the water tunnel experiment. It was commonly found that the minimum amount of air injected for the formative phase is three to four times that for the maintenance phase. According to the volume balance principle of the cavity, the difference in the gas demand in the formation and maintenance stages is caused by the difference in the gas escaping velocity at different stages, and the gas escaping velocity is mainly determined by the closing mode of the cavity tail. In the experiment, an air cavity with the limit length (completely covering the groove) was studied, and the minimum air flow rate curve under different Froude numbers was obtained. However, no general gas demand law had been found, and the dependence between the amount of air injected and Froude number and Reynolds number is not clear. Slyozkin et al. [45] studied the relationship among the air flux, the cavity size, and the drag reduction rate in a cavitation tunnel test. The results showed that, in general, the amount of air flux, which is required to create and/or to maintain a unit area of a cavity, increases exponentially when the incoming flow speed is applied, the cavity size increases significantly, and the drag reduction effect is almost proportional to the cavity area. Zverkhovskyi [17] studied the multicavity scheme, as shown in Figure 11 (adapted from [17]). It was found that increasing the cavity number will produce extra pressure drag, but the stability of the air layer decreases when the air cavity size is too large. The balance between the two should be considered, and a small number of air cavities should be used to cover a large surface area as far as possible under the condition of anti-interference. The multicavity design can reduce the ship’s total drag by about 12–20%. Wu et al. [46] conducted an experimental study on ALDR under a flat plate in the towing tank. The experiment results showed that when the air is injected directly into the bottom of the plate without a bottom cavity, the shape of the gas–liquid mixed flow presents different flow states at different speeds and different air flow rates. The air has the characteristic of lateral diffusion on the bottom surface. For ships with the bottom air cavity, when the bottom air cavity is completely covered by the air layer, a good drag reduction effect can be achieved. It is proved that forming an air layer at the bottom of the ship model with a bottom cavity is an effective method to reduce friction drag. Because of the existence of the cavity, the air can be effectively prevented from overflowing from the bottom of plate. Taking a bulk carrier as the research object, Wu and Ou [47] carried out a model test in a towing tank by adopting the ALDR method with different bottom air cavity depths. The experiment results showed that the drag of the ship model increases when the bottom cavity is set. The larger air cavity depth is beneficial to improve the stability of the air layer in waves. Cucinotta et al. [48] refitted a high-speed planing yacht and compared different cavity shapes, incoming flow velocities, and the air flux. The results showed that compared with the conventional hull, the planing hull can also achieve important drag reduction. More complex cavity shapes designed to prevent air from escaping from the chain do not lead to satisfactory results. This phenomenon is caused by a low enough pressure at the bottom of a high-speed boat and an increase in the wetted surfaces. Amromin et al. [49] found that the air in the closed structure of the cavity is more likely to reside in the air cavity. As the buoyancy of the air cavity makes the height of the ship higher than the water level, it helps to reduce the drag by reducing the wetted surface area on the side and the immersed volume. However, the mass of the real ship is larger than that of the ship model. Although the hollow air cavity in the real ship test can provide a certain buoyancy, it may not be able to achieve the effect of lifting the real ship. In order to avoid the interference of this phenomenon, the waterline depth of the real ship should be fixed.
In the study of the stability of the air layer and cavity, Elbing et al. [50] found that increasing air flux will increase the thickness of the air layer, thus making the air layer more resistant to local disturbances that can interfere with the air layer. Gao et al. [51] pointed out that additional consideration should be given to the influence of air injection conditions when optimizing the cavity structure. M Kiharju et al. [52,53] studied the stability of the cavity under the condition of disturbed flow, and simulated the disturbance by changing the pressure and velocities of the incoming flow through periodic oscillation. The research results showed that the stability of the air cavity can be maintained only when the air cavity has a larger air flux under the condition of disturbance. The establishment of the active flow control system is of great significance for studying the stability of the air cavity under disturbance conditions.
Based on the above research results of the ship model tests of the air lubrication technology, MBDR is analyzed from the air generation mode and air injection forms of microbubbles, and ALDR and ACDR are analyzed from the gas-layer morphology and the size of the air cavity. It is concluded that the key to MBDR is the formation of small enough bubbles and uniform distribution in water, whereas the key to ALDR and ACDR is the stability of the air layer and the size and layout of the air cavity. MBDR, ALDR, and ACDR have their advantages and disadvantages under different Froude numbers. In addition, MBDR requires much less air flux than ALDR and ACDR. Therefore, only according to the requirements of different types of ships can we choose the specific drag reduction methods.
4. Numerical Studies on Drag Reduction of Air Lubrication
4.1. Selection of the Numerical Model
4.1.1. MBDR Model
When the theoretical analysis and the numerical simulation are carried out for MBDR, ALDR, and ACDR, the reasonable numerical model selection can obtain more accurate conclusions.
Numerical models should accurately reflect the effect of microbubbles on the turbulent boundary layer. Mattson and Mahesh [54] used an Euler–Lagrange algorithm to simulate the flow of microbubbles injected into a turbulent boundary layer. The bubbles were simulated as dispersed phases, and the individual bubbles were treated as point particles governed by the bubble motion equation, combined with the continuous carrier phase described by the Navier–Stokes equations. Because of the small size of the bubble and the assumption that the concentration of the bubble was diluted, the force of the bubble on the current-carrying fluid or other bubbles was negligible. It is important to note that the bubble sizes in the experiments are not monodisperse but have a size distribution, which is assumed to be equal to the mean for simplicity, but it may be important to consider non-uniform bubble size distributions because the bubble drag and volumetric accelerations are functions of bubble size. Wang [55] carried out numerical studies on MBDR by using the flat-plate geometric model, and compared the influence relationship between the Euler multiphase flow model and the mixture multiphase flow model based on the calculation results. The calculation results showed that the mixture multiphase flow model requires less mesh than the Euler multiphase flow model. The mixture multiphase flow model tends to a stable value with the thinning of grid, whereas the results of the Euler multiphase flow model fluctuated up and down with the thinning of the grid and then gradually became stable. The Euler multiphase flow model has a high calculation accuracy, but a long calculation time and poor convergence. The mixture multiphase flow model has a short calculation time and good convergence, but a large error. Lyu et al. [56] proposed a gas–liquid two-phase flow model based on the mixed flow model, and carried out a numerical simulation of MBDR in the hull of a SUBOFF rotary model. The effect of the velocity ratio and air volume fraction on the drag reduction rate was assessed by using a standard k-ε turbulence model. It was found that both the velocity ratio and air volume fraction play an important role in MBDR. Lin [57] established a MBDR numerical model using the PHOENICS computational fluid software, and studied two-dimensional flat plates and two-dimensional ship models. The model established the Navier–Stokes equation for gas and liquid by using the phase slip algorithm, and considered the interaction force between the two phases. The results were qualitatively consistent with those of previous studies. However, this model does not solve the problem of increasing velocity when there are microbubbles in the boundary layer. Pang et al. [58] established the Euler–Lagrange two-way coupling model and conducted a numerical study on MBDR of the flat. Direct numerical simulation (DNS) was used to solve the velocity field of the liquid, and the Newton equation of motion was used to calculate the bubble trajectory. The momentum transfer between gas and liquid phases was realized by interphase forces. It was found that MBDR depends on the interaction between microbubbles and the liquid turbulence.
MBDR also needs to consider the bubble breakage and coalescence. Mohanarangam et al. [59] used a multiple-size group (MUSIG) based on population balance models to study the MBDR of two-dimensional flat plates. The model considered the interphase force of drag. The change of the average velocity of the free stream, void fraction, and turbulence modification in the presence of microbubbles was studied. According to the calculation results, the mechanism of MBDR was analyzed and discussed in detail, and the effect of the bubble coalescence and fragmentation on MBDR was emphatically analyzed. It was found that the MUSIG model can be considered as one of the best choices to solve the bubble dynamic embedded in MBDR. Wei [60] used an Euler–Euler two-phase flow model to conduct a numerical simulation of MBDR on flat plates and bulk carriers, and discussed the influencing factors of MBDR according to the calculation results. The model considers the interphase resistance, but ignores the effect of the bubble deformation, coalescence, and breakage. Pang and Zhang [61] studied the MBDR of the horizontal channel turbulence by using the mixture multiphase flow model combined with the population balance model. The results showed that the liquid Reynolds number and the global void fraction have the greatest influence on the drag reduction rate and smaller microbubbles are more conducive to drag reduction. The population balance model is used to describe the coalescence and breakup phenomena of the bubble groups in the study. Qin et al. [62] simulated the bubbly flow along the flat plate based on Eulerian–Eulerian two-fluid modeling, coupled with a population balance model. Bubble coalescence and fragmentation were considered, and bubble deformation was ignored. Drag and lift were fully modeled based on applicable closure models. The predicted drag reduction rate and bubble distributions were in good agreement with the experimental results, and the numerical results revealed the stream-wise distribution of MBDR. In this study, the change in the velocity gradient is proved to be another important mechanism for bubble drag reduction.
4.1.2. ALDR Model
Similar to the MBDR model, the ALDR model should accurately simulate the flow state of the gas layer in the turbulent boundary layer. Wang et al. [63] used the interface tracking Cartesian grid model of the two-phase flow to study the ALDR of the flat-plate turbulence at a high Reynolds number, and used a two-phase sharp-interface Cartesian grid solver to simulate the formation process of the air layer in a turbulent flat-plate boundary layer at a high Reynolds number. The coupled level set and the volume-of-fluid method was used to track the interface, and the Spalart–Allmaras turbulence model and the wall function method were used to model the turbulence. The numerical results showed that the air layer of the whole test plate is successfully realized, and the drag reduction rate is approximately 100%, which is very consistent with the experimental findings. It is worth noting that the critical air flow rate for ALDR formation in the simulation is lower than the experimental value, which may be due to the choice of turbulence model, instability of the 3D model, and surface tension effect. Aiming at the accuracy of the simulation, Wu and Ou [64] systematically studied the effects of the turbulence model, the grid, and the wall function on the calculation results. The results showed that the mixture model combined with the renormalization group (RNG) k-ε turbulence model can effectively simulate the diffusion boundary of the air layer along the width of the plate and the variation of the air layer thickness along the flow direction. For the suitability of numerical methods, Wu et al. [65] used mixture, VOF, and Eulerian multiphase flow models to numerically simulate the gas–liquid mixed flow and the gas–liquid stratified flow at the bottom of the plate, and the results showed that the mixture model used to calculate the gas–liquid mixed flow without grooves can better simulate the morphology of the air layer, and the prediction of the drag reduction rate of the model has a certain accuracy, whereas the VOF model used to calculate the long cavitation in the grooves of the plate can better simulate the air layer fluctuation and predict the drag reduction rate. Zhao et al. [66] used the Euler–Euler two-fluid model and the VOF model in the OpenFOAM software to compare MBDR and ALDR. The results showed that the drag reduction rate obtained by the Euler–Euler two-fluid model is in good agreement with the experimental results when the air flow ratio is low. When the air flow ratio is high, the drag reduction rate of the VOF model is in good agreement with the experimental data. For the medium air flow ratio, neither model can predict the drag reduction effect well. It should be noted that the presented CFD models are only suitable for the BDR region and ALDR region, but not for the transition region. For the moving mesh technology, De et al. [67] studied the vortex phenomenon of gliding boats. The Reynolds-averaged Navier–Stokes (RANS) and large eddy simulation (LES) were used to analyze the same flow conditions. The results showed that at different model speeds, different moving mesh techniques (overset/chimera and morphing grid) are used to analyze the same flow conditions. The numerical results agreed with the experimental data, and the chimera mesh was found to be the better of the two methods. The overset mesh ensures the high quality of the simulation results and shows high adaptability to the wide variations of trim and heave of the stepped hull. Montazeri and Alishahi [68] proposed an efficient numerical method. The linear stability is combined with URANS flow-field modeling, and the fundamental flow is extracted from the CFD of the linear stability analysis to obtain the frequency of the most unstable modes. The final CFD simulation adds additional perturbation terms specific to the frequencies.
4.1.3. ACDR Model
The prediction of the free liquid surface is one of the most important problems in the research of ACDR because the key to the design is whether the geometric parameters of the bottom of the ship can match well with the cavity interface. Potential flow theory is generally used to analyze fluid flow in the application scenario of the overall shape and tail closure characteristics of the gas chamber dominated by buoyancy. Butuzov [69] first adopted a cavity flow mathematical model based on a slender wedge to model the free liquid surface. Matveev et al. [44] then improved the prediction model of the free interface by constructing a virtual cavity closing interface with the Riabouchinsky algorithm according to Butuzov’s [69] analysis. Four cavity flow patterns are obtained as shown in Figure 12 [44]. Cavity 1 is characterized by the formation of a pulsating re-entrant jet at the tail part of the cavity, whereas the cavity boundary near the wedge remained stable. Cavity 2 is associated with the flow pattern in the absence of a re-entrant jet, with the cavity tail smoothly attached to the plate. In this case, the cavity-maintaining gas flow, as well as the cavitation drag, is theoretically equal to zero. Cavity 3 is characterized by the fact that the cavity theoretically pierces the plate at the tail (as shown by the dotted lines). During the test, in this case, a strong pulsation of the entire cavity can be observed, as in the experiment on over-ventilated flows with a positive cavitation number. Under certain conditions, it is also possible to form an unsealed cavity 4. However, the power required for air injection is too high, making this regime unattractive for practical drag reduction.
Up to now, numerical models of ACDR have been explored. Rotte et al. [70] discussed the limitations and capabilities of RANS-VOF modeling in the numerical simulation of air cavity flows. The air cavity profiles and velocity profiles at different stream-wise locations in the boundary layer around the air cavity can be predicted based on the experimental findings. However, a mismatch was found in determining the air flow rate required for the air cavity, which was assumed to be mainly due to incorrect turbulence modeling around the interface and the advection of the air–water interface coated at the reattachment zone. The exact mechanism by which the air is expelled at the closure of the cavity was unknown. Laux and Johansen [71] used VOF and a two-fluid model to predict the entrapped bubble parameters generated by the plunging jet. Ma et al. [72] established a multiscale model that combined the two-fluid model with the level set method of free-surface bubble flows. Hansch et al. [73] introduced the inhomogeneous MUSIG model into a two-fluid framework to capture interface structures at different scales. To stabilize large-scale interfacial structures, specific interfacial forces were applied between the liquid and the continuous gas phase. Yan and Che [74] established a unified framework for resolving the multiscale interface structure between gas and liquid. A “volume fraction redistribution” method was used for regions containing all three phases. This treatment deals with the connection between the two base models within the solution framework. Based on the unified solution framework, the modified MCBA–SIMPLE algorithm is used to solve the governing equations, and it can extend many other techniques developed for a single-fluid flow to a multiphase flow. Compared with the hydraulic jump flow and the plunging jet, the ventilated cavitating flow has a similar gas entrainment mechanism. However, the mass and momentum transfer processes involved are more complex, and there are few multiscale studies of ventilation cavities in the literature. Xiang et al. [75] proposed a multiscale numerical approach to investigate the multiphase flow generated by the ventilated cavity. The approach was based on the Eulerian–Eulerian multifluid model, combined with the subgrid gas entrainment model and the compressive VOF model, to establish a numerical framework. The population balance approach was also used to capture the evolution of bubble size. The flow parameters including the void fraction, the bubble velocity, and the bubble size fraction in and downstream of the ventilated cavity are studied in detail. The numerical model is proved to be in good agreement with the experimental data.
4.2. Numerical Study on Drag Reduction Mechanism
4.2.1. MBDR Mechanism
The numerical method is used to study the drag reduction technology of air lubrication, which is convenient for analyzing the distribution law of bubbles in turbulence, and then, mastering the action mechanism of bubbles on the turbulent boundary layer to predict and evaluate the drag reduction effect of bubbles in advance.
For MBDR, Mohanarangam et al. [56] used numerical results to measure the amount of drag reduction, which was basically consistent with the experimental measurement (Madavan et al., 1984). Numerical results showed that the MBDR mechanism can be attributed to the following three factors: 1. An additional momentum source is caused due to the injection of gas bubbles. This redistributes the flow structure of the carrier phase in the boundary layer and reduces the resultant skin-friction coefficient along the wall surface by increasing the normal flow velocity, leading to a significant decrease in the mean stream-wise velocities. 2. The presence of the micro-bubbles causes perceptible turbulence modification to the carrier phase. Turbulence attenuation occurring near the wall surface may contribute to drag reduction. 3. The injection of microbubbles creates a thin film of liquid that covers the wall surface, thereby reducing the shear stress and drag forces between water and wall.
Microbubble concentration is also an important factor affecting MBDR. Wang and Cao [76] used the method of Lin in [53] to study the formation of microbubbles from the bottom of the bow by air injection, and found that the drag reduction rate is affected by the Reynolds number of the incoming flow, and the incoming flow of a high Reynolds number is unfavorable to drag reduction. The greater the concentration of local microbubbles in the wall boundary layer, the better the drag reduction effect. Increasing and keeping the bubble concentration in the boundary layer downstream of the inlet is an important factor to improve the drag reduction effect. Wu and He [77] carried out a numerical simulation on the microbubble drag reduction of a rotary body, the flow with microbubbles was treated as a mixture flow, and the results showed that that when the diameter of a microbubble is relatively small (10 μm magnitude), bubbles can be uniformly attached to the surface of the model, and the drag reduction effect is good. Increasing the velocity of air injection can improve the void fraction near the wall, thus reducing the skin-friction drag more. When the flow velocity is higher, the microbubbles are more concentrated near the surface of the model, and the decrease in the skin-friction drag increases with the increase in the void fraction near the wall. The maximum reduction rate of the total drag can reach 50%, and the maximum reduction rate of the skin-friction drag can reach 80%. It can be seen that the drag reduction effect of microbubbles is very obvious. The key to MBDR is that the bubbles generated are small enough and adhere to the surface of the model as to obtain a high void fraction. Guo et al. [78] numerically analyzed MBDR on the surface of the flat plate with a mixture model and also obtained a drag reduction rate of 80% within a certain speed range. Gamal et al. [79] performed a three-dimensional numerical study of MBDR on a KRISO container ship model. For simulating a two-phase flow, the “mixture model” is implemented in FLUENT. The aim was to understand the mechanism of resistance reduction by microbubble injection at the bottom of ship models with different Froude numbers, injection rates, and void fractions. It was concluded that when the Froude number is high, because the bubbles are pushed out of the boundary layer and do not completely cover the bottom of the hull, the air injection flow rate must be increased to achieve greater drag reduction. At lower Froude numbers, because the water flow can move bubbles to a whole region of the boundary layer and completely cover the bottom of the hull, the air injection flow rate must be decreased to achieve greater drag reduction.
4.2.2. ALDR Mechanism
In the numerical study of the ALDR mechanism, Yu et al. [80] studied the physical process of axisymmetric body drag reduction by using the volume of fluid (VOF) method and the modified RNG k-ε model. The comparison between the numerical and experimental air layer length showed a good correlation. The results showed that the air in the boundary layer reduces the density, the velocity gradient, and the dynamic viscosity near the wall surface. Zhang [81] conducted a study on low-speed, full-form ships. When there is no jet, the RNG k-ε model is selected, and the discrete scheme is a second-order upwind scheme. When calculating the jet state, the mixture mixed-phase model and the RNG k-ε two-equation turbulence model are used. It was found that the drag reduction effect is greatly influenced by the air flow rate and the incoming flow velocity, and the large air flow rate and incoming flow velocity have positive effects on drag reduction. Placing both front and rear vents on the bottom of the ship will produce a larger air layer than placing only front vents. The angle of ventilation has no effect on drag reduction. It is worth noting that due to the large static pressure at the bottom of a real ship, the energy required for ventilation also increases accordingly; therefore, more experimental works should be performed before applying air injection to a full-scale real ship. Li et al. [82] used the RANS method and SST k-ω turbulence model to analyze the bubble stability of a transition-type bubble boat under various attitudes; it was found that the drag reduction effect varies little under different heeling conditions. After ventilation, the heeling moment of the bubble boat changes only a little. When heeling, the air does not escape from the cavitation. Ventilation has little effect on navigation stability in oblique navigation. However, the drift angle has great influence on the morphology of the air layer in cavitation. In the process of turning, the drag reduction rate increases gradually with the increase in the turning radius. Air injection will reduce the yaw moment. An et al. [83] combined the model with the SST k-ω turbulence model, designing a novel automatic air intake drag reduction strut structure based on the Venturi effect for high-speed, small water-plane area, twin-hull vessels. The drag-reducing struts could realize the automatic air intake function when the vehicle is running at high speed, and the air inhaled forms the air layer to cover the surface of the struts, effectively reducing the drag of the struts. It was found that as the sailing speed increases, the drag reduction rate of the strut gradually rises and its maximum value reaches about 30%. The proposed the automatic air intake drag reduction strut has good application prospects for achieving the targets of ship energy conservation and emission reduction.
4.2.3. ACDR Mechanism
In the numerical study of the ACDR mechanism, Cucinotta et al. [84] used the VOF model and k-ω Menter turbulence model to study the ACDR of a planing boat by using CFD and URANSE methods. The results showed that the air distribution at the bottom of the boat can be improved in different ways by changing several geometric parameters, such as the longitudinal position, the width, and the height of the step or the deadrise angle. Kim et al. [85], through the direct numerical simulation of a two-phase flow, numerically studied the formation mechanism and stability of the air layer under two different air flow rates. The results showed that for a high air flow rate, a stable air layer is formed on the plate, and the drag reduction rate is more than 90%. In the case of a low air flow rate, the air layer is broken and ALDR cannot be realized. Fang et al. [86] used the VOF two-phase flow model, VOF wave model, and SST (Menter) K-omega turbulence model to focus on the cavity behavior and hydrodynamic performance of the air cavity ships (ACS) across a wide range of Froude numbers (Fr = 1 − 4.5). It was found that the drag reduction rate and trim rate of ACS increase first and then decrease with Fr, whereas the sinkage increases monotonically. When Fr is constant, the drag reduction first increases rapidly with the ventilation coefficient and then remains constant, whereas the trim and sinkage increase roughly. The air cavity of the hull has influence on the drag reduction performance and the motion attitude. The air coverage rate and the pressure distribution of the cavity are the key factors affecting the drag reduction performance and the motion attitude of the ACS. Wu and Ou [87] used the RNG k-ε turbulence model as the model, and the two-phase flow as the VOF method, to study the influence of the ship model attitude on the cavity drag reduction for a low-speed ship with a large, flat bottom. It was found that for the roll attitude, there is a critical roll angle of the ship. When the heeling angle is less than the critical value, the air layer can be stable, and when the heeling angle is greater than the critical value, the air layer will be broken. The larger ship should avoid having the trim by the stern as far as possible during the voyage because it may destabilize the stability of the bottom air layer.
Compared with the ship model test and the plate test, the numerical method can greatly reduce research costs. Although there is a great difference between the data obtained through numerical simulation and the experimental data, the numerical research is the premise of the experimental research, which can provide predictions for the results of subsequent experimental research, and is the basis for carrying out the ship model test.
5. Summary
In this paper, the existing drag reduction techniques of air lubrication are reviewed. Air lubrication drag reduction is mainly divided into three categories: MBDR, ALDR, and ACDR. The key to distinguishing MBDR from ALDR is whether the drag reduction rate reaches the critical value. The difference between ALDR and ACDR is the presence of a sealed air chamber, which results in a distinct water–gas interface due to the pressure difference between the inside and the outside. Generally, under the same conditions, the existence of the sealed air chamber will reduce the skin-friction drag more, but also will introduce additional drag; therefore, the size of the sealed air chamber is key to ACDR.
At present, there are three main viewpoints on the mechanism of MBDR: 1. the momentum generated in the jet vents changes the fluid structure in the boundary layer; 2. the existence of microbubbles causes the change of turbulent flow; and 3. the injected bubbles form a thin film between the water and the wall, reducing the shear force between the water and the wall. For ALDR and ACDR, it is generally believed that the introduction of gas changes the local effective viscosity and density of the fluid, thus changing the local turbulent Reynolds number. The bubble size, the incoming flow velocity, the vent distribution, the jet air flow rate, and the gas type all have certain influences on the drag reduction effect of air lubrication. For MBDR, the smaller the bubble size and the larger the bubble concentration near the wall surface, the better the drag reduction effect is. For ALDR, the drag reduction rate increases with the increase in the air injection flow rate at the same incoming flow velocity, but when the air injection flow rate reaches the saturation value, the influence of the air injection flow rate on the drag reduction rate is not significant. At the same time, it is necessary to consider the size design of the air chamber, which has a large influence on the saturation air injection quantity and the stability of the air chamber. The comparison of the three drag reduction techniques is shown in Table 1.
There are also differences in the drag reduction efficiency between the three types of air lubrication technologies. Comparing MBDR with ALDR, Elbing [5] found that the significant drag reduction of MBDR (>25%) is limited to the first few meters downstream of the injection point, whereas the drag reduction of ALDR can extend further. The drag reduction rates of both the slot injection and the porous plate injection using ALDR can maintain more than 80% at 10 m downstream of the injection point, whereas the two injection methods of MBDR both decrease significantly at 2 m, and can only maintain a drag reduction rate below 20% after 4 m. However, it should be noted that the gas injection rate adopted by the ALDR is much higher than that of MBDR. Therefore, from the economic perspective, a more comprehensive comparison is needed in specific applications. For ALDR and ACDR, Wu [46] made a comparison through a plate experiment. For the plate without a cavity, the frictional drag reduction rate is less than 40% because the measuring point at the tail of the plate is far away from the air injection point. For the plate with air cavities, the air layer can extend to the tail of the plate due to the existence of the bottom cavity; thus, the frictional drag reduction rate of the tail measurement point is more than 60%. The study also compares the air layer maintenance times. When air is continuously injected into the bottom of the plate, the drag reduction rate of ALDR is about 21%. When the air injection stopped, the drag reduction effect lasted only 12 s. For ALDR with side plates, the absolute drag reduction rate can reach 32.3%. The maintenance time of the drag reduction effect is about 50 s after the air injection is stopped. For ACDR with a side plate and back step, the drag reduction effect can reach 38.7%, and the maintenance time of the drag reduction effect is about 154 s. The reasonable explanation is that the side plate and the back step can effectively control the air overflow, which is conducive to the formation and maintenance of the air layer in the cavity.
In addition, ALDR and ACDR are greatly affected by sea conditions, and thus, the stability of the air layer or the air cavity should be considered. The design of the suitable ship shape and the groove structure at the bottom of the ship can attach the air layer or air cavity more easily to the bottom of the ship, which can effectively improve the stability of the gas layer or air cavity and the drag reduction efficiency.
From the perspective of the development of drag reduction technology for air lubrication, Figure 13 shows the variation trend in the number of papers published on the three drag reduction technologies from 2002 to 2022. As can be seen from the figure, MBDR had a small peak around 2006, at which time relatively clear concepts of ALDR and ACDR had not been produced, and the concept of ALDR was often confused with the concept of MBDR. It was not until around 2009 that the number of papers on ALDR and ACDR began to increase. Since then, the research interest around MBDR has always maintained a low level, whereas the research interest around ALDR and ACDR has increased year by year. Therefore, from the statistics of the published literature on air lubrication technology in recent years, ALDR technology and ACDR technology are currently the main research fields.
Air lubrication drag reduction technology is a new powerful means of ship energy savings and emission reductions, of which the development prospect is very broad. In order to realize the wide application of this technology in actual ships, the author puts forward the following suggestions and research directions according to the current theoretical and experimental research results:
- Confirmation of ship-type schemes meeting air lubrication drag reduction technologies. Through the analysis of the drag reduction mechanism of air lubrication, it can be seen that different types of air lubrication technologies have obvious differences in the requirements of flow-field characteristics around the hull. Therefore, in the design of a ship-type scheme, the technical requirements of ship type should be taken into account while meeting the use function of the vessels.
- According to the characteristics of the flow field around the air vents, a gas injection scheme matching the ship type is proposed to improve the efficiency of the injected gas and reduce the power consumed by the injected gas. In the selection of the gas injection scheme, the interference of wind, waves, and other environmental factors should be considered, and the influence of wave motion around the hull on gas injection should be analyzed to maintain the uniformity and stability of gas injection.
- Integration of a variety of air lubrication technologies. Different types of air lubrication technologies are applied in different parts of the hull according to different ship types with different functions, and these technologies should be integrated to maximize the overall drag reduction efficiency of the ship.
Author Contributions
Conceptualization, H.A.; methodology, H.A., H.P.; software, H.P., P.Y.; validation, H.P., P.Y.; formal analysis, H.A.; investigation, H.A.; resources, H.P., P.Y.; writing—original draft preparation, H.P. All authors have read and agreed to the published version of the manuscript.
Funding
This research received no external funding.
Conflicts of Interest
The authors declare no conflict of interest.
Abbreviation
| MBDR | microbubble drag reduction |
| ALDR | air layer drag reduction |
| ACDR | air cavity drag reduction |
| MHI | Mitsubishi Heavy Industries |
| CFM | cubic feet per minute |
| PIV | particle image velocimetry |
| RANS | Reynolds-averaged Navier–Stokes |
| DNS | direct numerical simulation |
| MUSIG | multiple-size group |
| LES | large eddy simulation |
| VOF | volume of fraction |
| ACS | air cavity ship |
References
- Tiannan, X.U. Application of Air Lubrication Drag Reduction Technology at Home and Abroad. Ship Boat 2021, 32, 69–74. [Google Scholar]
- Min, T.; Kim, J. Effects of Hydrophobic Surface on Skin-friction Drag. Phys. Fluids 2004, 16, 55–58. [Google Scholar] [CrossRef]
- Ohlendorf, D.; Interthal, W.; Hoffmann, H. Surfaetant Systems for Drag Reduction: Physico-chemical Properties and Rheological Behaviour. Rheologica Acta 1986, 25, 468–486. [Google Scholar] [CrossRef]
- Lin, J.C.; Ash, R.L. Wall Temperature Control of Low-Speed Body Drag. J. Aircraft 1986, 23, 93–94. [Google Scholar] [CrossRef]
- Elbing, B.R.; Winkel, E.S.; Lay, K.A.; Ceccio, S.L.; Dowling, D.R.; Perlin, M. Bubble-induced Skin-friction Drag Reduction and the Abrupt Transition to Air-layer Drag Reduction. J. Fluid Mech. 2008, 612, 201–236. [Google Scholar] [CrossRef]
- McCormick, M.E.; Bhattacharya, R. Drag Reduction of a Submersible Hull by Electrolysis. Nav. Eng. J. 1973, 85, 11–16. [Google Scholar] [CrossRef]
- Mizokami, S.; Kawakita, C.; Kodan, Y.; Takano, S.; Higasa, S.; Shigenaga, R. Experimental Study of Air Lubrication Method and Verification of Effects on Actual Hull by Means of Sea Trial. Mitsubishi Heavy Ind. Tech. Rev. 2010, 47, 41–47. [Google Scholar]
- Pavlov, G.A.; Yun, L.; Bliault, A.; He, S.L. Air Lubricated and Air Cavity Ships: Development, Design, and Application; Springer: New York, NY, USA, 2020; p. 28. [Google Scholar]
- Silberschmidt, N.; Tasker, D.; Pappas, T.; Johanneson, J. Silverstream System—Air Lubrication Performance Verification and Design Development. In Proceedings of the HIPER 2016 Conference, Cortana, Italy, 12–19 October 2016. [Google Scholar]
- Kumagai, I.; Takahashi, Y.; Murai, Y. Power-saving Device for Air Bubble Generation using a Hydrofoil to Reduce Ship Drag: Theory, Experiments and Application to Ships. Ocean Eng. 2015, 95, 183–194. [Google Scholar] [CrossRef] [Green Version]
- Makiharju, S.A.; Perlin, M.; Ceccio, S.L. On the Energy Economics of Air Lubrication Drag Reduction. Int. J. Nav. Archit. Ocean. Eng. 2012, 4, 412–422. [Google Scholar] [CrossRef] [Green Version]
- Ceccio, S.L. Friction Drag Reduction of External Flows with Bubble and Gas Injection. Annu. Rev. Fluid Mech. 2010, 42, 183–203. [Google Scholar] [CrossRef] [Green Version]
- Matveev, K.I.; Perry, N.I.; Mattson, A.W.; Chaney, C.S. Development of a Remotely Controlled Testing Platform with Low-Drag Air-Ventilated Hull. J. Mar. Sci. Appl. 2015, 14, 25–29. [Google Scholar] [CrossRef]
- Abolfazls, S.; Leer-Andersen, M.; Bensow, R.E.; Norrby, J. Hydrodynamics of a Displacement Air Cavity Ship. In Proceedings of the 29th Symposium on Naval Hydrodynamics, Gothenburg, Sweden, 26–31 August 2012. [Google Scholar]
- Mäkiharju, S.A.; Ceccio, S.L. On Multi-Point Gas Injection to form an Air Layer for Frictional Drag Reduction. Ocean Eng. 2018, 147, 206–214. [Google Scholar] [CrossRef]
- Mäkiharju, S.A.; Lee, I.-H.R.; Filip, G.P.; Maki, K.J.; Ceccio, S.L. The Topology of Gas Jets Injected Beneath a Surface and Subject to Liquid Cross-Flow. J. Fluid Mech. 2017, 818, 141–183. [Google Scholar] [CrossRef]
- Zverkhovskyi, O. Ship Drag Reduction by Air Cavities. Ph.D. Thesis, Delft University of Technology, Delft, NL, USA, 2014. [Google Scholar]
- Wu, H.; Dong, W.-C.; Ou, Y.-P. Experimental Study of Flow Field Characteristics and Air Distribution Strategies on a Alat Plate With Air Injection. J. Harbin Eng. Univ. 2016, 37, 1220–1226. (In Chinese) [Google Scholar]
- Matveev, K.I.; Burnett, T.J.; Ockfen, A.E. Study of Air-Ventilated Cavity Under Model Hull on Water Surface. Ocean Eng. 2009, 36, 930–940. [Google Scholar] [CrossRef]
- Huang, H.; He, S.; Gao, L.; Shi, X.; Zhang, C.; Xu, Q. Reduction of Friction Drag by Gas injection in a High-Reynolds-Number Flat-Plate Turbulent Boundary Layer. Shipbuild. China 2018, 59, 1–15. (In Chinese) [Google Scholar]
- Jang, J.; Choi, S.H.; Ahn, S.-M.; Kim, B.; Seo, J.S. Experimental Investigation of Frictional Resistance Reduction with Air Layer on the Hull Bottom of a Ship. Int. J. Nav. Arch. Ocean 2014, 6, 363–379. [Google Scholar] [CrossRef] [Green Version]
- Sindagi, S.; Vijayakumar, R.; Saxena, B.K. Experimental Investigation on Ship’s Model in Carrying out Energy Economics of BDR/ALS methodology. Ships Offshore Struc. 2021, 17, 1437–1446. [Google Scholar] [CrossRef]
- Park, S.H.; Lee, I. Optimization of Drag Reduction Effect of Air Lubrication for a Tanker Model. Int. J. Nav. Archit. Ocean. Eng. 2018, 10, 427–438. [Google Scholar] [CrossRef]
- Park, H.J.; Tasaka, Y.; Murai, Y.; Oishi, Y. Vortical Structures Swept by a Bubble Swarm in Turbulent Boundary Layers. Chem. Eng. Sci. 2014, 116, 486–496. [Google Scholar] [CrossRef]
- Paik, B.-G.; Yim, G.-T.; Kim, K.-Y.; Kim, K.-S. The Effects of Microbubbles on Skin Friction in a Turbulent Boundary Layer Flow. Int. J. Multiphas Flow 2016, 80, 164–175. [Google Scholar] [CrossRef]
- Park, H.J.; Tasaka, Y.; Murai, Y. Bubbly Drag Reduction Investigated by Time-Resolved Ultrasonic Pulse Echography for Liquid Films Creeping inside a Turbulent Boundary Layer. Exp. Therm. Fluid Sci. 2019, 103, 66–77. [Google Scholar] [CrossRef]
- Oishi, Y.; Murai, Y. Horizontal Turbulent Channel Flow Interacted by a Single Large Bubble. Exp. Therm. Fluid Sci. 2014, 55, 128–139. [Google Scholar] [CrossRef]
- Madavan, N.K.; Deutsch, S.; Merkle, C.L. Reduction of Turbulent Skin Friction by Microbubbles. Phys. Fluids 1984, 27, 356–363. [Google Scholar] [CrossRef]
- Madavan, N.K.; Deutsch, S.; Merkle, C.L. Measurements of Local Skin Friction in a Microbubble-Modified Turbulent Boundary Layer. J. Fluid Mech. 1985, 156, 237–256. [Google Scholar] [CrossRef]
- Guin, M.M.; Kato, H.; Yamaguchi, H.; Maeda, M.; Miyanaga, M. Reduction of Skin Friction by Microbubbles and Its Relation with near Wall Bubble Concentration in a Channel. J. Mar. Sci. Tech. Jpn. 1996, 1, 241–254. [Google Scholar] [CrossRef]
- Sanders, W.C.; Winkel, E.S.; Dowling, D.R.; Perlin, M.; Ceccio, S.L. Bubble Friction Drag Reduction in a High-Reynolds-Number Flat-Plate Turbulent Boundary Layer. J. Fluid Mech. 2006, 552, 353. [Google Scholar] [CrossRef]
- Cai, C.-f. Theoretical Analysis and Experiments of Ship Drag Reduction by Microbubble. Master’s Thesis, Wuhan University of Technology, Wuhan, China, 2003. (In Chinese). [Google Scholar]
- Sayyaadi, H.; Nematollahi, M. Determination of Optimum Injection Flow Rate to Achieve Maximum Micro Bubble Drag Reduction in Ships; an Experimental Approach. Sci. Iran. 2013, 20, 535–541. [Google Scholar]
- Wu, S.-J.; Ouyang, K.; Shiah, S.-W. Robust Design of Microbubble Drag Reduction in a Channel Flow Using the Taguchi Method. Ocean Eng. 2008, 35, 856–863. [Google Scholar] [CrossRef]
- Kato, H.; Miura, K.; Yamaguchi, H.; Miyanaga, M. Experimental Study on Microbubble Ejection Method for Frictional Drag Reduction. J. Mar. Sci. Tech. Jpn. 1998, 3, 122–129. [Google Scholar] [CrossRef]
- Kawakita, C.; Hamada, T. Experimental Investigation on Influence of Inclination and Curved Surface of Ship Bottom in Air Lubrication Method. In Proceedings of the ASME-JSME-KSME 2019 8th Joint Fluids Engineering Conference, San Francisco, CA, USA, 28 July 2019. [Google Scholar]
- Fontaine, A.A.; Deutsch, S. The Influence of the Type of Gas on the Reduction of Skin Friction Drag by Microbubble Injection. Exp. Fluids 1992, 13, 128–136. [Google Scholar] [CrossRef]
- Song, W.-C.; Wang, C.; Wei, Y.-J.; Lu, L.-R. Influences of Microbubble and Homogeneous Polymer on Drag Reduction Characteristics of Axisymmetric Body. Acta Armamentari 2018, 39, 1151–1158. [Google Scholar]
- Zhao, X.; Zong, Z. Experimental and numerical studies on the air-injection drag reduction of the ship model. Ocean Eng. 2022, 251, 111032. [Google Scholar] [CrossRef]
- Ye, Q.; Dong, W.; Ou, Y. An Experimental Study of the Flow Field Around the Flat Plate with Air Injection. J. Harbin Eng. Univ. 2014, 35, 25–29. (In Chinese) [Google Scholar]
- Sato, T.; Nakatat, T.; Takeshita, M.; Tsuchiya, Y.; Miyata, H. Experimental Study on Friction Reduction of a Model Ship by Air Lubrication. J. Jpn. Soc. Nav. Archit. Ocean. Eng. 1997, 182, 121–128. [Google Scholar] [CrossRef]
- Makiharju, S.A.; Elbing, B.R.; Wiggins, A.; Schinasi, S.; Vanden-Broeck, J.-M.; Perlin, M.; Dowling, D.R.; Ceccio, S.L. On the Scaling of Air Entrainment from a Ventilated Partial Cavity. J. Fluid Mech. 2013, 732, 47–76. [Google Scholar] [CrossRef]
- Arndt, R.E.A.; Hambleton, W.T.; Kawakami, E.; Amromin, E.L. Creation and Maintenance of Cavities Under Horizontal Surfaces in Steady and Gust Flows. J. Fluids Eng. 2009, 131, 111301. [Google Scholar] [CrossRef]
- Matveev, K.I. On the Limiting Parameters of Artificial Cavitation. Ocean Eng. 2003, 30, 1179–1190. [Google Scholar] [CrossRef]
- Slyozkin, A.; Atlar, M.; Sampson, R.; Seo, K.-C. An Experimental Investigation into the Hydrodynamic Drag Reduction of a Flat Plate Using Air-Fed Cavities. Ocean Eng. 2014, 76, 105–120. [Google Scholar] [CrossRef]
- Hao, W.U.; Yongpeng, O.; Qing, Y.E. Experimental Study of Air Layer Drag Reduction on a Flat Plate and Bottom Hull of a Ship with Cavity. Ocean Eng. 2019, 183, 236–248. [Google Scholar] [CrossRef]
- Wu, H.; Ou, Y.-P. Experimental Study of Air Layer Drag Reduction with Bottom Cavity for A Bulk Carrier Ship Model. China Ocean Eng. 2019, 33, 554–562. [Google Scholar] [CrossRef]
- Cucinotta, F.; Guglielmino, E.; Sfravara, F. An Experimental Comparison Between Different Artificial Air Cavity Designs for a Planing Hull. Ocean Eng. 2017, 140, 233–243. [Google Scholar] [CrossRef]
- Amromin, E.L.; Metcalf, B.; Karafiath, G. Synergy of Resistance Reduction Effects for a Ship with Bottom Air Cavity. J. Fluids Eng. 2011, 133, 1–7. [Google Scholar] [CrossRef]
- Elbing, B.R.; Mäkiharju, S.; Wiggins, A.; Perlin, M.; Dowling, D.R.; Ceccio, S.L. On the Scaling of Air Layer Drag Reduction. J. Fluid Mech. 2013, 717, 484–513. [Google Scholar] [CrossRef]
- Lijin, G.; Shaofeng, C.; Qiuqin, Y. Research on Influence Factors in Air Layer Drag Reduction Technology. Shipbuild. China 2018, 59, 1–13. (In Chinese) [Google Scholar]
- MaKiharju, S.A.; Elbing, B.R.; Wiggins, A.; Dowling, D.R.; Perlin, M.; Ceccio, S.L. Perturbed Partial Cavity Drag Reduction at High Reynolds Numbers. In Proceedings of the 28th Symposium on Naval Hydrodynamics, Pasadena, CA, USA, 12–17 September 2010. [Google Scholar]
- MaKiharju, S.A.; Elbing, B.R.; Perlin, M. Ventilated Partial Cavity Flows at High Reynolds Numbers. In Proceedings of the 7th International Conference on Multiphase Flow. ICMF 2010, Tampa, FL, USA, 30 May–4 June 2010. [Google Scholar]
- Mattson, M.; Mahesh, K. Euler-Lagrangian Simulation of Bubble Migration in a Turbulent Boundary Layer. In Proceedings of the 28th Symposium on Naval Hydrodynamics, Pasadena, CA, USA, 12–17 September 2010. [Google Scholar]
- Wang, B. Numerical Simulation and Mechanism Research on Drag Reduction of Ship by Microbubbles. Master’s Thesis, Harbin Engineering University, Harbin, China, 2012. (In Chinese). [Google Scholar]
- Lyu, X.; Tang, H.; Sun, J.; Wu, X.; Chen, X. Simulation of Microbubble Resistance Reduction on a Suboff Model. Brodogr. Teorja I Praksa Brodogr. I Pomor. Teh. 2014, 65, 23–32. [Google Scholar]
- Lin, L. The Computational Software, PHOENICS, and the Numerical Simulation of Microbubble Friction Reduction. Master’s Thesis, Wuhan University of Technology, Wuhan, China, 2002. (In Chinese). [Google Scholar]
- Pang, M.J.; Weij, J.; Yu, B. Numerical Study on Modulation of Microbubbles on Turbulence Frictional Drag in a Horizontal Channel. Ocean Eng. 2014, 81, 58–68. [Google Scholar] [CrossRef]
- Mohanarangam, K.; Cheung, S.C.P.; Tu, J.Y.; Chen, L. Numerical Simulation of Micro-Bubble Drag Reduction using Population Balance Model. Ocean Eng. 2009, 36, 863–872. [Google Scholar] [CrossRef]
- Wei, Y. Numerical Simulation of Microbubble Drag Reduction and Mechanism Analysis. Master’s Thesis, Harbin Engineering University, Harbin, China, 2013. (In Chinese). [Google Scholar]
- Pang, M.; Zhang, Z. Numerical Investigation on Turbulence Drag Reduction by Small Bubbles in Horizontal Channel with Mixture Model Combined with Population Balance Model. Ocean Eng. 2018, 162, 80–97. [Google Scholar] [CrossRef]
- Qin, S.; Chu, N.; Yao, Y.; Liu, J.; Haung, B.; Wu, D. Stream-wise Distribution of Skin-Friction Drag Reduction on a Flat Plate with Bubble Injection. Phy. Fluids 2017, 29, 037103. [Google Scholar] [CrossRef]
- Wang, Z.; Yang, J.; Stern, F. URANS Study of Air-Layer Drag Reduction in a High-Reynolds-Number Flat-Plate Turbulent Boundary Layer. In Proceedings of the 40th Fluid Dynamics Conference and Exhibit, Chicago, IL, USA, 28 June–1 July 2010. [Google Scholar]
- Wu, H.; Ou, Y.-P.; Dong, W. Numerical Study of Method of Flat Plate Viscous Flow Field with Bubble. Ship Sci. Technol. 2016, 38, 47–51. (In Chinese) [Google Scholar]
- Wu, H.; Dong, W.; Ou, Y.-P. Numerical Method Investigation of Drag Reduction with Air Layer at Bottom of Ship. J. Nav. Univ. Eng. 2016, 28, 70–75. (In Chinese) [Google Scholar]
- Zhao, X.; Zong, Z.; Jiang, Y.; Sun, T. A Numerical Investigation of The Mechanism of Air-Injection Drag Reduction. Appl. Ocean Res. 2020, 94, 101978. [Google Scholar] [CrossRef]
- De Marco, A.; Mancini, S.; Miranda, S.; Scognamiglio, R.; Vitiello, L. Experimental and Numerical Hydrodynamic Analysis of a Stepped Planing Hull. Appl. Ocean Res. 2017, 64, 135–154. [Google Scholar] [CrossRef]
- Montazeri, M.; Alishahi, M. An Efficient Method for Numerical Modeling of Thin Air Layer Drag Reduction on Flat Plate and Prediction of Flow Instabilities. Ocean Eng. 2019, 179, 22–37. [Google Scholar] [CrossRef]
- Butuzov, A.A. Limiting Parameters of an Artificial Cavity Formed on the Lower Surface of a Horizontal Wall. Fluid Dyn. 1966, 1, 167–170. [Google Scholar] [CrossRef]
- Rotte, G.; Kerkvliet, M.; Van Terwisga, T. Exploring the Limits of RANS-VoF Modelling for Air Cavity Flows. Int. Shipbuild. Progr. 2019, 66, 273–293. [Google Scholar] [CrossRef]
- Laux, H.; Johansen, S.T. A CFD Analysis of the Air Entrainment Rate due to a Plunging Steel Jet Combining Mathematical Models for Dispersed and Separated multiphase Flows. Fluid Flow Phenom. Met. Process. 1999, 21–30. [Google Scholar]
- Ma, J.; Oberai, A.A.; Drew, D.A.; Lahey, R.T., Jr.; Hyman, M.C. A Comprehensive Sub-Grid Air Entrainment Model for RANS Modeling of Free-surface Bubbly Flows. J. Comput. Multiph. Flows 2011, 3, 41–56. [Google Scholar] [CrossRef] [Green Version]
- Hänsch, S.; Lucas, D.; Krepper, E.; Höhne, T. A Multi-Field Two-Fluid Concept for Transitions Between Different Scales of Interfacial Structures. Int. J. Multiph. Flow 2012, 47, 171–182. [Google Scholar] [CrossRef]
- Yan, K.; Che, D. A Coupled Model for Simulation of the Gas-Liquid Two-Phase Flow with Complex Flow Patterns. Int. J. Multiph. Flow 2010, 36, 333–348. [Google Scholar] [CrossRef]
- Xiang, M.; Li, K.; Tu, J.; Zhang, H. Numerical Investigation on the Gas Entrainment of Ventilated Partial Cavity Based on a Multiscale Modelling Approach. Appl. Ocean Res. 2016, 60, 84–93. [Google Scholar] [CrossRef]
- Wang, J.-M.; Cao, C.-Y. Numerical Simulation on Drag Reduction of a Vessel by Microbubbles. Ship Ocean. Eng. 2005, 2, 21–23. (In Chinese) [Google Scholar]
- Wu, C.-S.; He, S.-L. Numerical Simulation of Microbubble Flow and Analysis of the Mechanism of Drag Reduction. J. Ship Mech. 2005, 9, 30–37. (In Chinese) [Google Scholar]
- Guo, F.; Bi, Y.; Cao, G. Numerical Simulation of Friction Resistance Reduction of a Flat Plate by Micro-bubbles. J. Nav. Univ. Eng. 2008, 20, 50–54. (In Chinese) [Google Scholar]
- Gamal, M.; Kotb, M.; Naguib, A.; Elsherbiny, K. Numerical Investigations of Micro Bubble Drag Reduction Effect for Container Ships. Mar. Syst. Ocean. Technol. 2021, 16, 199–212. [Google Scholar] [CrossRef]
- Yu, X.; Wang, Y.; Huang, C.; Wei, T.; Fang, W.; Du, T.; Wu, X. Experiment and Simulation on Air Layer Drag Reduction of High-Speed Underwater Axisymmetric Projectile. Eur. J. Mech. B-Fluid 2015, 52, 45–54. [Google Scholar] [CrossRef] [Green Version]
- Zhang, Z. Study of Drag Reduction with Air-film on Low-speed Full Form Ship. Master’s Thesis, Wuhan University of Technology, Wuhan, China, 2010. (In Chinese). [Google Scholar]
- Li, S.-Z.; Wang, L.-Y.; Ni, Q.-J.; Zhao, F. The Effect Analysis of Bubble Stability for Air Cavity Craft in Maneuver Condition. Hydrodyn. Res. Prog. (Ser. A) 2016, 31, 277–285. (In Chinese) [Google Scholar]
- An, H.; Hu, Z.; Pan, H.; Yang, P. Numerical Investigation of the Automatic Air Intake Drag Reduction Strut Based on the Venturi Effect. Symmetry 2022, 14, 367. [Google Scholar] [CrossRef]
- Cucinotta, F.; Guglielmino, E.; Sfravara, F.; Strasser, C. Numerical and Experimental Investigation of a Planning Air Cavity Ship and its Air Layer Evolution. Ocean Eng. 2018, 152, 130–144. [Google Scholar] [CrossRef]
- Kim, D.; Moin, P. Direct Numerical Simulation of Air Layer Drag Reduction over a Backward-Facing Step. In Proceedings of the 63rd Annual Meeting of the APS Division of Fluid Dynamics, Long Beach, CA, USA, 21–23 November 2010. [Google Scholar]
- Fang, H.; Qin, S.; Sun, S.; Wang, L.; Feng, X.; Huang, B.; Wu, D. Numerical Investigation on the Cavity Behavior and Hydrodynamic Performance of a Planing Air Cavity Ship. Ocean Eng. 2021, 241, 110042. [Google Scholar] [CrossRef]
- Wu, H.; Ou, Y.-P. Numerical Study of Influence of Trim and Heel on Stability of Ship Bottom Air Layer. Ship Eng. 2015, 37, 21–25. (In Chinese) [Google Scholar]
Figure 1.
Various modes of air lubrication drag reduction. The modes can be listed as: (a) MBDR mode; (b) Tfansitional ALDR mode; (c) ALDR mode; (d) ACDR mode.
Figure 1.
Various modes of air lubrication drag reduction. The modes can be listed as: (a) MBDR mode; (b) Tfansitional ALDR mode; (c) ALDR mode; (d) ACDR mode.

Figure 2.
Changes of drag reduction rate in MBDR and ALDR modes. (Reproduced with permission from Ref. [5]. Copyright 2008 Cambridge University Press.).
Figure 2.
Changes of drag reduction rate in MBDR and ALDR modes. (Reproduced with permission from Ref. [5]. Copyright 2008 Cambridge University Press.).

Figure 3.
Forms of air vents of MHI Air Lubrication System.

Figure 4.
Air vent arrangement and the pressurization chamber of foreship. In the figure, (a) represents the arrangement of the air chambers and nozzles, and (b) represents the cross-section of the ejection nozzle.
Figure 4.
Air vent arrangement and the pressurization chamber of foreship. In the figure, (a) represents the arrangement of the air chambers and nozzles, and (b) represents the cross-section of the ejection nozzle.

Figure 5.
Dimensions and Kelvin–Helmholtz action of the WAIP system. (Reproduced with permission from Ref. [10]. Copyright 2015 Elsevier.).
Figure 5.
Dimensions and Kelvin–Helmholtz action of the WAIP system. (Reproduced with permission from Ref. [10]. Copyright 2015 Elsevier.).

Figure 6.
Injection of multiple circular jet holes. (Reproduced with permission from Ref. [15]. Copyright 2018 Elsevier.).
Figure 6.
Injection of multiple circular jet holes. (Reproduced with permission from Ref. [15]. Copyright 2018 Elsevier.).

Figure 7.
Slotted nozzle.

Figure 8.
Chamber type of the jet hole.

Figure 9.
Arrangement of air injection units.

Figure 10.
Small bubble generation methods. The following methods are included: (a) convex section with air hole; (b) convergent – livergent nozzle; (c) transverse wire.
Figure 10.
Small bubble generation methods. The following methods are included: (a) convex section with air hole; (b) convergent – livergent nozzle; (c) transverse wire.

Figure 11.
Concept of the air cavity system. The cavities are formed behind vertical cavitators. The number of cavities depend on the velocity.
Figure 11.
Concept of the air cavity system. The cavities are formed behind vertical cavitators. The number of cavities depend on the velocity.

Figure 12.
Four two-dimensional cavity flow patterns. (Reproduced with permission from Ref. [44]. Copyright 2003 Elsevier.).
Figure 12.
Four two-dimensional cavity flow patterns. (Reproduced with permission from Ref. [44]. Copyright 2003 Elsevier.).

Figure 13.
Variation trends in the number of papers published on the three drag reduction technologies.
Figure 13.
Variation trends in the number of papers published on the three drag reduction technologies.


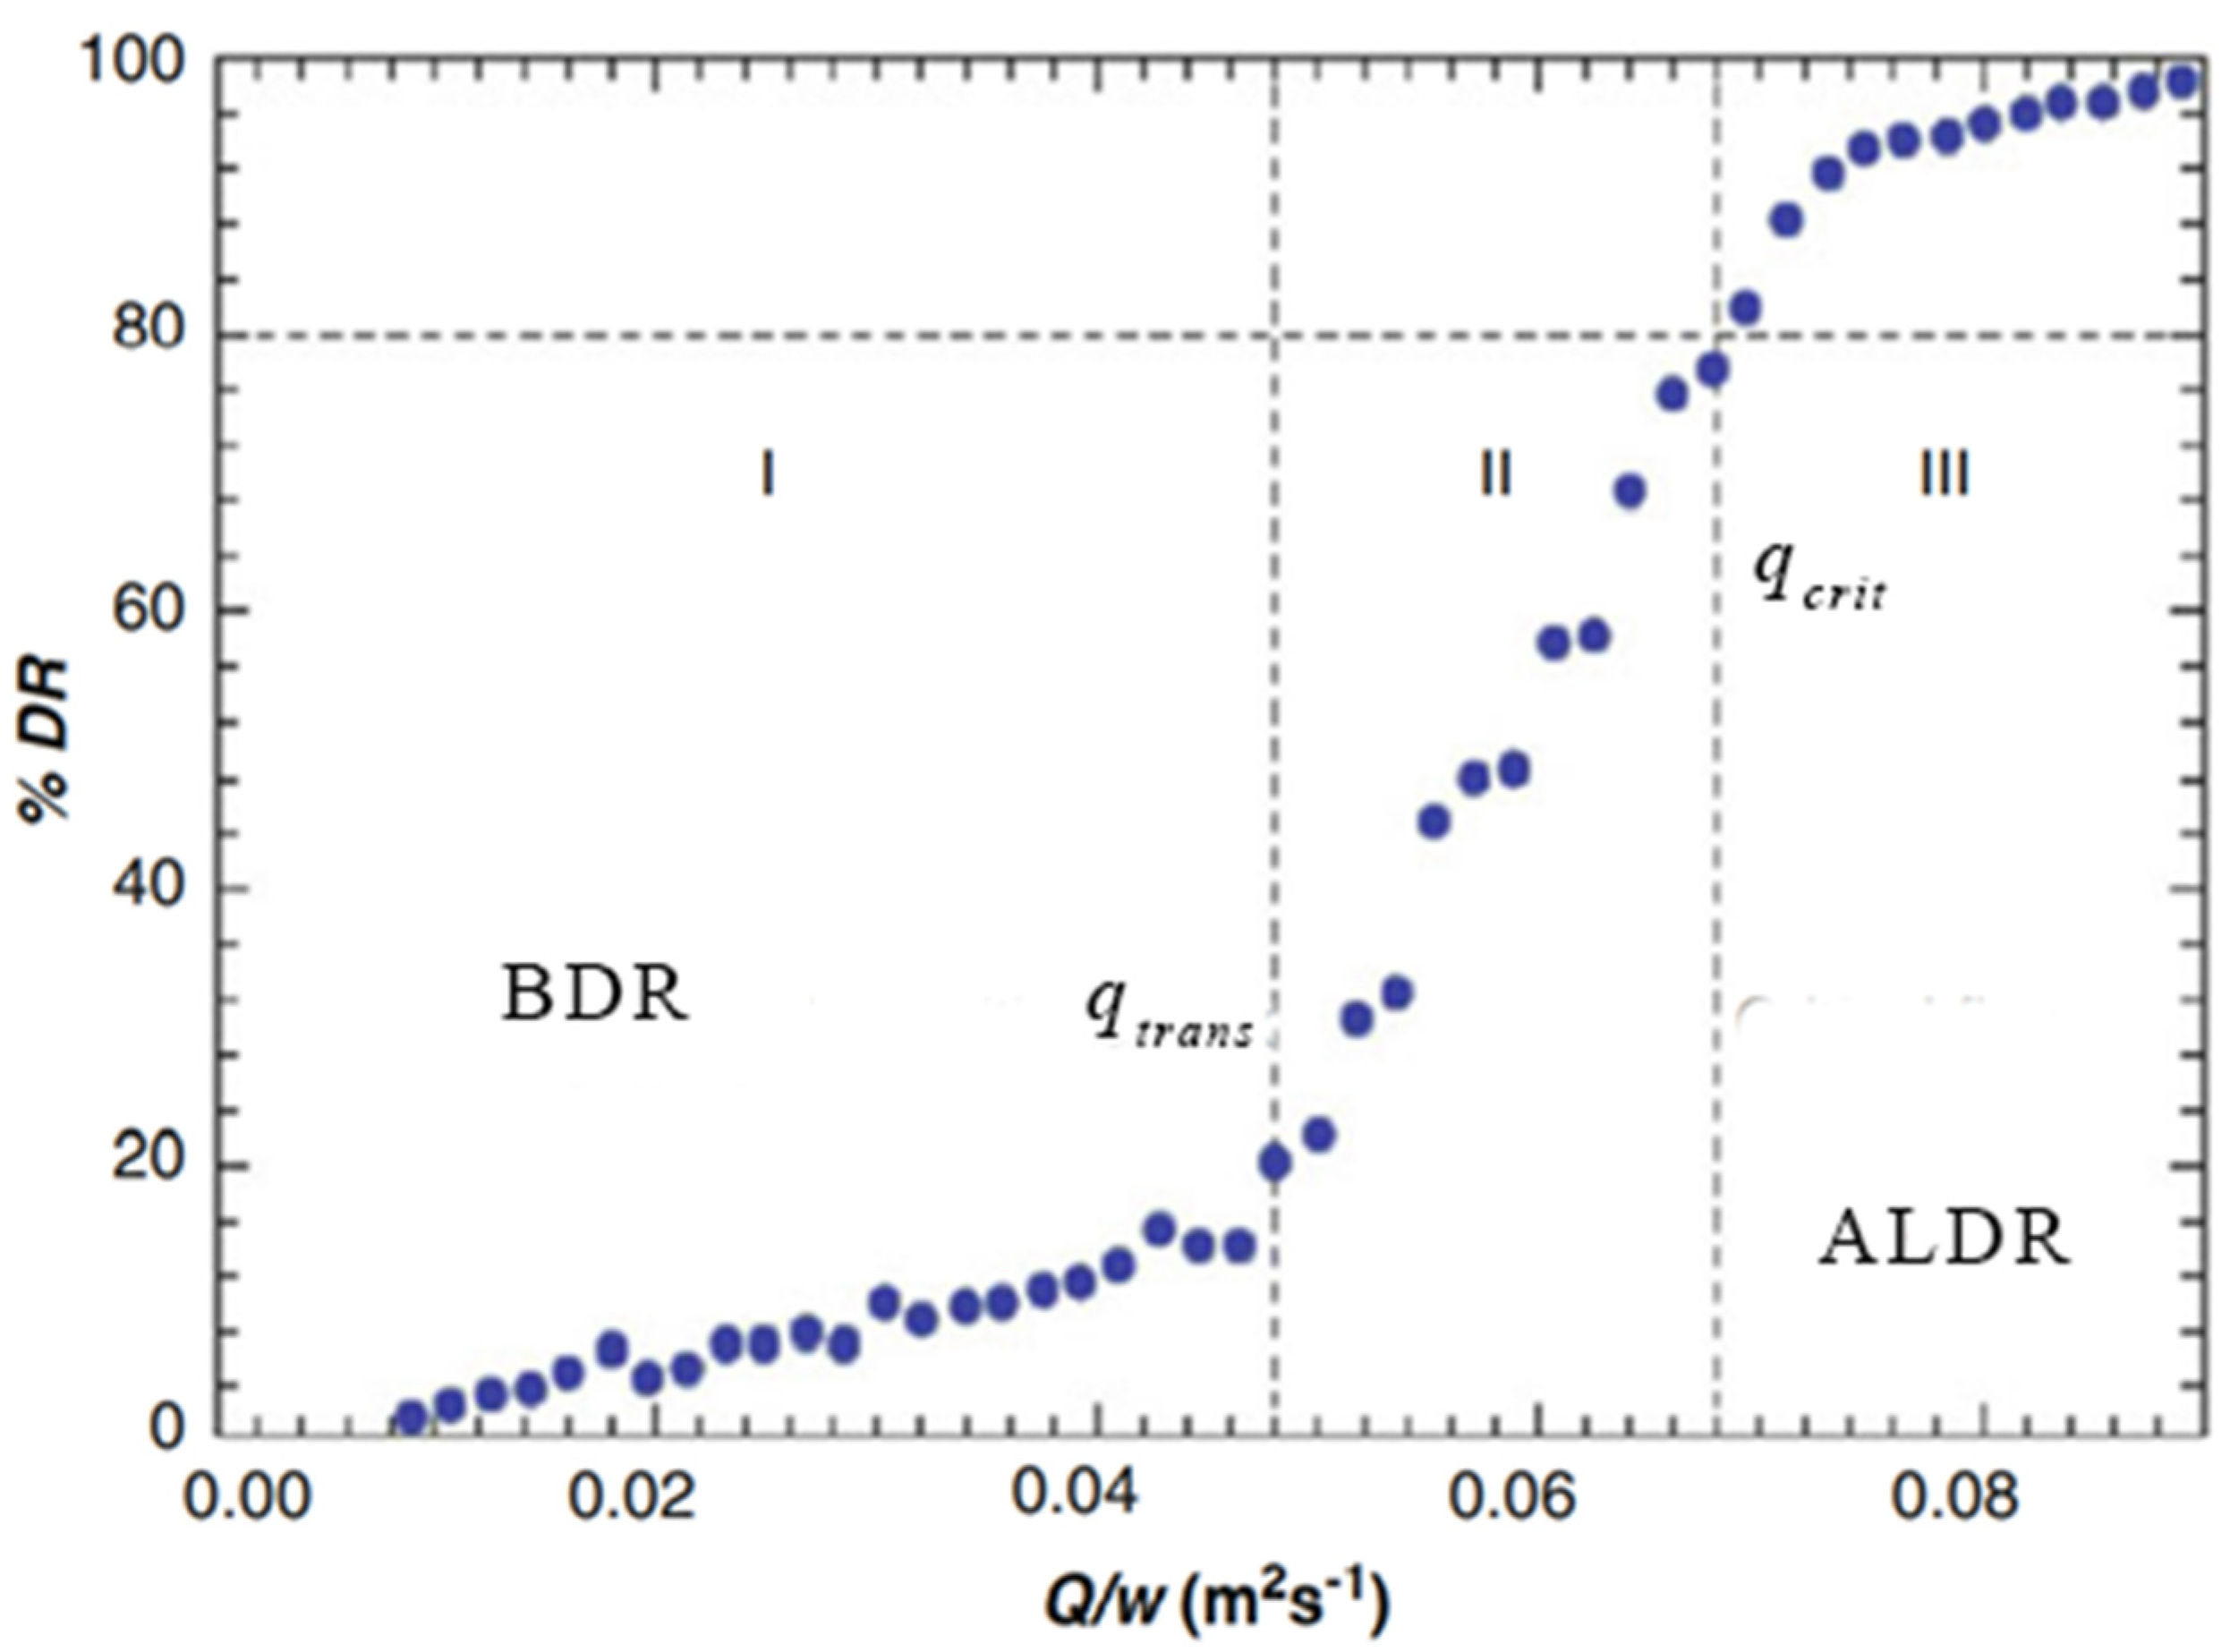
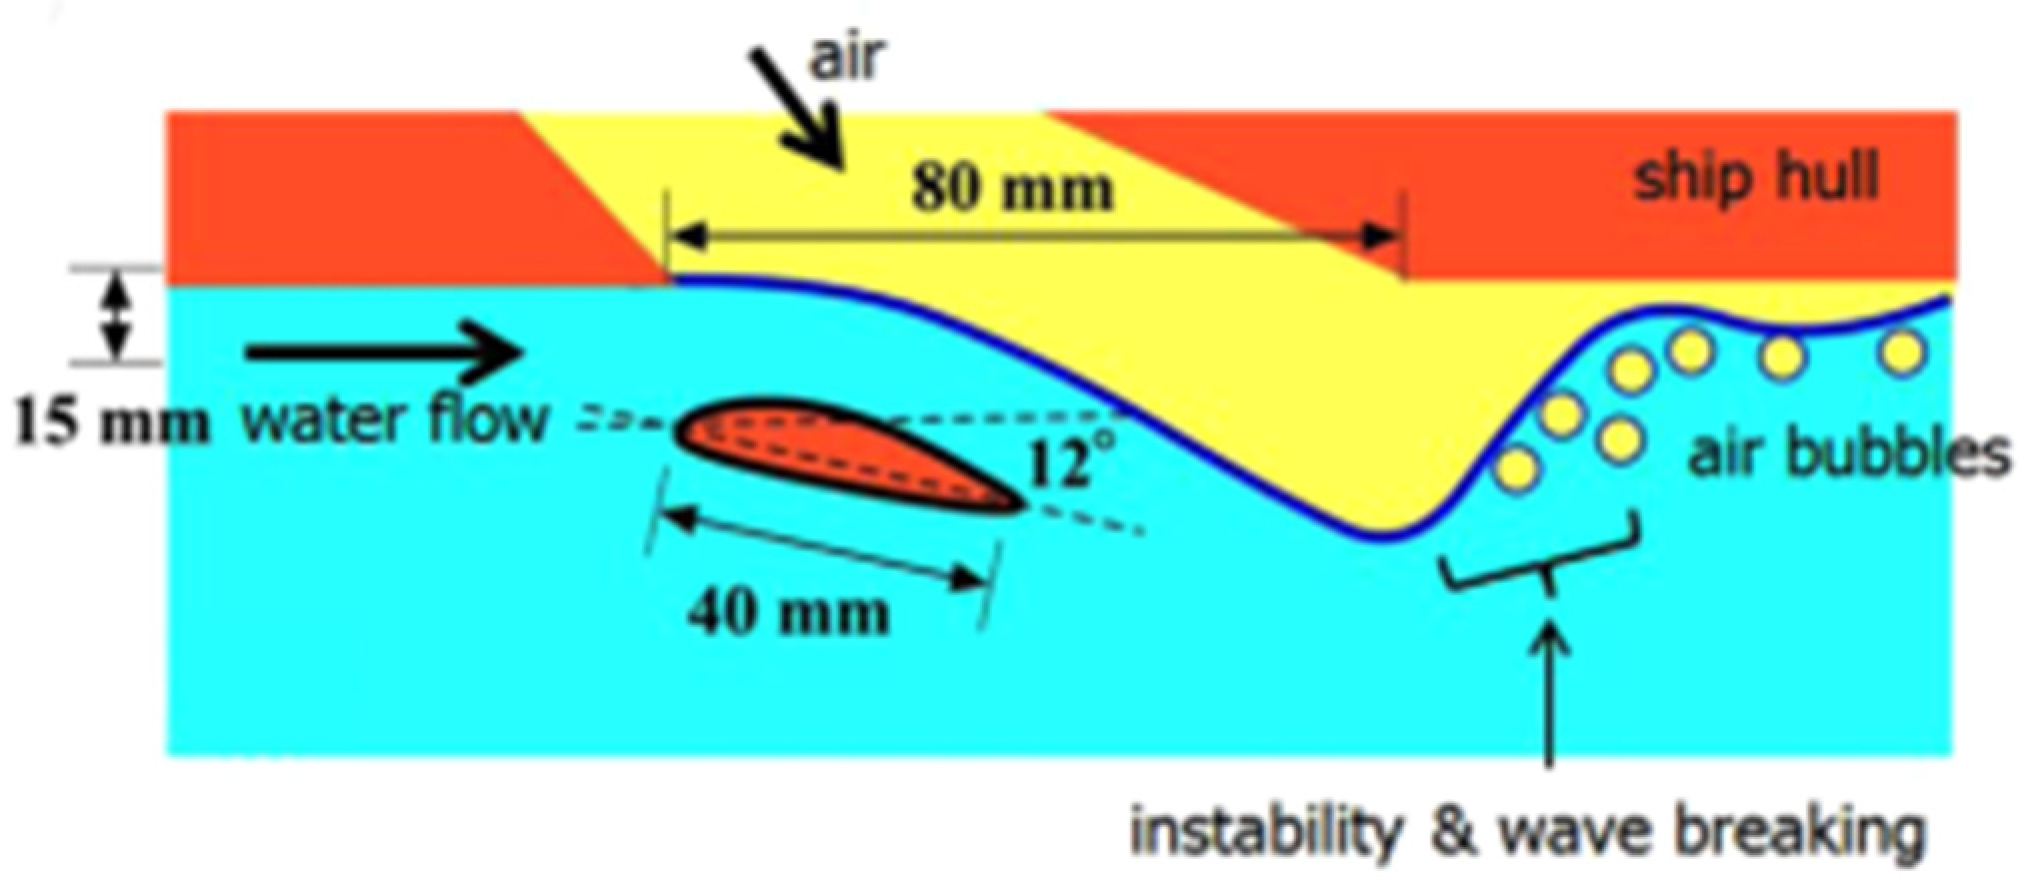
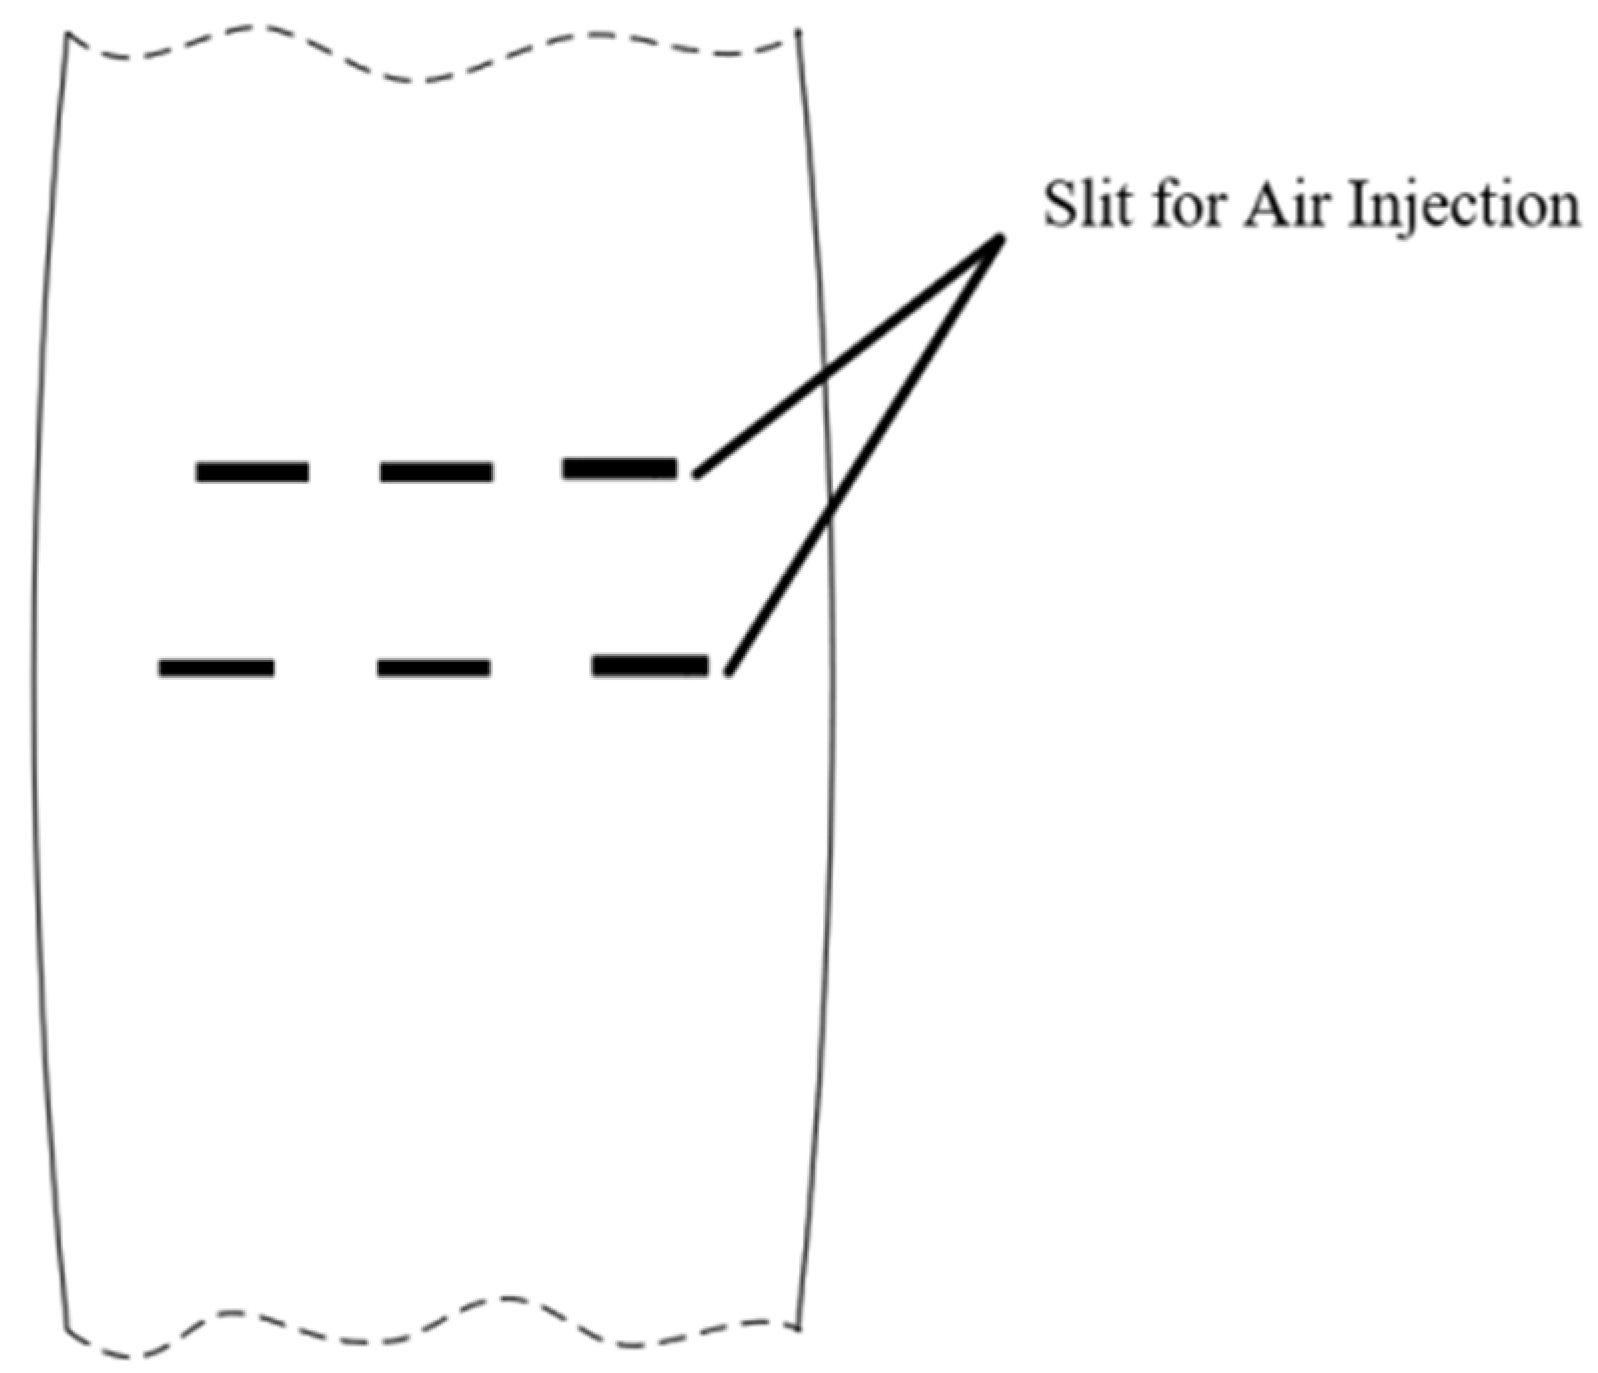
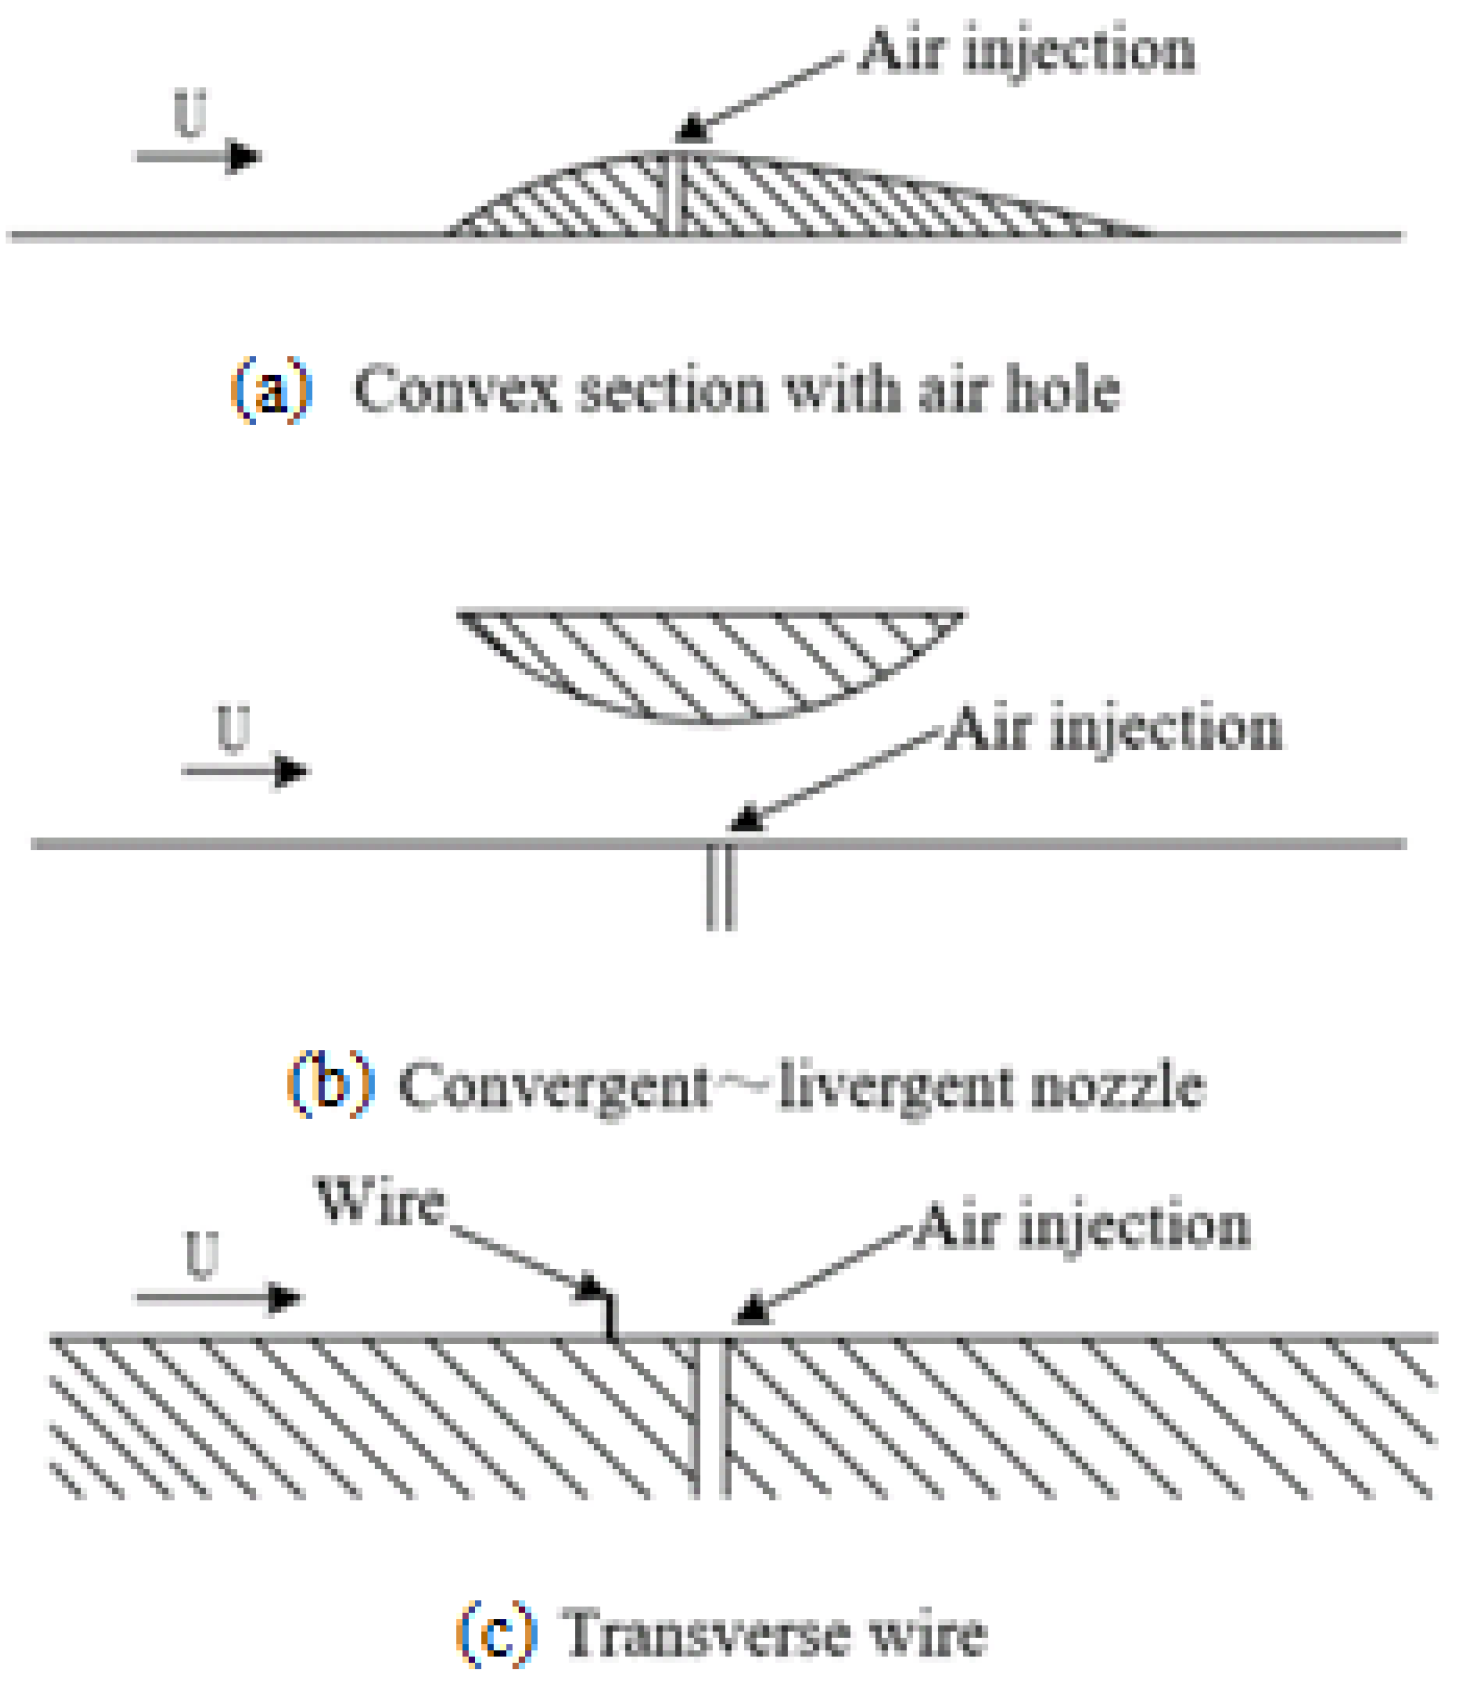
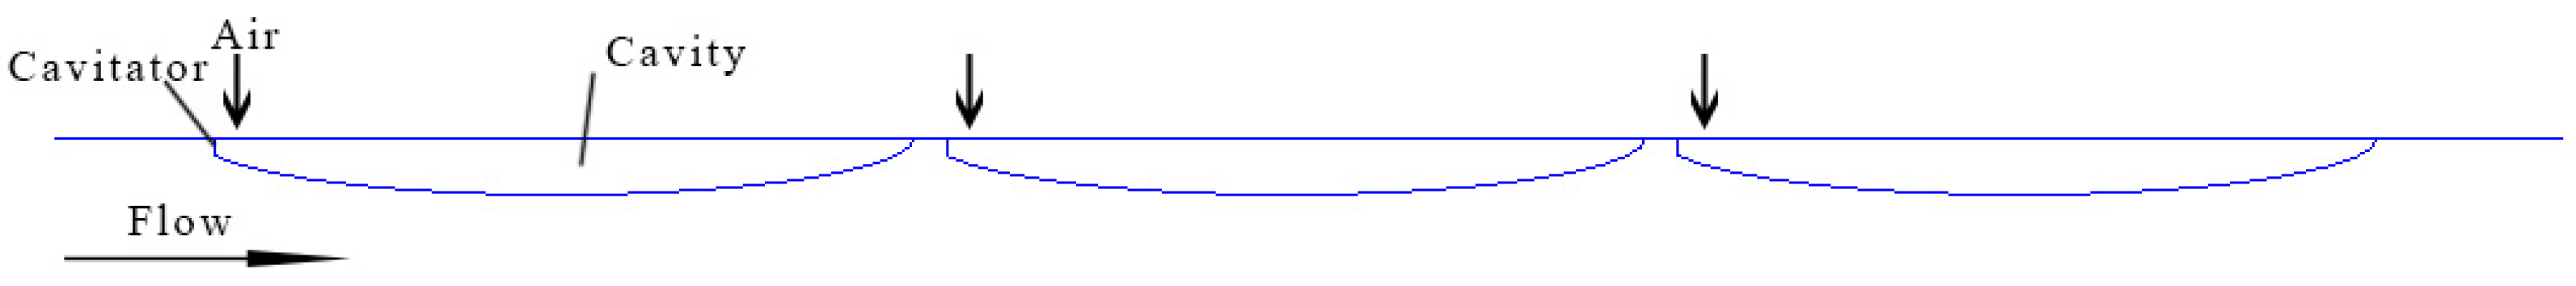
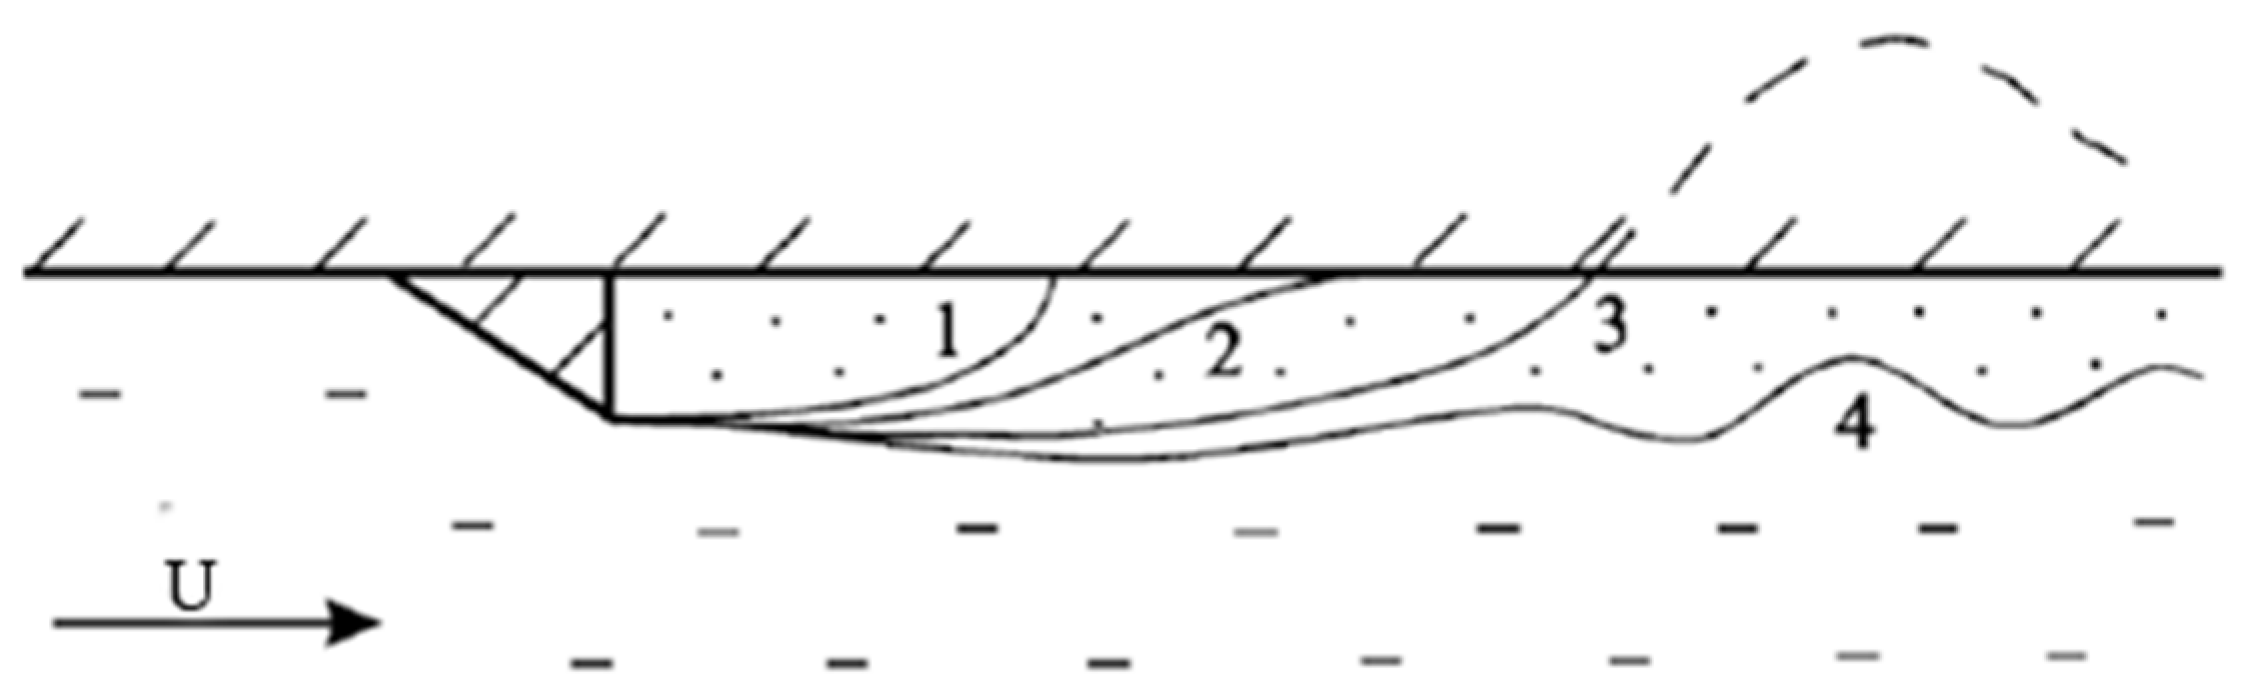
Table 1.
Comparison of different types of air lubrication drag reduction techniques.
| Air Lubrication Drag Reduction Mode | Influencing Factors of Drag Reduction Effect | Numerical Study Model | Drag Reduction Mechanism |
|---|---|---|---|
| MBDR | Gas type; bubble size; void fraction; inflow velocity; distribution of air vents; air injection rate; the tilting angle of the hull. | Euler–Euler model; Euler–Lagrange model; mixture model; MUSIG model. | The momentum generated by the injected gas changes the fluid structure in the boundary layer. The injected gas causes a change in the velocity gradient in the turbulent boundary layer. The injected gas creates a thin film of liquid covering the wall surface, thereby reducing the shear stress and drag forces between water and wall. |
| ALDR | Inflow velocity; vent size; distribution of air vents; air injection rate. | Mixture model; VOF model. | The injection of gas changes the local effective viscosity and density of the fluid, thereby changing the local turbulent Reynolds number of the fluid. |
| ACDR | Groove shape; layout of air cavities; inflow velocity; air injection rate. | VOF model; VOF and two-fluid model; VOF and MUSIG model; “volume fraction redistribution” model; Euler–Euler coupled with VOF and subgrid gas entrainment model using PBM. | Gas is injected into the physical cavity to form an air cushion that separates the liquid from the hull, thereby reducing local friction. |
Publisher’s Note: MDPI stays neutral with regard to jurisdictional claims in published maps and institutional affiliations. |
© 2022 by the authors. Licensee MDPI, Basel, Switzerland. This article is an open access article distributed under the terms and conditions of the Creative Commons Attribution (CC BY) license (https://creativecommons.org/licenses/by/4.0/).
Share and Cite
MDPI and ACS Style
An, H.; Pan, H.; Yang, P. Research Progress of Air Lubrication Drag Reduction Technology for Ships. Fluids 2022, 7, 319. https://doi.org/10.3390/fluids7100319
AMA Style
An H, Pan H, Yang P. Research Progress of Air Lubrication Drag Reduction Technology for Ships. Fluids. 2022; 7(10):319. https://doi.org/10.3390/fluids7100319
Chicago/Turabian StyleAn, Hai, Haozhe Pan, and Po Yang. 2022. "Research Progress of Air Lubrication Drag Reduction Technology for Ships" Fluids 7, no. 10: 319. https://doi.org/10.3390/fluids7100319