Case Report

A Simplified Mathematical Formulation for Water Quality Index (WQI): A Case Study in the Kelani River Basin, Sri Lanka

1
Department of Civil Engineering, Faculty of Engineering, Sri Lanka Institute of Information Technology, New Kandy Road, Malabe, Colombo 10115, Sri Lanka
2
Department of Civil and Environmental Engineering, Faculty of Engineering, University of Ruhuna, Hapugala 80000, Sri Lanka
3
Department of Civil and Environmental Engineering, The Faculty of Engineering, The University of West Indies, St. Augustine 32080, Trinidad and Tobago
4
Department of Civil Engineering, Water Resources and Environmental Division, National Institute of Technology Warangal, Warangal 506004, India
*
Author to whom correspondence should be addressed.
Fluids 2022, 7(5), 147; https://doi.org/10.3390/fluids7050147
Submission received: 6 April 2022 / Revised: 22 April 2022 / Accepted: 22 April 2022 / Published: 23 April 2022

Abstract

:
Surface water quality is degraded due to industrialization; however, it is one of the widely used sources for water supply systems worldwide. Thus, the polluted water creates significant issues for the health of the end users. However, poor attention and concern can be identified on this important issue in most developing countries, including Sri Lanka. The Kelani River in Sri Lanka is the heart of the water supply of the whole Colombo area and has the water intake for drinking purposes near an industrialized zone (Biyagama). Therefore, this study intends to analyze the effect of industrialization on surface water quality variation of the Kelani River basin in Sri Lanka in terms of the water quality index (WQI). We proposed a regression model to predict the WQI using the water quality parameters. Nine water quality parameters, including pH, total phosphate, electric conductivity, biochemical oxygen demand, temperature, nitrates, dissolved oxygen, chemical oxygen demand, and chlorine evaluated the Kelani River water quality. The proposed regression model was used to examine the water quality of samples obtained at twelve locations from January 2005 to December 2012. The highest WQI values were found in Raggahawatte Ela throughout the 8 years, located near the Biyagama industrial zone. The relationship of industries to water quality in the Kelani River is stated. The surface water quality gradually decreased as a result of development and industrialized activities. Therefore, this work showcases and recommends the importance of introducing necessary actions and considerations for future water management systems.

1. Introduction

Water is a primary necessity for all humans and natural systems and the most critical resource for society’s sustainable development [1]. Surface water has a significant contribution to world drinking water volumes. Therefore, surface water can be treated as one of the most important ecological factors, which balance the hydrologic cycle. The river basins are an essential component of the surface water and thus of hydrology. They have unique geographical characteristics that guide various flow situations. Each river basin is a self-contained drainage system in which different types of water are cycled through constant flow and mutual transformation [2]. Increased anthropogenic activities, such as sand mining, transportation, irrigation, small-scale fishing, manufacturing, and disposal of municipal and agricultural waste including toxic chemicals, have increased the amount of waste and pollutants discharged directly into rivers. As a result, natural river systems become contaminated [3,4,5]. Additionally, numerous studies have revealed that the impact of industries on surface water has increased considerably in recent years while highlighting the critical parameters affecting the quality of surface water [5,6,7]. Statistics showcase that around 10% of industries release treated wastewater directly into streams, while the remainder dumps untreated effluent directly into rivers and other bodies of water [8]. However, the dumping percentage for untreated wastewater can be higher in developing countries.
Surface water deterioration due to increased pollution is one of the significant issues facing the growing populations worldwide [9]. This is a considerable threat to the drinking water supply in most countries and impacts economic development due to various health issues. According to United Nations International Children’s Emergency Fund (UNICEF) [10], especially in Asia, improving the quality of water supplies is a key priority because poor water quality significantly threatens community health, primarily through water-borne diseases. To minimize these problems, many countries executed their water quality protection measures through continuous water quality monitoring [11]. It is imperative to evaluate the quality of water and the key parameters, which usually vary spatially and temporally, to have a clearer understanding of water resource conditions for human consumption and other activities.
The quality of surface water and the quality of groundwater are at a threat due to anthropogenic activities all over the world [12,13,14]. The situation is similar in Sri Lanka, and both surface and groundwater quality have deteriorated dramatically during the last few decades. Rapid industrialization in Sri Lanka is one of the main reasons for the water quality deterioration [15,16,17]. Major industries and factories such as textile industries, raw rubber factories, rubber latex factories, beverage factories, milk and food industries, plywood factories, steel manufacturing factories, chemical industries, fertilizer manufacturing factories, petroleum refineries, and other commercial industries directly contribute to water pollution-induced problems in Sri Lanka [18,19]. The Kelani River has been identified as one of the most polluted rivers in Sri Lanka. However, the Kelani River is the primary source of water supply for Colombo, the commercial heart of Sri Lanka. Therefore, the catchment area of the Kelani River basin from Glencorse (6.9643° N, 80.1877° E) to the river mouth (6.9787° N, 79.8700° E) has been identified as an environmentally sensitive area considering the importance of maintaining acceptable water quality concentration limits.
However, most of the manufacturing industries (both government and private sector) are concentrated in the western province of Sri Lanka and occupy a significant proportion of the area of the Kelani River basin. These include the largest export processing zones and industrial estates, such as the Biyagama and Katunayake export processing zones and the Seethawaka Industrial estate. Some industries have direct effluents to the river, while some other industries release the treated wastewater. Therefore, the acceptable water quality concentrations are exceeded at several sites along the river.
Therefore, the drinking water supply to Colombo is under threat, and solid research and implementation of the outcomes are required to provide safe drinking water to more than 1 million people. However, the study is a minimum to provide a holistic view of the water quality along the Kelani River as a single index. The water quality index (WQI) combines a set of water quality parameters into a single index and is extensively used in surface water quality assessments [20,21,22,23]. The index provides the overall water quality at an identified location and time. Therefore, to overcome the identified research gap, the measured water quality parameters along the Kelani River were presented as a single index, the WQI. The variations in water quality concentrations were analyzed, and spatial representations of the affected areas were presented.

2. Study Area and Methodology
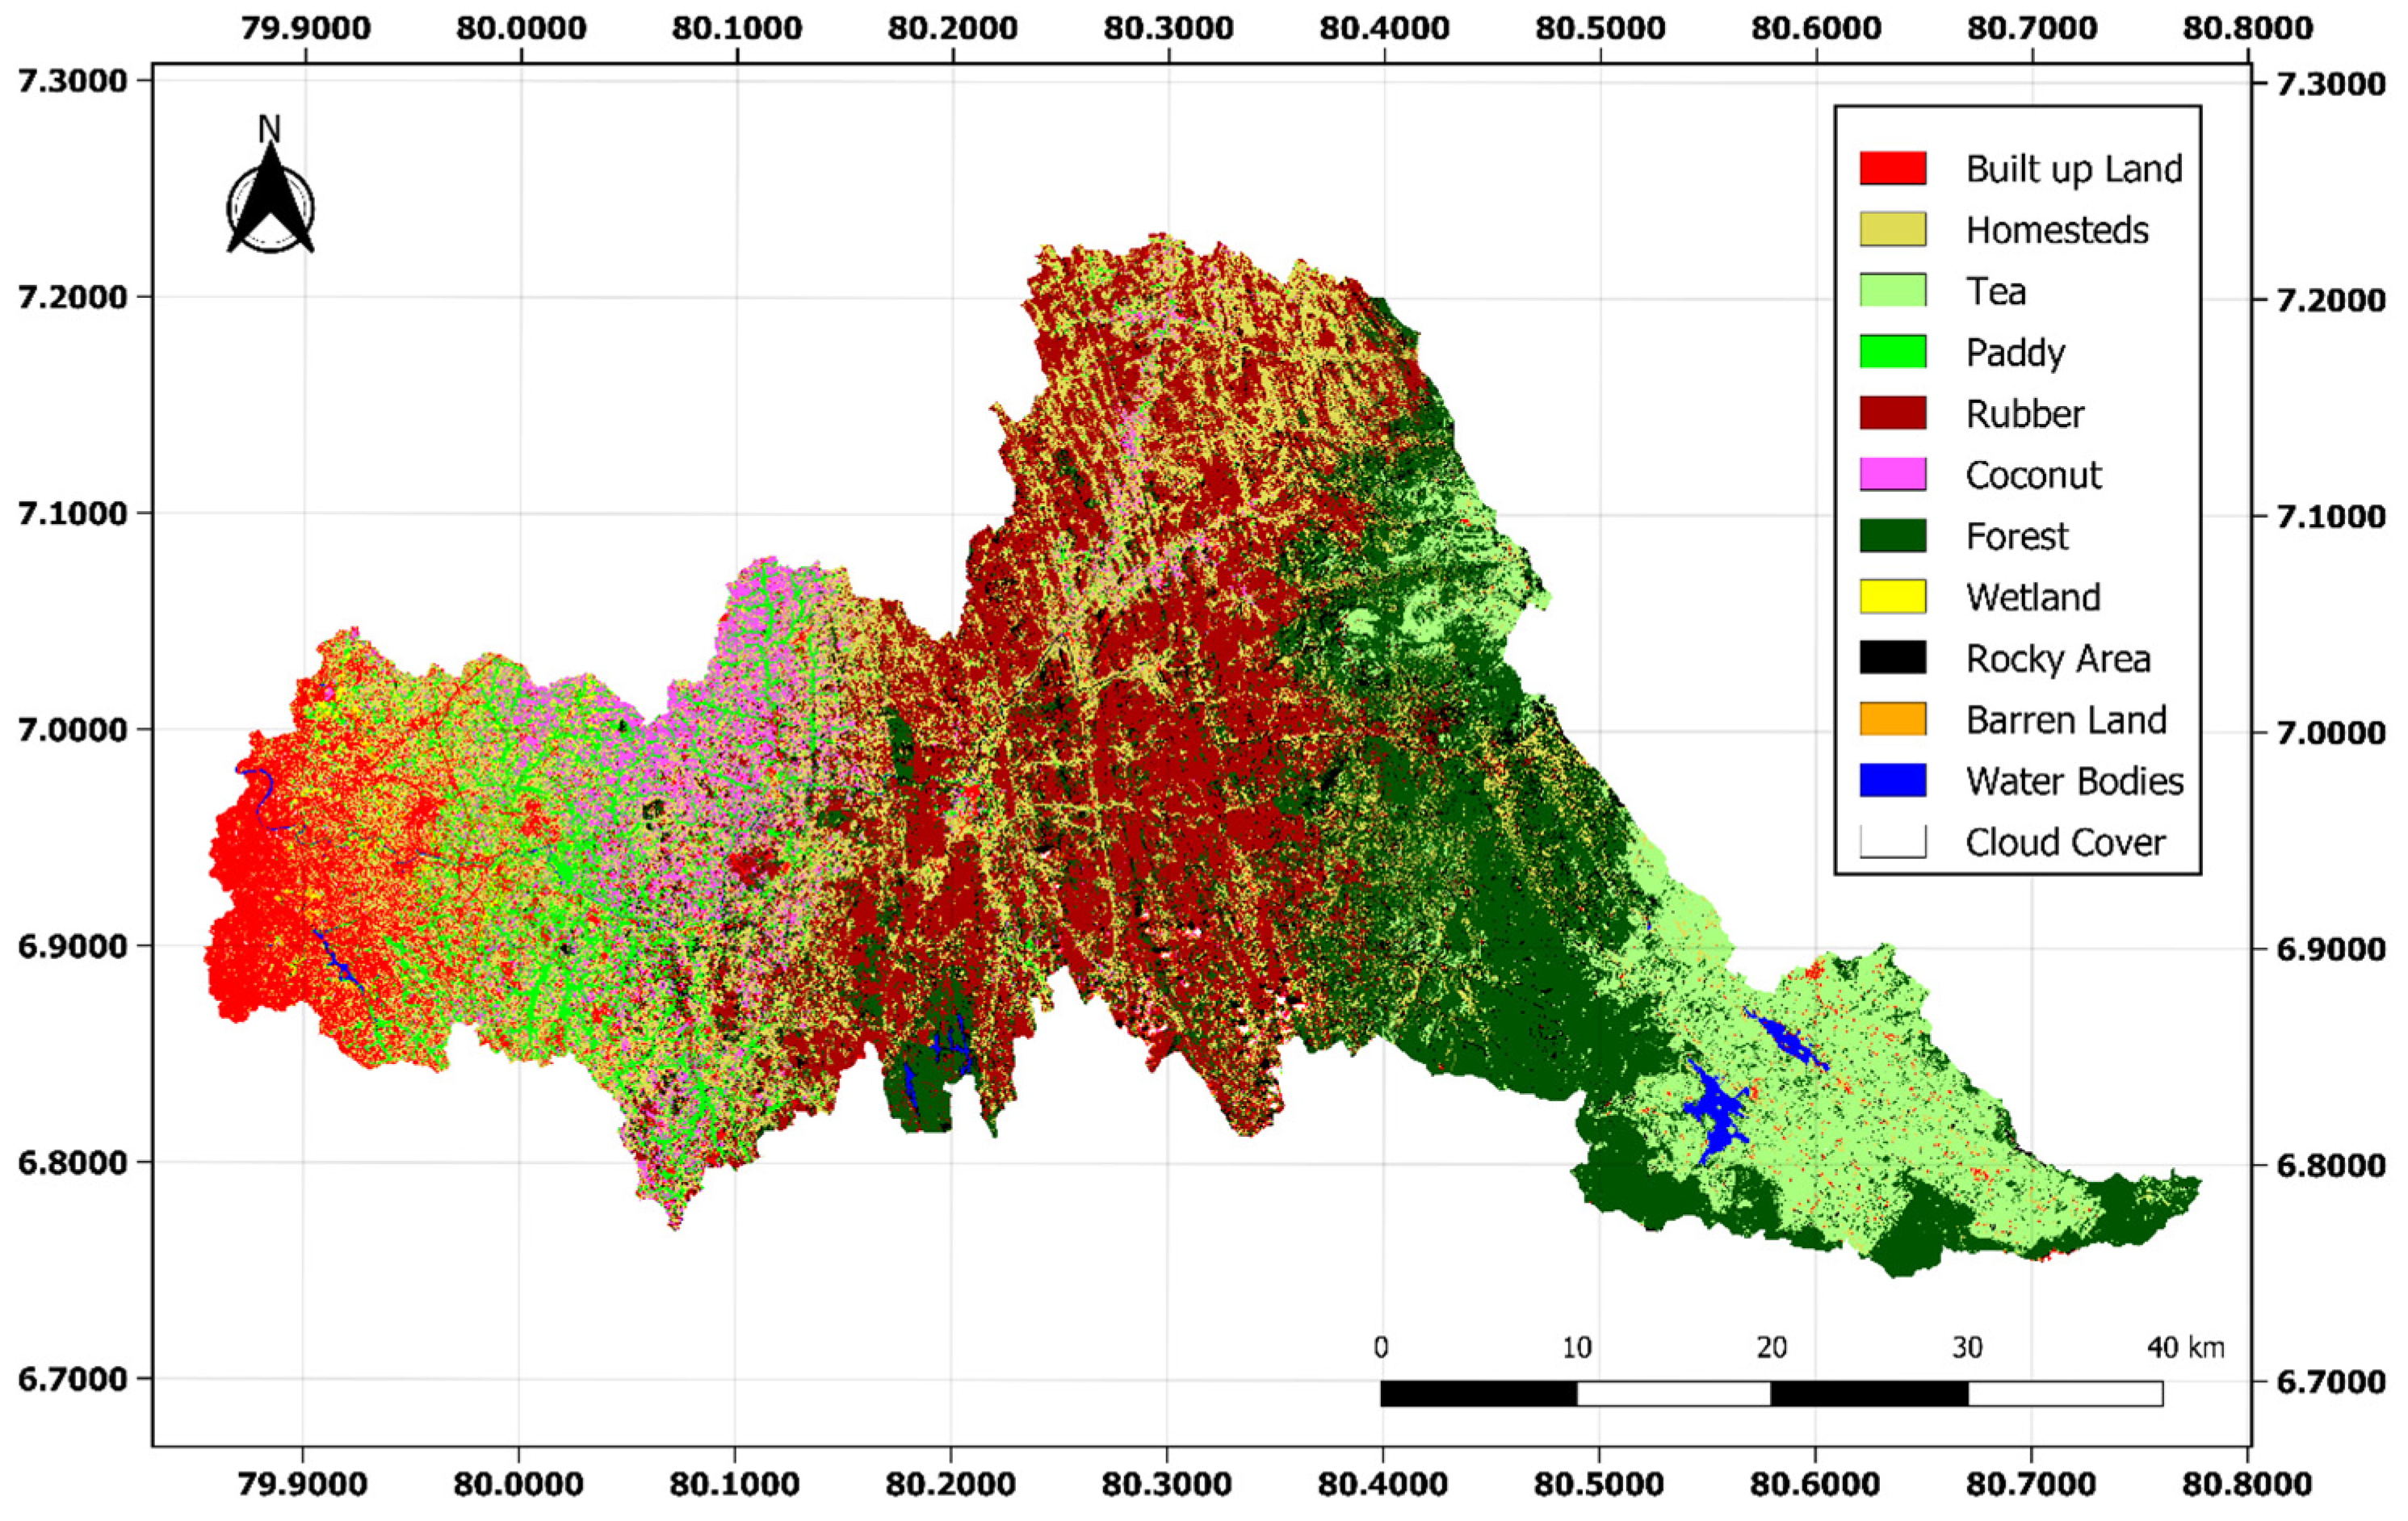
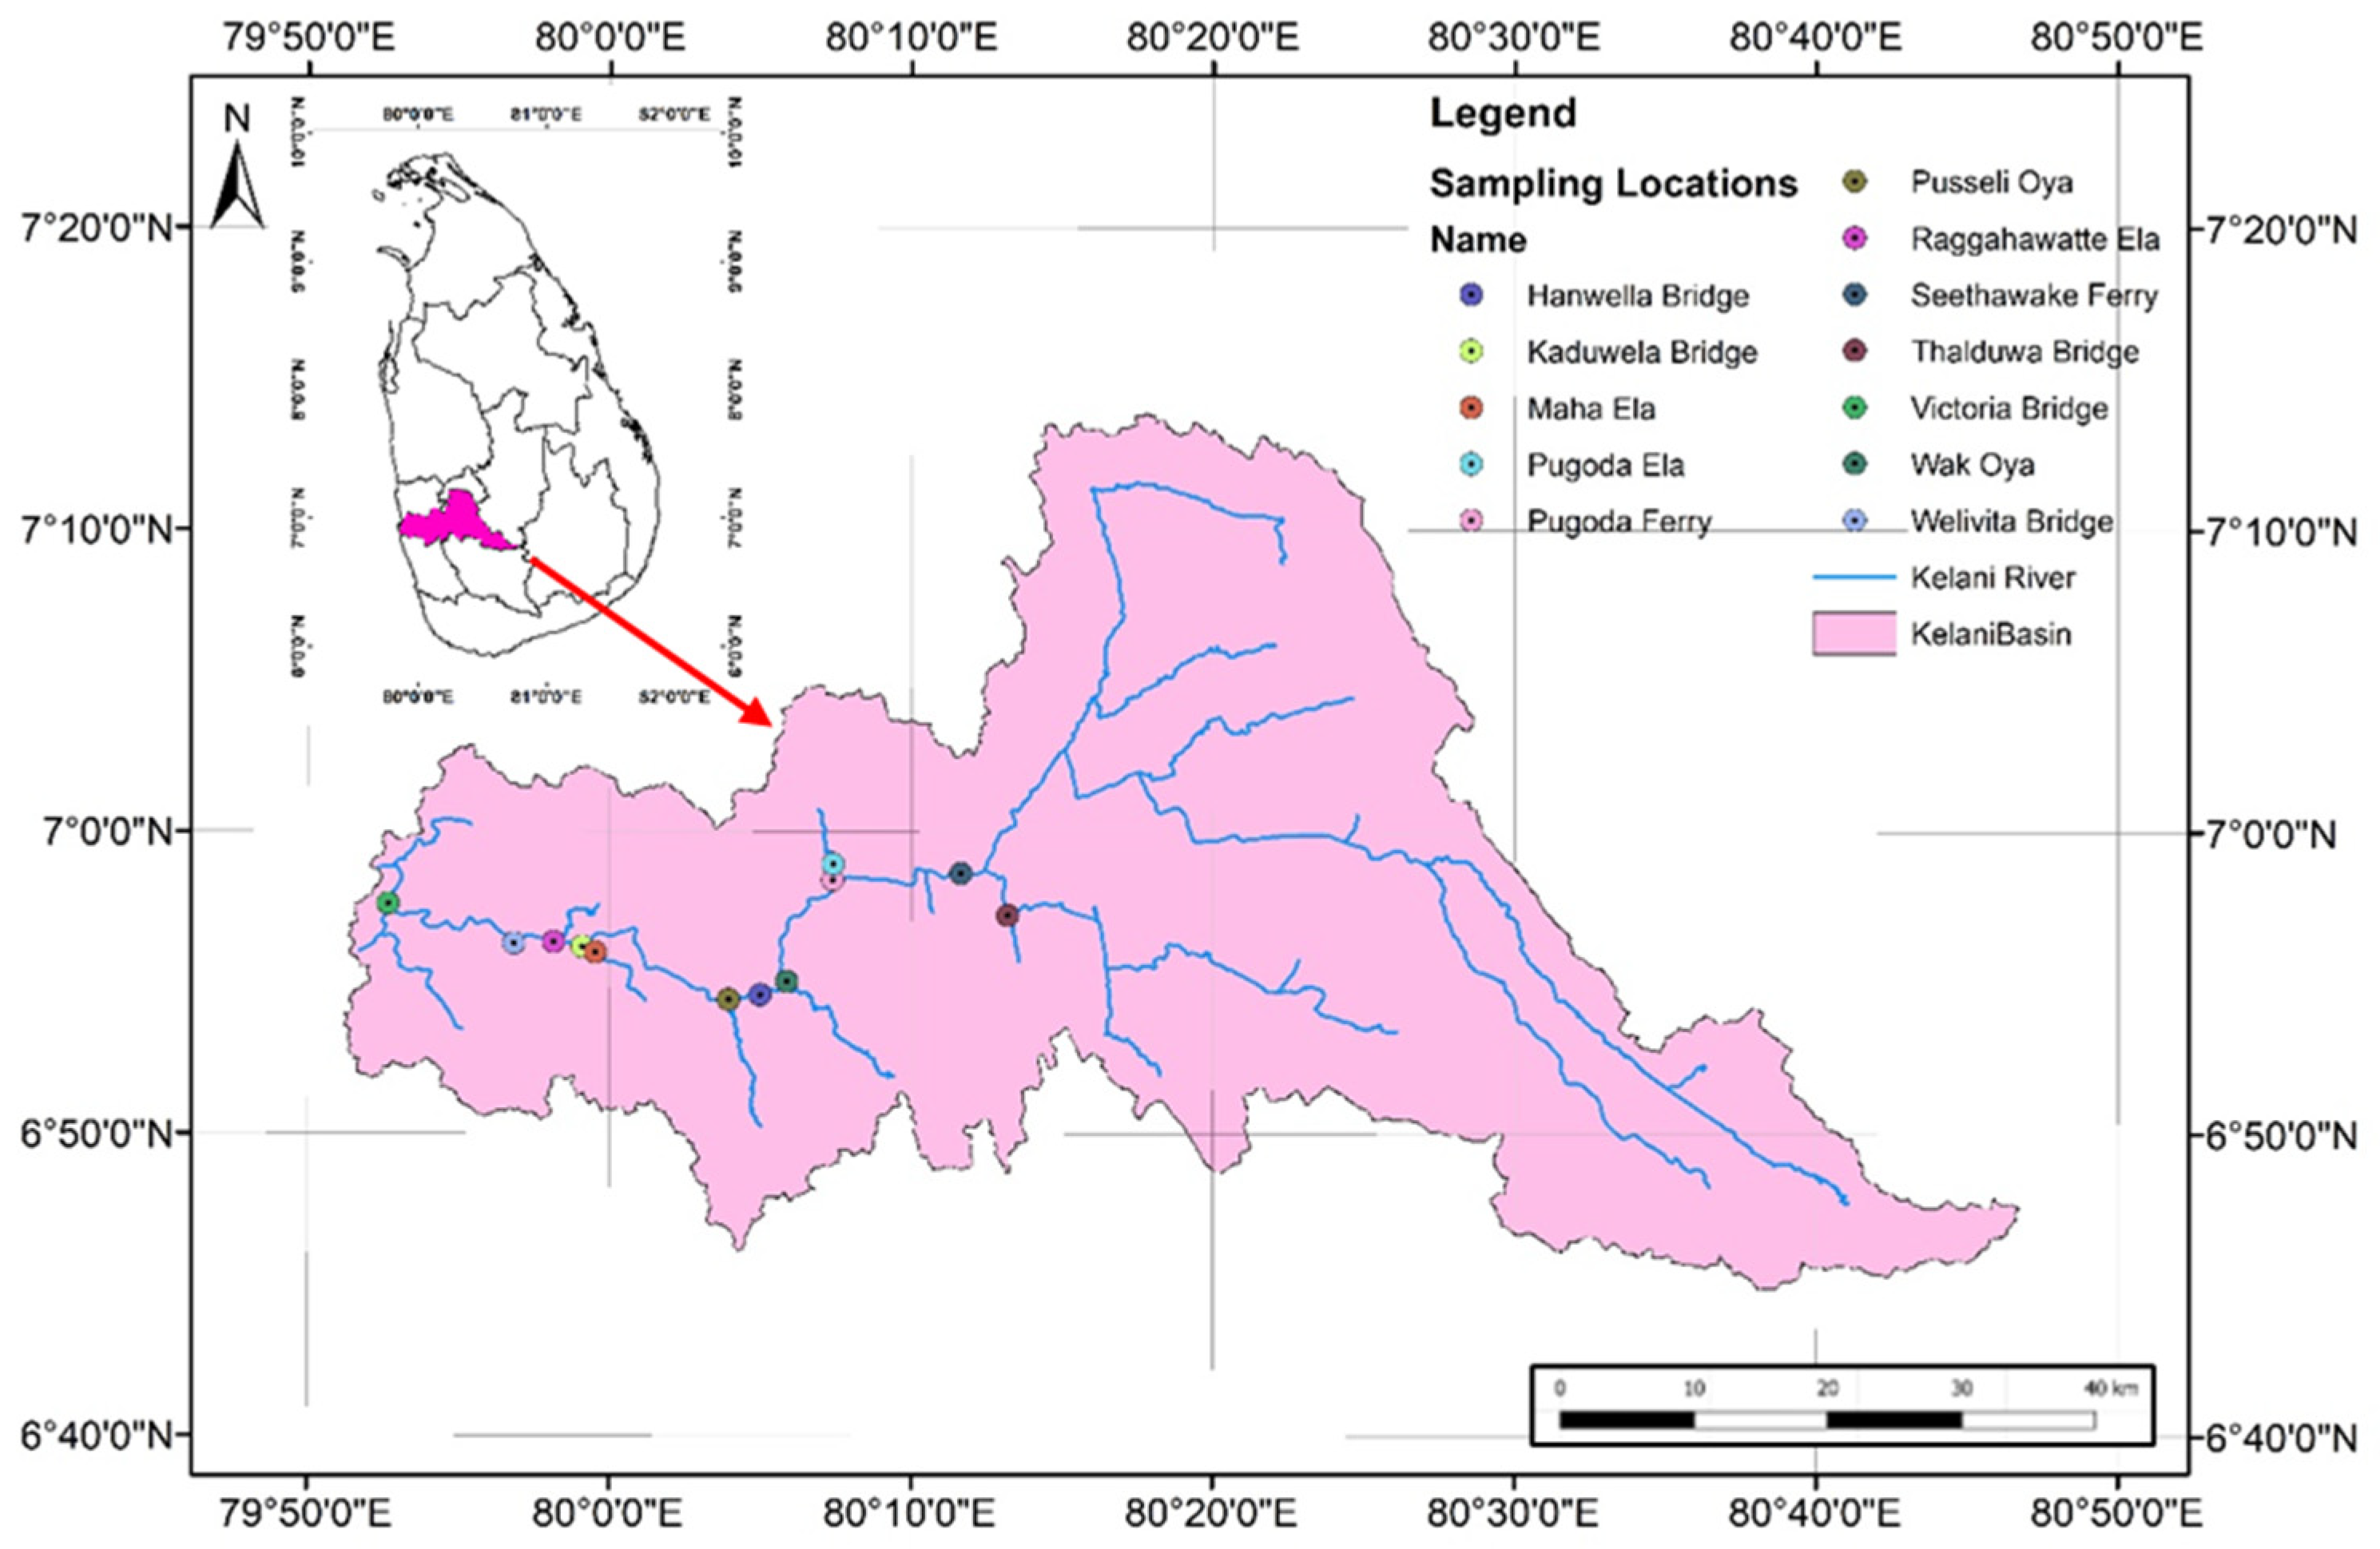
2.1. Study Area

The Kelani River is one of the longest rivers in Sri Lanka. It is 144 km long and drains an area of 2230 km 2 [24]. It starts in the middle of the central hills in Sri Lanka (Nallatanniya area) and ends at Mattakuliya in Colombo, Sri Lanka’s most prominent commercial city. As was already stated, the Kelani River is one of the most important rivers in Sri Lanka as it covers more than 80% of the water demand of Colombo. The other main uses of Kelani River’s water are transportation, irrigation, fisheries, and hydropower generation. The flow in the Kelani River varies between 800 and 1500 m3/s during monsoon seasons, whereas it falls to 20–25 m3/s in the dry season, depending on the operation of 3 reservoirs in the catchment [25]. The land use patterns of the Kelani River basin are showcased in Figure 1. The upstream is somewhat greenish, whereas the downstream of the river basin has significant built-up land.
Cabinet Paper No 93/340/166 [26] identified and designated the Kelani River basin as an environmentally sensitive area, including the divisional secretariats of Kolonnawa, Kelaniya, Hanwella, Biyagama, Ruwanwella, Homagama, and Dehiovita [27]. Therefore, the downstream of the Kelani River basin was selected for this study.
Openly available water quality data were collected from The Central Environmental Authority (CEA) for twelve sampling sites: (1) Thalduwa Bridge, (2) Seethawaka Ferry, (3) Pugoda Ferry, (4) Hanwella Bridge, (5) Kaduwela Bridge, (6) Welivita Bridge, (7) Victoria Bridge, (8) Pugoda Ela, (9) Wak Oya, (10) Pusseli Oya, (11) Maha Oya, and (12) Raggahawatte Ela over eight years (i.e., from January 2005 to December 2012). The water quality data can be freely obtained from The Central Environmental Authority website (http://203.115.26.11:8881/environmentalreport/dl, accessed on 21 February 2022). These sampling locations are given in Figure 2.
Nine commonly used water quality parameters including pH, chemical oxygen demand (COD), biochemical oxygen demand (BOD), total nitrate (NO3), total phosphate (PO42−), dissolved oxygen (DO), temperature, electric conductivity (EC), and chloride (Cl) were obtained for this analysis. Based on the literature [5,6,7,25,28,29,30,31] and the availability of the data, these water quality parameters were selected.

2.2. WQI Model Development

The water quality index (WQI) was developed using the weighted arithmetic index method [32] and is given in Equation (1).
W Q I = Q i W i W i
where Q i is the quality rating of i th water quality parameter, and W i ( W i   = 1) is the unit weight of i th water quality parameter. The quality rating, Q i can be calculated using Equation (2).
Q i = 100 ( V i V o ) ( S i V o )
where V i is the actual amount of i th parameter, V o represents the ideal value of the parameter [ V o = 0, except for pH ( V o = 7) and DO ( V o = 14.6 mg/L)], and S i is the standard allowable value for the i th parameter. The unit weight ( W i ) is calculated using Equation (3).
W i = K S i
The term K is a proportional constant and calculated as per Equation (4).
K = 1   ( 1 S i )
Water quality status (WQS) was determined based on the WQI ratings and is presented in Table 1 [32].
The water quality concentrations obtained for the 12 sampling locations were used to calculate the WQI. The results were interpreted to have discussion points in this research. In addition, the water quality standards and guidelines under Sri Lanka Standards (SLS 614) for each water quality constituent are given in Table A1 in Appendix A.

3. Results and Discussion

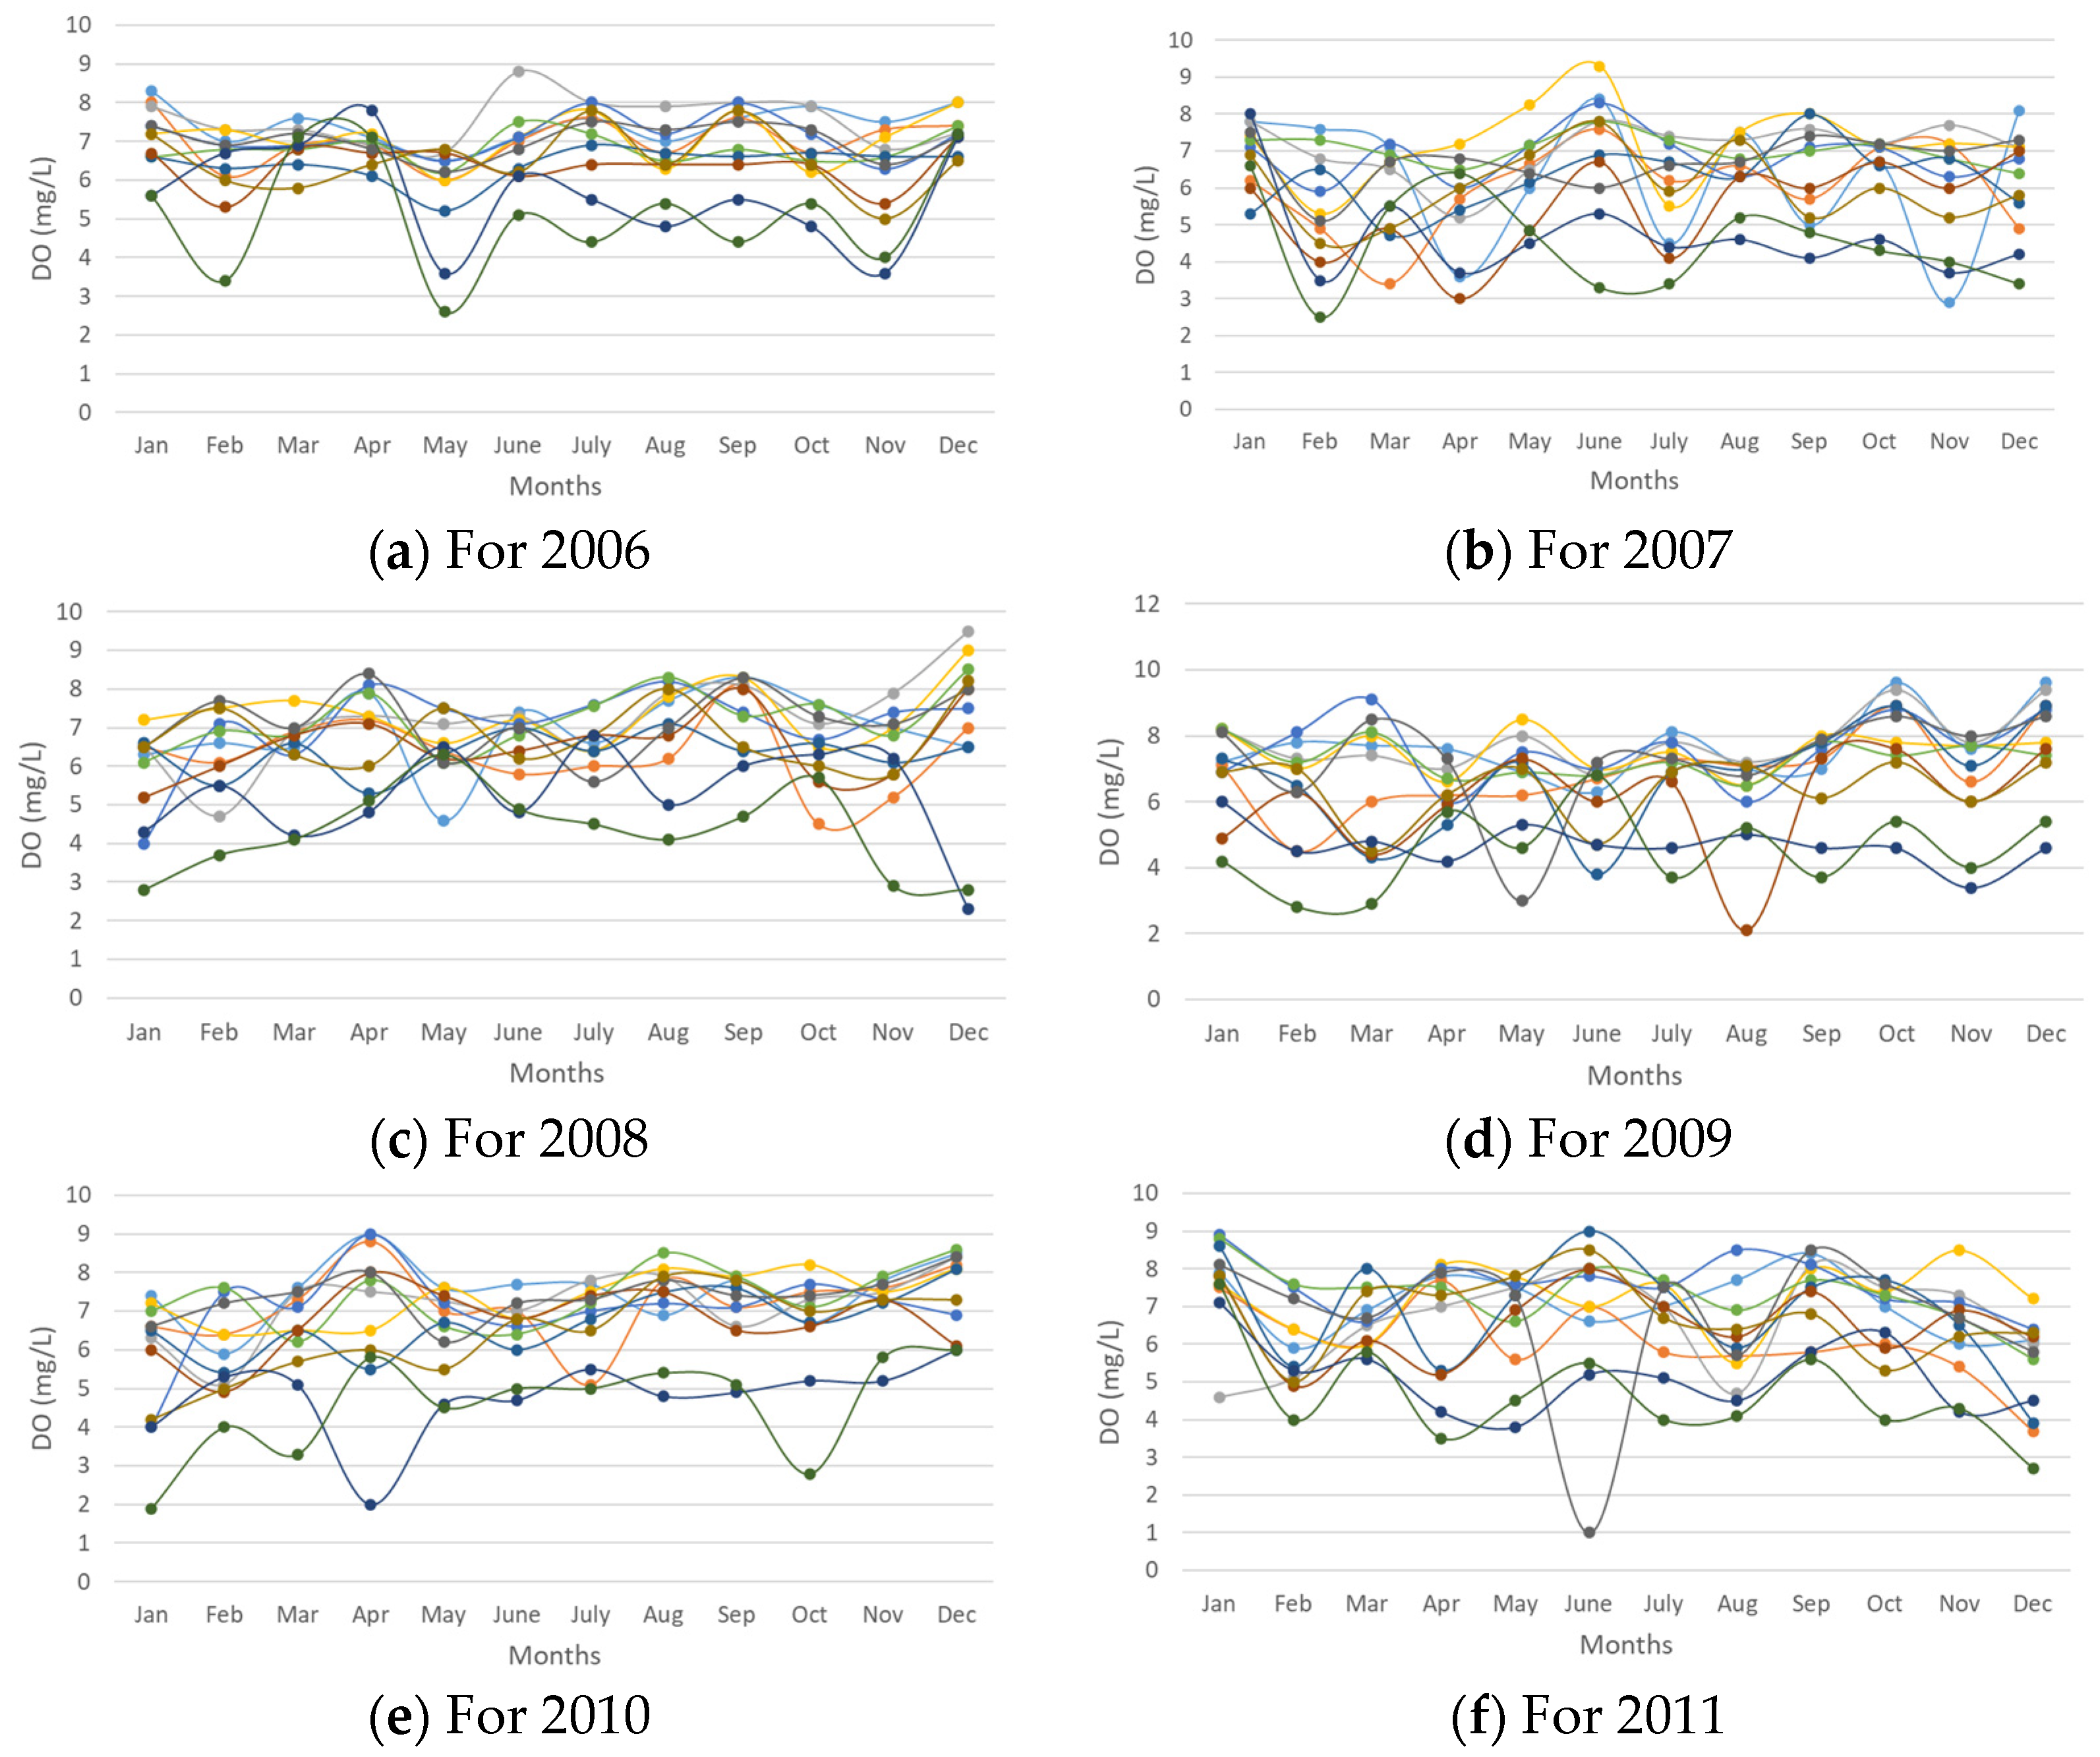
3.1. Water Quality Parameter Presentation
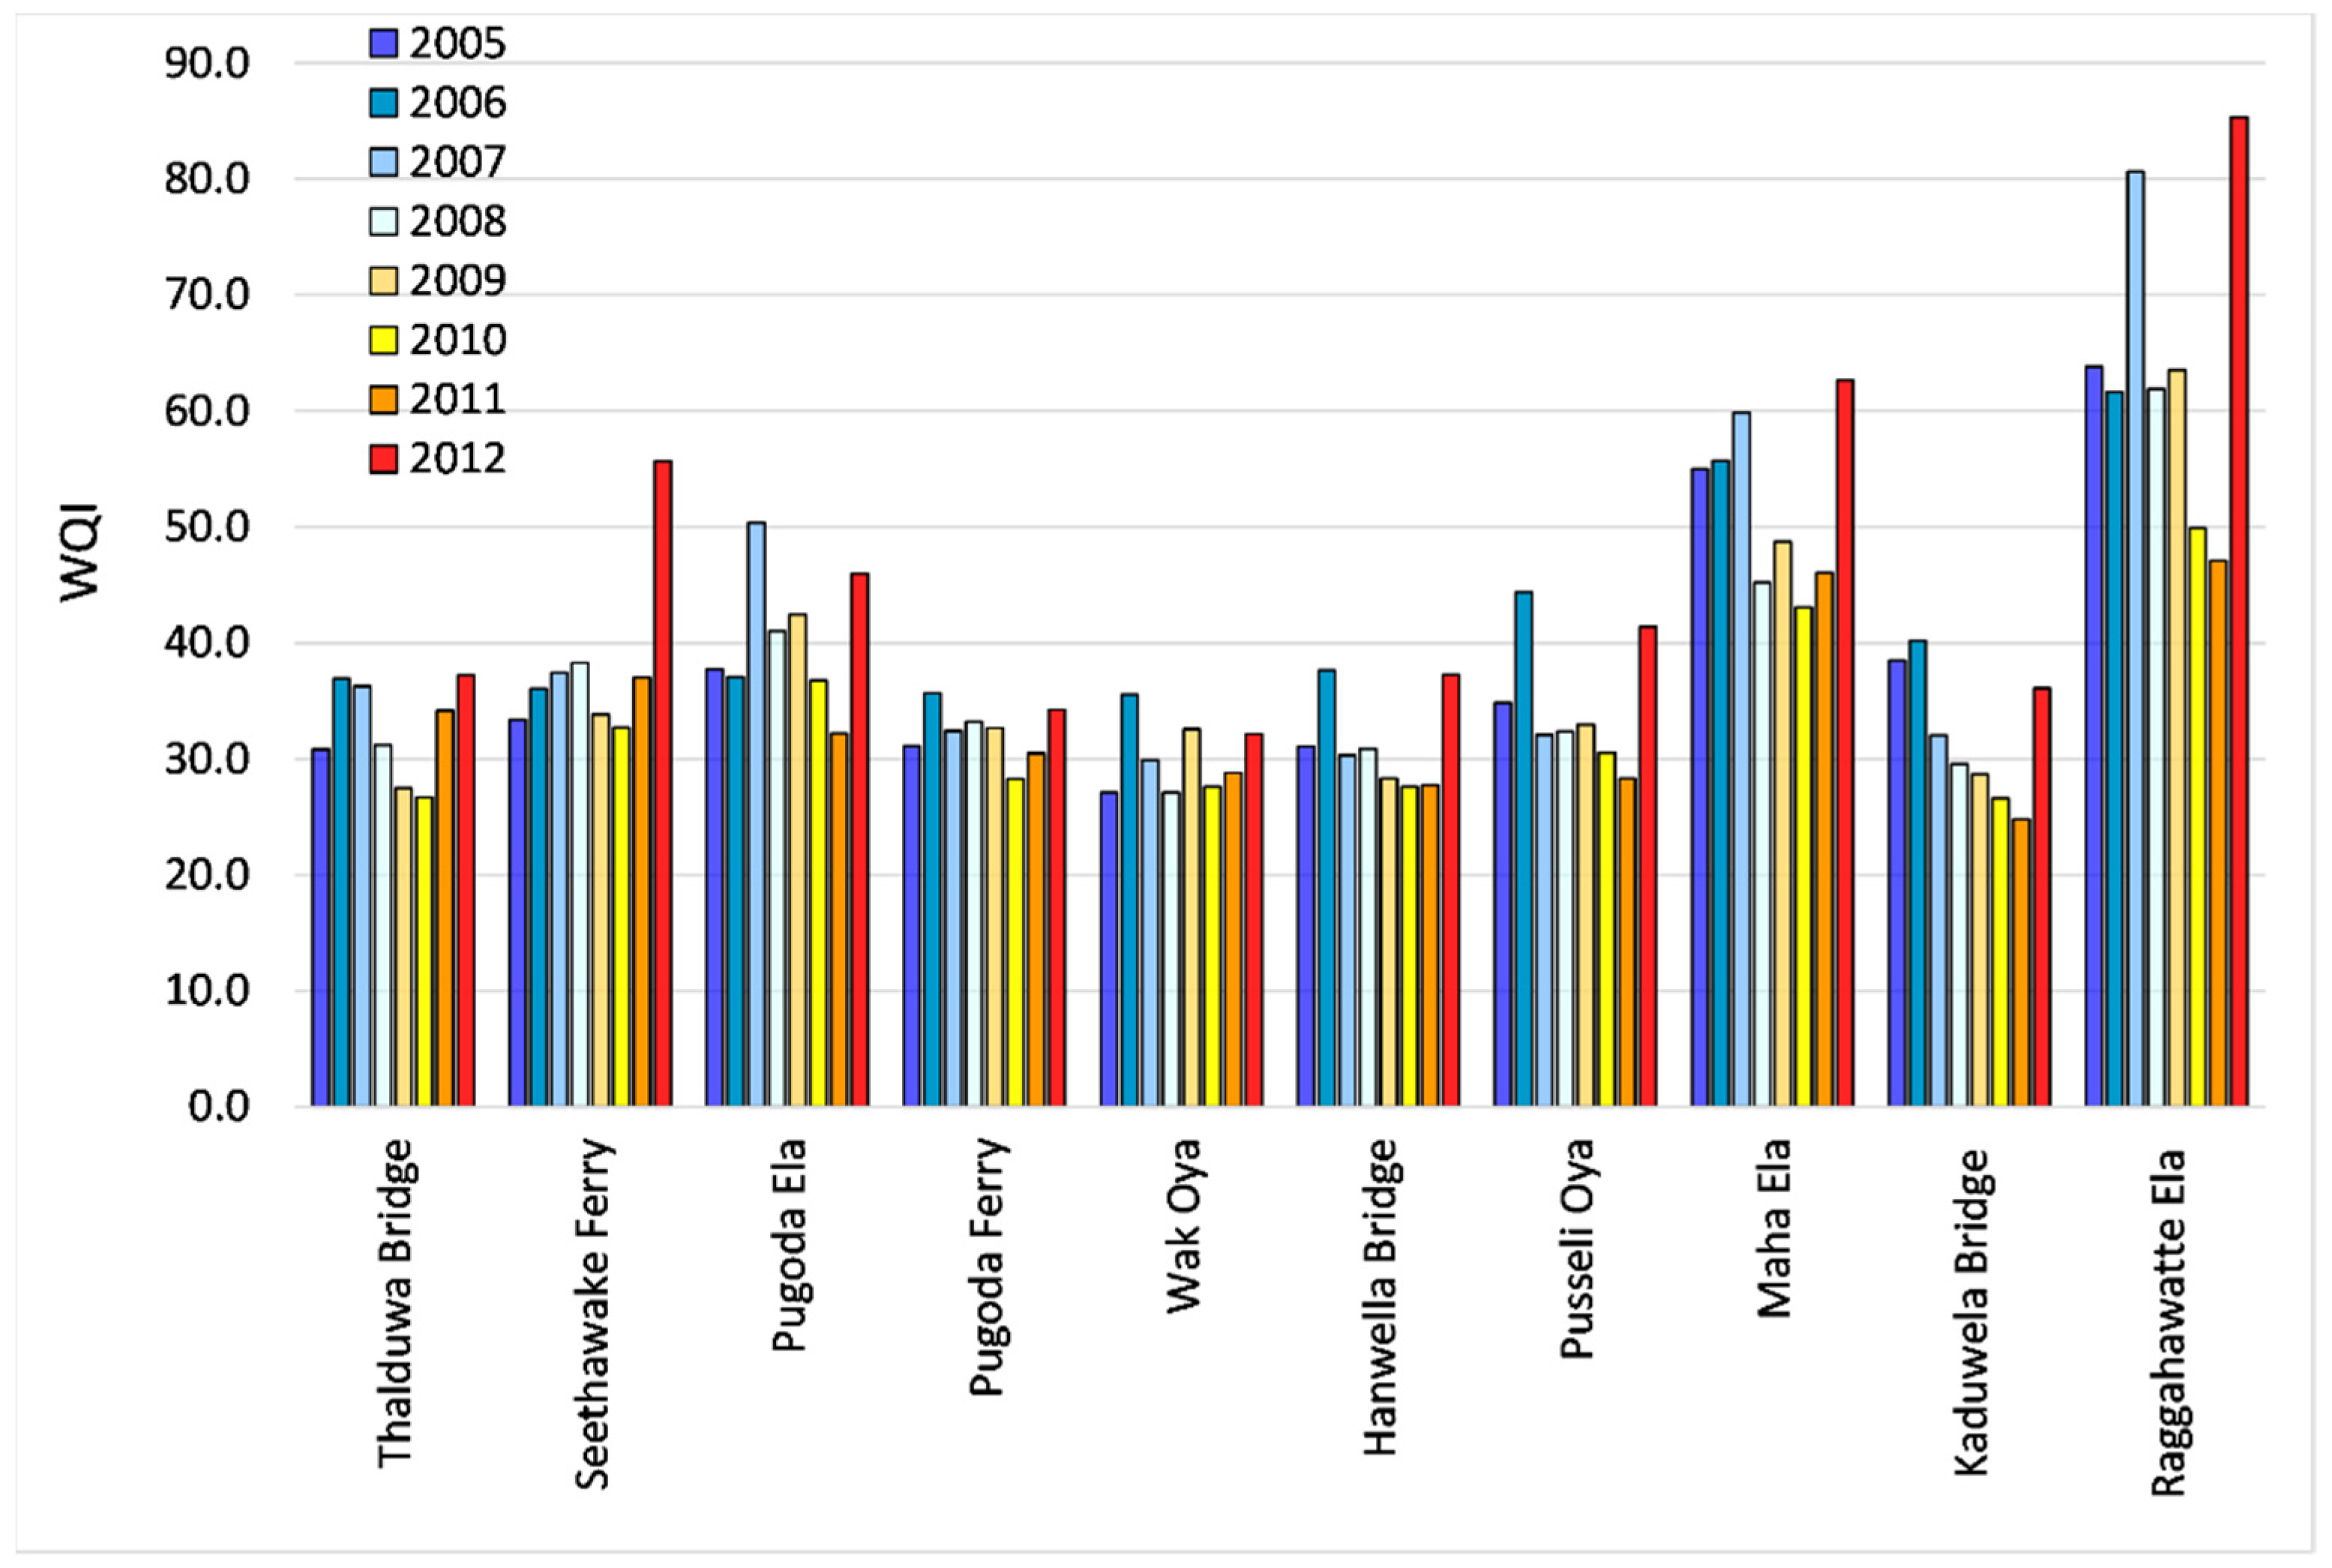
Nine water quality parameters were analyzed for the development of the WQI. Highly fluctuating locations were selected from the spatiotemporal plots of each water quality constituent. Dissolved oxygen concentration is an important water quality parameter for the equilibrium of the aquatic ecosystem as it is a standard indicator for assessing water resource quality. DO levels in natural water paths can be varied mainly due to wastewater discharges. It was found that DO was negatively correlated to the temperature and ammonium concentrations ( N H 4 + ) [33]. Kumari et al. [34] reported that an increase in temperature decreases the dissolution of ambient DO in river water. In addition, higher activities of microorganisms cause low DO values in summer as they require a substantial amount of oxygen for metabolizing activities and for organic matter degradation [35].
Raggahawatte Ela, Seethawaka ferry, and Maha Ela showed a distinct pattern of variation of DO levels, whereas the other locations showcased DO levels within acceptable dissolve oxygen standards. These illustrations for 2005 and 2012 are shown in Figure 3 (Illustrations for the years 2006–2011 are given in Appendix A).
These variations showcase lower DO values along the Kelani River (less than 4 mg/L). Therefore, aquatic life may be facing a concerning situation. The lowest DO values over the years are presented in Table 2. Sampling locations in Maha Oya and Raggahawatte Ela showcase continuous lower DO values.
The spatiotemporal variations of the other water quality constituents (COD, BOD, and N O 3 ) were also analyzed; however, they are not presented in this paper (as they are not the results from this study but the visualization of the measurements). Nevertheless, the most essential features are stated here for information. (Interested readers may request these details from the corresponding author.)
Substantial variation in COD can be found at the Pugoda Ela, Victoria Bridge, Raggahawatte Ela, and Seethawaka ferry sampling stations. In addition, Maha Ela and Raggahawatte Ela had the most significant BOD fluctuations over the years. Furthermore, Raggahawatte Ela showcased the highest variations of nitrates. These observations can interpret a draft view of the water quality in the Raggahawatte Ela area.

3.2. WQI Analysis

The weighted arithmetic method was employed to obtain the WQI along the Kelani River. Figure 4 showcases the spatiotemporal variation of the calculated WQI.
The WQI analysis showcases that it has higher values for the Raggahawatte Ela sampling location in all years. In addition, Maha Ela illustrates higher WQI values. The minimum and the maximum WQI for the years from 2005 to 2012 are given in Table 3. The highest WQI values in Raggahawatte Ela imply that the area had the poorest water quality. However, Wak Oya had comparatively good water quality from 2005 to 2008 and 2012, while Thalduwa and Kaduwela had the best water quality in the remaining years.
Raggahawatte Ela, the closest site to the Biyagama industrial zone, surpassed the COD, BOD, and DO values, resulting in the poorest water quality compared to other test locations, indicating a clear picture of the influence of industrial effluents on surface water quality.
Similarly, as illustrated in Figure 5, the water quality state at the Seethawaka ferry site has deteriorated significantly over the previous three years from 2010 to 2012, primarily as a result of receiving industrial wastewater from the Seethawaka industrial zone. Therefore, industrialization directly influences the water quality in the Kelani River.

3.3. Development of Simplified Equation for WQI

After analyzing the water quality index, a regression model was developed using the R Project for Statistical Computing. The water quality model was developed using data from 2005 to 2010, and the remaining data from 2011 to 2012 were utilized to validate the results. Table 4 presents the coefficients obtained for each parameter using the forward selection method. The interception point was found at −20.666.
Therefore, the following equation was proposed as a regression model for the water quality index.
W Q I = 20.666 + 0.8439 ( C O D ) + 3.376 ( B O D ) + 6.619 ( p H ) + 21.10 ( P O 4 2 ) + 0.135 ( T ) + 0.00135 ( C l ) 1.758 ( D O ) + 0.000938 ( E C ) + 0.03376 ( N O 3 )
It can be clearly seen that phosphate dominates the WQI for the Kelani River. Therefore, a deeper understanding of phosphate concentrations and their origin in the Kelani River should be required. However, a relatively insignificant contribution can be identified from chloride, electrical conductivity, and nitrate concentrations.
The validation of the simple equation for the WQI can be seen in Figure 6. The simple equation has a perfect match to the calculated WQI. Therefore, this can simply calculate the WQI for other years without bringing complex and lengthier calculations.
The obtained equation is limited to the selected Kelani basin. However, the results do not rule out employing the form of the equation for different basins. Regression coefficients can be derived based on their water quality parameters. Therefore, we encourage future studies to develop such relationships for other basins that can be critically assessed in a global context.

4. Conclusions

This study proposed a multiple linear regression model to predict the WQI for the Kelani River in Sri Lanka. The equation was validated using available water quality parameters of the Kelani River at distinct locations. The equation fits perfectly with the validation set with R2 = 1. Furthermore, the equation signifies the critical water quality parameters and their contributions. On the other hand, the equation suggests the required water treatment strategies based on the contribution of each parameter. Thus, the required attention can be provided to protect the water quality of the river as it is the primary source of water supply to Colombo, the commercial capital of Sri Lanka.
The concentrations of DO, phosphate, COD, BOD, and nitrate were often above the standards at Raggahawatte Ela and Seethwaka ferry. The computed WQIs for the exact location validated these observations. Raggahawatte Ela was continuously reported to have the lowest water quality during the study period, while the Seethawaka ferry fell dramatically throughout the three years from 2010 to 2012. Due to the proximity of both places to an industrial zone, the surface water quality has degraded due to industrial effluent discharges. Thus, this study can be used to establish a water quality monitoring strategy, public awareness campaigns, and some policy decisions addressing the quality of water near industrial zones, such as imposing new legislation on industries that discharge effluents into natural streams.

Author Contributions

Conceptualization, R.M. and U.R.; methodology, R.M.; software, R.M.; formal analysis, R.M.; writing—original draft preparation, R.M.; writing—review and editing, R.M., D.P.P.M., H.M.A., M.P. and U.R.; supervision, U.R.; project administration, U.R.; funding acquisition, H.M.A., M.P. and U.R. All authors have read and agreed to the published version of the manuscript.

Funding

This research received no external funding.

Data Availability Statement

The water quality data can be freely downloaded as per the explanations given in the manuscript. In addition, all calculations can be requested from the corresponding author for research purposes.

Acknowledgments

The authors would like to acknowledge the support received from the Sri Lanka Institute of Information Technology, Sri Lanka to carry out this research work.

Conflicts of Interest

The authors declare no conflict of interest.

Appendix A

Table A1. Surface water pollution standards based on Sri Lankan water quality standards (SLS 614), WHO Standards, and BIS Standards.
ParameterSLS 614/WHO/BIS Standard
pH6.5–8.5
Electrical conductivity300
Chloride250
DO5
COD10
BOD5
Phosphate2
Nitrate50
Temperature25
All parameters are in milligrams per liter except pH, EC (µS/ cm), and Temperature (°C).
Figure A1. DO variation along the Kelani River basin: (a) For 2006; (b) For 2007; (c) For 2008, (d) For 2009; (e) For 2010; (f) For 2011.
Fluids 07 00147 g0a1

References

  1. Ni, X.; Wu, Y.; Wu, J.; Lu, J.; Wilson, P.C. Scenario analysis for sustainable development of Chongming Island: Water resources sustainability. Sci. Total Environ. 2012, 439, 129–135. [Google Scholar] [CrossRef] [PubMed]
  2. Shu, J.; Ying, H. The economic analysis of sustainable utilization of agricultural water resources in Shandong province. Energy Procedia 2011, 5, 2120–2124. [Google Scholar] [CrossRef] [Green Version]
  3. Abu-Zeid, M.A. Water and sustainable development: The vision for world water, life and the environment. Water Policy 1998, 1, 9–19. [Google Scholar] [CrossRef]
  4. Biswas, A.K. Water for sustainable development in the 21st century. Int. J. Water Resour. Dev. 1991, 7, 219–224. [Google Scholar] [CrossRef]
  5. Gartsiyanova, K.; Varbanov, M.; Kitev, A.; Genchev, S. Water quality analysis of the rivers Topolnitsa and Luda Yana, Bulgaria using different indices. In Journal of Physics: Conference Series; IOP Publishing: Bristol, UK, 2021; Volume 1960, p. 012018. [Google Scholar] [CrossRef]
  6. Nizar, F.R.; Ghazi, R.M.; Awang, N.R.; Muhammad, M. Assessment of Kelantan River water quality using water quality index (WQI). In IOP Conference Series: Earth and Environmental Science; IOP Publishing: Bristol, UK, 2021; Volume 842, p. 012005. [Google Scholar] [CrossRef]
  7. Mokarram, M.; Pourghasemi, H.R.; Huang, K.; Zhang, H. Investigation of water quality and its spatial distribution in the Kor River basin, Fars province, Iran. Environ. Res. 2022, 204, 112294. [Google Scholar] [CrossRef]
  8. Satter, M.; Islam, M. Quality assessment of river water around Dhaka city. Bangladesh J. Environ. Sci. 2005, 10, 326–329. [Google Scholar]
  9. John, V.; Jain, P.; Rahate, M.; Labhasetwar, P. Assessment of deterioration in water quality from source to household storage in semi-urban settings of developing countries. Environ. Monit. Assess. 2014, 186, 725–734. [Google Scholar] [CrossRef]
  10. WHO/UNICEF Joint Monitoring Programme for Water Supply and Sanitation; World Health Organization; Water, Sanitation and Health Team. Meeting the MDG Drinking Water and Sanitation Target: A Mid-Term Assessment of Progress; World Health Organization: Geneva, Switzerland, 2004. [Google Scholar]
  11. Astel, A.; Biziuk, M.; Przyjazny, A.; Namieśnik, J. Chemometrics in monitoring spatial and temporal variations in drinking water quality. Water Res. 2006, 40, 1706–1716. [Google Scholar] [CrossRef]
  12. Xu, S.; Li, S.; Yue, F.; Udeshani, C.; Chandrajith, R. Natural and Anthropogenic Controls of Groundwater Quality in Sri Lanka: Implications for Chronic Kidney Disease of Unknown Etiology (CKDu). Water 2021, 13, 2724. [Google Scholar] [CrossRef]
  13. Akhtar, N.; Ishak, M.S.; Bhawani, S.; Umar, K. Various Natural and Anthropogenic Factors Responsible for Water Quality Degradation: A Review. Water 2021, 13, 2660. [Google Scholar] [CrossRef]
  14. Khatri, N.; Tyagi, S. Influences of natural and anthropogenic factors on surface and groundwater quality in rural and urban areas. Front. Life Sci. 2014, 8, 23–39. [Google Scholar] [CrossRef]
  15. Liyanage, C.; Yamada, K. Impact of Population Growth on the Water Quality of Natural Water Bodies. Sustainability 2017, 9, 1405. [Google Scholar] [CrossRef] [Green Version]
  16. Amarathunga, A.; Kazama, F. Impact of Land Use on Surface Water Quality: A Case Study in the Gin River Basin, Sri Lanka. Asian J. Water Environ. Pollut. 2016, 13, 1–13. [Google Scholar] [CrossRef]
  17. Bandara, N. Water and wastewater related issues in Sri Lanka. Water Sci. Technol. 2003, 47, 305–312. [Google Scholar] [CrossRef]
  18. Zubair, L. Challenges for environmental impact assessment in Sri Lanka. Environ. Impact Assess. Rev. 2001, 21, 469–478. [Google Scholar] [CrossRef]
  19. Kumar, M.; Chaminda, T.; Honda, R.; Furumai, H. Vulnerability of urban waters to emerging contaminants in India and Sri Lanka: Resilience framework and strategy. APN Sci. Bull. 2019, 9, 57–66. [Google Scholar] [CrossRef] [Green Version]
  20. Uddin, M.; Nash, S.; Olbert, A. A review of water quality index models and their use for assessing surface water quality. Ecol. Indic. 2021, 122, 107218. [Google Scholar] [CrossRef]
  21. Son, C.; Giang, N.; Thao, T.; Nui, N.; Lam, N.; Cong, V. Assessment of Cau River water quality assessment using a combination of water quality and pollution indices. J. Water Supply Res. Technol. Aqua 2020, 69, 160–172. [Google Scholar] [CrossRef]
  22. Bhat, S.; Pandit, A. Surface Water Quality Assessment of Wular Lake, A Ramsar Site in Kashmir Himalaya, Using Discriminant Analysis and WQI. J. Ecosyst. 2014, 2014, 724728. [Google Scholar] [CrossRef] [Green Version]
  23. Kaurish, F.; Younos, T. Developing a Standardized Water Quality Index for Evaluating Surface Water Quality. J. Am. Water Resour. Assoc. 2007, 43, 533–545. [Google Scholar] [CrossRef]
  24. Mahagamage, M.; Chinthaka, S.; Manage, P.M. Multivariate analysis of physico-chemical and microbial parameters of surface water in Kelani River basin. Int. J. Multidiscip. Stud. 2016, 1, 55–61. [Google Scholar] [CrossRef]
  25. Abeysinghe, N.D.A.; Samarakoon, M. Analysis of variation of water quality in Kelani River, Sri Lanka. Int. J. Environ. Agric. Biotechnol. 2017, 2, 238965. [Google Scholar] [CrossRef]
  26. The Ministry of Environment and Natural Resources and the Ministry of Water Supply & Drainage. 2022. Available online: http://www.waterboard.lk/web/images/contents/key_sections/policy_and_planning/downloads/policy_on_siting_of_high_polluting_industries.pdf (accessed on 19 April 2022).
  27. Herath, H.; Weerahewa, J. An economic approach to manage industrial water pollution in river basins: Case of Kelani River Basin, Sri Lanka. In XI World Water Congress—Water Resources Management in the 21st Century; International Water Resources Association: Madrid, Spain, 2003; pp. 1–11. [Google Scholar]
  28. Amiri, B.J.; Nakane, K. Modeling the linkage between river water quality and landscape metrics in the Chugoku district of Japan. Water Resour. Manag. 2009, 23, 931–956. [Google Scholar] [CrossRef]
  29. Bora, M.; Goswami, D.C. Water quality assessment in terms of water quality index (WQI): Case study of the Kolong River, Assam, India. Appl. Water Sci. 2017, 7, 3125–3135. [Google Scholar] [CrossRef] [Green Version]
  30. Huang, J.; Zhan, J.; Yan, H.; Wu, F.; Deng, X. Evaluation of the impacts of land use on water quality: A case study in the Chaohu Lake basin. Sci. World J. 2013, 2013, 329187. [Google Scholar] [CrossRef] [Green Version]
  31. Shah, K.A.; Joshi, G.S. Evaluation of water quality index for River Sabarmati, Gujarat, India. Appl. Water Sci. 2017, 7, 1349–1358. [Google Scholar] [CrossRef] [Green Version]
  32. Brown, R.M.; McClelland, N.I.; Deininger, R.A.; O’Connor, M.F. A water quality index—Crashing the physiological barrier. Indic. Environ. Qual. 1972, 1, 173–182. [Google Scholar]
  33. Barakat, A.; El Baghdadi, M.; Rais, J.; Aghezzaf, B.; Slassi, M. Assessment of spatial and seasonal water quality variation of Oum Er Rbia River (Morocco) using multivariate statistical techniques. Int. Soil Water Conserv. Res. 2016, 4, 284–292. [Google Scholar] [CrossRef]
  34. Kumari, M.; Tripathi, S.; Pathak, V.; Tripathi, B. Chemometric characterization of river water quality. Environ. Monit. Assess. 2013, 185, 3081–3092. [Google Scholar] [CrossRef]
  35. Jo, E.-K.; Yang, C.-S.; Choi, C.H.; Harding, C.V. Intracellular signalling cascades regulating innate immune responses to Mycobacteria: Branching out from Toll-like receptors. Cell. Microbiol. 2007, 9, 1087–1098. [Google Scholar] [CrossRef]
Figure 1. Land use pattern in the Kelani River basin.
Fluids 07 00147 g001
Figure 2. Sampling locations along the Kelani River basin.
Fluids 07 00147 g002
Figure 3. DO variation along the Kelani River basin in (a) 2005 (b) 2012.
Fluids 07 00147 g003aFluids 07 00147 g003b
Figure 4. Spatiotemporal variation of calculated WQI along the Kelani River.
Fluids 07 00147 g004
Figure 5. WQI variation at Seethawaka ferry sampling point.
Fluids 07 00147 g005
Figure 6. WQI validation from 2011 to 2012.
Fluids 07 00147 g006
Table 1. Recommended range of WQI for intended usage: [32].
WQIStatus of Water Quality (WQS)Intended Usage
DrinkingIrrigationIndustrial
0–25Excellent
26–50Good
51–75PoorX
76–100Very poorXX
Above 100Not suitable for drinking or fish cultureProper treatment is required
Table 2. Minimum DO values along the Kelani River.
Month/YearLocationMinimum DO Value (mg/L)
May/2005Maha Oya1.3
May/2006Raggahawatte Ela2.6
February/2007Raggahawatte Ela2.5
December/2008Maha Oya2.3
August/2009Pugoda Ela2.1
January/2010Raggahawatte Ela1.9
June/2011Wak Oya1.0
November/2012Maha Oya2.5
Table 3. Maximum and minimum values of WQI along the Kelani River.
YearMax ValueLocationMin ValueLocation
200563.842Raggahawatte Ela27.091Wak Oya
200661.670Raggahawatte Ela35.563Wak Oya
200780.623Raggahawatte Ela29.570Wak Oya
200861.903Raggahawatte Ela27.105Wak Oya
200963.541Raggahawatte Ela27.480Thalduwa Bridge
201049.905Raggahawatte Ela26.615Kaduwela Bridge
201147.091Raggahawatte Ela24.813Kaduwela Bridge
201285.309Raggahawatte Ela32.167Wak Oya
Table 4. Coefficients for the water quality index parameters.
ParameterCoefficientParameterCoefficient
COD0.8439Phosphate21.10
BOD3.376Chloride0.00135
pH6.619Nitrate0.03376
Temperature0.135EC0.000938
DO−1.758
Publisher’s Note: MDPI stays neutral with regard to jurisdictional claims in published maps and institutional affiliations.

