Article

Comparison of Two Hydrological Models, HEC-HMS and SWAT in Runoff Estimation: Application to Huai Bang Sai Tropical Watershed, Thailand

by
Imiya M. Chathuranika
1,
Miyuru B. Gunathilake
2,3,
Pavithra K. Baddewela
4,
Erandi Sachinthanie
5,
Mukand S. Babel
6,
Sangam Shrestha
6,
Manoj K. Jha
7 and
Upaka S. Rathnayake
1,*
1
Department of Civil Engineering, Faculty of Engineering, Sri Lanka Institute of Technology, Malabe 10115, Sri Lanka
2
Hydrology and Aquatic Environment, Division of Environmental and Natural Resources, Norwegian Institute of Bioeconomy and Research, 1431 Ås, Norway
3
Water, Energy and Environmental Engineering Research Unit, Faculty of Technology, University of Oulu, 90014 Oulu, Finland
4
Department of Transport and Logistics Management, Faculty of Engineering, University of Moratuwa, Katubedda 10400, Sri Lanka
5
Department of Physics, Faculty of Science, University of Peradeniya, Peradeniya, Kandy 20400, Sri Lanka
6
Water Engineering and Management, School of Engineering and Technology, Asian Institute of Technology, Pathum Thani 12120, Thailand
7
Department of Civil, Architectural and Environmental Engineering, North Carolina Agricultural and Technical State University, Greensboro, NC 27411, USA
*
Author to whom correspondence should be addressed.
Fluids 2022, 7(8), 267; https://doi.org/10.3390/fluids7080267
Submission received: 25 May 2022 / Revised: 29 July 2022 / Accepted: 30 July 2022 / Published: 4 August 2022

Abstract

:
In the present study, the streamflow simulation capacities between the Soil and Water Assessment Tool (SWAT) and the Hydrologic Engineering Centre-Hydrologic Modelling System (HEC-HMS) were compared for the Huai Bang Sai (HBS) watershed in northeastern Thailand. During calibration (2007–2010) and validation (2011–2014), the SWAT model demonstrated a Coefficient of Determination (R2) and a Nash Sutcliffe Efficiency (NSE) of 0.83 and 0.82, and 0.78 and 0.77, respectively. During the same periods, the HEC-HMS model demonstrated values of 0.80 and 0.79, and 0.84 and 0.82. The exceedance probabilities at 10%, 40%, and 90% were 144.5, 14.5, and 0.9 mm in the flow duration curves (FDCs) obtained for observed flow. From the HEC-HMS and SWAT models, these indices yielded 109.0, 15.0, and 0.02 mm, and 123.5, 16.95, and 0.02 mm. These results inferred those high flows were captured well by the SWAT model, while medium flows were captured well by the HEC-HMS model. It is noteworthy that the low flows were accurately simulated by both models. Furthermore, dry and wet seasonal flows were simulated reasonably well by the SWAT model with slight under-predictions of 2.12% and 13.52% compared to the observed values. The HEC-HMS model under-predicted the dry and wet seasonal flows by 10.76% and 18.54% compared to observed flows. The results of the present study will provide valuable recommendations for the stakeholders of the HBS watershed to improve water usage policies. In addition, the present study will be helpful to select the most appropriate hydrologic model for humid tropical watersheds in Thailand and elsewhere in the world.

Graphical Abstract

1. Introduction

Water resource management and operational hydrology require reliable predictions of water balance components including runoff, evapotranspiration, infiltration, and groundwater flow. Hydrologic models are used for the planning of water resources [1,2,3], for flood predictions [4,5,6], to understand the hydrology due to changes in land use and climate [7,8], for water quality monitoring [9], to formulate aquifer recharge management strategies [10], to design hydraulic infrastructure [11], for ecological restoration design [12], etc. The evolvement of computer technology and programming has benefited researchers, academia, and commercial-based companies to develop different software to simulate watershed processes. The Soil and Water Assessment Tool (SWAT) [13], the Hydrologic Engineering Center-Hydrologic Modeling System (HEC-HMS) [14], the Hydrologiska Byråns Vattenbalansavdelning (HBV light) model [15], the J2000 model [16], the GR4J model [17], the Hydrologic Simulation Program FORTRAN (HSPF) model [18], and the MIKE-SHE model [19] are some of the widely used hydrologic models used in different regions of the world today [20].
In this study, the widely used SWAT and the HEC-HMS hydrologic models were used to compare the streamflow simulation capacities in the Huai Bang Sai (HBS) watershed, which flows into the greater Mekong River. These two hydrologic models have been frequently used in tropical regions by many researchers [21,22]. The HEC-HMS model is a lump-based model, while the SWAT model is a semi-distributed model. Lump-based models consider the total basin as a “single homogeneous element”. On the other hand, the semi-distributed models discretize the drainage basin into homogeneous units of landform, soil, and topography of the watershed [23]. Hence, in the present study, the hypothesis tested was whether the spatial discretization of the watershed through different hydrologic models had an impact on the response to the streamflow simulation.
It is noteworthy that hydrologic models that were developed in environments were later applied in watersheds that had different climatic and watershed characteristics than they were originally developed for. For instance, Gunathilake et al. [24] and Chathuranika et al. [25] used the HEC-HMS model to simulate streamflow in the Seethawaka and Nilwala watersheds in Sri Lanka. However, the HEC-HMS was developed for the temperate climatic conditions of the USA. This model is widely used and was developed by the United States Army Corps of Engineers (USACE). In another study, the SWAT model developed by the Agricultural Research Services of the United States Department of Agriculture, (originally developed for the temperate climatic conditions in the USA) was applied in the sub-humid tropical Indian region by Shekar and Vinay [26]. Phomcha et al. [27] applied the SWAT model to the Lam Sonthi tropical watershed in Thailand and found that the model was able to simulate sediments accurately. Phomcha et al. [27] stated that although the SWAT model can be simulated with a small amount of input data, some of its model algorithms are inefficient for tropical watersheds. Supakosol and Boonrawd [28] and Rossi et al. [29] used the SWAT model to simulate streamflow in the Nong Han lake basin and Mae Nam Chi in Yasothon in northeastern Thailand. Furthermore, the HEC-HMS model was used by Kuntiyawichai et al. [30] to simulate flow into the Ubol Ratana reservoir in northeastern Thailand. These results showcased that both these models are capable of simulating streamflow in watersheds of northeastern Thailand.
Shekar and Vinay [26] conducted a comparison study for HEC-HMS and SWAT for a river basin in India and demonstrated that the SWAT model outperformed the HEC-HMS model. On the contrary, Aliye et al. [31] showcased that the HEC-HMS model performed better than the SWAT model for the Ethiopian Rift valley lake basin. A similar comparison study was carried out in the Srepok river basin in Vietnam by Khoi [32]. The results of this study inferred that the SWAT model outperformed the HEC-HMS. However, Ismail et al. [33] reported that the HEC-HMS model outperformed the SWAT model in the tropical Bernam river basin in Malaysia. The above studies indicate that the hydrological performance of models should be determined for the individual watershed for its suitability.
As it was stated in the preceding paragraphs, streamflow computation is highly important to major streams and rivers in a watershed. Even though the field measurements are highly accurate, the logistic difficulties might devalue the field measurements. Hourly instrument usage is not an easy task for a major catchment. Therefore, computational modeling is convenient in this situation. However, the streamflow calculations from different computational models can have some mismatches to the ground-measured streamflows. Therefore, identification of the best suited hydrologic model for a particular watershed is important in the context of streamflows.
This study presents the comparative analysis of SWAT and HEC-HMS hydrologic models in the HBS of northeastern Thailand. The overall idea of the comparative analysis is to investigate the capabilities of streamflow calculations by the two widely used computational models. Both models were calibrated between 2007 and 2010 (for 4 years) and validated from 2011 to 2014 (for 4 years) at the same discharge station. The hydrologic model statistical performances for both models were examined using the Coefficient of Determination (R2) and the Nash Sutcliffe Efficiency (NSE). Error in Peak flow, Percentage Error in Volume (PEV) were calculated to compare the performances of both models. These parameters were investigated to determine the streamflow computational capabilities. In the present study, the hypothesis tested was whether the spatial discretization of the watershed through different hydrologic models had an impact on the response to the streamflow simulation. The results of the present study will essentially provide valuable recommendations and insights to select the most appropriate hydrologic model simulating rainfall–runoff processes of the tropical humid northeastern part of Thailand. The research findings would also be useful for the policymakers to take necessary actions to achieve sustainable water resource management.

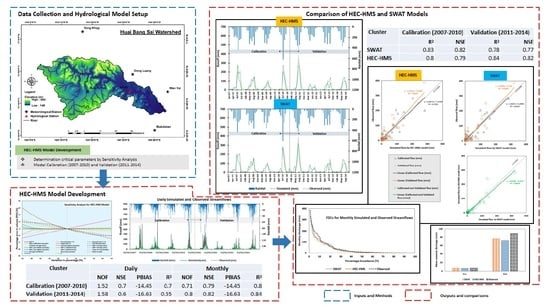
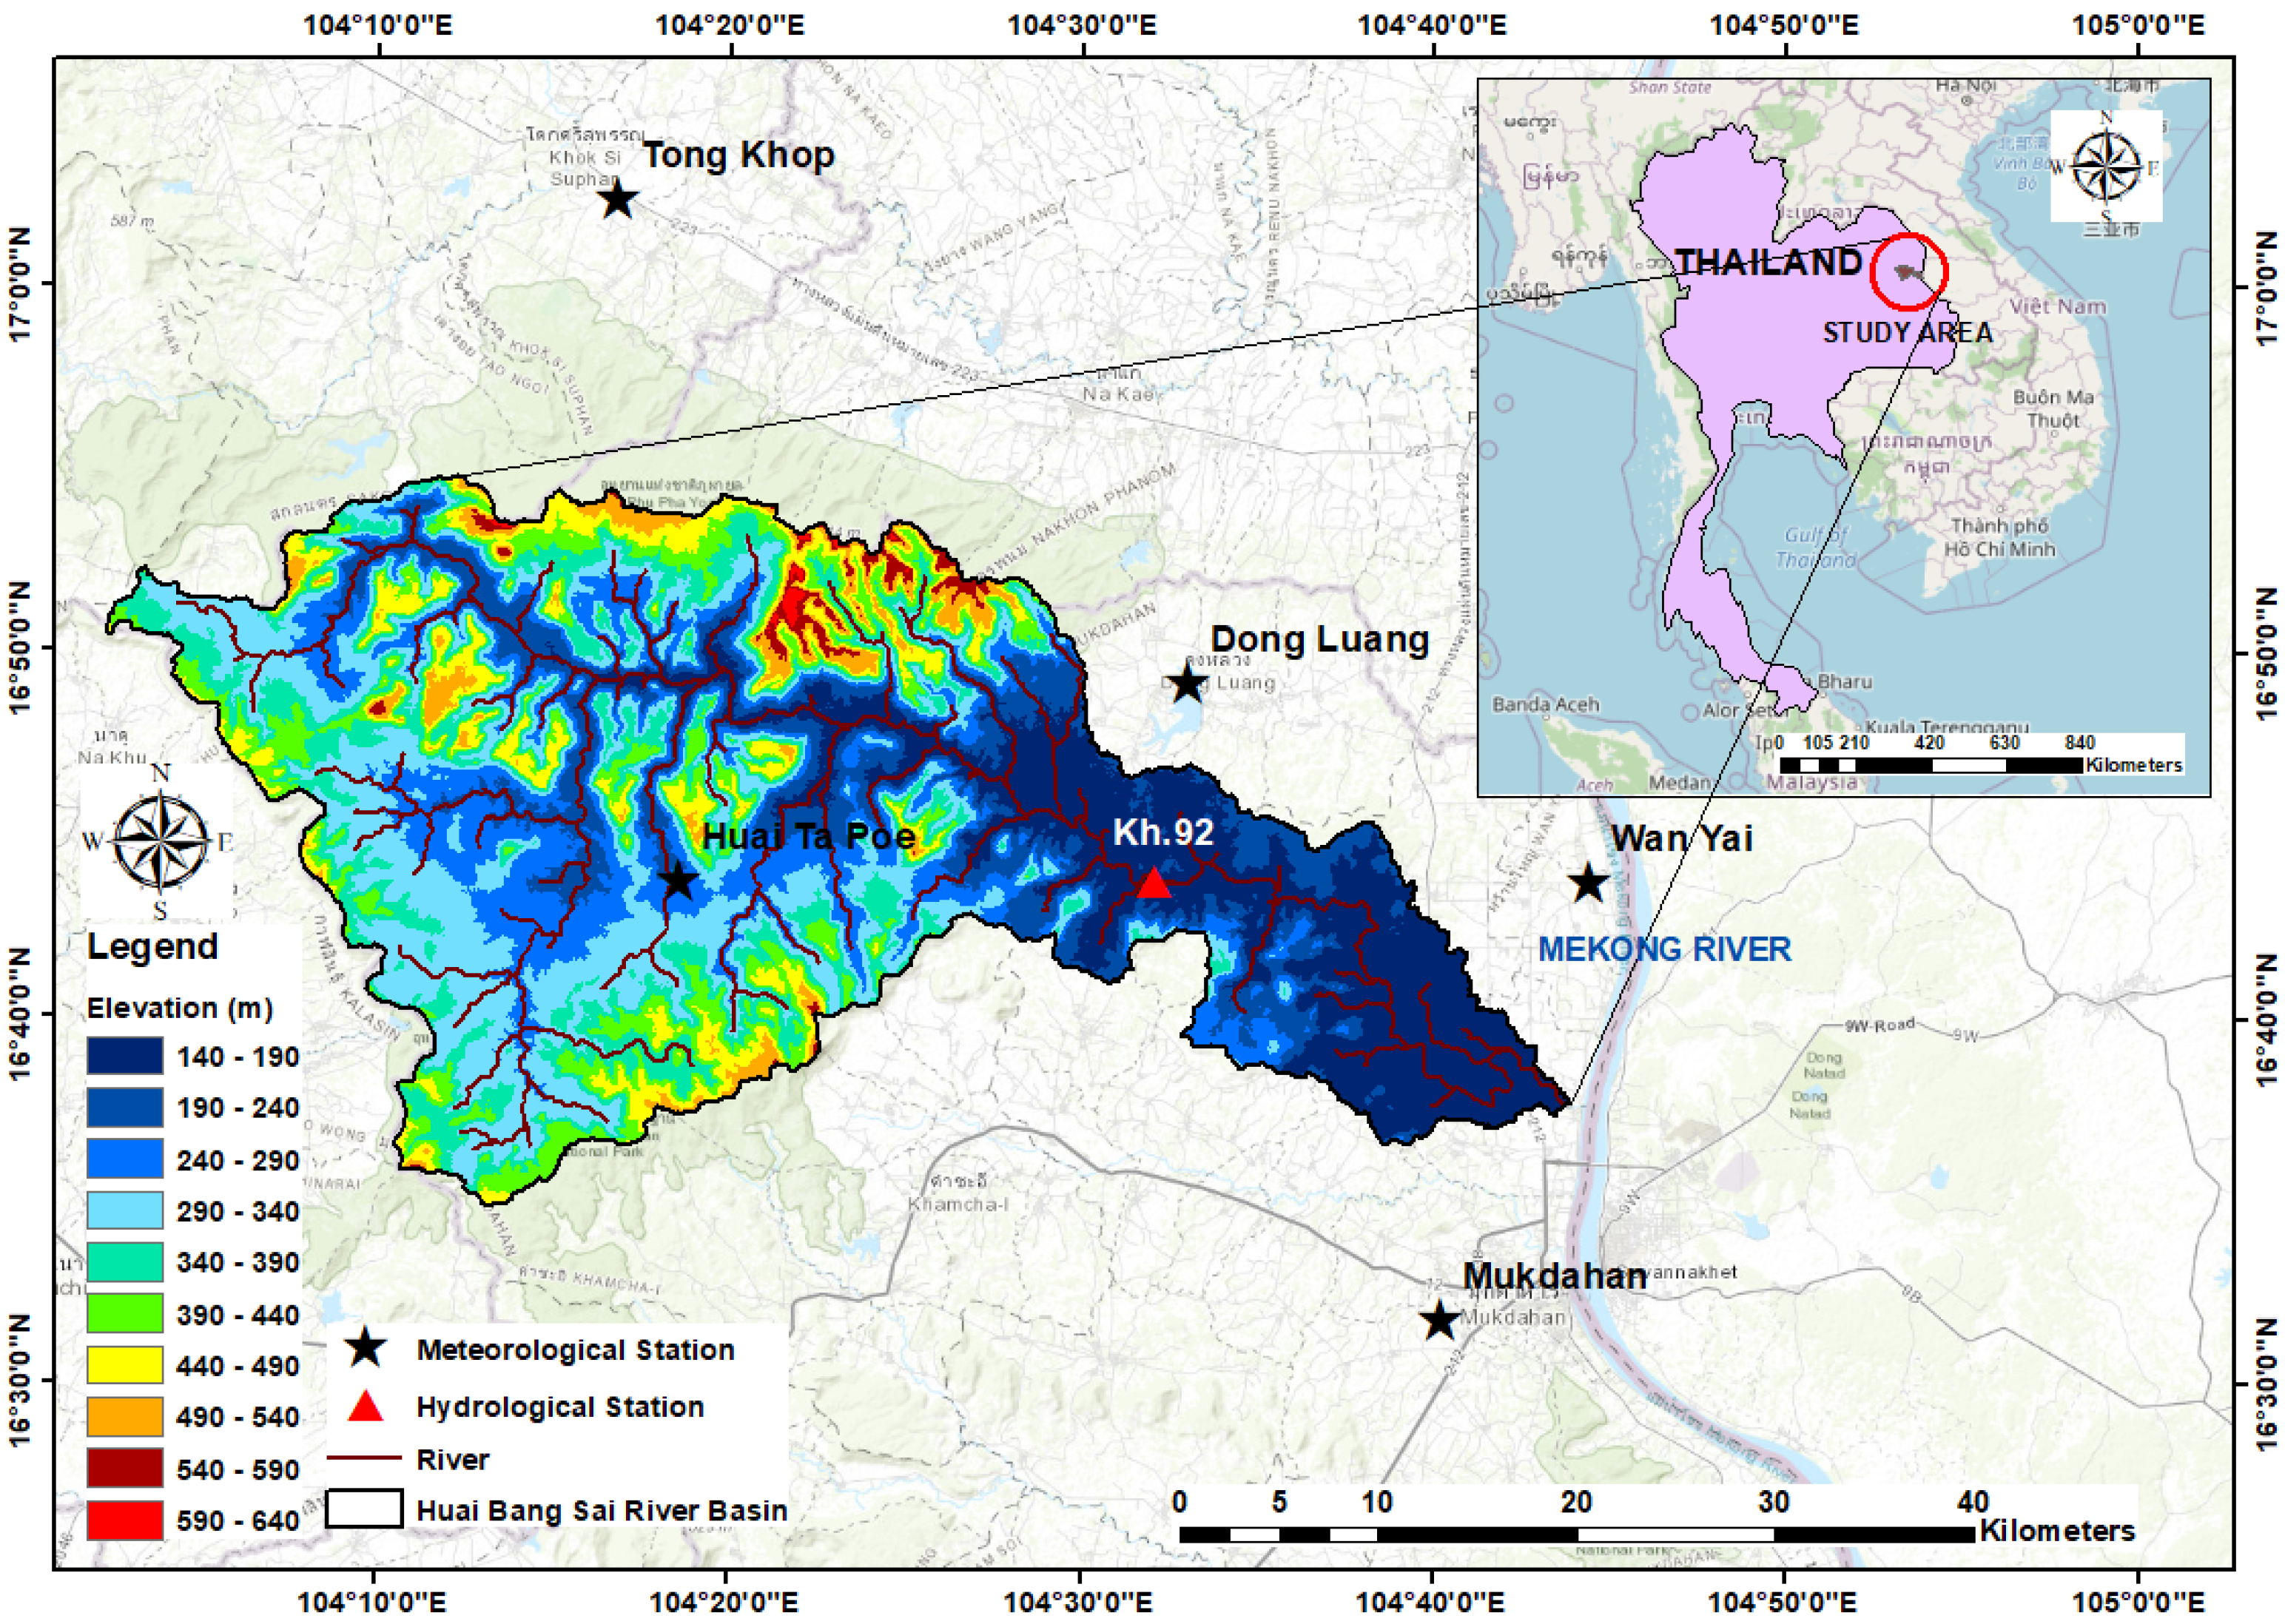
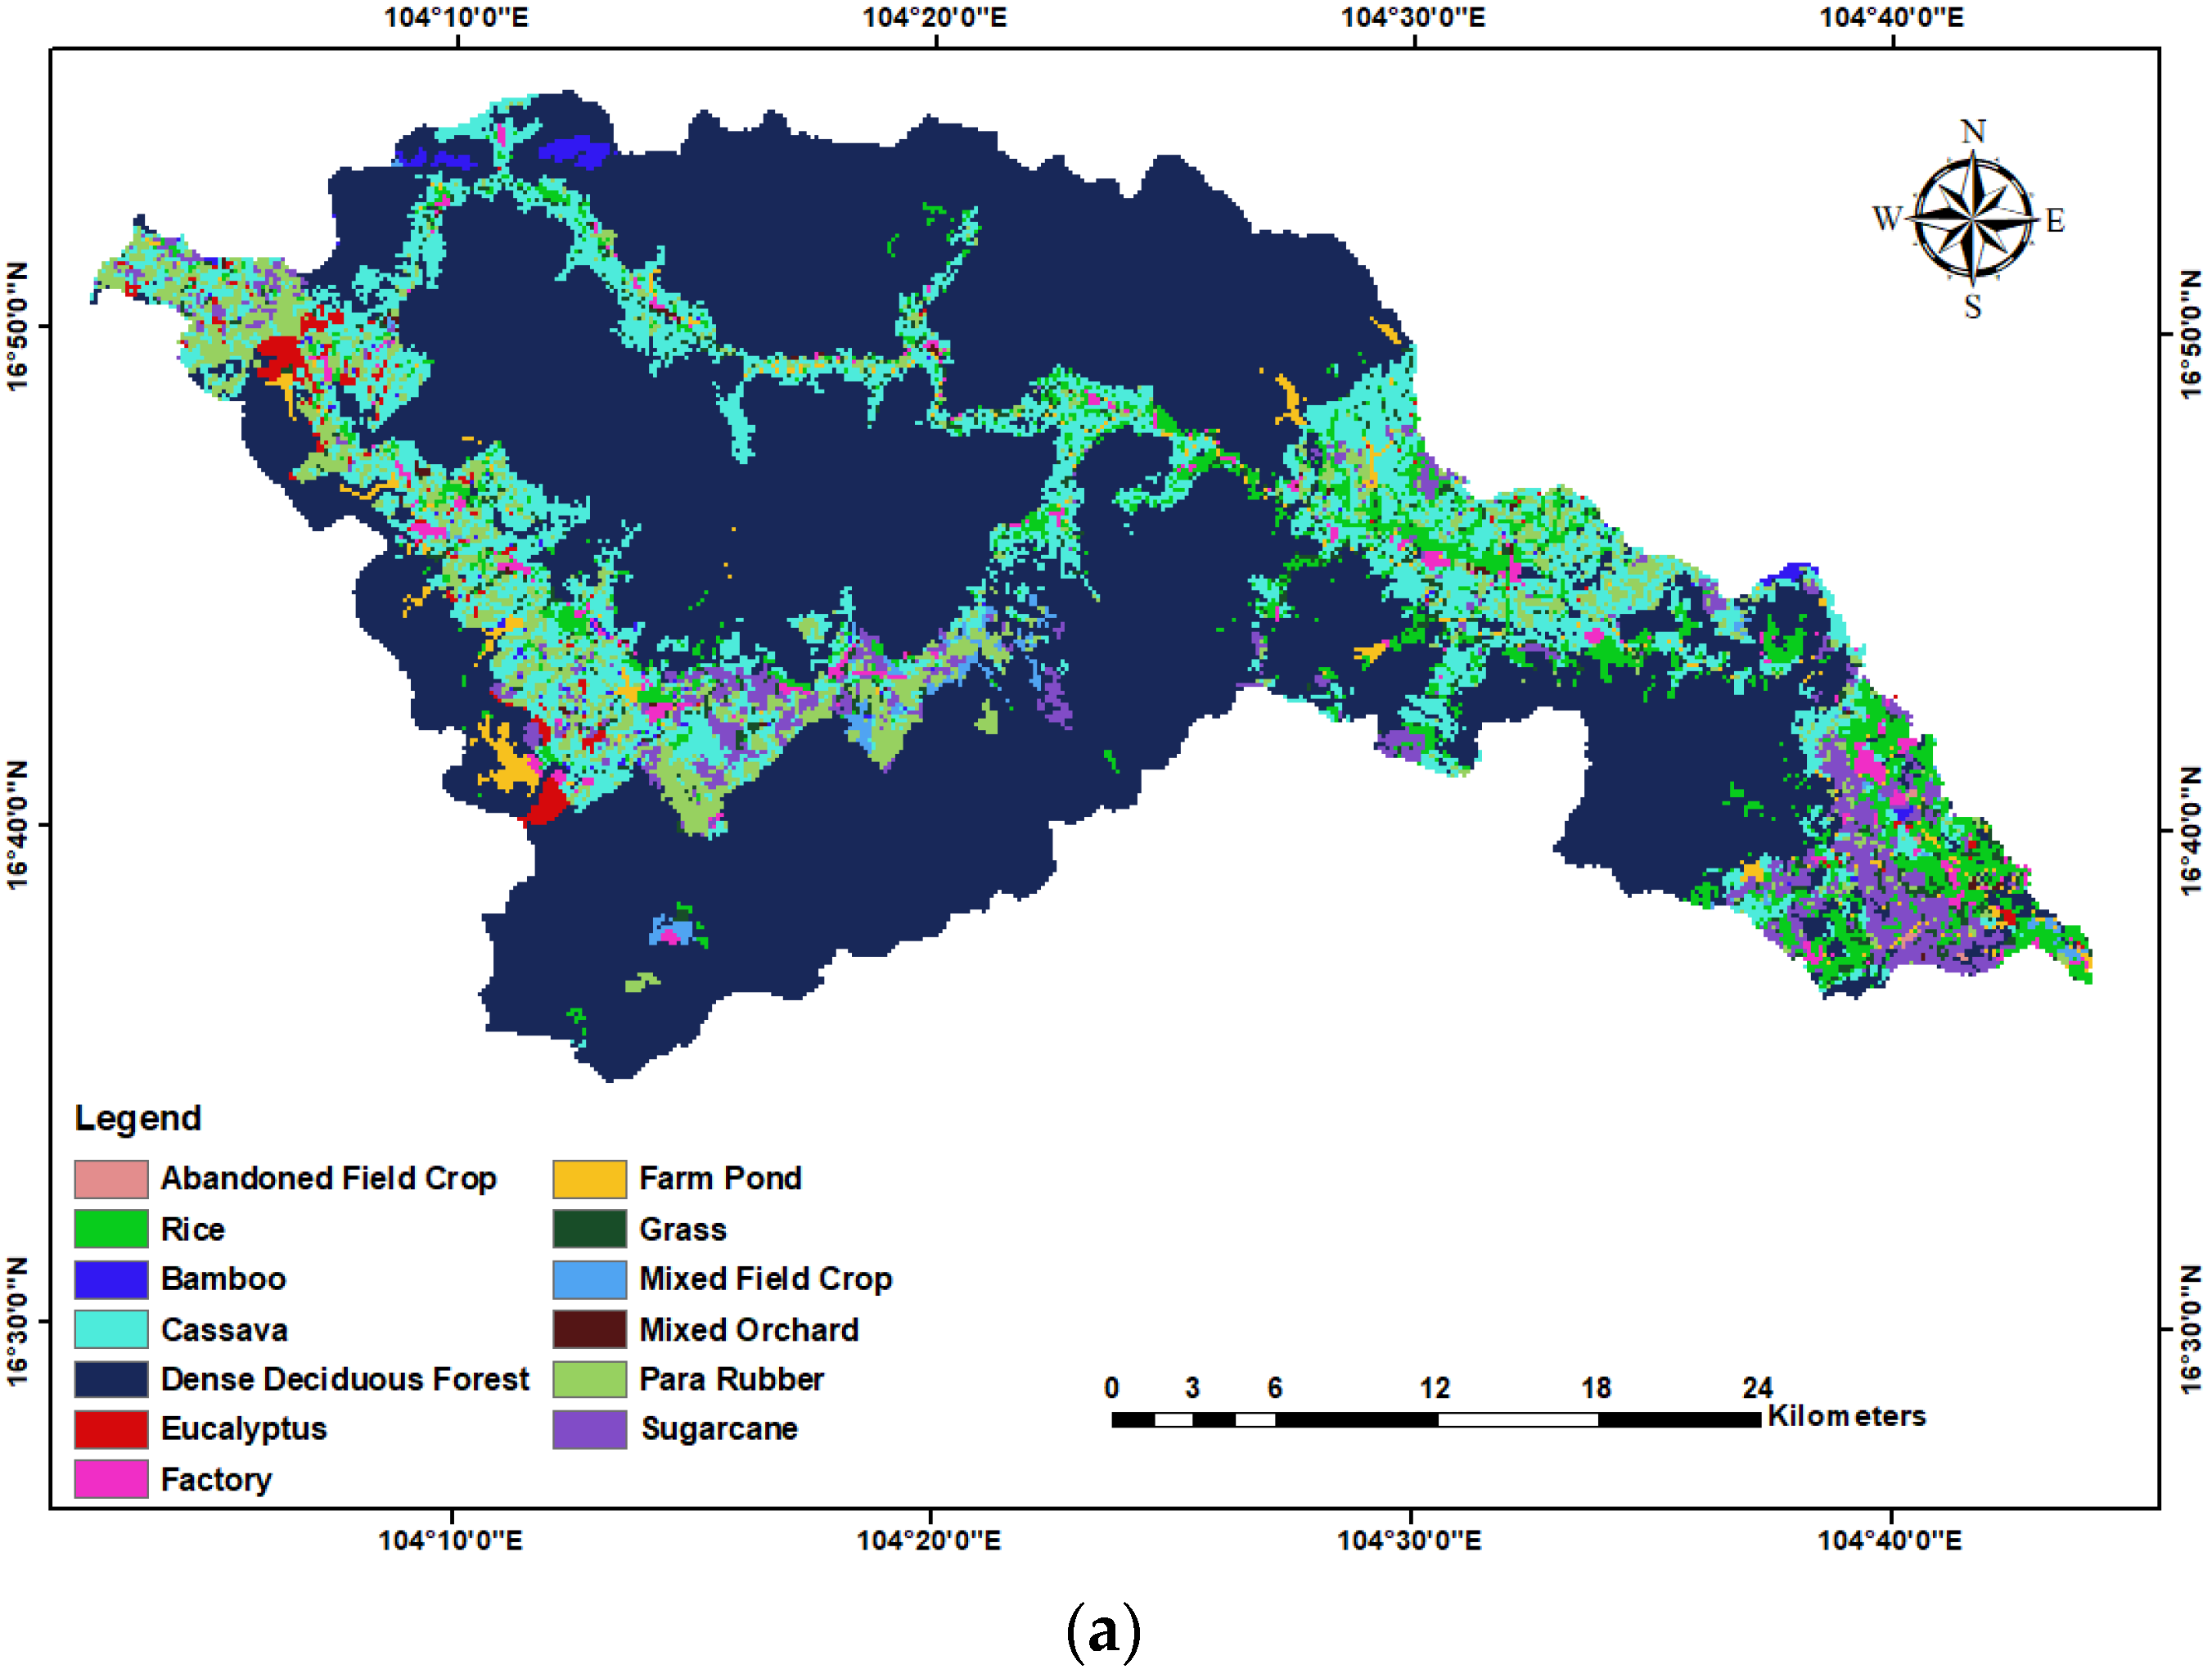
2. The Study Area and Data Required

The HBS watershed is a sub-catchment of the greater Mekong River watershed, which is in northeastern Thailand. This region is situated at the Thailand-Lao PDR border (neighboring the Mekong River) on the eastern side. The HBS drains an area of 1340 km2 before joining the Mekong River near Mukdahan town (refer to Figure 1). The HBS watershed lies between 16°35′ N–16°55′ N and 104°02′ E–104°44′ E. The altitude of the HBS watershed varies between 140 and 640 m above mean sea level (AMSL). This area receives a mean annual precipitation of 1200 mm with the majority of this received during the southwest monsoon season from May to September. Dense deciduous forests are the primary land use type of the area, and it covers nearly 68% of the catchment. Other main land use types in the area are cassava, sugarcane, and rubber plantations (refer to Figure 2a). Forest cover deterioration due to the cultivation of cash crops and the reduction in soil and water quality are identified as the key environmental problems during the last 30 years in the region. This phenomenon has happened due to poor soil and water conservation practices [34]. Hang Chat is the primary soil type in the catchment. It has a loamy sand texture and belongs to the hydrologic soil group C (loamy sand nature) of the “United States Department of Agriculture” (USDA)’s soil classification. Figure 2b represents the soil distribution map of the HBS watershed.
Figure 1 shows the locations of the rain gauges and the flow gauge in the study area. Daily rainfall data were obtained from the “Royal Irrigation Department” (RID), Thailand for Dong Luang, Wan Yai, Tong Khop, Mukdahan, and Huai Ta Poe stations for 8 years (from 2007 to 2014). Daily temperature records were obtained for a similar period from “Thai Meteorological Department” (TMD) from the nearby meteorological stations. Similarly, daily streamflow data for station kh.92 (Ban Kan Luang Dong) were also collected from RID. The land use types for the year 2015 were obtained from the Land Development Department (LDD) of Thailand with a 500 m resolution, and in a 1:50,000 scale. Soil data for 2015 were also acquired from the LDD of Thailand with a 1 km resolution, and in a 1:100,000 scale. “Digital Elevation Model” (DEM) of 30 m resolution was downloaded from the “United States Geological Survey” (USGS) website; https://earthexplorer.usgs.gov/ (accessed on 31 June 2022).

3. Rainfall–Runoff Modelling of the HBS Watershed

This study compared the performance of HEC-HMS and SWAT hydrological models to simulate streamflow at the kh.92 hydrological station from 2007 to 2014. For the present study, a HEC-HMS model was developed, and the model was compared with the SWAT model, which was developed previously by Babel et al. [21].
Both the HEC-HMS and SWAT models are capable of continuous simulations [35]. These models simplify water resource systems for ease of understanding of the model behavior. Understanding the components of the hydrological cycle including surface runoff, infiltration, evaporation, transpiration, and precipitation is of prime importance in hydrologic modeling studies.
In the case of the HEC-HMS model, the HEC-GeoHMS and Archydro tools were used to delineate and calculate the physical and drainage characteristics of the watershed. They were used in the HEC-HMS model as inputs for the initial simulation. The whole watershed was delineated into 12 sub-watersheds considering nearly equal surface areas for each sub-watershed. HEC-HMS model development process includes four main components namely, basin model, input data (time series, paired and gridded data), meteorological model, and control specifications [36,37]. The basin model connects sub-watersheds, reaches, junctions, diversions, reservoirs, etc., to create a drainage system [38]. The time interval for a simulation is controlled by control specifications [39]. In this study, climate data were added to the meteorological model to distribute them spatially and temporally over the watershed through the Thiessen polygon method. Time series data of precipitation, temperature, and streamflow data in a daily step were included in the model. The HEC-HMS model was calibrated from 1 January 2007 to 31 December 2010 and validated between 1 January 2011 and 31 December 2014. A sensitivity analysis was conducted by considering the changes in the percentage error in runoff volume (PEV). The normalized objective function (NOF), the Nash Sutcliffe Efficiency (NSE), the percentage of bias (PBIAS), and the Coefficient of Determination (R2) were used to determine the statistical performance of the HEC-HMS model on a daily and monthly basis. If the simulated values exactly match with the observed values, NOF, NSE, PBIAS, and R2 would be equal to zero, one, zero percent, and one, respectively. These skill matrices were calculated using the following equations from (1) to (4) [40,41].
N O F = 1 Ō 1 n i = 1 n ( O i S i ) 2
N S E = 1 I = 1 n ( S i O i ) 2 I = 1 n ( O i Ō ) 2  
P B I A S = i = 1 n ( S i O i ) i 1 n O i × 100 %
R 2 = n   O i · S i   O i · S i ( n (   O i 2 ) (   O i ) 2 ) × ( n (   S i 2 ) (   S i ) 2 )
where O i = observed discharge, S i = simulated discharge, n = number of observed or simulated data points, and Ō = mean of the observed discharge.

4. Development of Hydrologic Models

4.1. SWAT Model Development

The SWAT model, which operates in daily time steps was developed by the Agricultural Research Services (ARS) division of the USDA [42]. This model is efficient in assessing hydrological processes and non-point source pollution at different spatial scales. The SWAT model divides a watershed into multiple watersheds, and then further discretizes into hydrologic response units (HRUs) consisting of a combination of similar land use, soil, and slope characteristics [43]. HRUs also represent sub-basin area percentages and they are not recognized spatially within a model simulation [44]. The water balance equation (refer to Equation (5)) is the governing equation in the SWAT model [45].
S W t = S W 0 + i = 1 t ( R d a y Q s u r f E T a W s e e p Q g w )
where S W t = final soil water content (mm), S W 0 = initial soil water content (mm), t = time (days), R d a y = amount of precipitation (mm), Q s u r f = amount of surface runoff (mm), E T a = amount of evapotranspiration (mm), W s e e p = amount of water entering the vadose zone from the soil profile (mm), and Q g w = amount of return flow (mm).
Babel et al. [21] developed the SWAT model for the HBS river basin using the SWAT 2012 version. In this previous study, firstly, the entire watershed was delineated into 7 sub-watersheds in the model setup process. Then, these sub-basins were subdivided into 797 HRUs. Afterward, the model was calibrated from 1 January 2007 to 31 December 2010 (4 years) and validated from 1 January 2011 to 31 December 2014 (4 years). A warm-up period of 3 years (1 January 2004 to 31 December 2006) was considered to equilibrate between various water storages in the model. Streamflows observed at the kh.92 hydrological station were used for hydrologic model development. A sensitivity analysis was conducted through the manual calibration process. SWAT Calibration and Uncertainty Procedures (SWAT-CUP) were initially used to identify the most sensitive parameters to streamflow. In the SWAT model developed through the previous study, surface runoff was predicted by the Soil Conservation Service Curve Number (SCS-CN) method. Moreover, the potential evapotranspiration was calculated by the Hargreaves method.
Initially, the Digital Elevation Model (DEM) of the HBS watershed was delineated into sub watersheds by the watershed delineation tool available in SWAT. Thereafter, the reclassified land use and soil maps were used as input in the SWAT model. Then, the weather data were inserted to run the model. Finally, the observed streamflow data at kh.92 was used to calibrate the model.

4.2. HEC-HMS Model Development

A well-calibrated model depends upon the technical abilities of the hydrological model as well as the quality of the input data. The HEC-HMS model for the HBS watershed was manually calibrated for daily streamflow predictions for the period 2007–2010 by comparing the observed streamflow for the peaks, timing, and runoff volumes.
In order to determine the critical parameters affecting the calibration of the rainfall–runoff model, a sensitivity analysis was carried out. One parameter was varied at a time between −50% and 50% within the augmentations of 10% [4]. This was performed while keeping other hydrological parameters constant until the best agreement between observed streamflow and simulated streamflow was achieved. The soil percolation (mm/hr), impervious percentage (%), soil storage (mm), and groundwater 1 storage (mm) are found to be the most sensitive parameters.

5. Results and Discussion

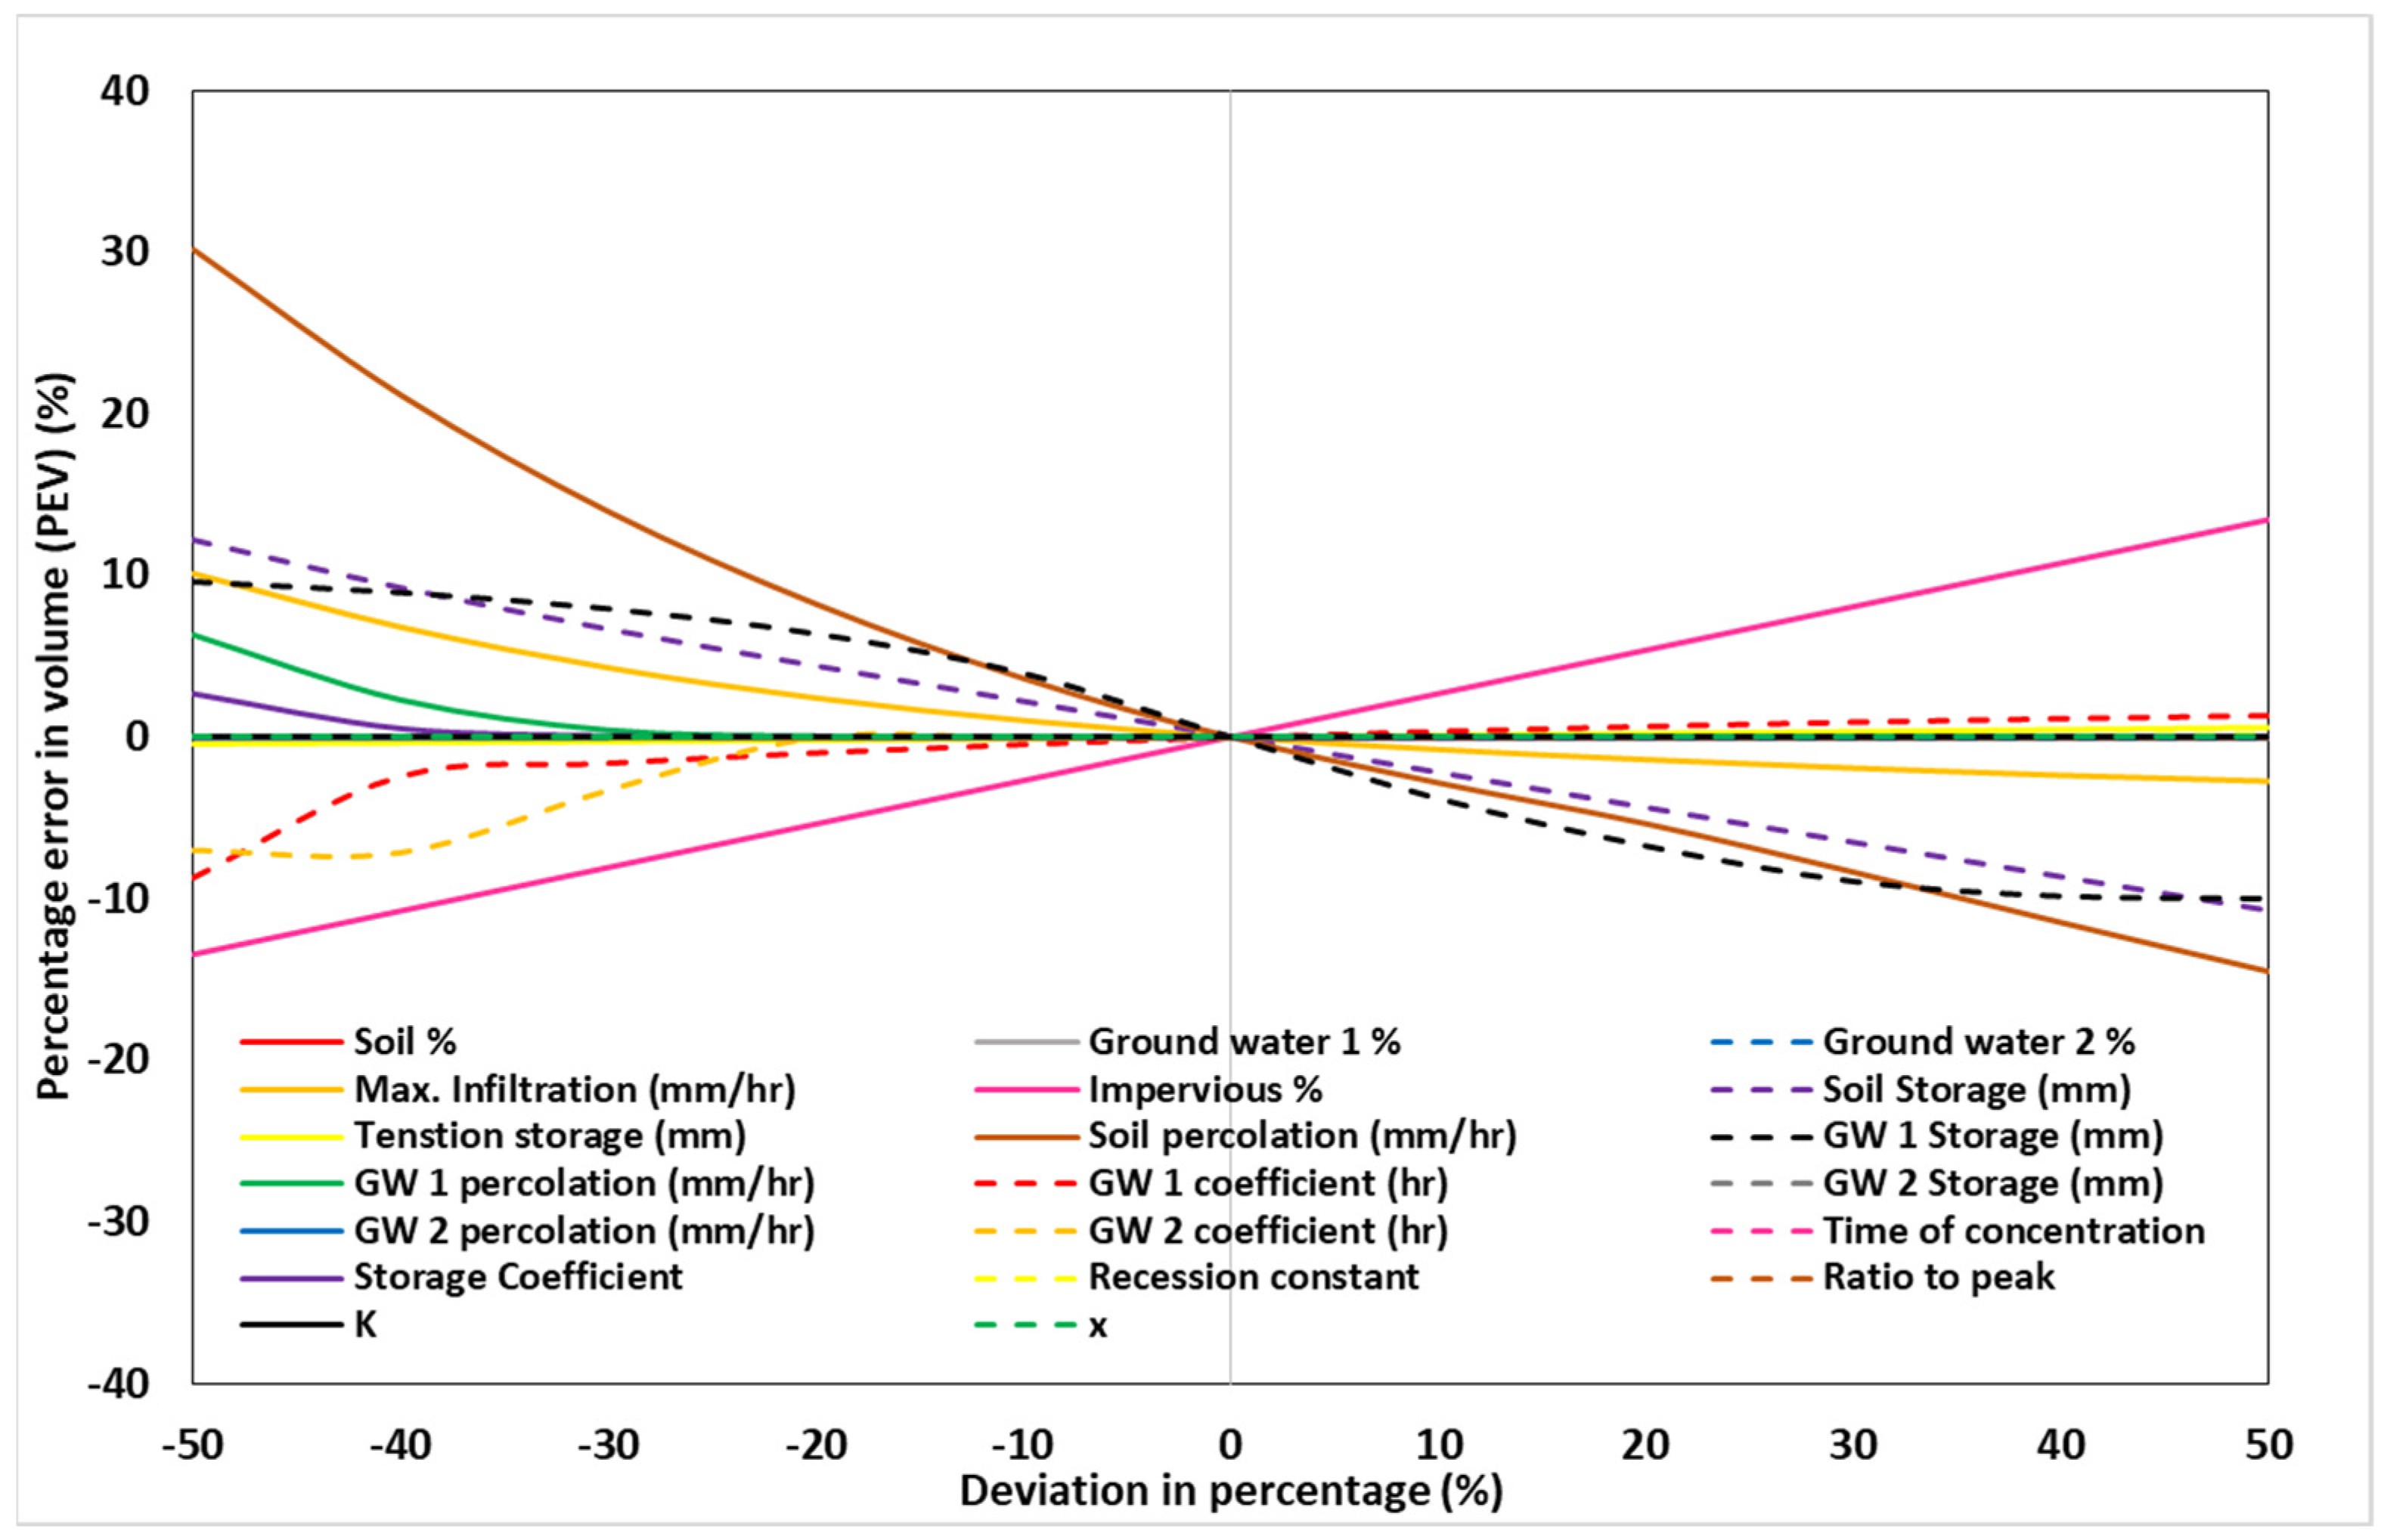
5.1. Results from the HEC-HMS Model

Figure 3 depicts the “percentage error in runoff volume” (PEV) for the calibration period (2007–2010).
The HEC-HMS model produced a reasonable agreement between observed and simulated discharges on daily and monthly time scales. Figure 4 depicts the daily hydrograph comparison of simulated and observed discharges at kh.92 hydrological station for the calibration (January 2007–December 2010) and validation (January 2011–December 2014) periods. The HEC-HMS model underestimated observed streamflow in certain time periods. During calibration and validation, the model underestimated the water volume by 14.43% and 16.62%, respectively. Optimized values for the HBS watershed are provided in Table 1. The model validation results proved that there was an acceptable agreement between observed and simulated hydrographs for the period between January 2011 and December 2014. Among the different loss methods available in the HEC-HMS model for the present study, the soil and moisture accounting method, which is capable of simulating continuous events, was used. The direct runoff was simulated by the Clark Unit Hydrograph. The recession method was used to simulate baseflow, while flow routing was carried out by the Muskingum method.
The statistics obtained during the calibration and validation of the HEC-HMS model are given in Table 2 below. The statistical indicators including NOF, NSE, PBIAS, and R2 were calculated to evaluate the model performance. Skill metrics for calibration and validation on a daily basis for different metrics including NOFs of 1.52 and 1.58, NSEs of 0.70 and 0.60, PBIAS of 14.44% and 16.63%, and R2 of 0.70 and 0.55, respectively. Monthly skill performance for calibration and validation presented better performance compared to the daily performance, which was calculated for NOF as 0.71 and 0.80, NSE as 0.79 and 0.82, and R2 as 0.80 and 0.84. PBIAS demonstrated an underestimation in both calibration and validation periods. Moreover, daily and monthly R2 values are found to be higher than 0.5, while NSE values were found to be greater than 0.60. The NOF was closer to zero. The obtained results demonstrated that the model is acceptable for use in hydrological studies.

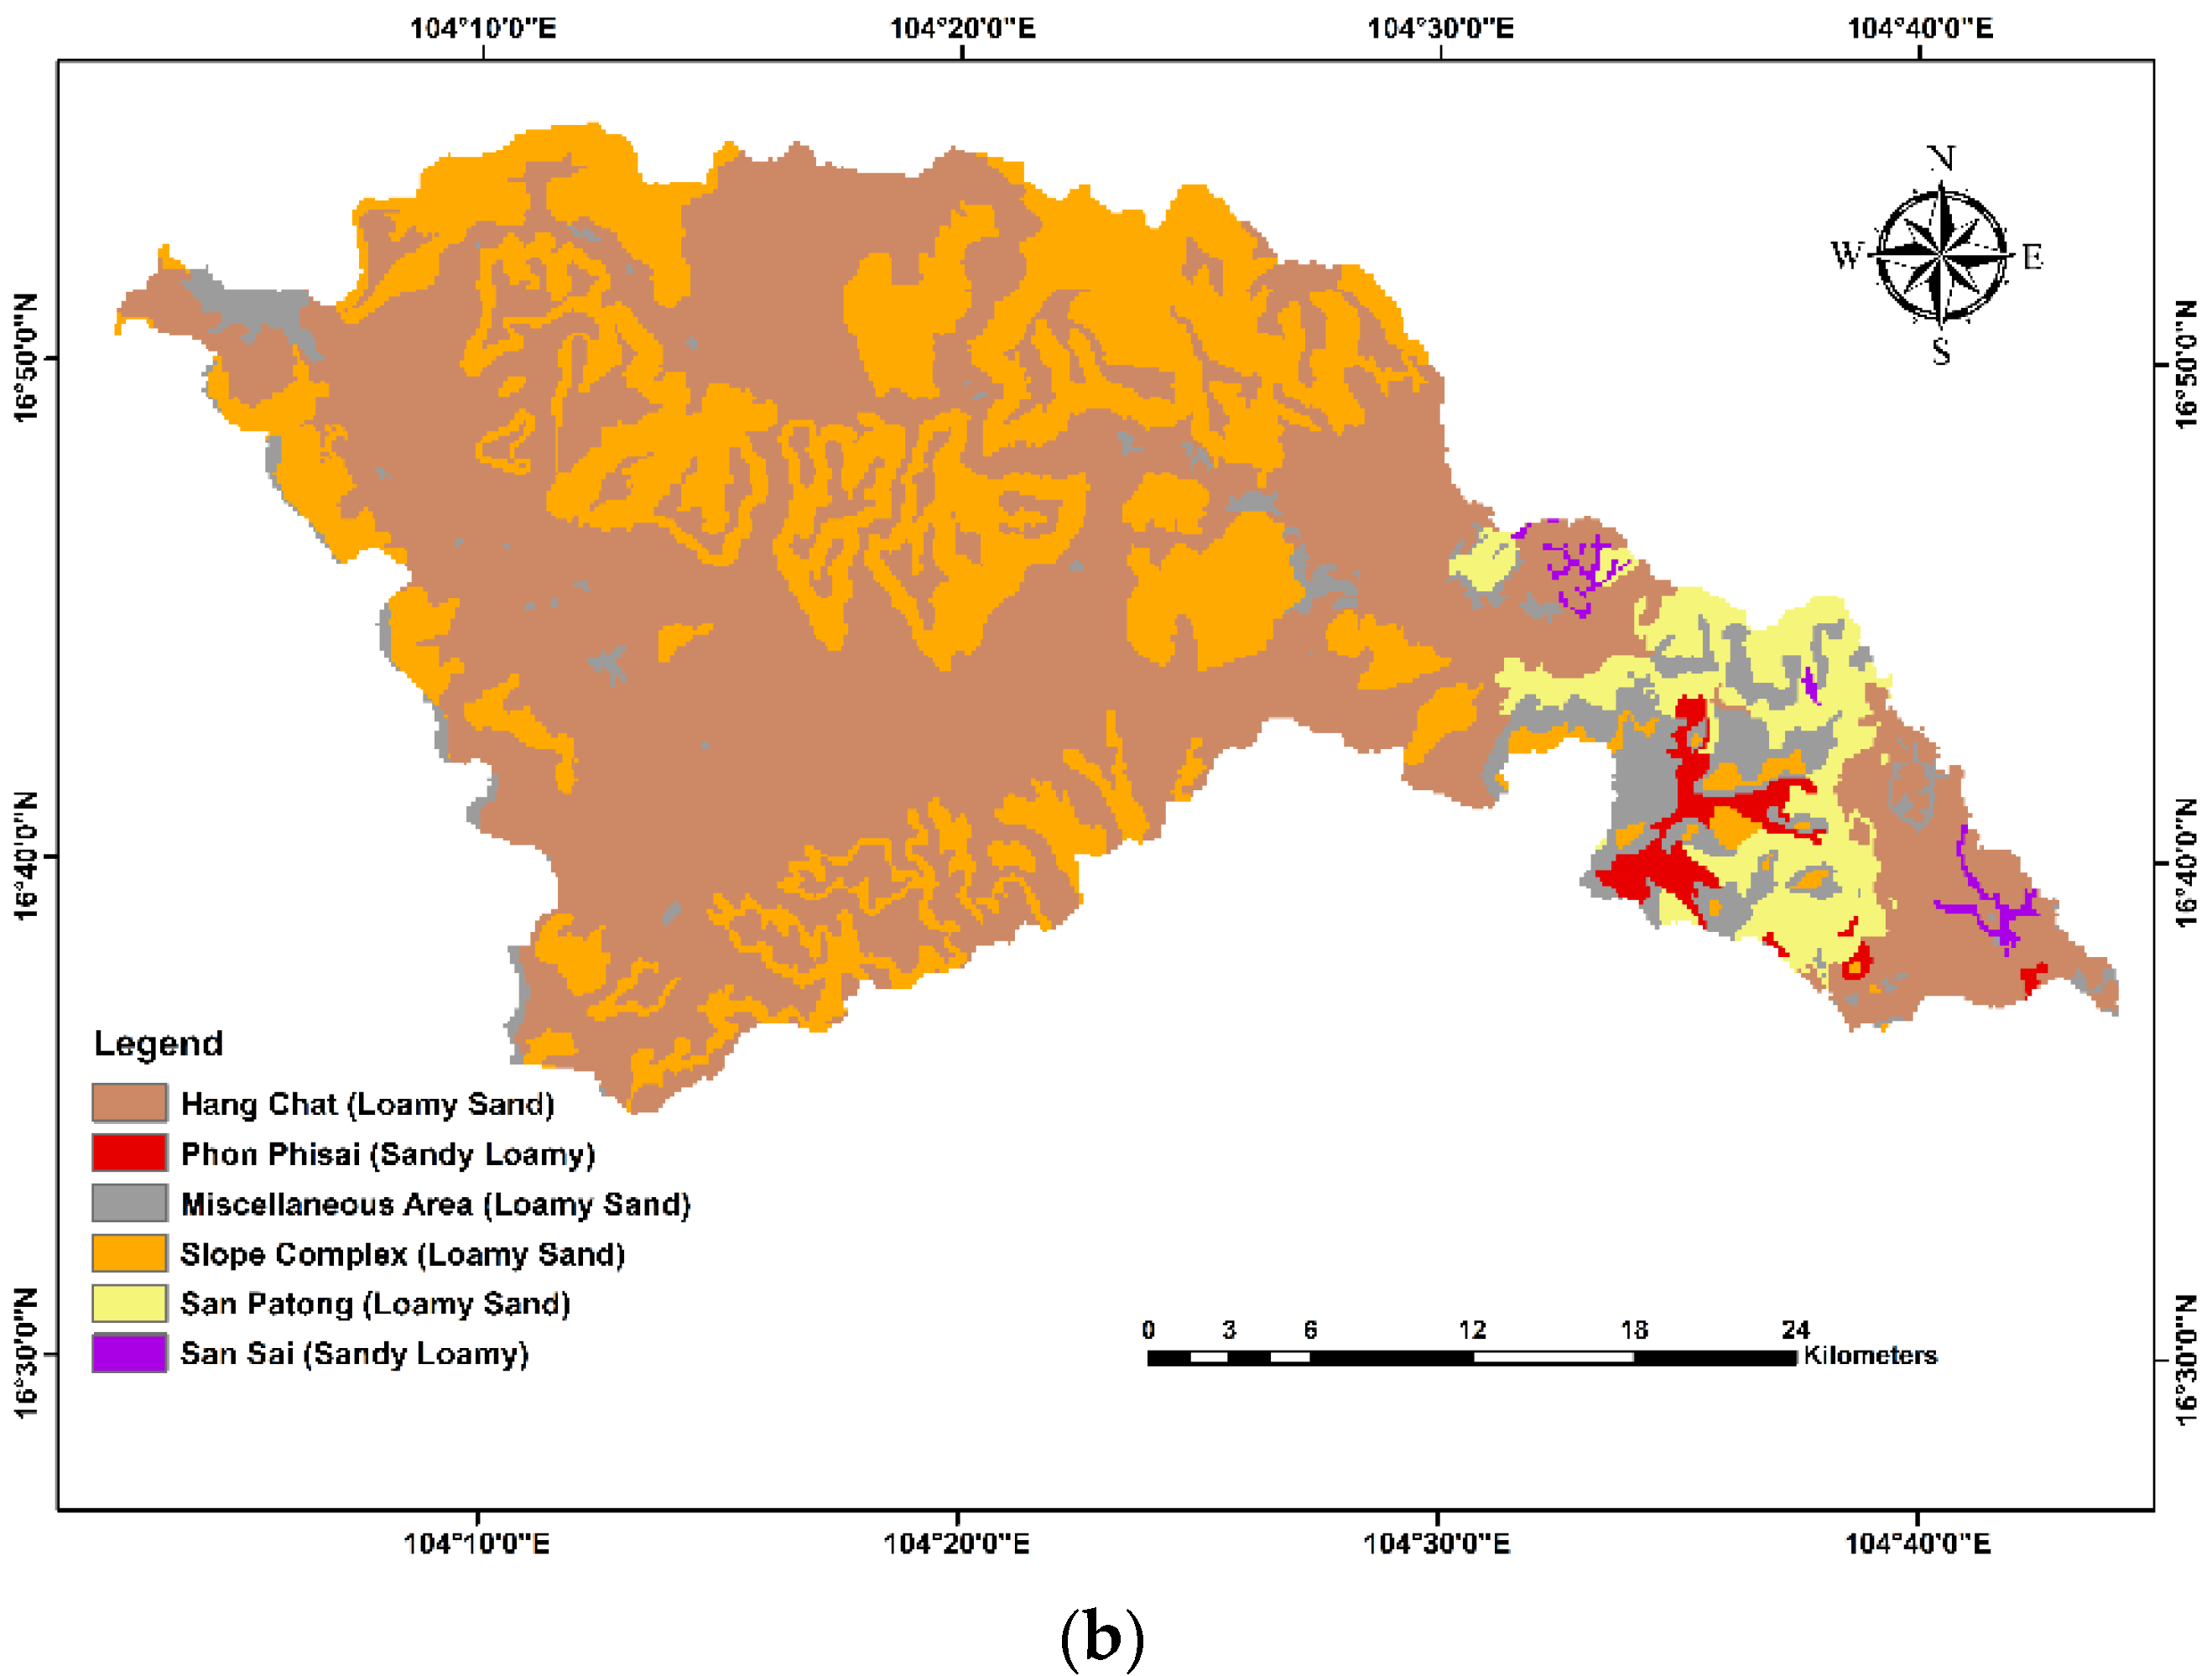
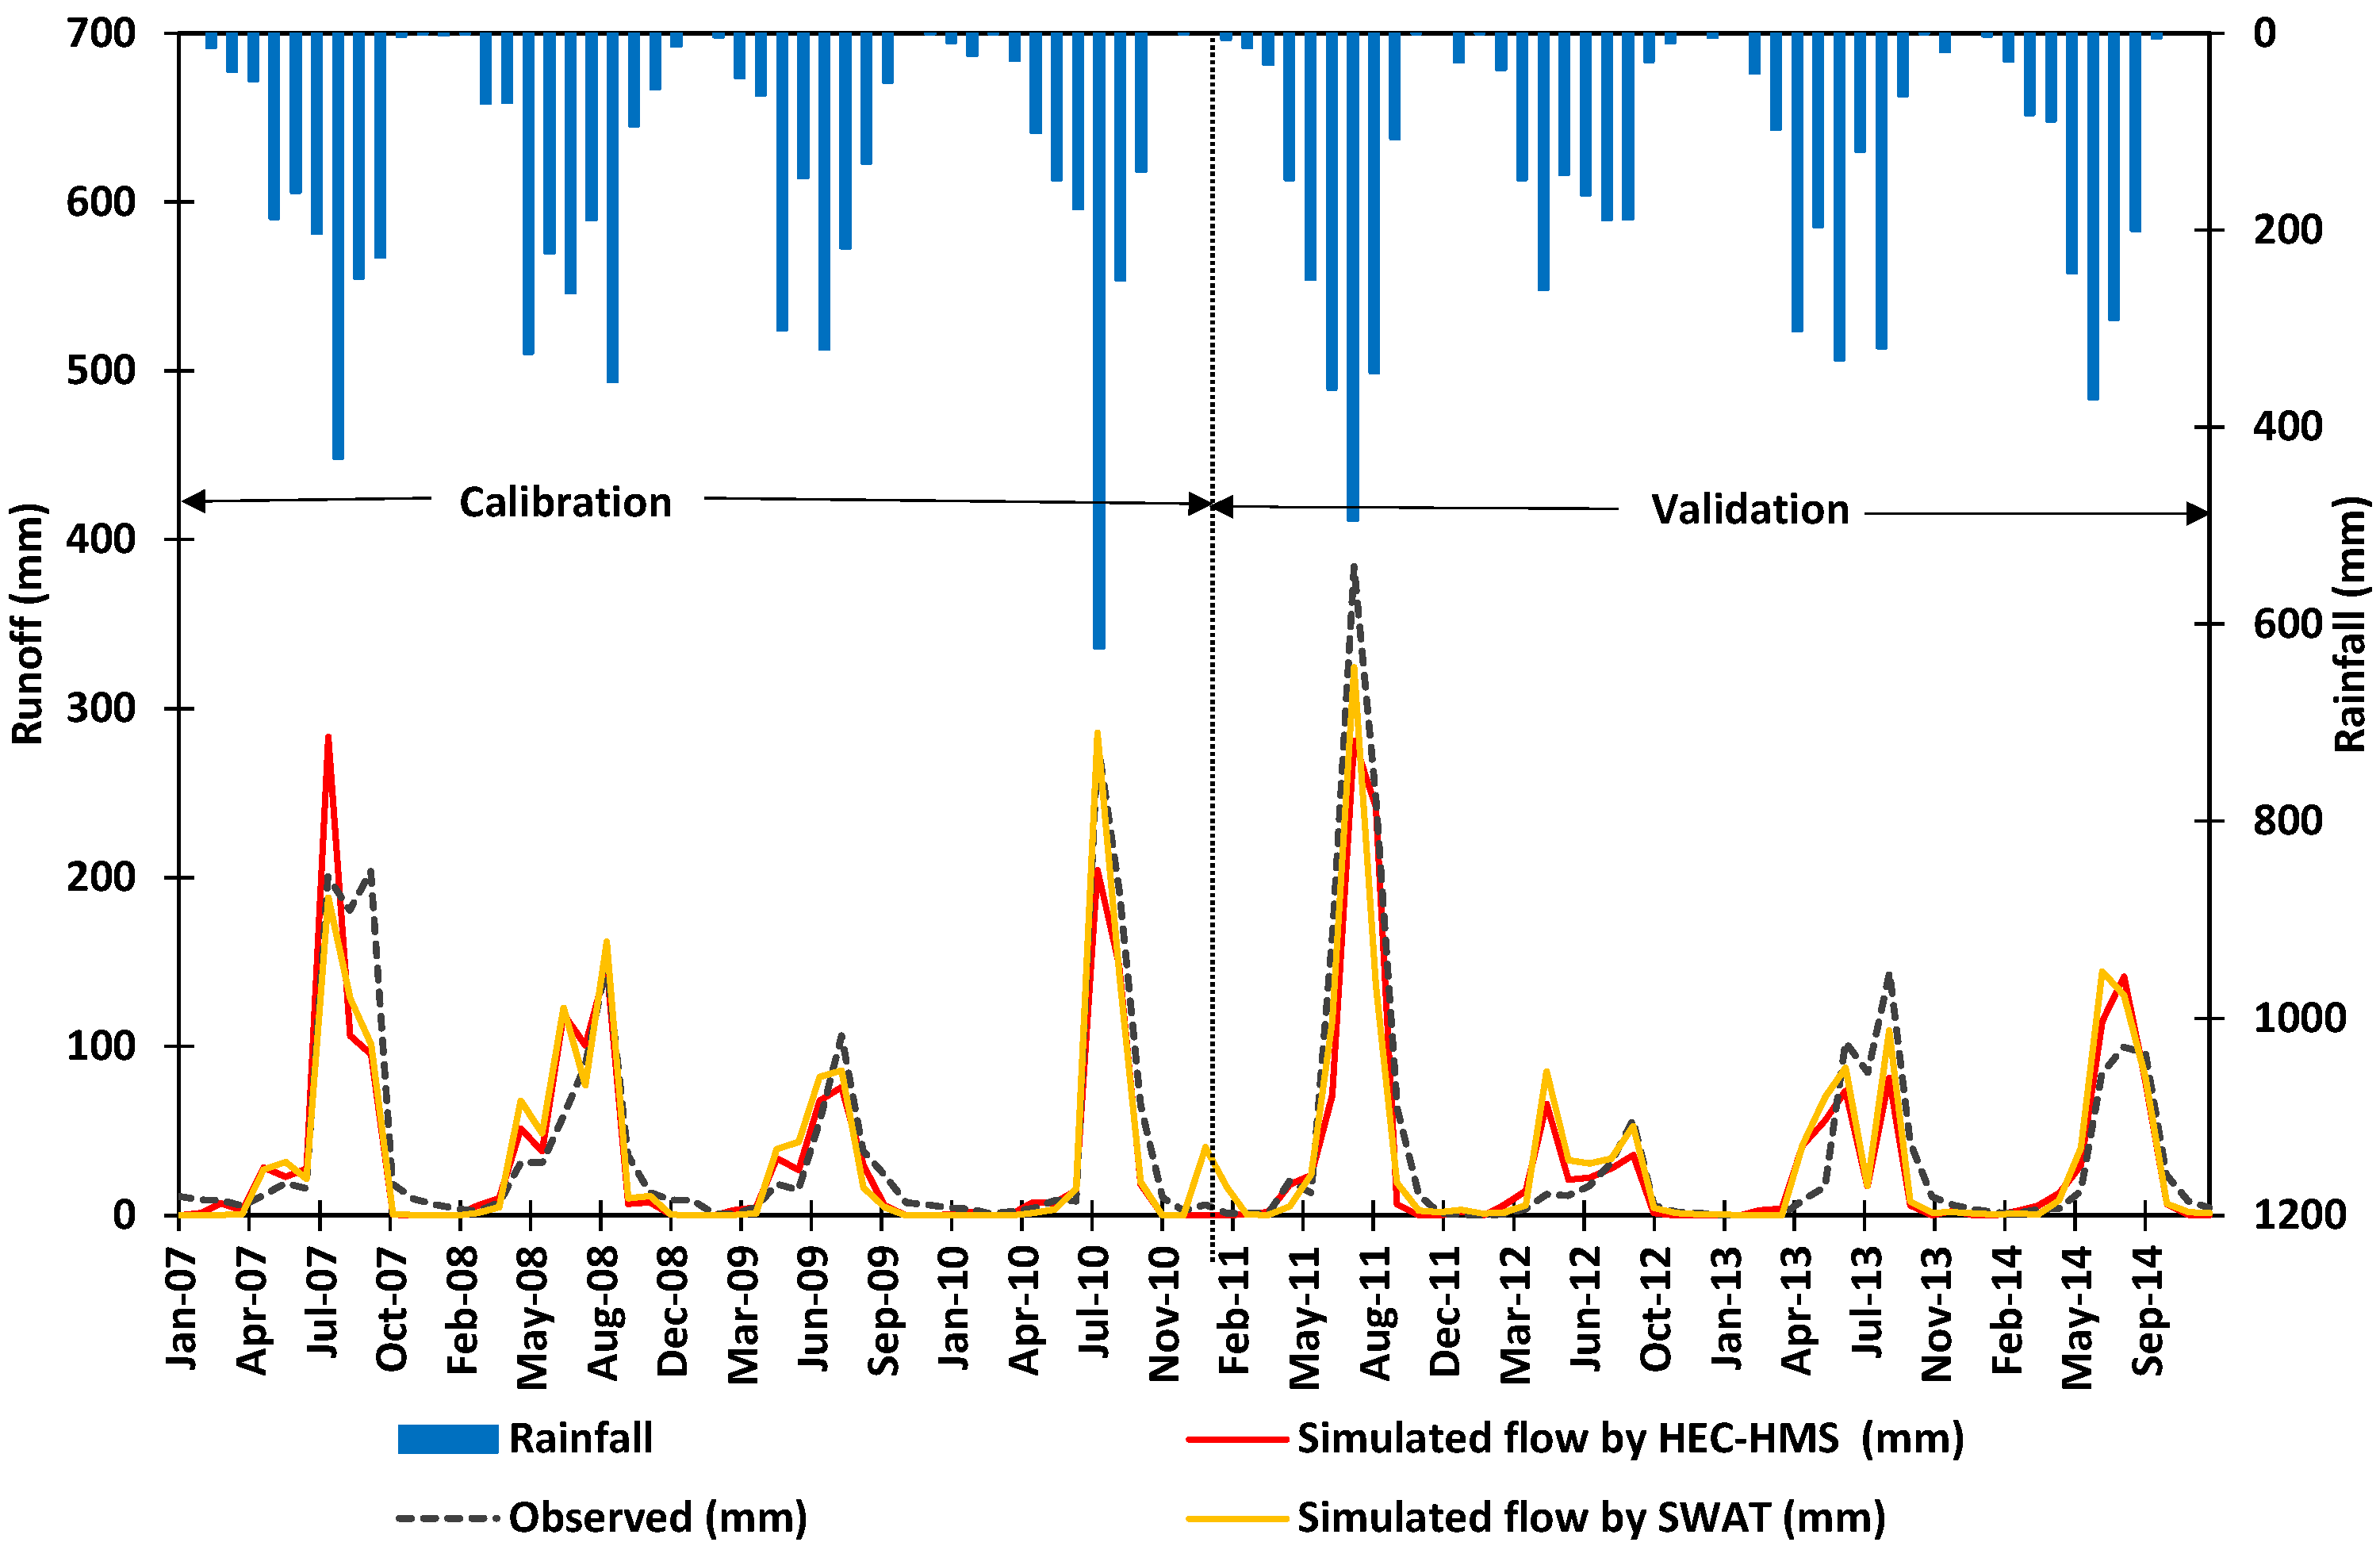
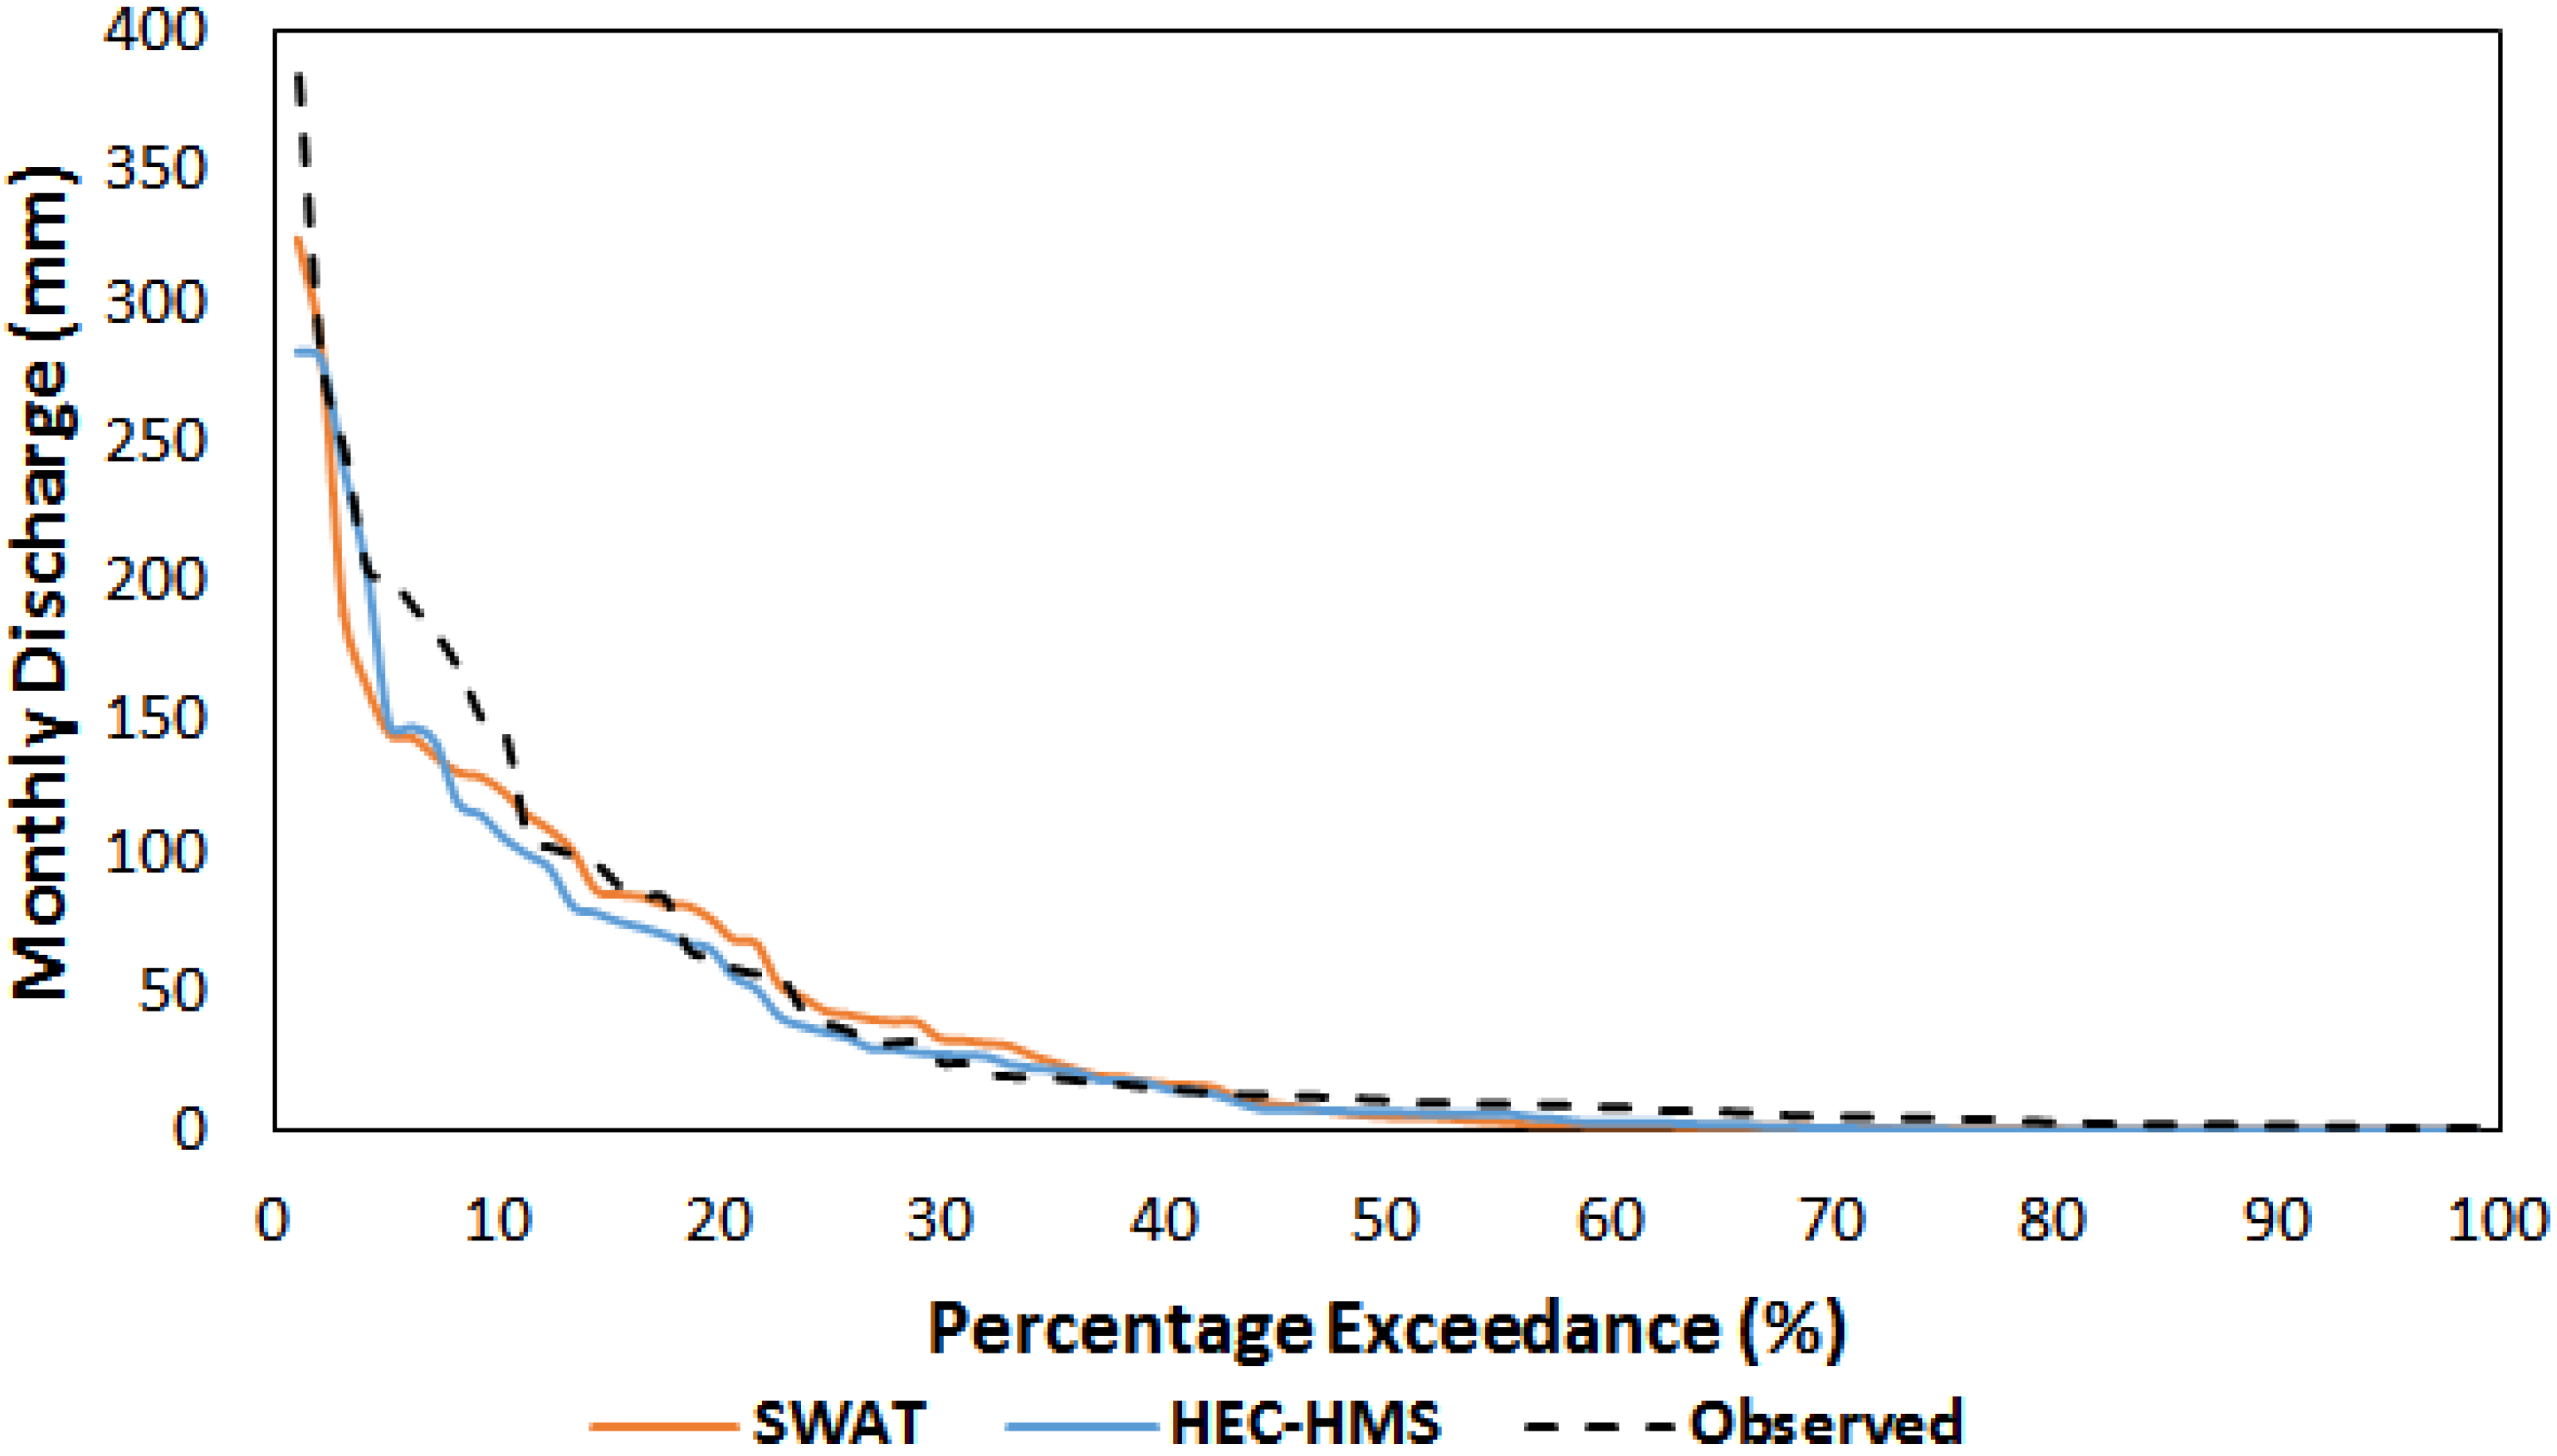
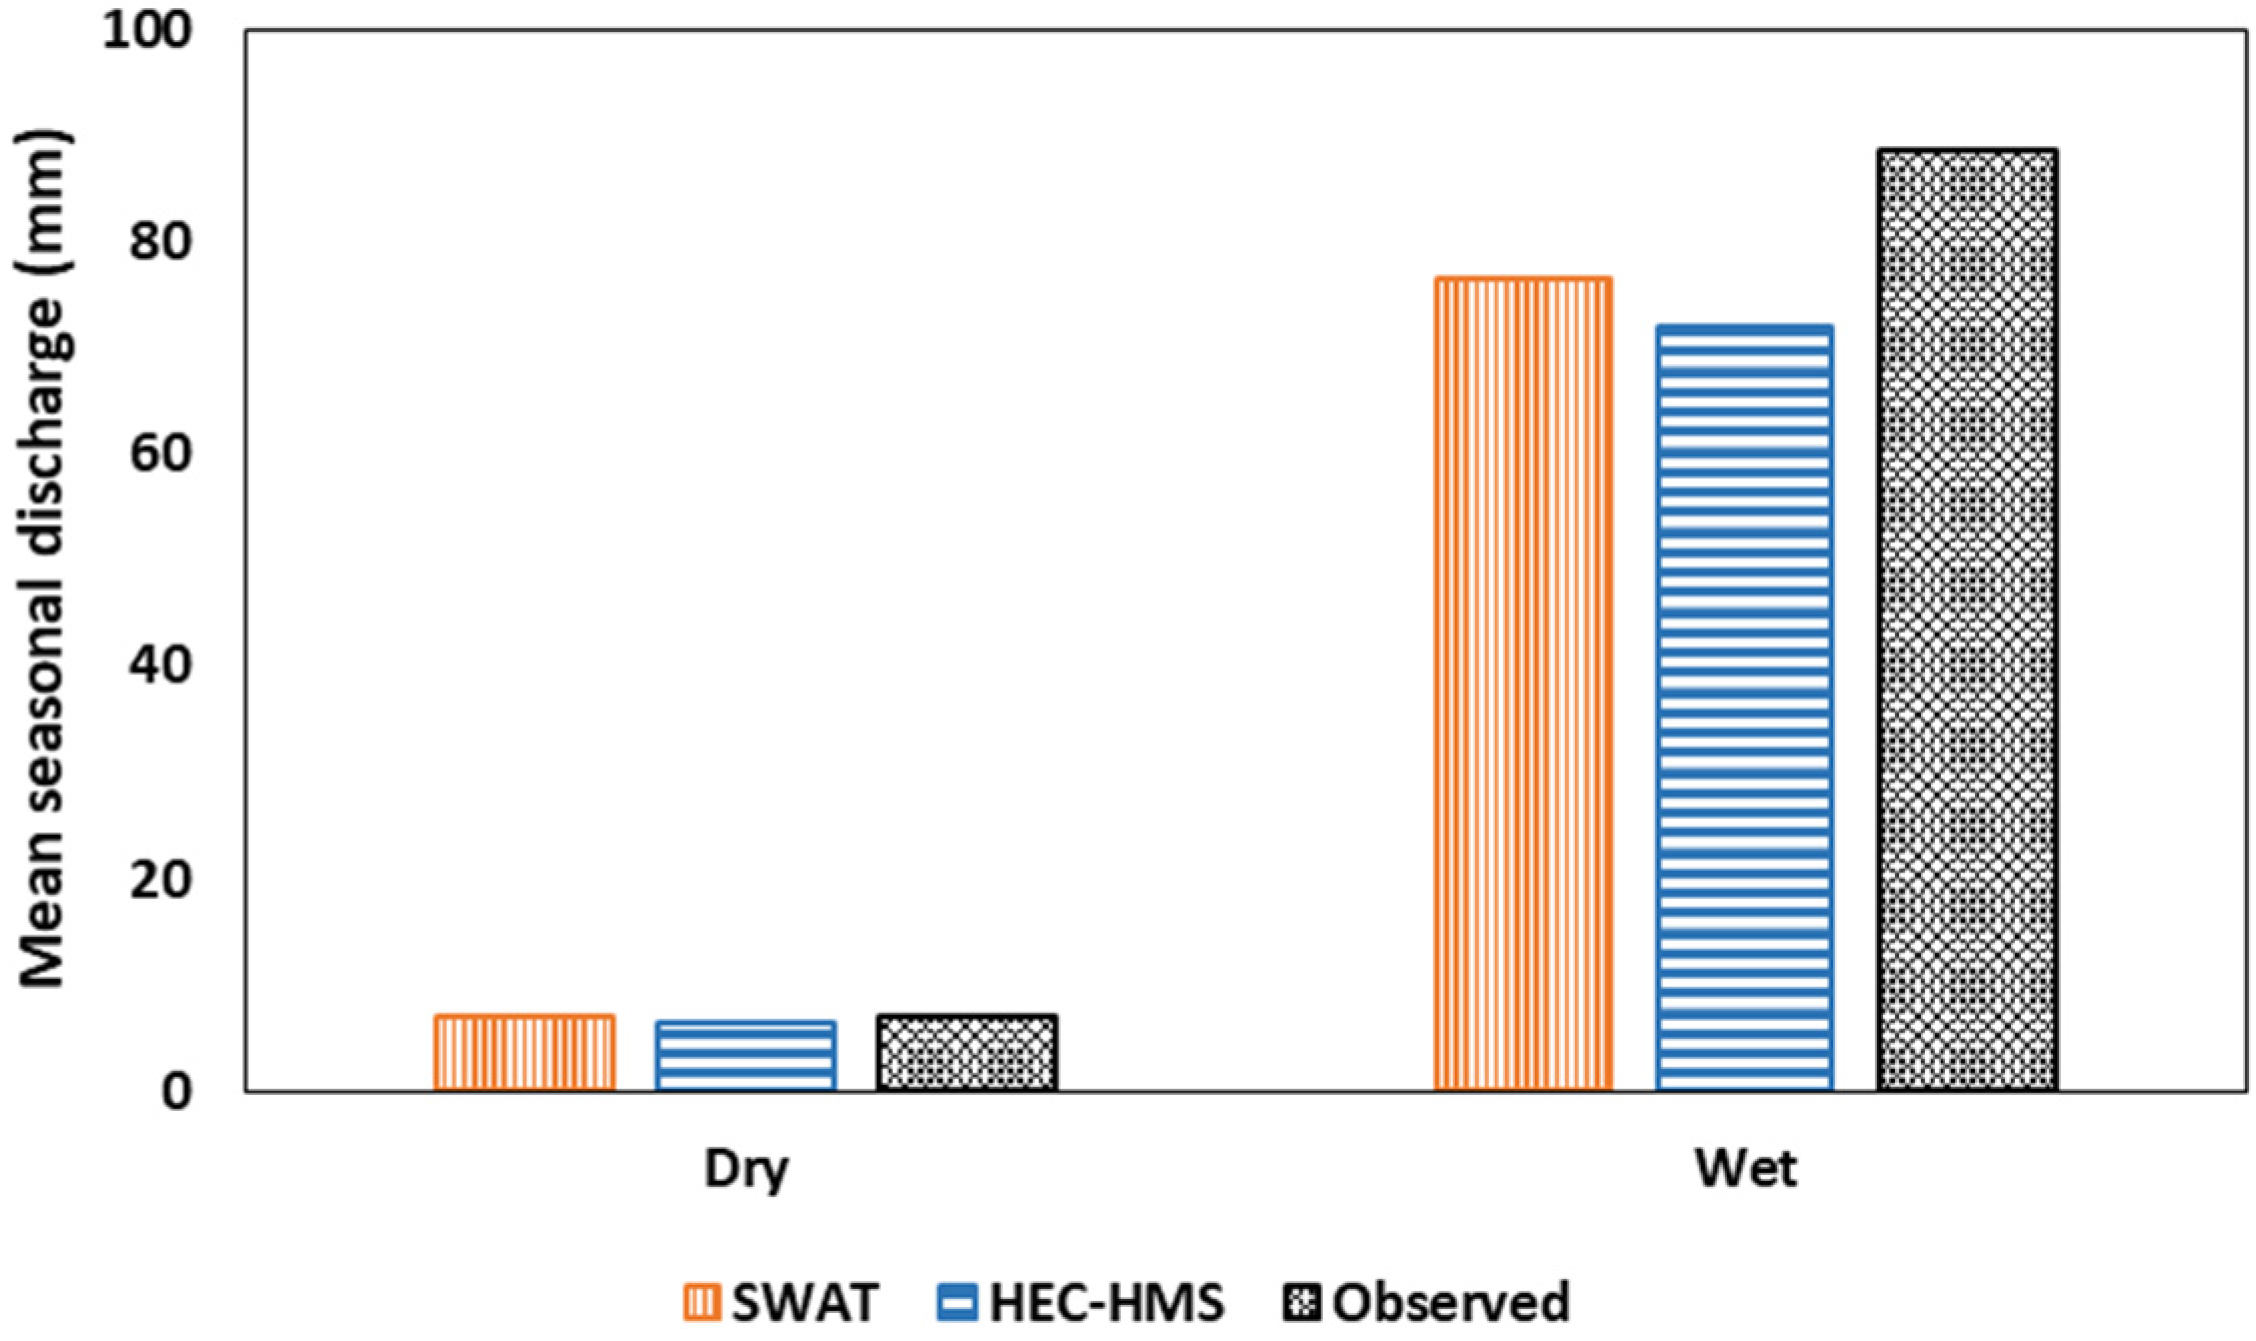
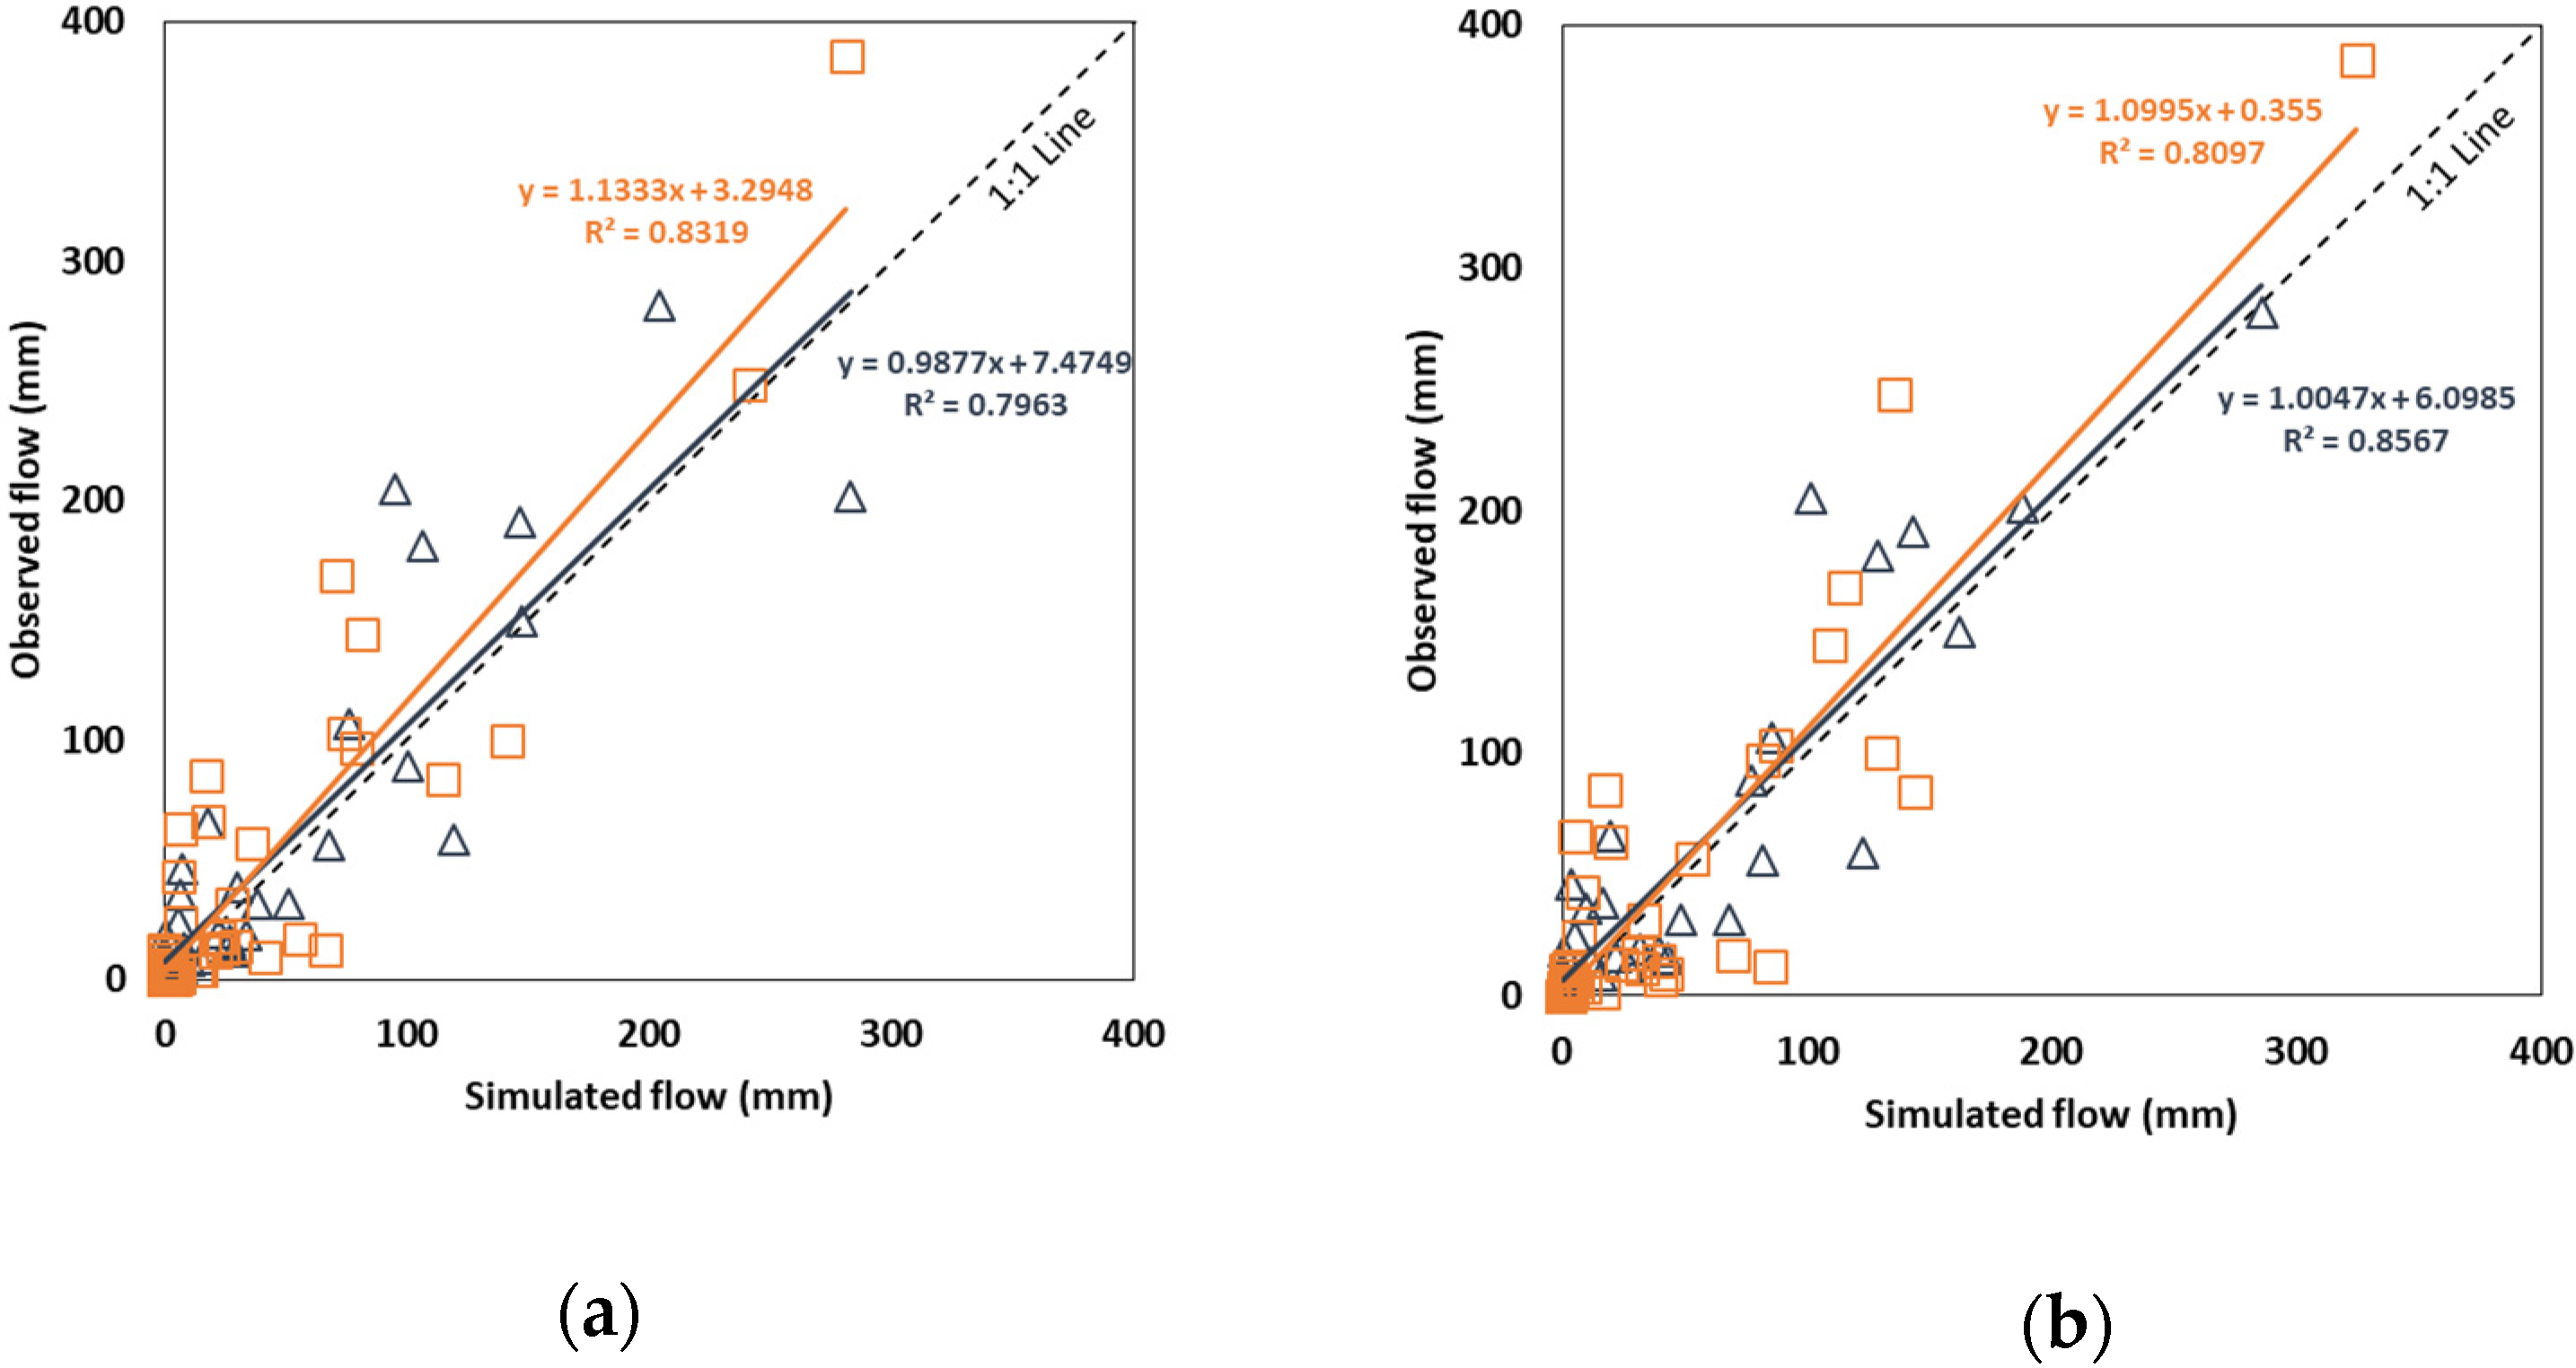
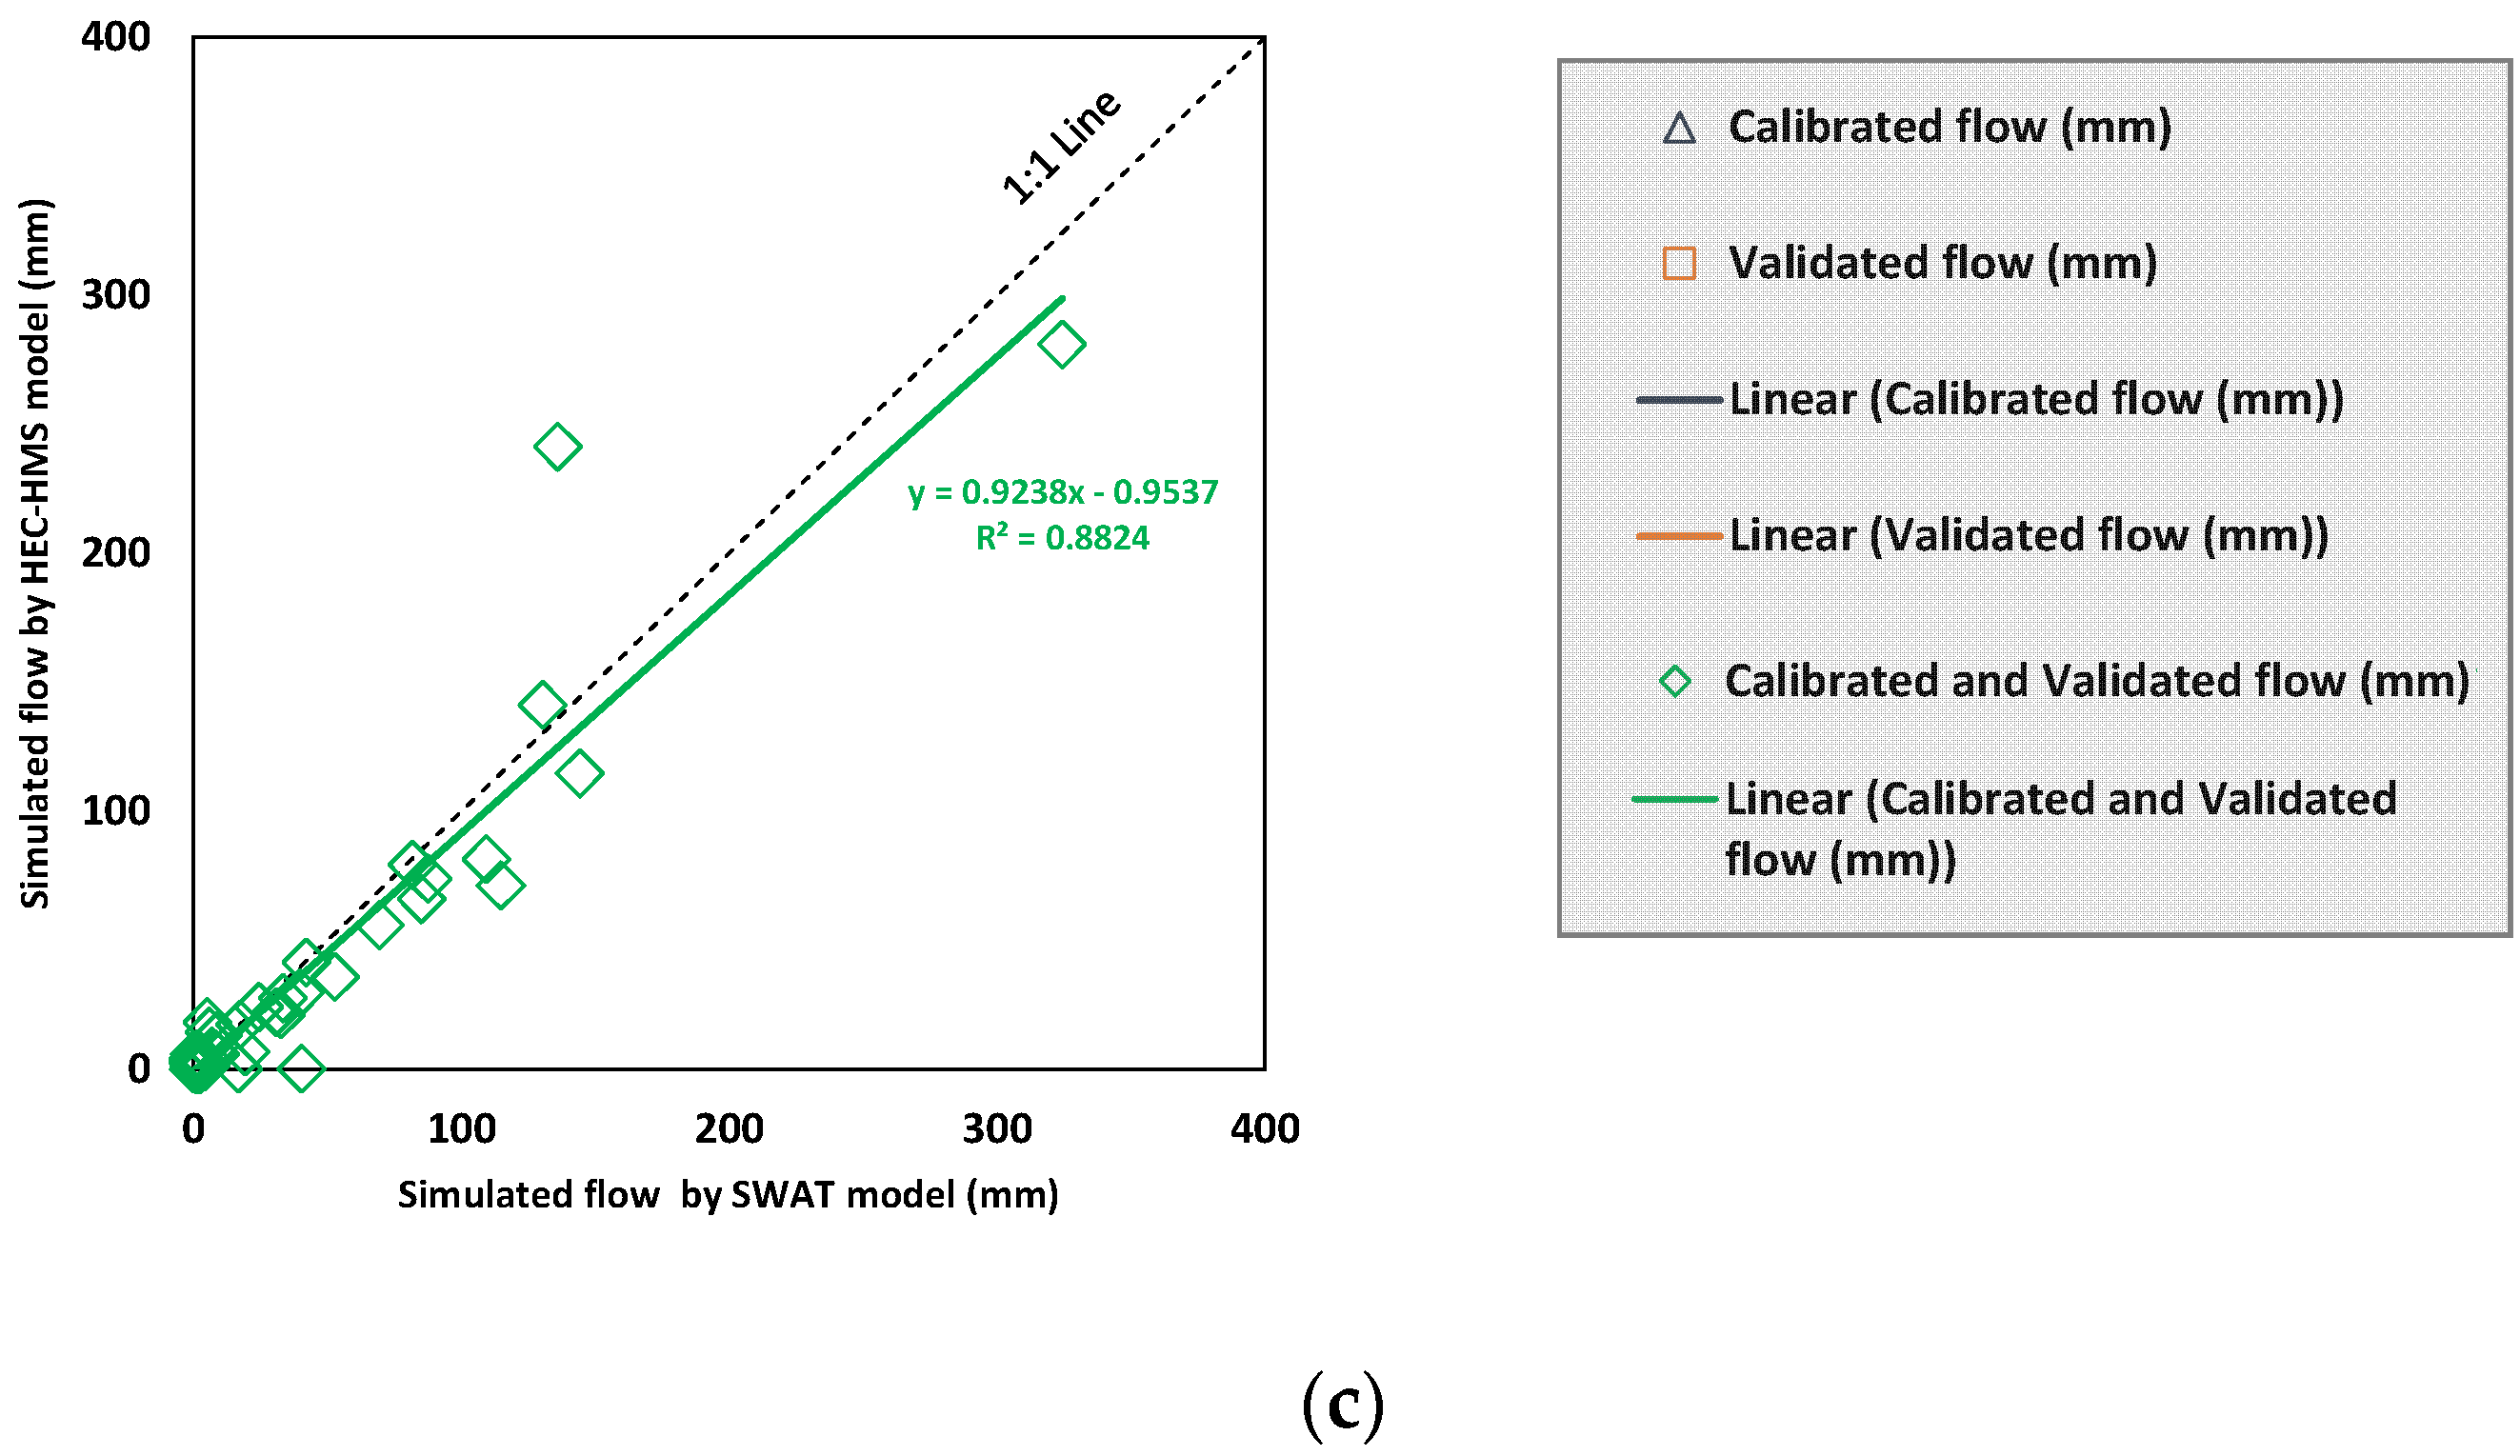
5.2. Streamflow Prediction Capacities between the HEC-HMS and SWAT Models

The streamflow predictions of HEC-HMS were compared with that of SWAT [21] for the HBS watershed.
The monthly observed and simulated streamflows for the period 2007–2014 for the HBS watershed using the HEC-HMS and SWAT models are depicted in Figure 5. Both models performed fairly well although with few discrepancies. The times to peak of simulated discharges from the two hydrological models were comparable. The highest observed monthly discharge at kh.92 during the 2007–2014 period happened in August 2011 and this peak discharge was underestimated by the HEC-HMS and SWAT models by 26.62% and 15.98%. Moreover, a reasonable amount of flood peaks were captured from the SWAT model compared to the HEC-HMS model. The total water volume from the 2007–2014 period has been underestimated through the HEC-HMS and SWAT simulations by 17.76% and 12.37%. In addition, the monthly statistical performances for R2 and NSE obtained by Babel et al. [21] were 0.83 and 0.82 during the calibration (2007–2010) and 0.78 and 0.77 for validation (2011–2014) from the SWAT model. During the same periods, the values obtained for the same metrics from the HEC-HMS model were 0.80 and 0.79 and 0.84 and 0.82. Therefore, the SWAT model statistically performed well during the calibration period (2007–2010).
Figure 6 illustrates scatter plots for the HEC-HMS and SWAT models after the optimization for the kh.92 hydrological station considering monthly simulated and observed streamflows under calibration (2007–2010) and validation (2011–2014) periods. Simulated and observed values are well distributed along the uphill and downhill compared to the 1:1 line for both models. Some points can be seen along the 1:1 lines as well. Therefore, predictive capacities for both models show satisfactory agreement during calibration and validation periods. Linear graphs for the calibration period (2007–2010) are very close to the 1:1 line for both models and HEC-HMS shows a better performance compared to the SWAT model if both hydrological models are exactly matched, then the green color linear curve in Figure 6c should be on the 1:1 line. This gap represents the strengths and weaknesses of both models. The HEC-HMS and SWAT models performed similarly while providing a few months of contradictory results. Through visual inspection, it is clear that the SWAT model was able to catch higher monthly flows compared to the HEC-HMS model.
Flow duration curves (FDCs) were created to compare high flows (10% exceedance), medium flows (40% exceedance), and low flows (90% exceedance) for simulated monthly discharges through the HEC-HMS and SWAT models and observed monthly discharges at the kh.92 hydrological station in the HBS catchment during the 2007–2014 period. Figure 7 illustrates the magnitude of observed monthly streamflows for 10%, 40%, and 90% exceedance percentages as 144.5, 14.5, and 0.9 mm. Simulated monthly discharges show exceedance probabilities of 10%, 40%, and 90% as 109.0, 15.0, and 0.02 mm for the HEC-HMS model and 123.5, 16.95, and 0.02 mm for the SWAT model, respectively. This infers that the SWAT model can capture high flows compared to the HEC-HMS model for the 2007–2014 period. Medium flows can be obtained through the HEC-HMS model more accurately compared to the SWAT model. Both models provide similar performance for the generation of low flows within the considered duration.
Figure 8 shows the mean seasonal discharge for the HEC-HMS and SWAT models with the observed mean seasonal discharge at kh.92 hydrologic station for the 2007–2014 period. Northeastern Thailand has two major rainfall seasons, namely the dry (November to May) and wet (June to October) seasons. The SWAT and HEC-HMS models performed with under-predictions compared to the observed for dry and wet seasons as 2.12% and 13.52%, and 10.76% and 18.54%, respectively. Therefore, the SWAT model performed moderately well compared with the HEC-HMS model on a seasonal basis for the HBS watershed, Thailand. Lacombe et al. [46] stated that northeastern Thailand receives approximately 80–90% of annual precipitation from May to October and above.
In fact, in the SWAT model, the precipitation for a specific sub-basin is derived from the nearest weather station. However, in the HEC-HMS model, a Thiessen Polygon weighted rainfall is assigned for different sub-basins. The Thiessen Polygon weights are user given. Since rainfall is the main input in a rainfall–runoff model this process might have an impact on streamflow simulations as observed through the two hydrologic models. The HEC-HMS uses the Clark Unit Hydrograph method to simulate streamflow, while the SCS-CN method is adopted in the SWAT model. The SCS-CN method accounts for soil, land use, and slopes, while the Clark Unit Hydrograph accounts for the basin shape, watershed storage, and timing. The above-mentioned reasons can be some of the contributing factors to the variations in streamflow results obtained.
The above results also focus on parameter uncertainty and it is clear that better results can be obtained using different parameter sets in different hydrological models. Additionally, errors in the observed datasets make it difficult to perfectly determine the accuracy of runoff predictions through hydrological modelling. The results of this study can be further improved if observed data for evapotranspiration, wind speed, radiation, etc., are available for comparison purposes. Moreover, the robustness of the hydrological model changes according to the chosen time scale. It is recommended to determine suitable hydrological models using alternatives and also to determine hydrology using ensembles of several model structures for tropical catchments.

6. Conclusions

A tropical watershed in northeastern Thailand, the Huai Bang Sai (HBS) was selected in this research to compare the hydrologic performances of two widely used hydrologic models the HEC-HMS and the SWAT. The current work was carried out for the period 2007–2014. For both models, the calibration was carried out at the kh.92 (Ban Kan Luang Dong) hydrological station. The HEC-HMS model developed for the HBS watershed was calibrated and validated and then compared with the earlier developed SWAT model. The R2 and NSE obtained during the calibration process were 0.80 and 0.79, and 0.83 and 0.82 during validation in the HEC-HMS model. For the SWAT model, during calibration, these indices yielded 0.83 and 0.82 and for validation, they were 0.78 and 0.77. The performance of both models is deemed to be satisfactory. The SWAT model was able to capture high flows compared to the HEC-HMS model more accurately for the 2007–2014 period, whereas medium flows were captured through the HEC-HMS model more accurately. Low flows were obtained with good accuracy by both models. In seasonal scales, the SWAT models outperformed the HEC-HMS model. Hence, the SWAT model can be attractive for both wet and dry seasonal flow simulations. The study results demonstrated that the spatial discretization of the HBS watershed through the SWAT and HEC-HMS models did not have a significant impact on response to streamflow simulations. The differences in equations used to compute hydrologic processes did not demonstrate large deviations in reproducing streamflow. Hence, both the SWAT and HEC-HMS are recommended to be used in the tropical humid conditions in Thailand and elsewhere in the world.

Author Contributions

Conceptualization, I.M.C., M.B.G. and U.S.R.; methodology, I.M.C.; software, I.M.C.; formal analysis, I.M.C.; writing—original draft preparation, I.M.C., M.B.G., P.K.B. and E.S.; writing—review and editing, I.M.C., M.B.G., M.K.J., M.S.B., S.S. and U.S.R. supervision, M.B.G., M.K.J., M.S.B., S.S. and U.S.R. All authors have read and agreed to the published version of the manuscript.

Funding

This research received no external funding.

Institutional Review Board Statement

Not applicable.

Informed Consent Statement

Not applicable.

Data Availability Statement

The climatic data used in this research study are available upon request for research purposes.

Acknowledgments

The authors of this manuscript are grateful to all data provision government agencies of Thailand for allowing us to carry out the work successfully. They are also thankful to Sri Lanka Institute of Information Technology, Sri Lanka for allowing the first author to carry out her research work.

Conflicts of Interest

The authors declare no conflict of interest.

References

  1. Gunathilake, M.B.; Amaratunga, Y.V.; Perera, A.; Chathuranika, I.M.; Gunathilake, A.S.; Rathnayake, U. Evaluation of Future Climate and Potential Impact on Streamflow in the Upper Nan River Basin of Northern Thailand. Adv. Meteorol. 2020, 2020, 8881118. [Google Scholar] [CrossRef]
  2. Li, T.; Duan, Y.; Guo, S.; Meng, L.; Nametso, M. Study on Applicability of Distributed Hydrological Model under Different Terrain Conditions. Sustainability 2020, 12, 9684. [Google Scholar] [CrossRef]
  3. Flores, N.; Rodríguez, R.; Yépez, S.; Osores, V.; Rau, P.; Rivera, D.; Balocchi, F. Comparison of Three Daily Rainfall-Runoff Hydrological Models Using Four Evapotranspiration Models in Four Small Forested Watersheds with Different Land Cover in South-Central Chile. Water 2021, 13, 3191. [Google Scholar] [CrossRef]
  4. Gunathilake, M.B.; Panditharathne, P.; Gunathilake, A.S.; Warakagoda, N. Application of a HEC-HMS model on event-based simulations in a tropical watershed. Eng. Appl. Sci. Res. 2020, 47, 349–360. [Google Scholar]
  5. Yang, S.-C.; Yang, T.-H.; Chang, Y.-C.; Chen, C.-H.; Lin, M.-Y.; Ho, J.-Y.; Lee, K.T. Development of a Hydrological Ensemble Prediction System to Assist with Decision-Making for Floods during Typhoons. Sustainability 2020, 12, 4258. [Google Scholar] [CrossRef]
  6. Hanif, A.; Dhanasekar, A.; Keene, A.; Li, H.; Carlson, K. Flood risk assessment methodology for planning under climate change scenarios and the corresponding change in land cover. J. Water Clim. Chang. 2019, 11, 1370–1382. [Google Scholar] [CrossRef]
  7. Bhatta, B.; Shrestha, S.; Shrestha, P.K.; Talchabhadel, R. Evaluation and application of a SWAT model to assess the climate change impact on the hydrology of the Himalayan River Basin. CATENA 2019, 181, 104082. [Google Scholar] [CrossRef]
  8. Chen, Q.; Chen, H.; Wang, J.; Zhao, Y.; Chen, J.; Xu, C. Impacts of Climate Change and Land-Use Change on Hydrological Extremes in the Jinsha River Basin. Water 2019, 11, 1398. [Google Scholar] [CrossRef] [Green Version]
  9. Zhou, Y.; Cui, Z.; Lin, K.; Sheng, S.; Chen, H.; Guo, S.; Xu, C.-Y. Short-term flood probability density forecasting using a conceptual hydrological model with machine learning techniques. J. Hydrol. 2021, 604, 127255. [Google Scholar] [CrossRef]
  10. Mvandaba, V.; Hughes, D.; Kapangaziwiri, E.; Kahinda, J.M.; Hobbs, P.; Madonsela, S.; Oosthuizen, N. The delineation of alluvial aquifers towards a better understanding of channel transmission losses in the Limpopo River Basin. Phys. Chem. Earth Parts A/B/C 2018, 108, 60–73. [Google Scholar] [CrossRef]
  11. Aureli, F.; Mignosa, P.; Prost, F.; Dazzi, S. Hydrological and Hydraulic Flood Hazard Modeling in Poorly Gauged Catchments: An Analysis in Northern Italy. Hydrology 2021, 8, 149. [Google Scholar] [CrossRef]
  12. Peng, H.; Jia, Y.; Tague, C.; Slaughter, P. An Eco-Hydrological Model-Based Assessment of the Impacts of Soil and Water Conservation Management in the Jinghe River Basin, China. Water 2015, 7, 6301–6320. [Google Scholar] [CrossRef] [Green Version]
  13. Arnold, J.G.; Muttiah, R.S.; Williams, J.R. Large-area hydrologic modeling and assessment: Part I. J. American Water Resour. Assoc. 1998, 34, 73–89. [Google Scholar] [CrossRef]
  14. Feldman, A. Hydrological Modeling System HEC-HMS, Technical Reference Manual; Hydrologic Engineering Center HEC; US Army Corps of Engineers: Davis, CA, USA, 2020. [Google Scholar]
  15. Bergström, S. The HBV Model-Its Structure and Applications; Swedish Meteorological and Hydrological Institute: Norrköping, Sweden, 1992. [Google Scholar]
  16. Krause, P. Das hydrologische Modellsystem J2000-Beschreibung und Anwendung in großen Flußgebieten (No. PreJuSER-37462); Programmgruppe Systemforschung und Technologische Entwicklung: Jülich, Germany, 2001; ISBN 3-89336-283-5. [Google Scholar]
  17. Perrin, C.; Michel, C.; Andréassian, V. Improvement of a parsimonious model for streamflow simulation. J. Hydrol. 2003, 279, 275–289. [Google Scholar] [CrossRef]
  18. Bicknell, B.R.; Imhoff, J.C.; Kittle, J.L.; Donigian, A.S.; Johanson, R.C. Athens, Greece: Hydrological Simulation Program—FORTRAN; User’s Manual for Version 11; Rep. No. EPA/600/R-97/080; U.S. EPA: Washington, DC, USA, 1997. [Google Scholar]
  19. Abbott, M.B.; Bathurst, J.C.; Cunge, J.A.; O’Connell, P.E.; Rasmussen, J. An introduction to the European Hydro-logical System-Système Hydrologique Européen, "SHE", 1: History and philosophy of a physically-based, distributed modelling system. J. Hydrol. 1986, 87, 45–59. [Google Scholar] [CrossRef]
  20. Đukić, V.; Erić, R. SHETRAN and HEC HMS Model Evaluation for Runoff and Soil Moisture Simulation in the Jičinka River Catchment (Czech Republic). Water 2021, 13, 872. [Google Scholar] [CrossRef]
  21. Babel, M.S.; Gunathilake, M.B.; Jha, M.K. Evaluation of Ecosystem-Based Adaptation Measures for Sediment Yield in a Tropical Watershed in Thailand. Water 2021, 13, 2767. [Google Scholar] [CrossRef]
  22. Gunathilake, M.B.; Amaratunga, Y.V.; Perera, A.; Karunanayake, C.; Gunathilake, A.S.; Rathnayake, U. Statistical evaluation and hydrologic simulation capacity of different satellite-based precipitation products (SbPPs) in the Upper Nan River Basin, Northern Thailand. J. Hydrol. Reg. Stud. 2020, 32, 100743. [Google Scholar] [CrossRef]
  23. Fathy, I.; Negm, A.M.; El-Fiky, M.; Nassar, M.; Al-Sayed, E. Runoff hydrograph modeling for arid regions (Case study: Wadi Sudr-Sinai). Int. Water Technol. J. 2015, 5, 58–68. [Google Scholar]
  24. Gunathilake, M.B.; Karunanayake, C.; Gunathilake, A.S.; Marasingha, N.; Samarasinghe, J.T.; Bandara, I.M.; Rathnayake, U. Hydrological Models and Artificial Neural Networks (ANNs) to Simulate Streamflow in a Tropical Catchment of Sri Lanka. Appl. Comput. Intell. Soft Comput. 2021, 2021, 6683389. [Google Scholar] [CrossRef]
  25. Chathuranika, I.M.; Gunathilake, M.B.; Azamathulla, H.; Rathnayake, U. Evaluation of Future Streamflow in the Upper Part of the Nilwala River Basin (Sri Lanka) under Climate Change. Hydrology 2022, 9, 48. [Google Scholar] [CrossRef]
  26. Shekar, N.C.S.; Vinay, D.C. Performance of HEC-HMS and SWAT to simulate streamflow in the sub-humid tropical Hemavathi catchment. J. Water Clim. Chang. 2021, 12, 3005–3017. [Google Scholar] [CrossRef]
  27. Phomcha, P.; Wirojanagud, P.; Vangpaisal, T.; Thaveevouthti, T. Predicting sediment discharge in an agricultural watershed: A case study of the Lam Sonthi watershed, Thailand. Sci. Asia 2011, 37, 43–50. [Google Scholar] [CrossRef]
  28. Supakosol, J.; Boonrawd, K. Hydrologic evaluation and effects of climate change on the Nong Han Lake Basin, northeastern Thailand. J. Water Clim. Chang. 2019, 11, 992–1000. [Google Scholar] [CrossRef]
  29. Rossi, C.G.; Srinivasan, K.; Jirayoot, T.; Le Due, P.; Souvannabouth, N.B.; Gassman, P.W. Hydrologic evaluation of the lower mekong river basin with the soil and water assessment tool model. Int. Agric. Eng. J. 2009, 18, 13. [Google Scholar]
  30. Kuntiyawichai, K.; Sri-Amporn, W.; Wongsasri, S.; Chindaprasirt, P. Anticipating of Potential Climate and Land Use Change Impacts on Floods: A Case Study of the Lower Nam Phong River Basin. Water 2020, 12, 1158. [Google Scholar] [CrossRef] [Green Version]
  31. Aliye, M.A.; Aga, A.O.; Tadesse, T.; Yohannes, P. Evaluating the Performance of HEC-HMS and SWAT Hydrological Models in Simulating the Rainfall-Runoff Process for Data Scarce Region of Ethiopian Rift Valley Lake Basin. Open J. Mod. Hydrol. 2020, 10, 105–122. [Google Scholar] [CrossRef]
  32. Khoi, D.N. Comparison of the HEC-HMS and SWAT hydrological models in simulating the streamflow. J. Sci. Technol. 2016, 53, 189–195. [Google Scholar]
  33. Ismail, H.; Kamal, M.R.; Hin, L.S.; Abdullah, A.F. Performance of HEC-HMS and ArcSWAT models for assessing climate change impacts on streamflow at Bernam River Basin in Malaysia. Sci. Technol. 2020, 28, 1027–1048. [Google Scholar]
  34. Kheereemangkla, Y.; Shrestha, R.P.; Shrestha, S.; Jourdain, D. Modeling hydrologic responses to land management scenarios for the Chi River Sub-basin Part II, Northeast Thailand. Environ. Earth Sci. 2016, 75, 793. [Google Scholar] [CrossRef]
  35. Bekele, W.T.; Haile, A.T.; Rientjes, T. Impact of climate change on the streamflow of the Arjo-Didessa catchment under RCP scenarios. J. Water Clim. Chang. 2021, 12, 2325–2337. [Google Scholar] [CrossRef]
  36. Bhuiyan, H.A.K.M.; McNairn, H.; Powers, J.; Merzouki, A. Application of HEC-HMS in a Cold Region Watershed and Use of RADARSAT-2 Soil Moisture in Initializing the Model. Hydrology 2017, 4, 9. [Google Scholar] [CrossRef] [Green Version]
  37. Haque, S.; Ali, M.; Islam, A.K.M.S.; Khan, J.U. Changes in flow and sediment load of poorly gauged Brahmaputra river basin under an extreme climate scenario. J. Water Clim. Chang. 2020, 12, 937–954. [Google Scholar] [CrossRef]
  38. Hamdan, A.; Almuktar, S.; Scholz, M. Rainfall-Runoff Modeling Using the HEC-HMS Model for the Al-Adhaim River Catchment, Northern Iraq. Hydrology 2021, 8, 58. [Google Scholar] [CrossRef]
  39. Tassew, B.G.; Belete, M.A.; Miegel, K. Application of HEC-HMS Model for Flow Simulation in the Lake Tana Basin: The Case of Gilgel Abay Catchment, Upper Blue Nile Basin, Ethiopia. Hydrology 2019, 6, 21. [Google Scholar] [CrossRef] [Green Version]
  40. Ouédraogo, W.A.A.; Raude, J.M.; Gathenya, J.M. Continuous Modeling of the Mkurumudzi River Catchment in Kenya Using the HEC-HMS Conceptual Model: Calibration, Validation, Model Performance Evaluation and Sensitivity Analysis. Hydrology 2018, 5, 44. [Google Scholar] [CrossRef] [Green Version]
  41. Chiang, S.; Chang, C.-H.; Chen, W.-B. Comparison of Rainfall-Runoff Simulation between Support Vector Regression and HEC-HMS for a Rural Watershed in Taiwan. Water 2022, 14, 191. [Google Scholar] [CrossRef]
  42. Melesse, A.M.; McClain, M.; Wang, X.; Abira, M.; Mutayoba, W. Modeling the Impact of Land-Cover and Rainfall Regime Change Scenarios on the Flow of Mara River, Kenya. In Proceedings of the World Environmental and Water Resources Congress 2008, Honolulu, HI, USA, 12–16 May 2008; pp. 1–10. [Google Scholar] [CrossRef]
  43. Akoko, G.; Le, T.; Gomi, T.; Kato, T. A Review of SWAT Model Application in Africa. Water 2021, 13, 1313. [Google Scholar] [CrossRef]
  44. Pignotti, G.; Rathjens, H.; Cibin, R.; Chaubey, I.; Crawford, M. Comparative Analysis of HRU and Grid-Based SWAT Models. Water 2017, 9, 272. [Google Scholar] [CrossRef] [Green Version]
  45. Marahatta, S.; Devkota, L.; Aryal, D. Application of SWAT in Hydrological Simulation of Complex Mountainous River Basin (Part I: Model Development). Water 2021, 13, 1546. [Google Scholar] [CrossRef]
  46. Lacombe, G.; Trébuil, G.; Polthanee, A. Long-term change in rainfall distribution in Northeast Thailand: Will cropping systems be able to adapt? Cah. Agric. 2017, 26, 25001. [Google Scholar] [CrossRef] [Green Version]
Figure 1. Location and topography map with hydrometeorological stations in Huai Bang Sai watershed in northeastern Thailand.
Fluids 07 00267 g001
Figure 2. (a) Land-use map and (b) soil distribution map for the HBS watershed.
Fluids 07 00267 g002aFluids 07 00267 g002b
Figure 3. Sensitivity analysis of the HEC-HMS model for the calibration period (2007-2010).
Fluids 07 00267 g003
Figure 4. Comparison of daily observed and simulated streamflows at kh.92 for the 2007–2014 period from the HEC-HMS model.
Fluids 07 00267 g004
Figure 5. Comparison of observed and simulated hydrographs for the HEC-HMS and SWAT models for the period 2007–2014 of the HBS watershed.
Fluids 07 00267 g005
Figure 6. Scatter plots for monthly data comparing between: (a) simulated streamflow by HEC-HMS model versus observed streamflow in mm for calibration and validation; (b) simulated streamflow by SWAT model versus observed streamflow in mm for calibration and validation; (c) simulated streamflow by SWAT model versus simulated streamflow by HEC-HMS during the 2007–2014 period.
Fluids 07 00267 g006aFluids 07 00267 g006b
Figure 7. FDCs for monthly simulated streamflows by the HEC-HMS and SWAT models compared to the observed monthly streamflow within the period 2007–2014.
Fluids 07 00267 g007
Figure 8. Mean seasonal discharge for observed as well as the HEC-HMS and SWAT models for the period 2007–2014.
Fluids 07 00267 g008
Table 1. Optimized parameters of HEC-HMS model.
MethodParameterUnitOptimized Value
Soil Moisture AccountingSoil Percentage%70
Groundwater 1%45
Groundwater 2%82
Max. Infiltrationmm/hr4.5
Impervious Percentage%16.2
Soil Storagemm276
Tension Storagemm30
Soil Percolationmm/hr0.42
GW 1 Storagemm9
GW 1 Percolationmm/hr0.675
GW 1 Coefficienthr120
GW 2 Storagemm100
GW 2 Percolationmm/hr1
GW 2 Coefficienthr100
Clark Unit HydrographTime of Concentrationhr10
Storage Coefficienthr42
RecessionInitial Discharge m3/s0.1
Recession Constant 0.35
Ratio to Peak 0.4
MuskingumKhr0.02
x 0.3
Table 2. Statistical performance criterions during calibration and validation for the HEC-HMS model.
ClusterDailyMonthly
NOFNSEPBIASR2NOFNSEPBIASR2
Calibration (2007–2010)1.520.70−14.450.700.710.79−14.450.80
Validation (2011–2014)1.580.60−16.630.550.800.82−16.630.84
Publisher’s Note: MDPI stays neutral with regard to jurisdictional claims in published maps and institutional affiliations.

