
Detection of Partial Blockages in Pressurized Pipes by Transient Tests: A Review of the Physical Experiments
by
 , , , and
Bruno Brunone
1,†,
Filomena Maietta
1,*,†,
Caterina Capponi
1,†,
Huan-Feng Duan
2,† and
Silvia Meniconi
1,† 1
Department of Civil and Environmental Engineering, University of Perugia, 06125 Perugia, Italy
2
Department of Civil and Environmental Engineering, The Hong Kong Polytechnic University, Hung Hom, Hong Kong 999077, China
*
Author to whom correspondence should be addressed.
†
These authors contributed equally to this work.
Fluids 2023, 8(1), 19; https://doi.org/10.3390/fluids8010019
Submission received: 11 November 2022
/
Revised: 13 December 2022
/
Accepted: 30 December 2022
/
Published: 3 January 2023
(This article belongs to the Special Issue Unsteady Flows in Pipes)
Abstract
:Pressure waves, while traveling along pressurized pipes, collect precious information about possible faults (e.g., leaks and partial blockages). In fact, the characteristics of the pressure wave reflected by the fault are strongly related to it. To encourage the use of the transient test-based technologies (TTBTs) for partial blockage (PB) detection in pressurized pipe systems, it can be of interest to critically analyze the available experimental results and to point out the aspects that need to be investigated in more detail, since no review has been executed so far. Such a deficiency has two negative consequences. The first one is that TTBTs are still relegated to limbo by technicians. The second one is that not enough material is available for refining tools to extract all the information contained in the acquired pressure signals and then to pursue an effective PB detection. As main results of the executed analysis, the following issues can be counted: (i) the lack of tests carried out in large diameter and concrete pipes; (ii) the absence of tests carried out in complex pipe systems (e.g., looped networks); and (iii) the extreme need for considering real pipe systems. The fulfillment of the last issue will greatly contribute to the solutions of the other ones.
1. Introduction
Faults in pressurized pipe systems may affect several features, resulting in different consequences in terms of functioning conditions. Leaks, as an example, imply not only resource loss but also energy waste. The corrosion of the pipe’s internal wall, as a second example, not only reduces the mechanical strength, but also facilitates biological processes at the wall that, for water pipes, may compromise potability. Moreover, over time, corrosion has external evidence, since it can lead to leakage. However, maybe the most insidious fault to detect and manage is the partial obstruction, the technical term for which is a “partial blockage”—hereafter referred to as a PB—which does not provide any external evidence. Indirect “symptoms” of a PB are a decrease in carrying capacity and pressure rise. However, such symptoms do not allow localizing nor viably characterizing PB by means of, as an example, steady-state measurements. In the case of water, PBs may result from the deposition of sand and excess calcium and hydrates, whereas in pipes carrying refined and crude oil, paraffins and asphaltene may obstruct the cross-section. Moreover, in the subsea pipelines, wax particles in the oil may crystallize and deposit on the inner surface because of the cold temperature [1]. Plaques and clots behave as PBs in the venous and arterial systems. In all cases, “natural” PBs start from small growths in the roughness of inner pipe walls, and if not detected early, protrude transversely (in many cases, radially and then with a circumferential shape) and longitudinally, occluding progressively the internal pipe cross-sectional area [2]. A PB can be also assimilated by an in-line valve negligently set as partially closed.
In liquid-filled pipelines, on which attention is focused in this paper, several methods have been proposed for detecting PBs (early detection is the best action!): vibration analysis [3], pulse echo methodology [2], acoustic reflectometry [4], steady-state [5], and unsteady-state [6,7,8] pressure measurements. An analysis of the characteristics of these methods is beyond the scope of this paper, where attention is focused on the methods using unsteady-state pressure measurements—the so called transient test-based techniques (TTBTs)—and specifically, on the the review of the available physical experimental data. The main reasons for such a choice is that the technicians responsible for large and long pipelines (i.e., those conveying water and oil) must be able to execute the diagnosis of the system whenever they need it to assure continuity and efficiency of service. Indeed, this is the case for TTBTs, which are based on the clear properties of the pressure waves propagating in a pressurized pipe (see the next section) and do not need nor use an extremely sophisticated equipment, nor the presence of external personnel.
As in [9], rational criteria for selecting the papers have been preliminary identified. Specifically, reasons for exclusion were:
- conference papers, research reports, and PhD theses (in most cases, they include preliminary results with the complete series of data published in successive Journal papers);
- tests where the PB was due to an air pocket (then only experiments on “rigid” PBs are considered);
- papers where incomplete information was provided about the experimental layout, modality of transient generation, or PB simulation.
With regard to the last feature, an exception was made for the paper by Contractor [10], a sort of milestone in the field, where regretfully very little information is given about the experiments. As a result, 18 papers were selected, which were published between 1965 and 2020.
The time-history of the published papers is reported in Figure 1. The figure anticipates one of the results of this review: with respect to the leak case [9], very few experimental papers deal with PB detection by means of transient tests. In such a bleak scenario, the long gap between 1965 and 2005 (40 years!) with no contribution must be noticed, and 2013 is a stand-out year, with four papers. For the sake of clarity and to make the paper easy to read, the selected papers have been grouped into six categories, each of them labeled by a progressive number (Table 1). For some categories, sub-categories have been identified. For category “# 6-PB simulation”, as an example, four subcategories have been considered: in-line valve, orifice, small-bore pipe, and “other types”. Moreover, to make clear the classification criterion, it is worth pointing out that if, as an example, two different devices have been used for simulating a PB in a study, the paper is included in both of the related sub-categories. In Table 2, all the selected papers are listed with their main characteristics indicated according to the identified categories. Finally, in Table 3, the meanings of the abbreviations used in Table 2 are given.
According to the aims of this paper, in Section 2 the mechanisms of interaction between a pressure wave and a PB are synthesized. Each sub-section of Section 3 concerns one of the above-mentioned categories and includes a description of the main features, critical issues, and possible objectives for future research. In the conclusions, some general comments on the literature review and hopes for the scientific community of the field are reported.
2. Mechanisms of Interaction between a Pressure Wave and a Partial Blockage (PB)
In one-dimensional flow in pressurized pipes—with the conduit wall and the fluid being linearly elastic—for the case of slightly compressible fluids and low velocities, the continuity equation can be written as
and, if the friction term is neglected, the equation of motion is:
where h = piezometric head, g = gravity acceleration, V = mean flow velocity, a = pressure wave speed, t = time, and s = spatial co-ordinate [26,27].
The D’Alembert general solution of Equations (1) and (2) is given by:
where the arbitrary functions and may be interpreted as pressure waves (in meters of fluid column) propagating in and directions, respectively. In Equations (3) and (4), the subscript 0 and indicate the pre-transient value and flow direction. These equations describe the transient where is the generated pressure wave, whereas is the reflected one due to a change in the boundary condition, as illustrated later in this section. For the sake of simplicity, hereafter and are indicated as and , respectively; the subscript refers to the part of the pipe where these pressure waves happen. It is worth noting that the frictionless hypothesis implies that the solution given by Equations (3) and (4) provides reliable results only in the first phases of the transients (e.g., [28]), precisely those considered in this paper.
With the aim of highlighting clearly the basic principles of TTBTs, below, the “genesis” of the reflected pressure wave, , is discussed for the specific case of PBs. Precisely, we discuss the interaction of the incoming pressure wave, , with boundaries, i.e., with “something” different in terms of geometry or flow condition with respect to the pipe with uniform characteristics in which is generated and propagating. In such a context, although the considered analytical approach can be found in several textbooks and papers (e.g., [10,26,27]), it is presented here in a unitary form. As a confirmation of the obtained relationships providing , a comparison with physical experimental results is offered. This also allows pointing out the difference between “discrete” and “extended” PBs. Such a distinction can be based on their transient responses. If a single reflected pressure wave characterizes the pressure time-history at the measured section—or if the maneuver is not instantaneous, a single train of reflected pressure waves—this is the case of a “discrete” PB. On the contrary, if several reflected pressure waves—or several trains of pressure waves—are identified, this is the case of an “extended” PB. It is worth noting that in capturing the pressure waves generated by the PB, for given pipe characteristics, the value of the sampling frequency at the measurement section plays a crucial role. Accordingly, two cases are examined below: the in-line orifice (Figure 2) and small-bore pipe (SBP) (Figure 3), as examples of “discrete” and “extended” PBs, respectively (the subscript b refers quantities to the PB).
For an in-line orifice (Figure 2), diameter reduction (Figure 3b), and expansion (Figure 3c), we can write:
since no reflected wave is generated yet (the subscripts u and d indicate the upstream and downstream branch, respectively), and
For the in-line orifice, which behaves as a partially closed in-line valve for a given opening degree, a minor loss occurs [10]:
and
Moreover, as it is = , and there is no storage in the orifice, it is = and = . Assuming that the velocity behind is zero or very nearly zero (), as in the case when the incoming is generated by a complete closure, the pressure wave reflected by the orifice is given by
According to Equation (5), an in-line orifice, and then a partially closed in-line valve, generates a positive reflected pressure wave. Such a feature is confirmed by the pressure signal reported in Figure 4b, where characterizes the transient response of the PB at the measurement section M. The shape of the pressure rise due to the arrival of the reflected pressure wave is linked to one of the maneuvers generating the incoming pressure wave. Precisely, an instantaneous (or nearly instantaneous) maneuver generates a single wave, whereas a maneuver with a given duration gives rise to a train of pressure waves.
A junction between two pipes [29], where the diameter decreases ( < D) in the direction of the propagation (case of shrinkage-Figure 3b), behaves as the downstream part of a small-bore pipe simulating an extended PB. Assuming that the two pipes have the same Young’s modulus and neglecting the effect on the pressure wave speed of the deposited material that reduces the diameter to , it can be assumed that . At the junction, continuity of flow and commonality of the piezometric head (if the local loss is neglected) allows writing:
As a consequence, the reflection coefficient, , defined as the ratio between the reflected pressure wave, , and incoming pressure wave, , is given by the following relationship:
According to Equation (6), a junction with a diameter decreasing in the direction of the generated pressure wave is characterized by a positive reflection coefficient.
On the contrary, for the case of a junction with a diameter increasing in the direction of the propagation (case of expansion—Figure 3c), following a procedure similar to that for Equation (6), the following expression is obtained for the reflection coefficient:
Then, a junction with a diameter increasing in the direction of the generated pressure wave is characterized by a negative reflection coefficient.
As a consequence, in a small-bore pipe, the mechanisms of interaction synthesized by Equations (6) and (7) give rise to a bell-shaped feature, linked to , in the pressure signal. Precisely, firstly, a pressure rise happens due to shrinkage, and then the expansion gives rise to a pressure decrease. Such a feature is confirmed by the experimental pressure signal reported in Figure 5b, where is the maximum value of the pressure signal due to the PB at the measurement section M.
3. Categories of Physical Experiments
As anticipated, in this section the available physical experiments are analyzed by referring to the categories reported in Table 1.
3.1. Category #1: Complexity of Layout and Modality of Transient Generation (CLM)
The relevance of such aspects merits a specific section, even if a very narrow range of types of experimental setups has been explored. In fact, 94% of the tests has been executed in a laboratory (L) and on a single pipe (SP). One paper [15] concerns field (F) tests carried out in a branched system (BS). In most papers (14, equal to 78%) valve closure (VC) was considered, whereas in one study [20], a sinusoidal oscillation was used (OM—other maneuver). In two studies, the pressure waves were inserted by means of the Portable Pressure Wave Maker (PPWM) device, refined at the Water Engineering Laboratory (WEL—http://welabpg.com, accessed on 13 December 2022) of the University of Perugia, Italy. In one study, transients were generated by both valve closure and PPWM [25].
3.2. Category #2: Pipe Material
Within TTBTs, the effect of the pipe material is reflected mainly in the value of the pressure wave speed, a. This quantity influences the value of the inserted pressure wave, , and the requirements for the data acquisition system. Precisely, the larger the a (e.g., as in metallic and concrete pipes) and the larger the (for a given velocity change), the larger the sampling frequency needed to capture the behavior of the traveling pressure waves. As shown in Figure 6, the available experiments are shared almost equally between metallic (with very few tests in copper pipes) and polyethylene pipes, whereas no tests have been executed in PVC and concrete pipes. The lack of experiments with PVC pipes can be assigned to the fact that they are usually approximated as the polyethylene ones. The lack of experiments with concrete pipes is due to the fact that almost all available tests have been executed in laboratories where concrete pipes cannot be used because their diameters are usually quite large.
3.3. Category #3: Pipe Diameter
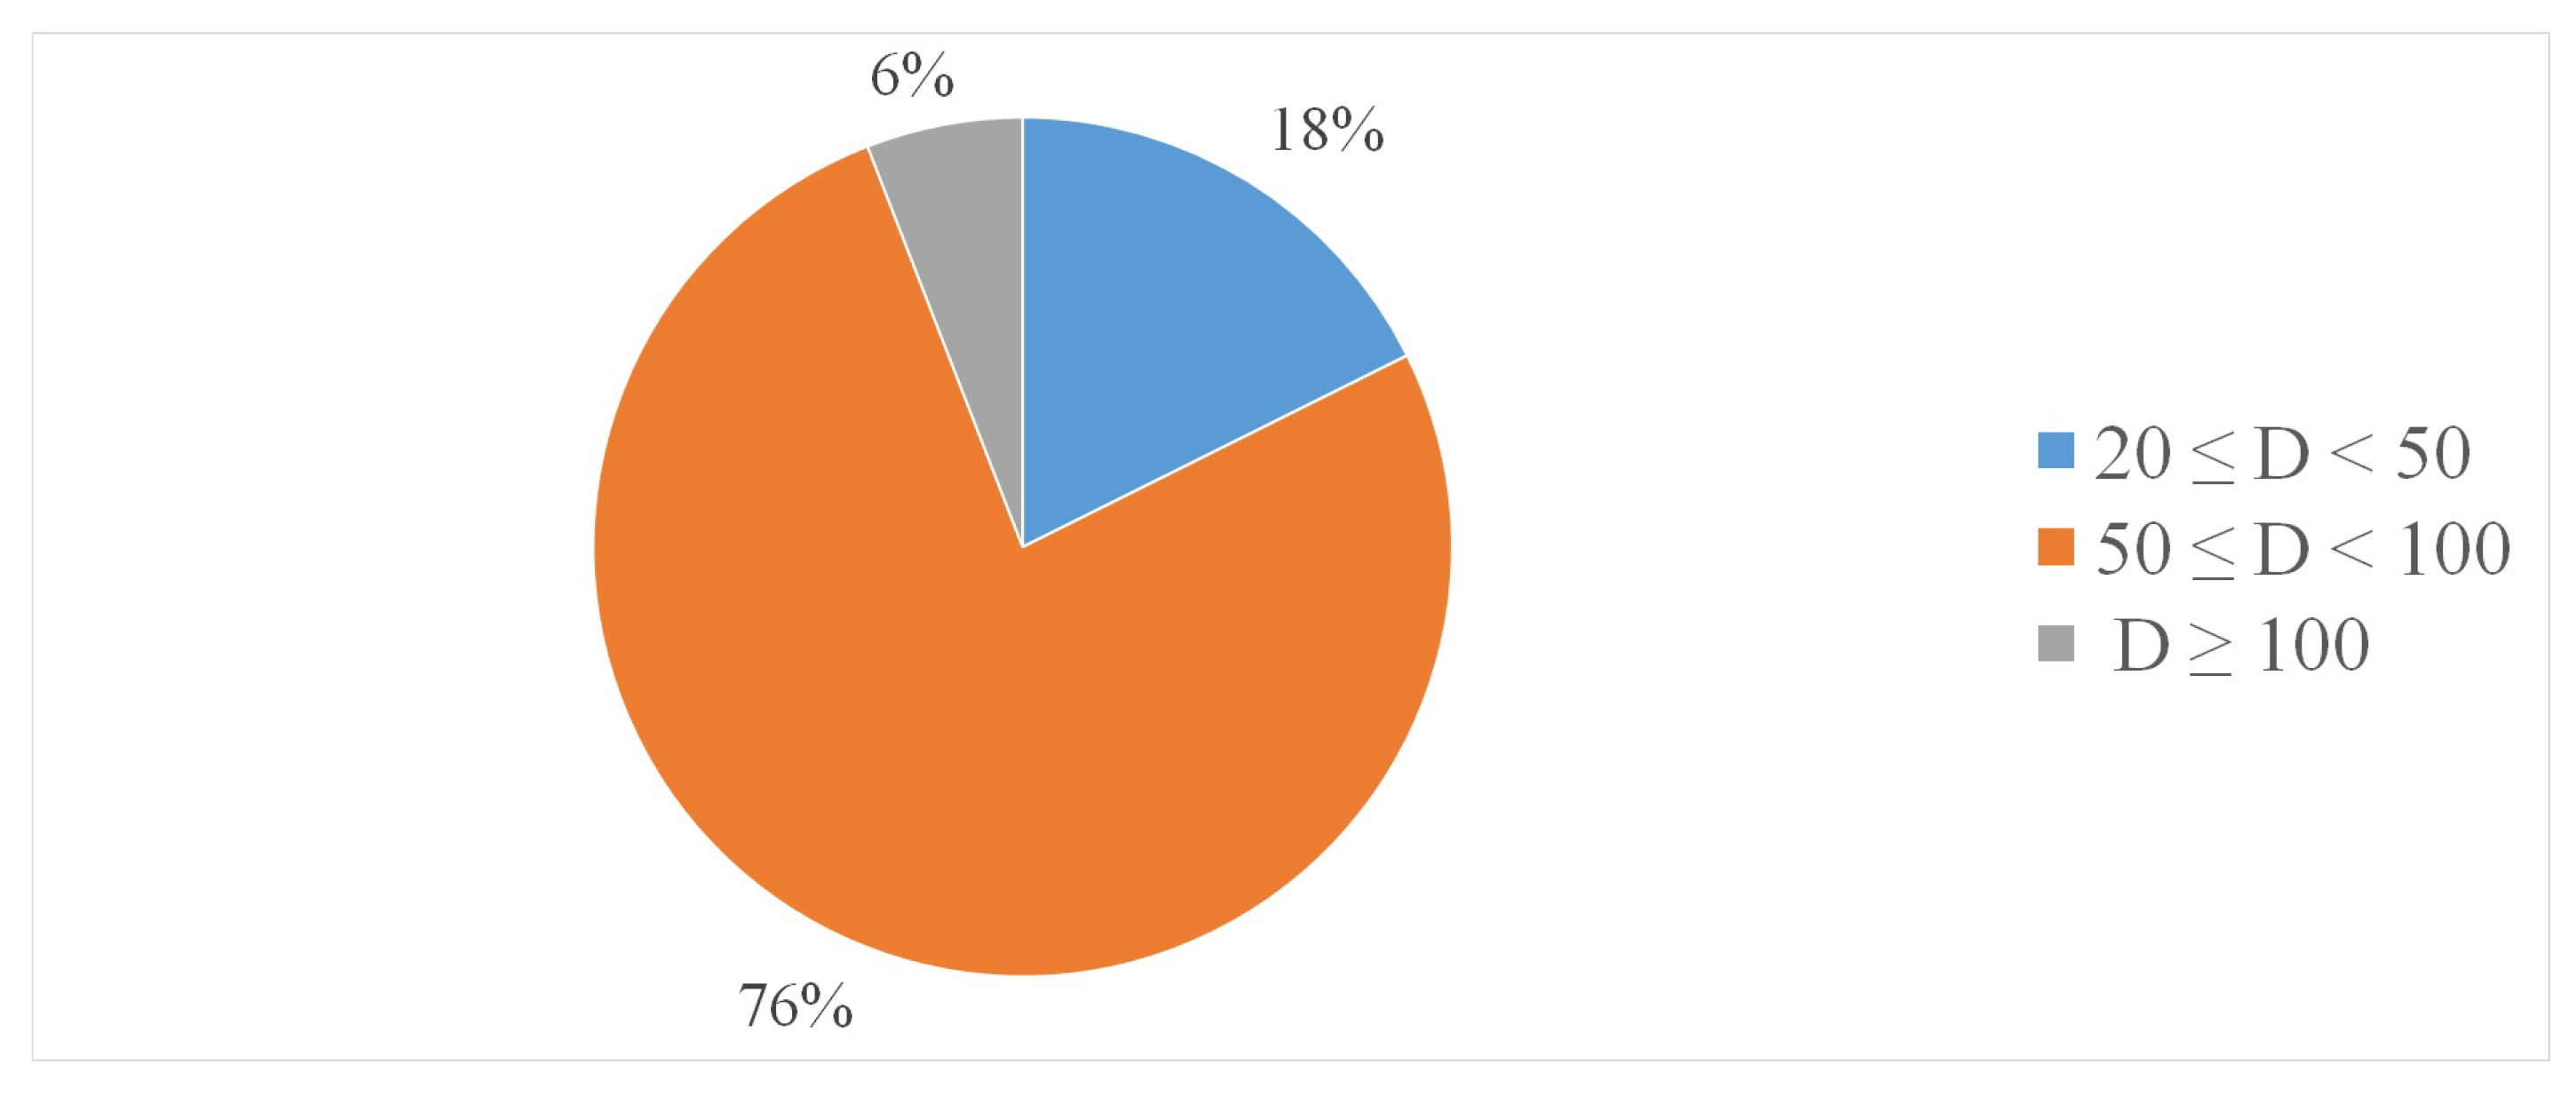
The diameters used in laboratory and field tests have been divided in the following three ranges (Table 3): (i) : 20 mm 50 mm; (ii) : 50 mm 100 mm; and (iii) : D ≥ 100 mm (note that in some cases, the value of the internal diameter is given, whereas in some others, the nominal diameter is provided). Figure 7, where the percentages of such ranges are reported, indicates that most tests (76%) have used the range. As for the pipe material, the lack of tests in large-diameter pipes is due to the fact that very few tests have been executed in real systems. Moreover, the use of a large diameter pipes implies large values of discharge, a feature quite difficult to achieve in laboratories.
3.4. Category #4: Pre-Transient Pressure and Flow Regime
According to the executed tests, four pressure ranges have been considered (Table 3). Most of tests (82%) have been carried out in the range (20 m ≤ 50 m), much less (12%) in the range (h < 20 m), and very few (6%) in the (h ≥ 50 m) one. For eight tests, the pre-transient pressure is not reported (the main reason is that only dimensionless plots are included).
The value of the Reynolds number, = , with = kinematic viscosity, characterizes the pre-transient flow conditions. The available tests have been divided into the following four groups: (i) : = 0; (ii) : 0 2000; (iii) : 2000 8000; and (iv) : 8000. The related percentages, reported in Figure 8, indicate that most tests (50%) have been carried out in turbulent conditions; in tests with , the PPWM has been used. According to [30], where it is shown that the smaller , the more stable the pressure signal, and then the easier the detection of the pressure waves reflected by any fault, it is of interest to execute further tests in laminar conditions. Moreover, to identify the possible mechanisms of interaction with the pressure waves, the characteristics in such conditions of the flow field around a PB—particularly downstream of it—must be investigated by means of appropriate tools (e.g., three dimensional computational fluid dynamics (CFD) models [5,31]).
3.5. Category #5: Inserted Pressure Wave
Within TTBTs it is quite evident that the larger the inserted pressure wave, , the more effective the fault detection. In other words, the larger , the smaller the minimum detectable fault and/or the larger the number of detectable faults for the given pipe system characteristics and measurement section. However, since TTBTs are “on demand” procedures (i.e., whenever a fault is suspected, transient tests are executed), a small should be inserted to avoid fatigue phenomena. As a consequence, the value of is the result of a series of compromises. In line with this consideration (Figure 9), for most the available tests, it is 20 m.
3.6. Category #6: Blockage Simulation
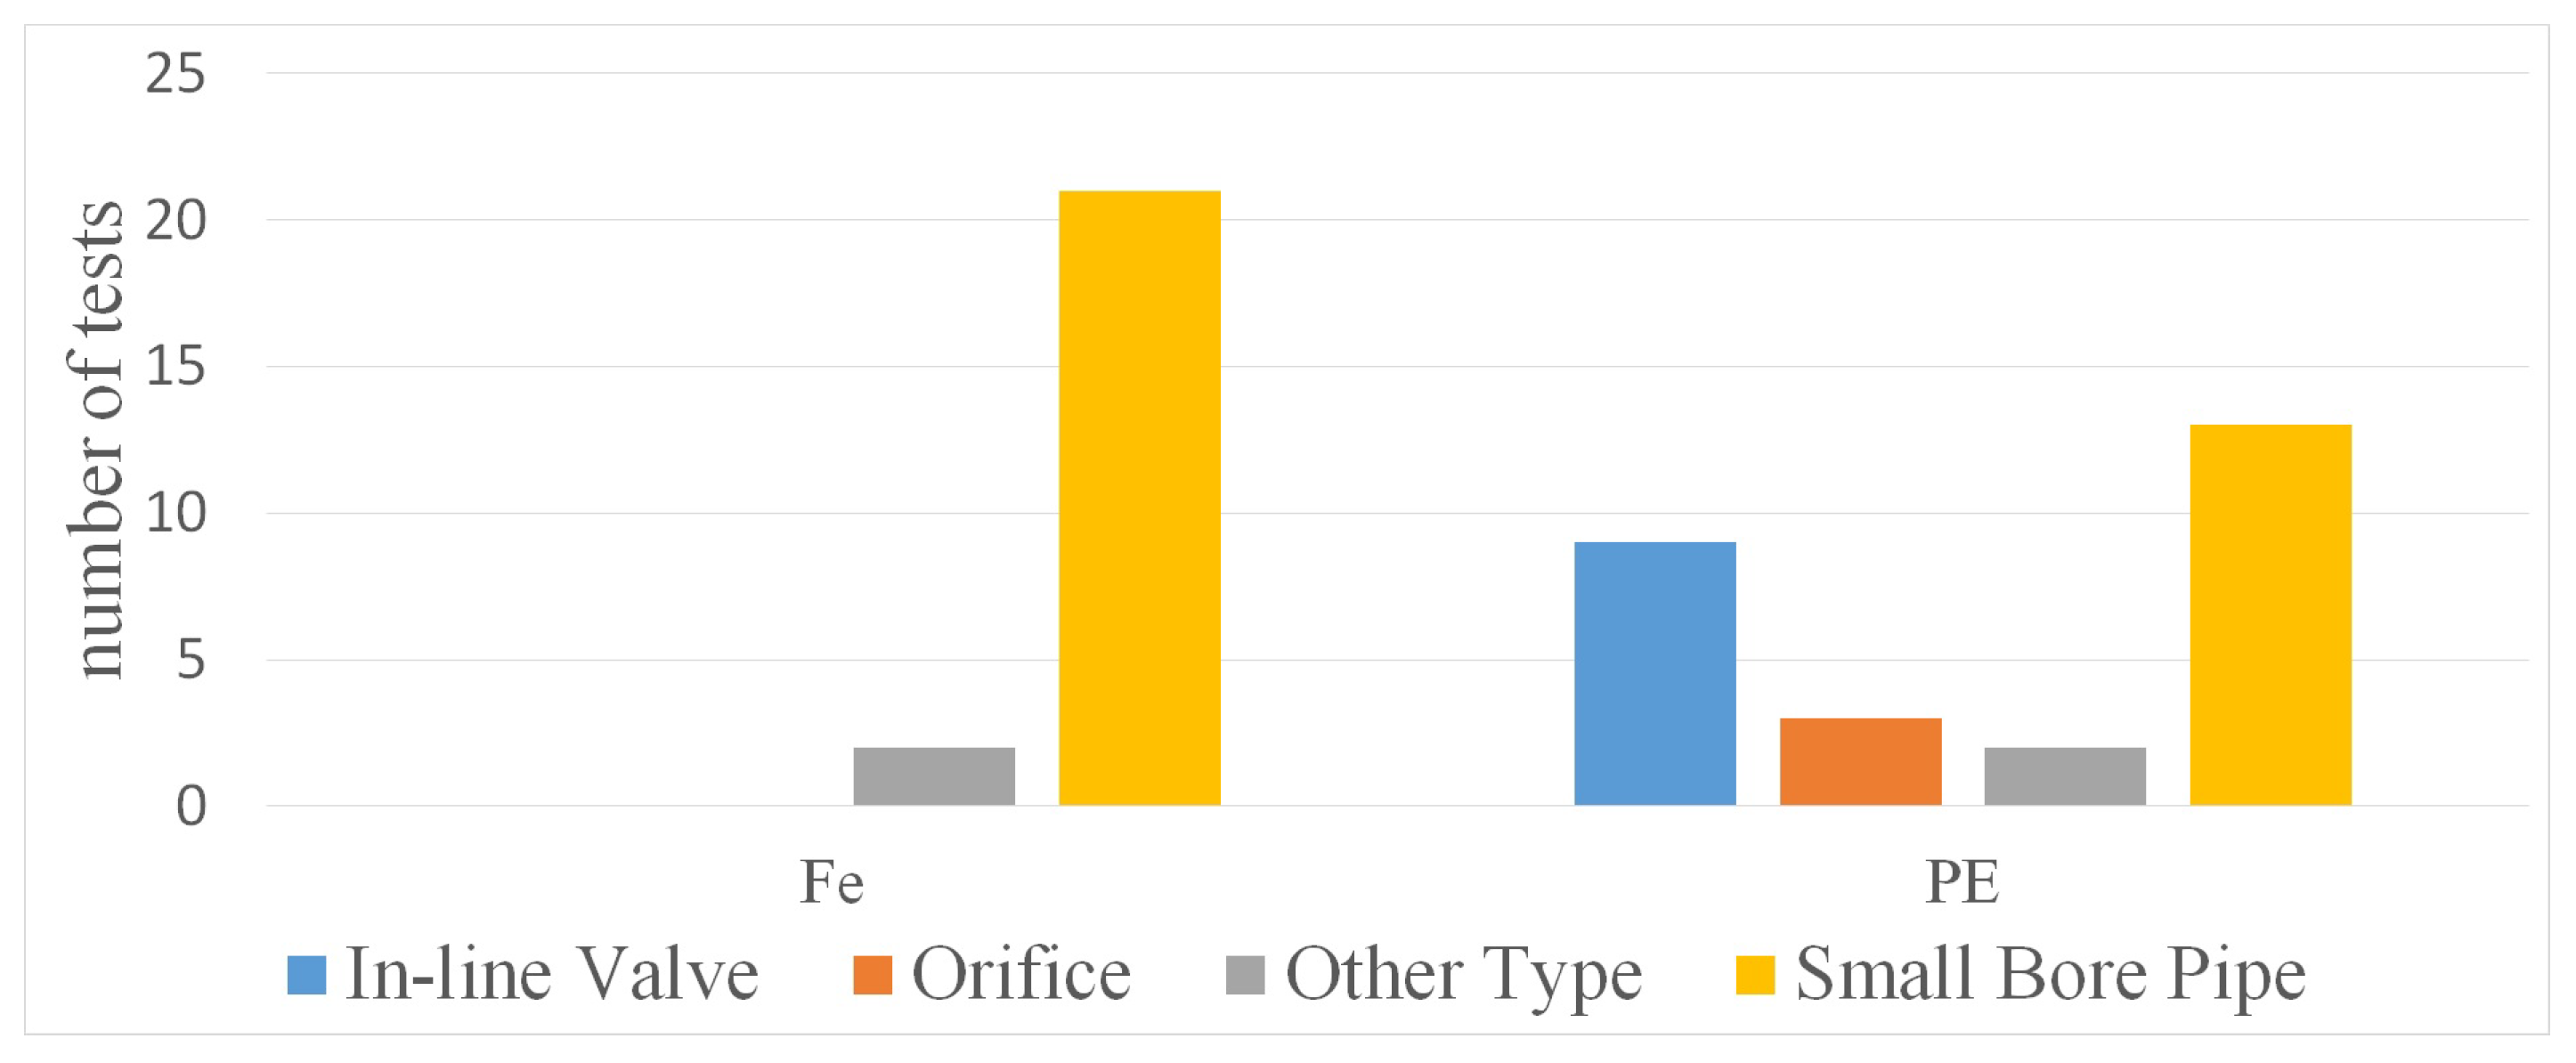
In this section, the characteristics of the devices used in the experiments to simulate PBs are described. In the available experiments (Table 2), four types of devices have been identified (Figure 10): (i) in-line valve, (ii) orifice, (iii) small-bore pipe, and (iv) “other types” (i.e., irregular rock aggregate or rough coconut coir [12]; very short PB and longitudinal-body PB—Figures 3 and 4 in [19], respectively). As shown in Figure 10, the most used device is the small-bore pipe, which captures indeed the characteristics of the real “extended” PBs [32]. Figure 11 shows that most tests have been executed in polyethylene pipes with a PB simulated by a small-bore pipe.
In terms of the PB severity, three parameters have been considered. The first one, B, is given by the ratio between the cross-sectional area of the PB, , and the pipe, A (). For each setup with a small-bore pipe or an orifice, is a constant value, whereas when the PB is simulated by means of an in-line valve, different values of have been considered for a given valve. The analysis of the executed tests indicates that most of them (=65%) has been executed for B = (<25%), i.e., for the most favorable conditions from the experimental point of view (the smaller , the easier the PB detection). This implies that experiments concerned mainly PBs at a late stage (i.e., ≪ A). As a consequence, future experiments should be carried out in pipe systems with large values of B, i.e., with PBs at an early stage. The second and third parameters—appropriate only for “extended” PBs—are defined in terms of the length, , and time interval, ; the latter is a sort of PB characteristic time (). In other words, is the time that the pressure wave takes to travel along the PB and be reflected back. It gives an idea of the frequency of acquisition needed to capture the length, , of the PB. In terms of , most experiments concerned quite “short” PBs (i.e., with of the order of few meters); in terms of : = 0.0003 s or = 0.5141 s; such values can guide future research.
4. Conclusions
In the last few decades, transient test-based techniques (TTBTs) have been established as a viable tool for fault detection, particularly in the poorly accessible pressurized-transmission mains (e.g., [33]). Although TTBTs are based on the well-known properties of the pressure waves generated during transients, to be considered as a practicable procedure, it has been considered necessary that many experiments validate them. Accordingly, papers reviewing and analyzing the available experimental results may help with reassuring pipe system managers about the performance of the TTBTs. This is hopefully the case for leaks in [9], and in this paper for partial blockages (PBs).
The first outcome of the review of the available physical experiments was finding the quite small number of papers focused on the use of the pressure waves for detecting PBs with respect to those concerning leak detection (18 vs. 49). A possible reason is the underestimation of the problem represented by PBs that have no external evidence and make their effect felt in the long run, and more importantly, through indirect manifestations. Precisely, the increase in the energy consumption and decrease in the carrying capacity in the rising mains and gravity systems, respectively, are the results of the progressive growth of PBs. In most cases, when such indirect effects are evident, the PB size and length can be very severe, and may be difficult to counter with simple actions. In other words, it is too late, and the pipe branch in question must be replaced.
The second outcome of this review was finding an extremely small number of tests executed in real systems. This is confirmed by the fact that no experiments have been carried out in large-diameter pipes. As a further consequence, no experiments have been carried out in concrete pipes.
The third outcome concerns the lack of experiments in pipe networks both in the laboratories, and as mentioned above, in real systems. This is a serious shortcoming, since the multiple reflections of the pressure waves and their overlapping in complex pipe systems could highlight possible weak points of the TTBTs.
The fourth outcome was that there has been no test executed in systems with “multiple” faults—e.g., a combination of several PBs and/or leaks—which is very frequent in real systems (the three orifices in series considered in [10] were so close that they behaved as a unique PB).
To conclude, in the writers’ opinion, this paper could encourage researchers to devote themselves to physical experimentation as a necessary action in parallel with the development of numerical methods for PB detection. In addition to the recommendation to present the results in dimensional quantities and with an accurate description of the experimental setup, two issues must be pointed out. The first one is that there is a need to refine reliable devices for generating fast transients that give rise to sharp pressure waves (easier to analyse). The second issue is that the time is ripe to fine-tune guidelines for carrying out transient tests in an optimal way within TTBTs.
Author Contributions
Conceptualization, B.B., F.M., C.C., H.-F.D. and S.M.; methodology, B.B., F.M., C.C., H.-F.D. and S.M.; writing—original draft preparation, B.B. and F.M.; writing—review and editing, B.B., F.M., C.C., H.-F.D. and S.M. All authors have read and agreed to the published version of the manuscript.
Funding
This research was funded by University of Perugia and MUR within the project “Dipartimenti di Eccellenza 2018–2022”.
Data Availability Statement
All data are reported in the cited papers.
Conflicts of Interest
The authors declare no conflict of interest.
Abbreviations
The following abbreviations are used in this manuscript:
| a | pipe pressure wave speed |
| A | pipe cross-section area |
| PB pressure wave speed (for small-bore pipes only) | |
| cross-sectional area of the PB | |
| PB size | |
| D | pipe diameter |
| h | pressure head |
| length of the PB (for small-bore pipes only) | |
| partial blockage | |
| Reynolds number | |
| V | mean flow velocity |
| inserted pressure wave | |
| PB characteristic time (for small-bore pipes only) | |
| local head loss | |
| kinematic viscosity |
References
- Alnaimat, F.; Ziauddin, M. Wax deposition and prediction in petroleum pipelines. J. Pet. Sci. Eng. 2020, 184, 106385. [Google Scholar] [CrossRef]
- Duan, W.; Kirby, R.; Prisutova, J.; Horoshenkov, K.V. On the use of power reflection ratio and phase change to determine the geometry of a blockage in a pipe. Appl. Acoust. 2015, 87, 190–197. [Google Scholar] [CrossRef] [Green Version]
- Lile, N.L.T.; Jaafar, M.H.M.; Roslan, M.R.; Azmi, M.S.M. Blockage detection in circular pipe using vibration analysis. Int. J. Adv. Sci. Eng. Inf. Technol. 2012, 2, 54–57. [Google Scholar] [CrossRef] [Green Version]
- Papadopoulou, K.A.; Shamout, M.N.; Lennox, B.; Mackay, D.; Taylor, A.R.; Turner, J.T.; Wang, X. An evaluation of acoustic reflectometry for leakage and blockage detection. Proc. Inst. Mech. Eng. Part C J. Mech. Eng. Sci. 2008, 222, 959–966. [Google Scholar] [CrossRef]
- Yang, L.; Fu, H.; Liang, H.; Wang, Y.; Han, G.; Ling, K. Detection of pipeline blockage using lab experiment and computational fluid dynamic simulation. J. Pet. Sci. Eng. 2019, 183, 106421. [Google Scholar] [CrossRef]
- Meniconi, S.; Brunone, B.; Ferrante, M. In-line pipe device checking by short-period analysis of transient tests. J. Hydraul. Eng. 2011, 137, 713–722. [Google Scholar] [CrossRef]
- Duan, H.F.; Lee, P.J.; Ghidaoui, M.S.; Tuck, J. Transient wave-blockage interaction and extended blockage detection in elastic water pipelines. J. Fluids Struct. 2014, 46, 2–16. [Google Scholar] [CrossRef] [Green Version]
- Louati, M.; Meniconi, S.; Ghidaoui, M.S.; Brunone, B. Experimental study of the eigenfrequency shift mechanism in a blocked pipe system. J. Hydraul. Eng. 2017, 143, 04017044. [Google Scholar] [CrossRef] [Green Version]
- Brunone, B.; Maietta, F.; Capponi, C.; Keramat, A.; Meniconi, S. A review of physical experiments for leak detection in water pipes through transient tests for addressing future research. J. Hydraul. Res. 2022, 60, 894–906. [Google Scholar] [CrossRef]
- Contractor, D.N. The reflection of waterhammer pressure waves from minor losses. J. Basic Eng. 1965, 87, 445–451. [Google Scholar] [CrossRef]
- Duan, H.F.; Lee, P.J.; Kashima, A.; Lu, J.; Ghidaoui, M.S.; Tung, Y.K. Extended blockage detection in pipes using the system frequency response: Analytical analysis and experimental verification. J. Hydraul. Eng. 2013, 139, 763–771. [Google Scholar] [CrossRef]
- Duan, H.; Lee, P.; Che, T.; Ghidaoui, M.; Karney, B.; Kolyshkin, A. The influence of non-uniform blockages on transient wave behavior and blockage detection in pressurized water pipelines. J. Hydro-Environ. Res. 2017, 17, 1–7. [Google Scholar] [CrossRef]
- Lee, P.J.; Duan, H.F.; Tuck, J.; Ghidaoui, M. Numerical and experimental study on the effect of signal bandwidth on pipe assessment using fluid transients. J. Hydraul. Eng. 2015, 141, 04014074. [Google Scholar] [CrossRef]
- Massari, C.; Yeh, T.C.; Ferrante, M.; Brunone, B.; Meniconi, S. A stochastic approach for extended partial blockage detection in viscoelastic pipelines: Numerical and laboratory experiments. J. Water Supply Res. Technol. 2015, 64, 583–595. [Google Scholar] [CrossRef]
- Meniconi, S.; Brunone, B.; Ferrante, M.; Massari, C. Potential of transient tests to diagnose real supply pipe systems: What can be done with a single extemporary test. J. Water Resour. Plan. Manag. 2011, 137, 238–241. [Google Scholar] [CrossRef]
- Meniconi, S.; Brunone, B.; Ferrante, M.; Massari, C. Small amplitude sharp pressure waves to diagnose pipe systems. Water Resour. Manag. 2011, 25, 79–96. [Google Scholar] [CrossRef]
- Meniconi, S.; Brunone, B.; Ferrante, M. Water-hammer pressure waves interaction at cross-section changes in series in viscoelastic pipes. J. Fluids Struct. 2012, 33, 44–58. [Google Scholar] [CrossRef]
- Meniconi, S.; Duan, H.F.; Lee, P.J.; Brunone, B.; Ghidaoui, M.S.; Ferrante, M. Experimental investigation of coupled frequency and time-domain transient test–based techniques for partial blockage detection in pipelines. J. Hydraul. Eng. 2013, 139, 1033–1040. [Google Scholar] [CrossRef]
- Meniconi, S.; Brunone, B.; Ferrante, M.; Capponi, C. Mechanism of interaction of pressure waves at a discrete partial blockage. J. Fluids Struct. 2016, 62, 33–45. [Google Scholar] [CrossRef]
- Sattar, A.M.; Chaudhry, M.H.; Kassem, A.A. Partial blockage detection in pipelines by frequency response method. J. Hydraul. Eng. 2008, 134, 76–89. [Google Scholar] [CrossRef]
- Sun, J.; Wang, R.; Duan, H.F. Multiple-fault detection in water pipelines using transient-based time-frequency analysis. J. Hydroinform. 2016, 18, 975–989. [Google Scholar] [CrossRef] [Green Version]
- Tuck, J.; Lee, P. Inverse transient analysis for classification of wall thickness variations in pipelines. Sensors 2013, 13, 17057–17066. [Google Scholar] [CrossRef] [Green Version]
- Tuck, J.; Lee, P.J.; Davidson, M.; Ghidaoui, M.S. Analysis of transient signals in simple pipeline systems with an extended blockage. J. Hydraul. Res. 2013, 51, 623–633. [Google Scholar] [CrossRef]
- Wang, X.J.; Lambert, M.F.; Simpson, A.R. Detection and location of a partial blockage in a pipeline using damping of fluid transients. J. Water Resour. Plan. Manag. 2005, 131, 244–249. [Google Scholar] [CrossRef]
- Zouari, F.; Louati, M.; Meniconi, S.; Blåsten, E.; Ghidaoui, M.S.; Brunone, B. Experimental verification of the accuracy and robustness of area reconstruction method for pressurized water pipe system. J. Hydraul. Eng. 2020, 146, 04020004. [Google Scholar] [CrossRef]
- Wylie, E.B.; Streeter, V.L. Fluid Transients in Systems; Prentice Hall: Englewood Cliffs, NJ, USA, 1993. [Google Scholar]
- Swaffield, J.A.; Boldy, A.P. Pressure Surge in Pipe and Duct Systems; Ashgate Pub.: Farnham, UK, 1993. [Google Scholar]
- Pezzinga, G.; Brunone, B.; Cannizzaro, D.; Ferrante, M.; Meniconi, S.; Berni, A. Two-dimensional features of viscoelastic models of pipe transients. J. Hydraul. Eng. 2014, 140, 0401403. [Google Scholar] [CrossRef]
- Ayed, L.; Hafsi, Z.; Elaoud, S.; Meniconi, S.; Brunone, B. A transient based analysis of a leak in a junction of a series pipes system: Mathematical development and numerical modelling. J. Pipeline Syst. Eng. Pract. 2023. forthcoming. [Google Scholar] [CrossRef]
- Brunone, B.; Capponi, C.; Meniconi, S. Design criteria and performance analysis of a smart portable device for leak detection in water transmission mains. Measurement 2021, 183, 109844. [Google Scholar] [CrossRef]
- Martins, N.M.C.; Covas, D.I.C.; Meniconi, S.; Capponi, C.; Brunone, B. Characterization of low-Reynolds number flow through an orifice: CFD results vs. laboratory data. J. Hydroinform. 2021, 23, 709–723. [Google Scholar] [CrossRef]
- Brunone, B.; Ferrante, M.; Meniconi, S. Discussion of “Detection of partial blockage in single pipelines” by P. K. Mohapatra, M. H. Chaudhry, A. A. Kassem, and J. Moloo. J. Hydraul. Eng. 2008, 134, 872–874. [Google Scholar] [CrossRef]
- Meniconi, S.; Maietta, F.; Alvisi, S.; Capponi, C.; Marsili, V.; Franchini, M.; Brunone, B. Consumption change-induced transients in a water distribution network: Laboratory tests in a looped system. Water Resour. Res. 2022, 58, e2021WR031343. [Google Scholar] [CrossRef]
Figure 1.
Number of papers per year on physical experiments for partial blockage (PB) detection involving transient tests.
Figure 1.
Number of papers per year on physical experiments for partial blockage (PB) detection involving transient tests.
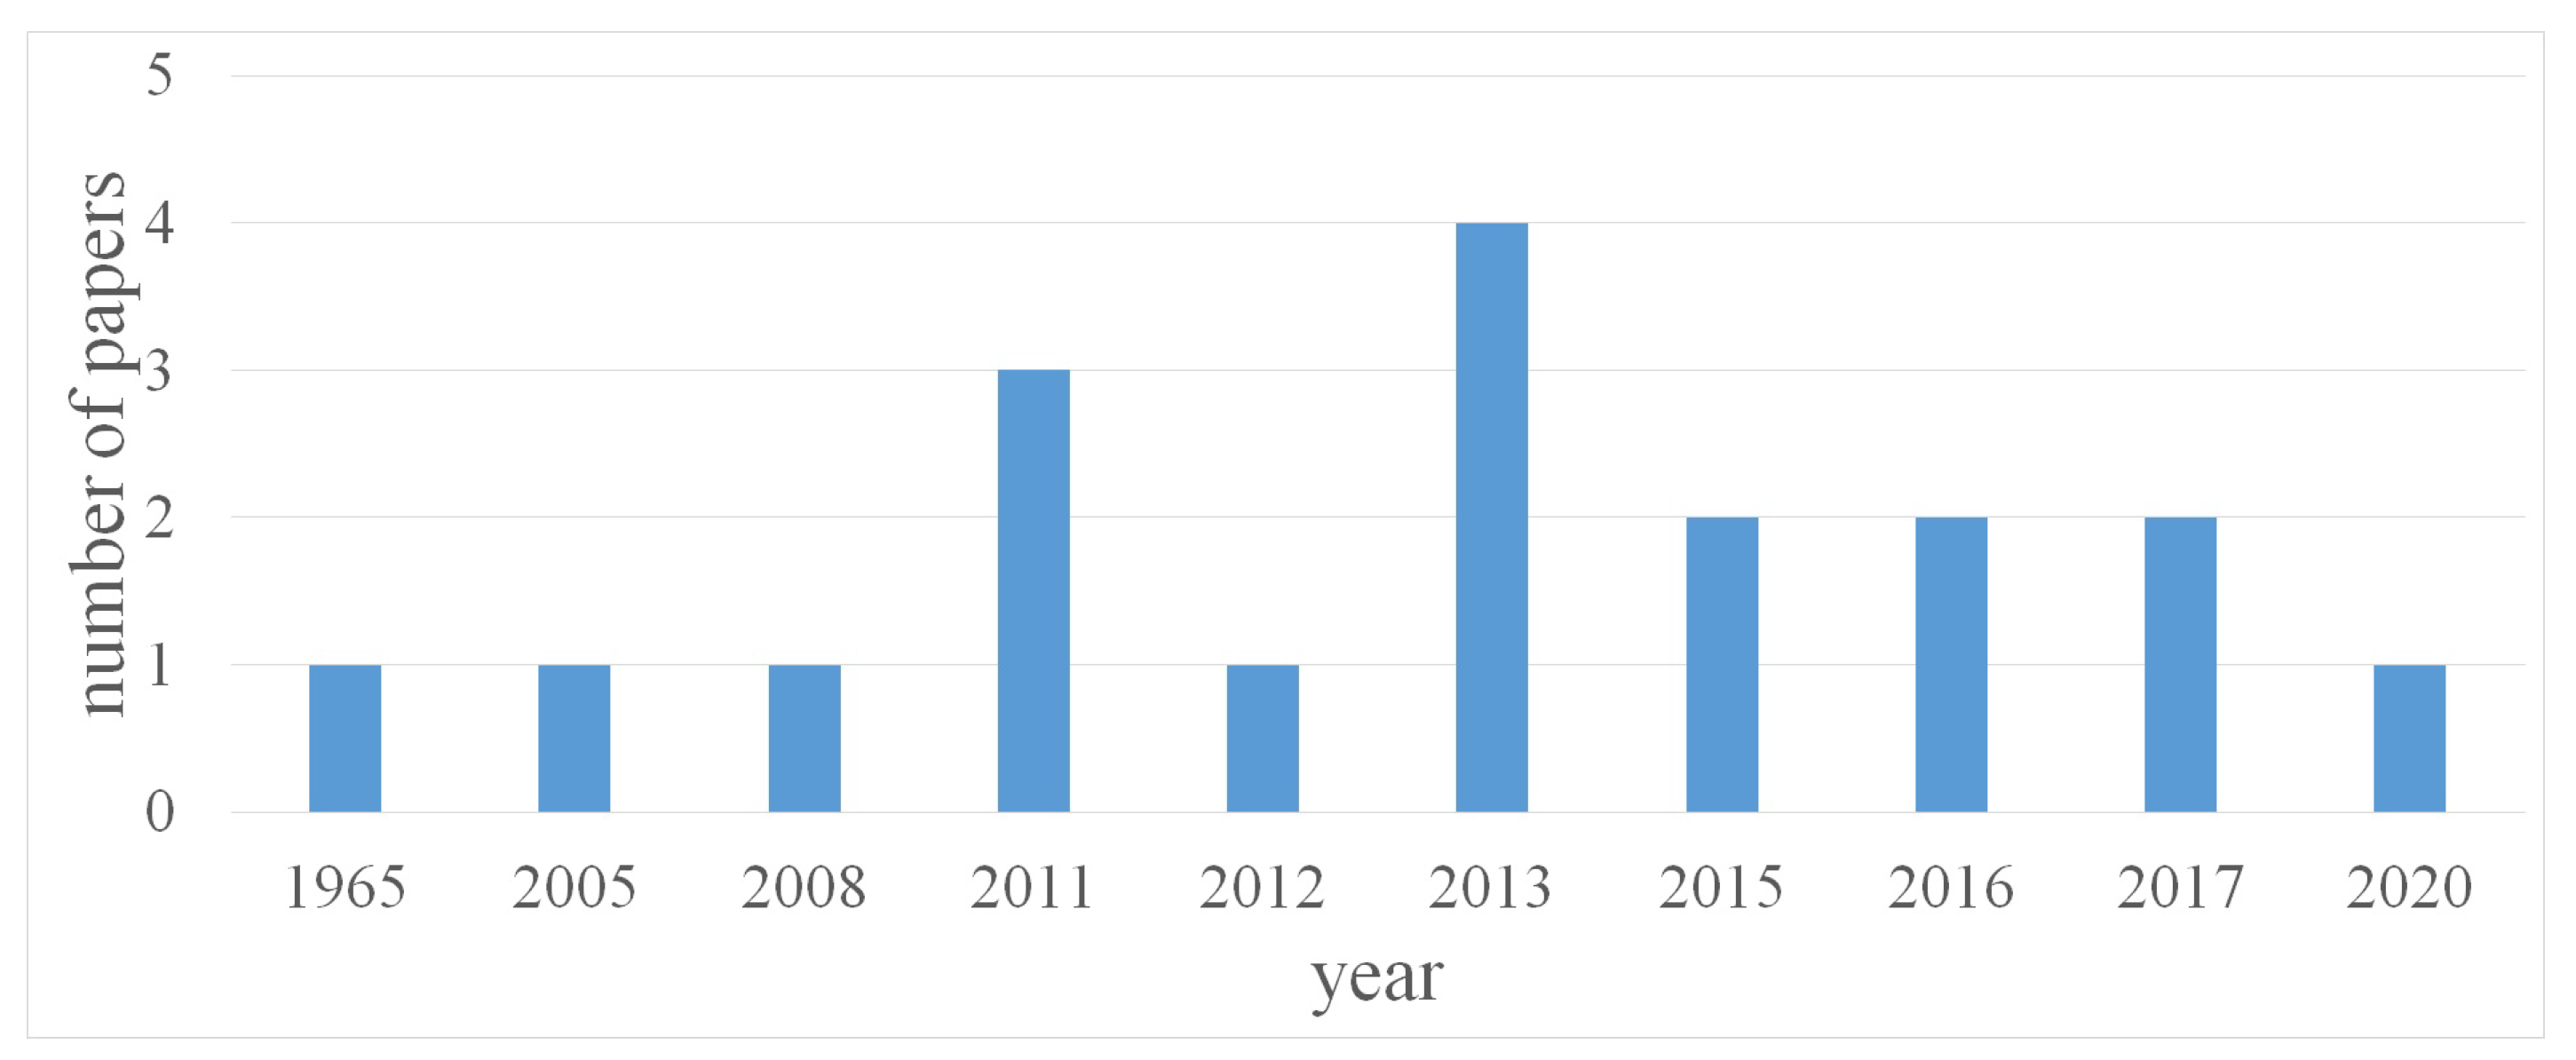
Figure 2.
Sketch of discrete partial blockage: in-line orifice.
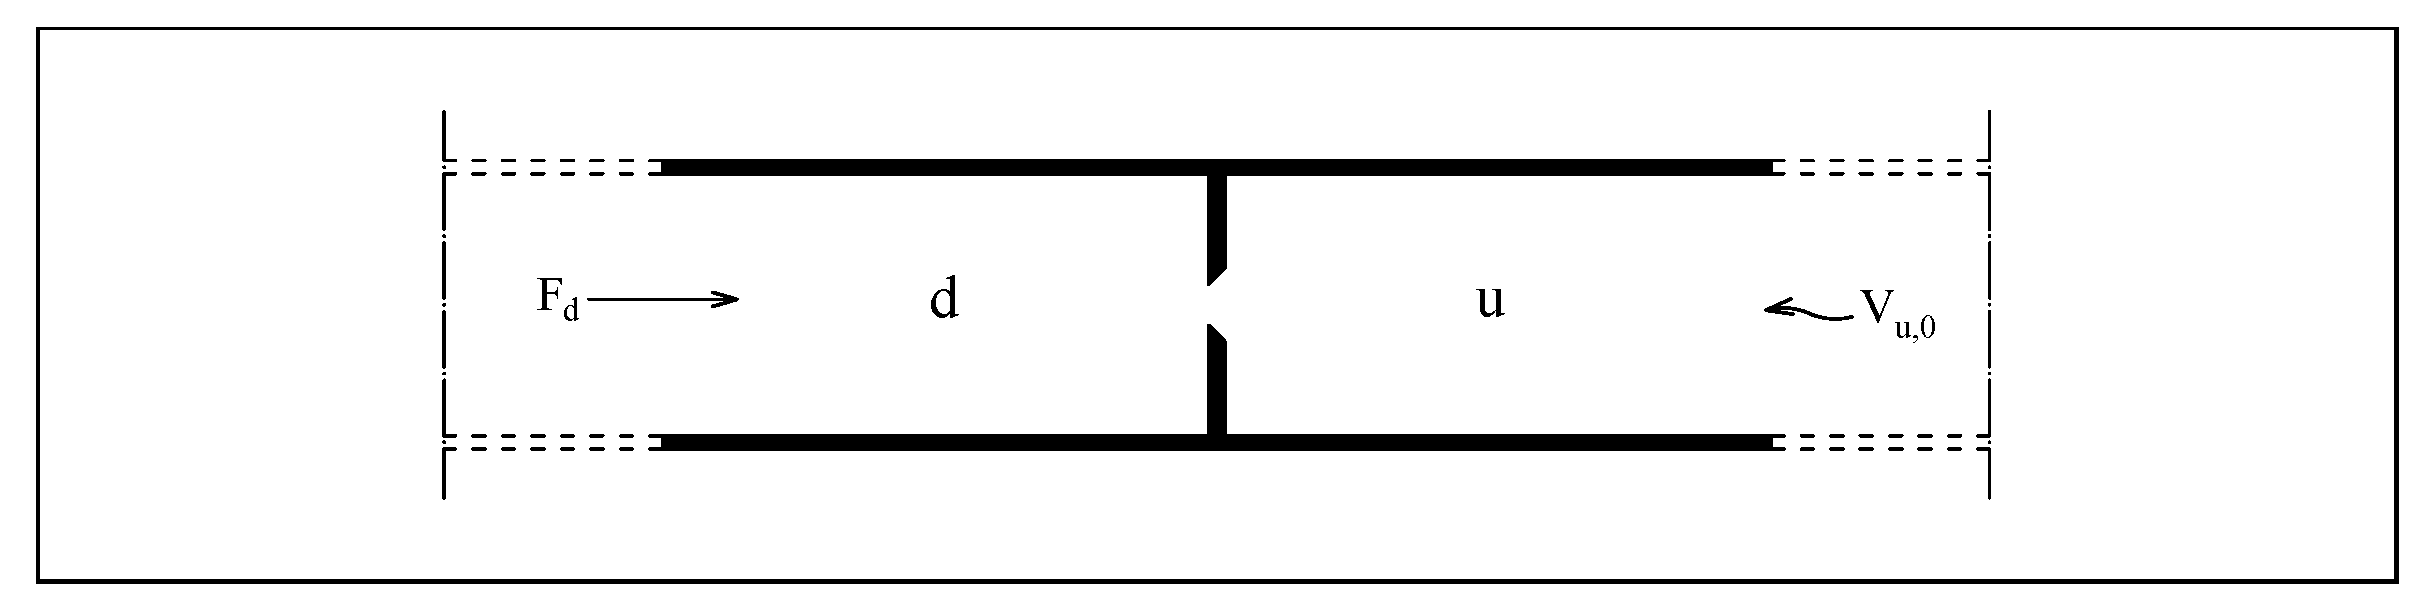
Figure 3.
Sketch of extended partial blockage: (a) small-bore pipe (SBP), as an ideal sum of (b) diameter reduction (shrinkage) and (c) diameter increase (expansion).
Figure 3.
Sketch of extended partial blockage: (a) small-bore pipe (SBP), as an ideal sum of (b) diameter reduction (shrinkage) and (c) diameter increase (expansion).
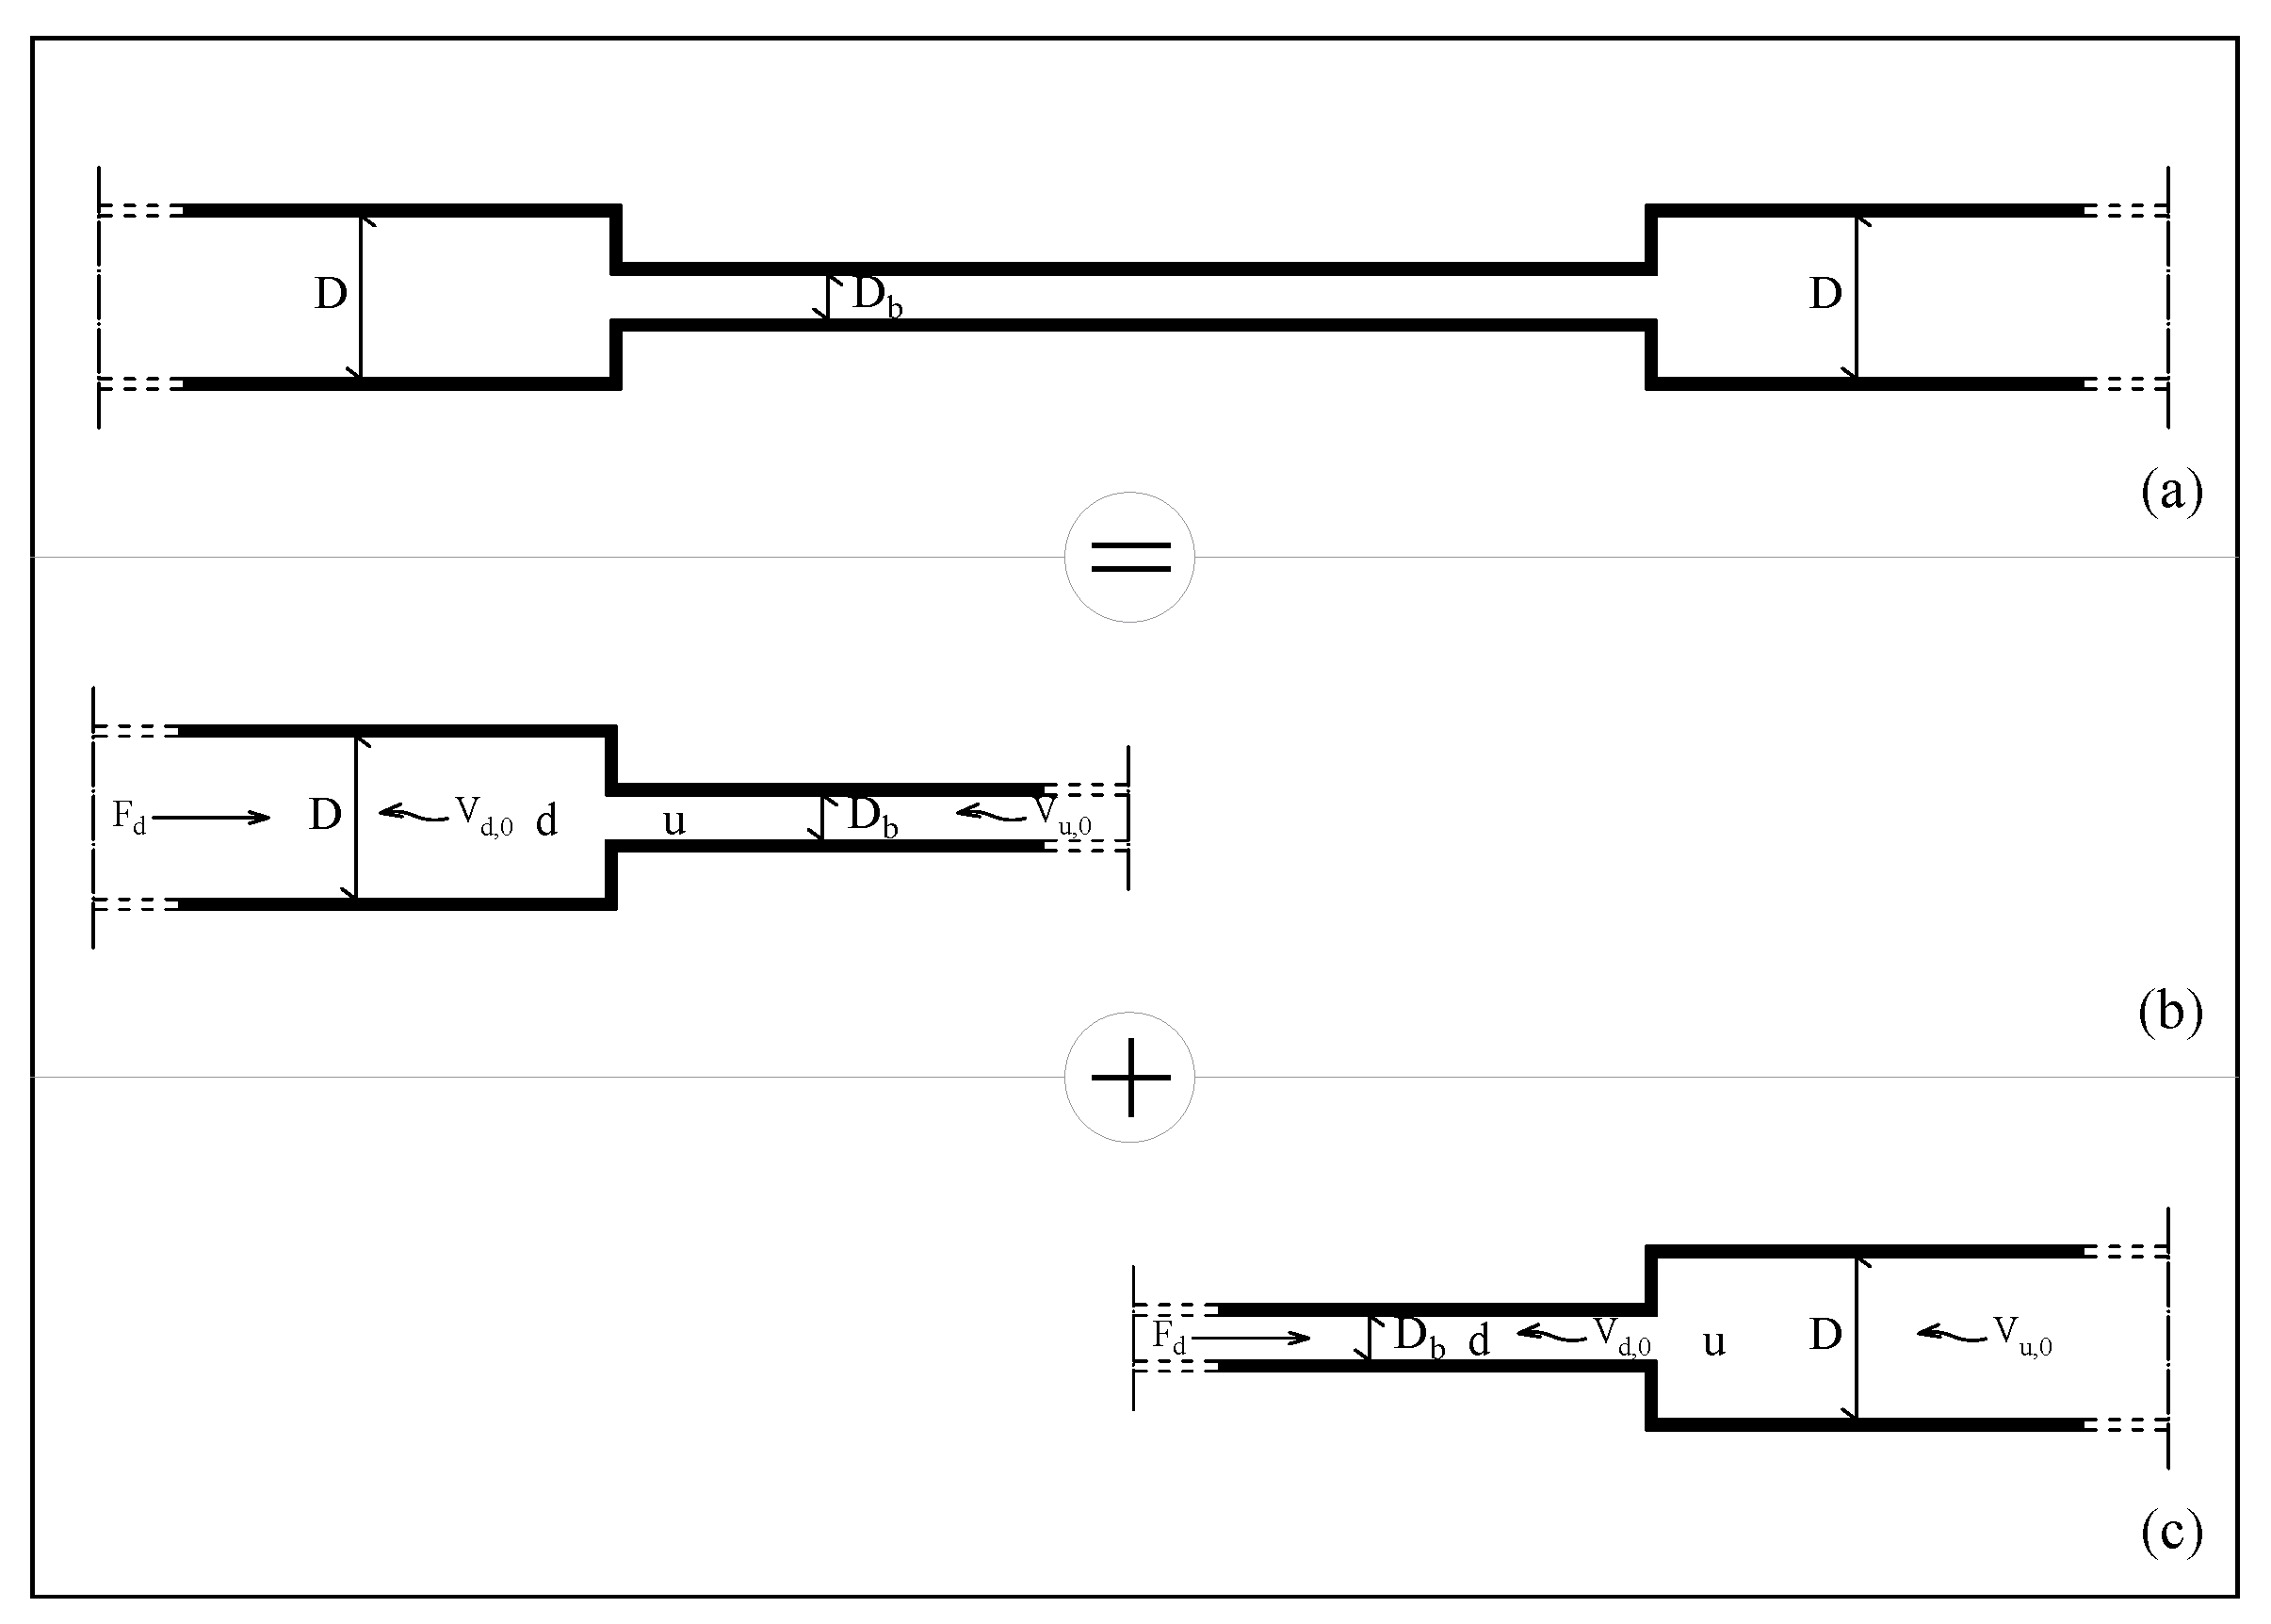
Figure 4.
Partially closed in-line valve simulating a discrete partial blockage: (a) sketch of the experimental setup at the Water Engineering Laboratory (WEL) of the University of Perugia, Italy (MV = maneuver valve, M = measurement section, PB = (discrete) partial blockage, R = reservoir), and (b) pressure signal during the transient generated by the complete closure of MV (modified from [19]).

Figure 5.
Small-bore pipe simulating an extended partial blockage: (a) sketch of the experimental setup at the Water Engineering Laboratory (WEL) of the University of Perugia, Italy (MV = maneuver valve, M = measurement section, = (extended) partial blockage, R = reservoir), (b) pressure signal during the transient generated by the complete closure of MV (modified from [17]).

Figure 6.
Category #2: pipe material. Percentage of the papers in terms of pipe material: steel/cast iron (Fe), polyethylene (PE), and copper (Cu).
Figure 6.
Category #2: pipe material. Percentage of the papers in terms of pipe material: steel/cast iron (Fe), polyethylene (PE), and copper (Cu).

Figure 7.
Category #3: pipe diameter. Percentages of the papers for the three diameter ranges.

Figure 8.
Category #4: pre-transient Reynolds number, . Percentages of the papers for the four ranges.
Figure 8.
Category #4: pre-transient Reynolds number, . Percentages of the papers for the four ranges.
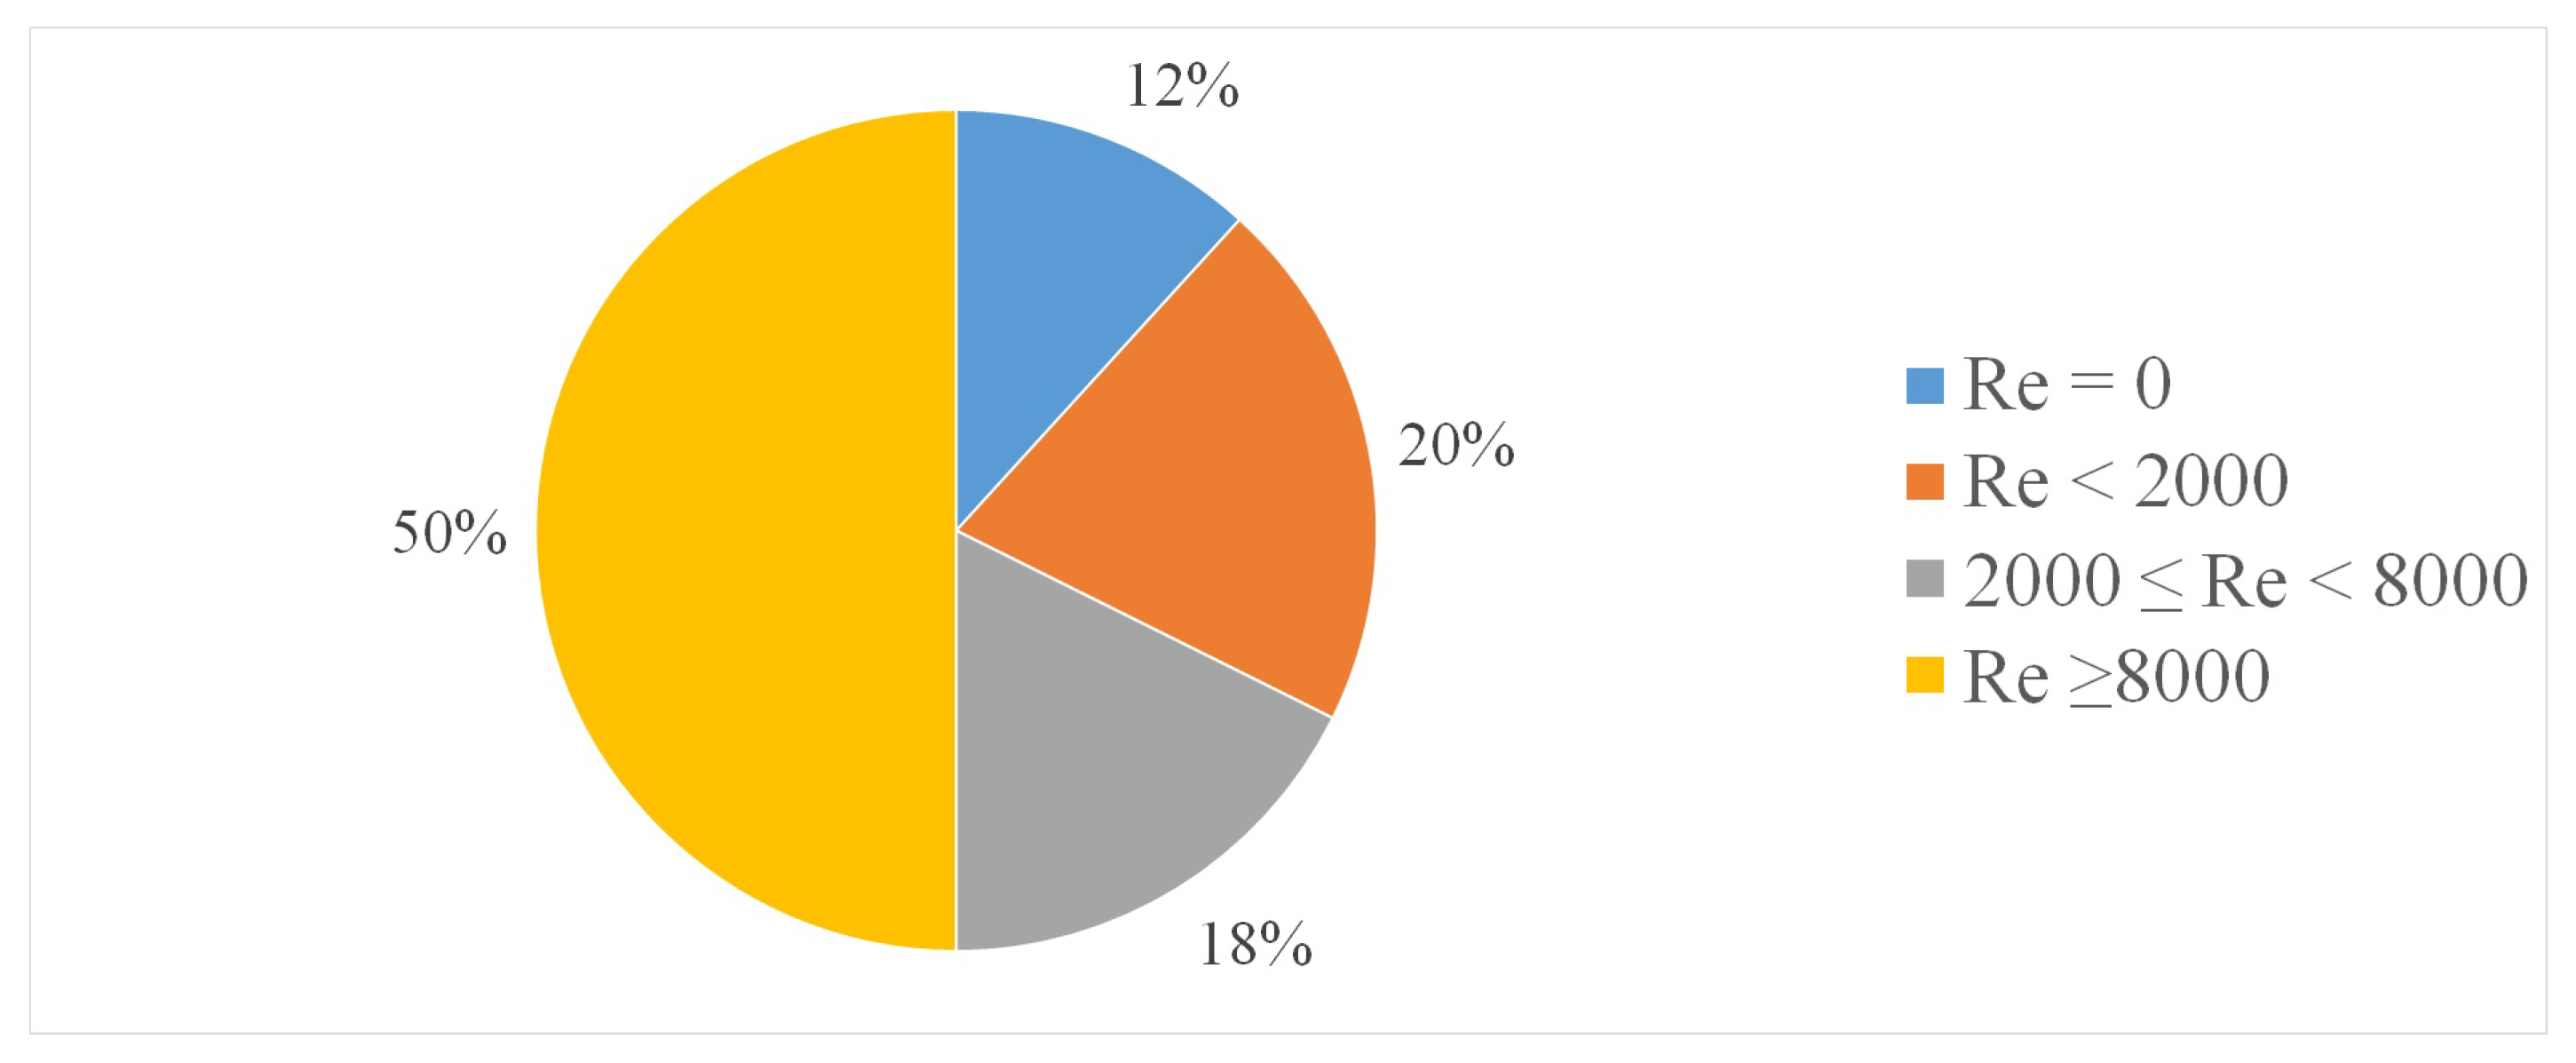
Figure 9.
Category #5: inserted pressure wave, . Percentages of the papers for the five ranges.

Figure 10.
Category #6: types of devices used for simulating PBs.
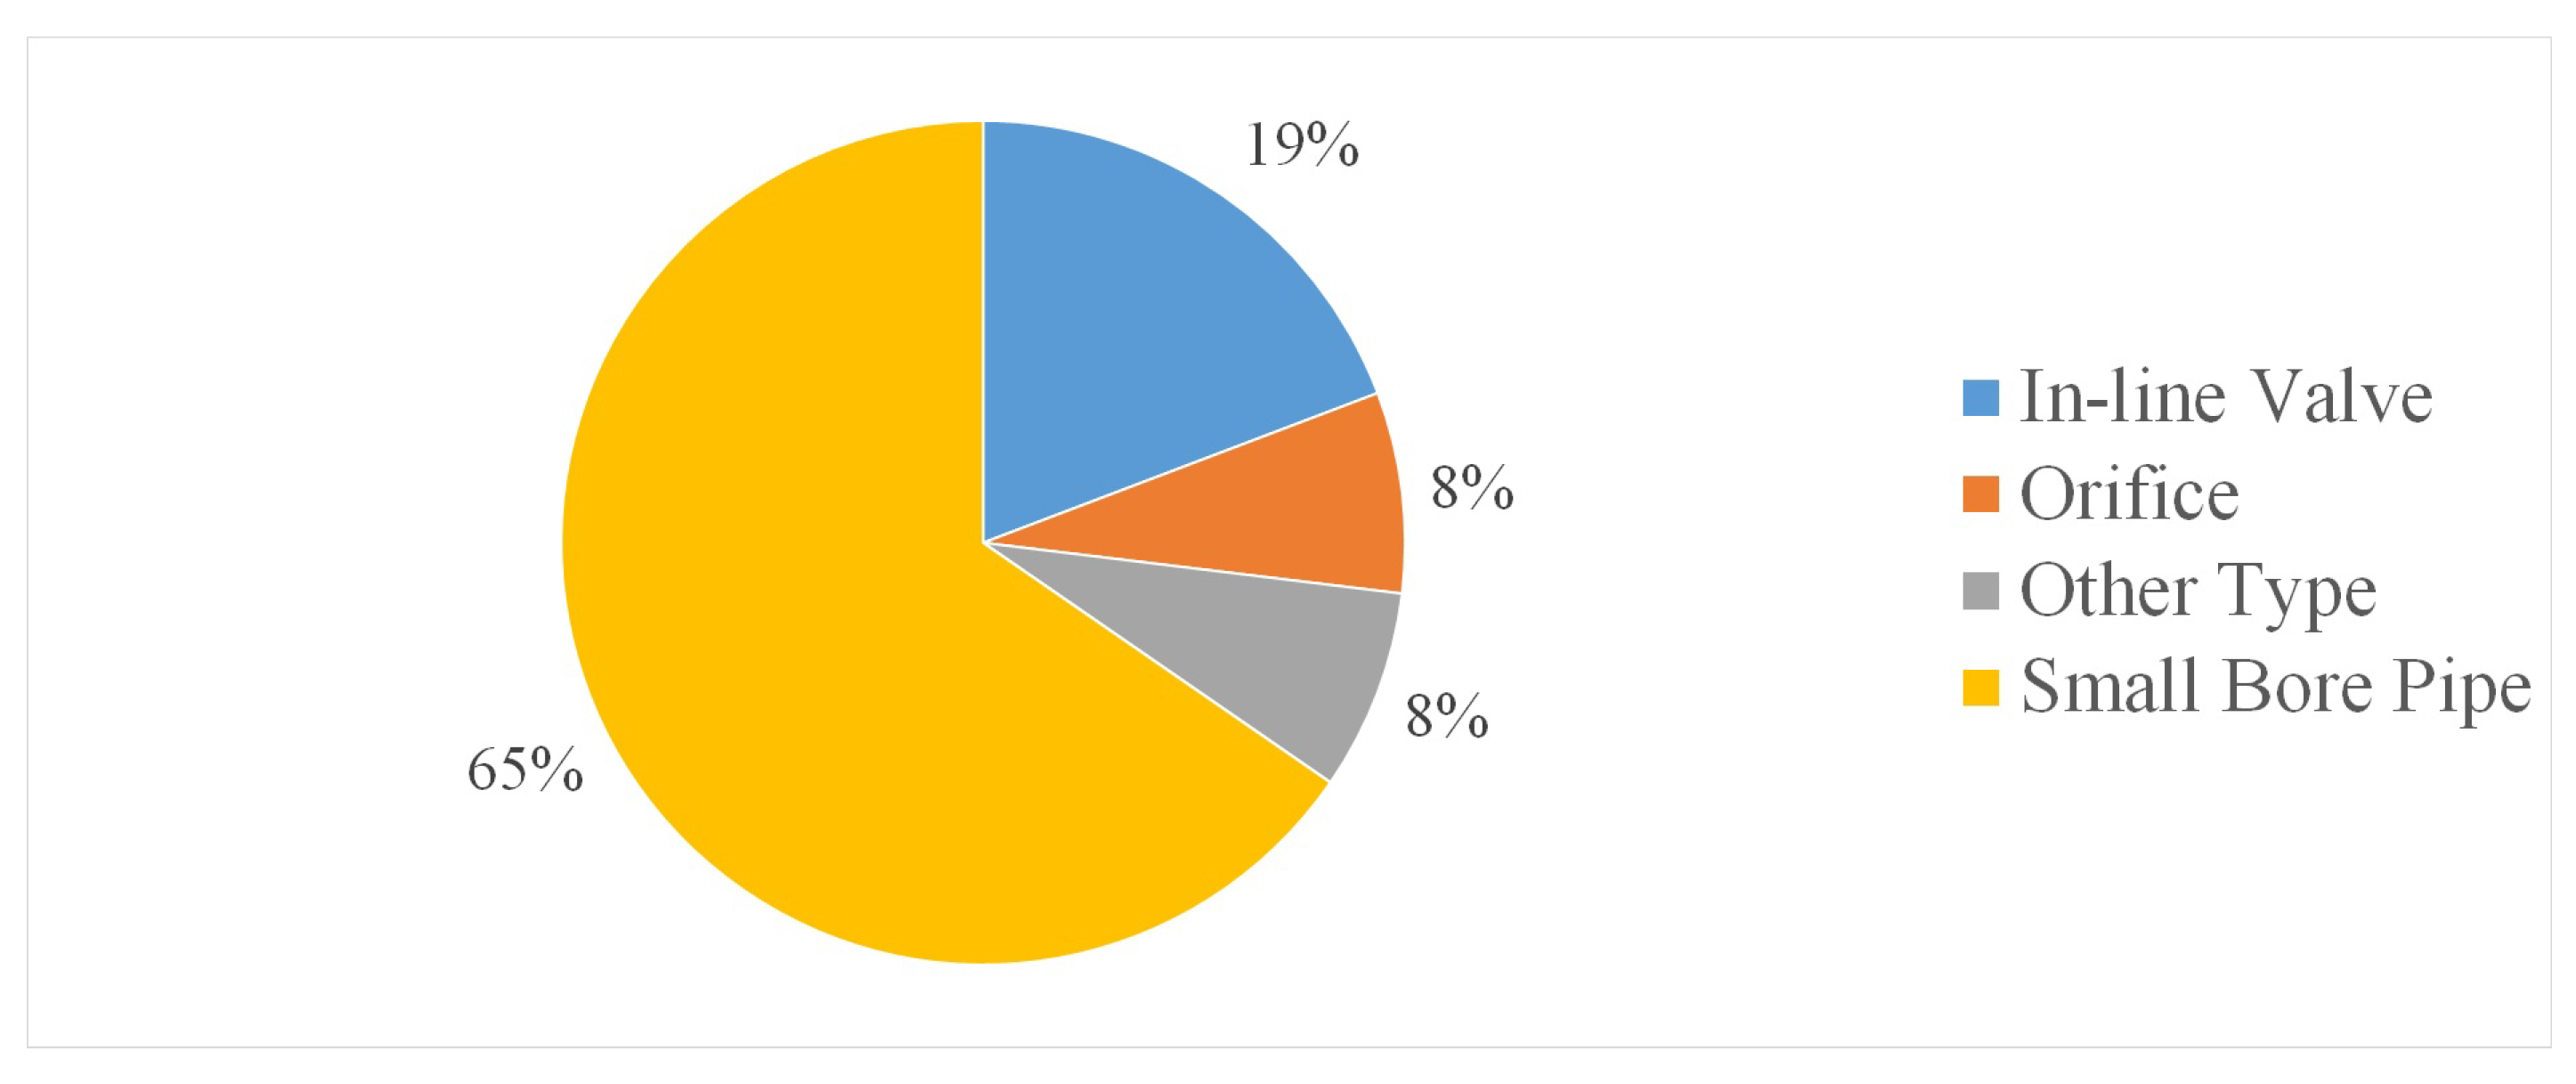
Figure 11.
Pipe material and PB type.

Table 1.
Categories identified for the analysis of the physical experimental tests.
| Category (#) | Title |
|---|---|
| 1 | complexity of the test system and modality of transient generation |
| 2 | pipe material |
| 3 | pipe diameter |
| 4 | pre-transient pressure and flow regime |
| 5 | inserted pressure wave |
| 6 | partial blockage simulation |
Table 2.
Selected papers with the main characteristics of the executed physical experimental tests.
| Paper Number | TLM | Mat. | D | h | Re | h | Type | Size | ||
|---|---|---|---|---|---|---|---|---|---|---|
| [10] | L, SP, VC | - | - | , | , | , | O | - | - | - |
| [11] | L, SP, VC | Fe | - | , | - | SBP | from 6.06 to 12.07 | - | ||
| [12] | L, SP, VC | Fe | - | , | - | SBP | 5.59 | 0.0085 | ||
| L, SP, VC | Fe | - | , | - | OT | 5.54, 5.59 | 0.0106, 0.0110 | |||
| [13] | L, SP, VC | Fe | - | - | SBP | 12.248 | 0.0181 | |||
| [8] | L, SP, PPWM | PE | SBP | 3.6, 24 | 0.0185, 0.1234 | |||||
| [14] | L, SP, VC | PE | SBP | 3.56 | 0.0180 | |||||
| [6] | L, SP, VC | PE | , | IV | - | - | ||||
| L, SP, VC | PE | O | - | - | ||||||
| [15] | F, BS, VC | Fe | IV | - | - | - | ||||
| [16] | L, SP, PPWM | PE | SBP | 7.06 | 0.036 | |||||
| L, SP, PPWM | PE | IV | - | - | - | |||||
| [17] | L, SP, VC | PE | SBP | from 0.06 to 100 | from 0.0003 to 0.5141 | |||||
| [18] | L, SP, VC | Fe | - | SBP | from 6.06 to 12.07 | from 0.088 to 0.0176 | ||||
| [19] | L, SP, VC | PE | , | IV | - | - | ||||
| L, SP, VC | PE | , | SBP | 0.48 | 0.0025 | |||||
| L, SP, VC | PE | , | OT | 0.12, 0.48 | 0.0006, 0.0025 | |||||
| [20] | L, SP, OM | Cu | - | - | - | - | - | |||
| [21] | L, SP, VC | Fe | , | SBP | 5 | - | ||||
| [22] | L, SP, VC | Fe | SBP | 10.407 | 0.0158 | |||||
| [23] | L, SP, VC | Fe | - | , | - | SBP | , | from 2.866 to 12.068 | from 0.0045 to 0.0176 | |
| [24] | L, SP, VC | - | - | - | IV | - | - | - | ||
| [25] | L, SP, PPWM | PE | , | SBP | , | 24 | 0.1206, 0.1234 | |||
| L, SP, VC | PE | SBP | , | 24 | 0.1206, 0.1234 |
Table 3.
Meanings of the abbreviations used in Table 2.
Table 3.
Meanings of the abbreviations used in Table 2.
| Category #1: complexity of layout and modality of transient generation (CLM) | |
|---|---|
| Complexity of the functioning conditions | Symbol |
| Laboratory tests | L |
| Field tests | F |
| Complexity of the test system | Symbol |
| Single pipes | |
| Branched systems | |
| Modality of transient generation | Symbol |
| Valve closure | |
| Portable Pressure Wave Maker or Other Maneuver | |
| Category #2: material (Mat.) | |
| Type | Symbol |
| Steel-Cast iron | |
| Copper | |
| Polyethylene | |
| Category #3: pipe diameter (D) | |
| Symbol | Range [mm] |
| 20 ≤ D < 50 | |
| 50 ≤ D < 100 | |
| D≥ 100 | |
| Category #4: pre-transient pressure (h) and flow regime (Reynolds number, ) | |
| Symbol | Range [m] |
| h < 20 | |
| 20 ≤ h < 50 | |
| h ≥ 50 | |
| = 0 | |
| < 2000 | |
| 2000 ≤ < 8000 | |
| ≥ 8000 | |
| Category #5: inserted pressure wave () | |
| Symbol | Range [m] |
| 5 | |
| 5 ≤ 10 | |
| 10 ≤ 20 | |
| 20 ≤ 50 | |
| 50 | |
| Category #6: partial blockage simulation | |
| Partial blockage type | |
| Type | Symbol |
| In-line Valve | |
| Orifice | O |
| Other type | |
| Small Bore Pipe | |
| Partial blockage size | |
| Symbol | Range [%] |
| B < 25 | |
| 25 ≤ B < 50 | |
| 50 ≤ B < 75 | |
| B ≥ 75 | |
| Partial blockage extension (only for SBP and OT) | |
| Length, [m] | |
| Characteristic time, [s] | |
Disclaimer/Publisher’s Note: The statements, opinions and data contained in all publications are solely those of the individual author(s) and contributor(s) and not of MDPI and/or the editor(s). MDPI and/or the editor(s) disclaim responsibility for any injury to people or property resulting from any ideas, methods, instructions or products referred to in the content. |
© 2023 by the authors. Licensee MDPI, Basel, Switzerland. This article is an open access article distributed under the terms and conditions of the Creative Commons Attribution (CC BY) license (https://creativecommons.org/licenses/by/4.0/).
Share and Cite
MDPI and ACS Style
Brunone, B.; Maietta, F.; Capponi, C.; Duan, H.-F.; Meniconi, S. Detection of Partial Blockages in Pressurized Pipes by Transient Tests: A Review of the Physical Experiments. Fluids 2023, 8, 19. https://doi.org/10.3390/fluids8010019
AMA Style
Brunone B, Maietta F, Capponi C, Duan H-F, Meniconi S. Detection of Partial Blockages in Pressurized Pipes by Transient Tests: A Review of the Physical Experiments. Fluids. 2023; 8(1):19. https://doi.org/10.3390/fluids8010019
Chicago/Turabian StyleBrunone, Bruno, Filomena Maietta, Caterina Capponi, Huan-Feng Duan, and Silvia Meniconi. 2023. "Detection of Partial Blockages in Pressurized Pipes by Transient Tests: A Review of the Physical Experiments" Fluids 8, no. 1: 19. https://doi.org/10.3390/fluids8010019