Article

Enhancement of an Air-Cooled Battery Thermal Management System Using Liquid Cooling with CuO and Al2O3 Nanofluids under Steady-State and Transient Conditions

1
Faculty of Mechanical Engineering, Semnan University, Semnan 35131-19111, Iran
2
School of Mechanical Engineering, University of Leeds, Leeds LS2 9JT, UK
3
School of Science, Engineering, and Environment (SEE), University of Salford, Manchester M5 4WT, UK
4
School of Engineering, Damghan University, Damghan 36716-45667, Iran
5
Department of Mechanical Engineering, The Hong Kong Polytechnic University, Kowloon, Hong Kong SAR, China
*
Author to whom correspondence should be addressed.
Fluids 2023, 8(10), 261; https://doi.org/10.3390/fluids8100261
Submission received: 11 August 2023 / Revised: 16 September 2023 / Accepted: 22 September 2023 / Published: 25 September 2023

Abstract

:
Lithium-ion batteries are a crucial part of transportation electrification. Various battery thermal management systems (BTMS) are employed in electric vehicles for safe and optimum battery operation. With the advancement in power demand and battery technology, there is an increasing interest in enhancing BTMS’ performance. Liquid cooling is gaining a lot of attention recently due to its higher heat capacity compared to air. In this study, an air-cooled BTMS is replaced by a liquid cooled with nanoparticles, and the impacts of different nanoparticles and flow chrematistics are modeled. Furthermore, a unique approach that involves transient analysis is employed. The effects of nanofluid in enhancing the thermal performance of lithium-ion batteries are assessed for two types of nanoparticles (CuO and Al2O3) at four different volume concentrations (0.5%, 2%, 3%, and 5%) and three fluid velocities (0.05, 0.075, and 0.1 m/s). To simulate fluid flow behavior and analyze the temperature distribution within the battery pack, a conventional k-ε turbulence model is used. The results indicate that the cooling efficiency of the system can be enhanced by introducing a 5% volume concentration of nanofluids at a lower fluid velocity as compared to pure liquid. Al2O3 and CuO reduce the temperature by 7.89% and 4.73% for the 5% volume concentration, respectively. From transient analysis, it is also found that for 600 s of operation at the highest power, the cell temperature is within the safe range for the selected vehicle with nanofluid cooling. The findings from this study are expected to contribute to improving BTMS by quantifying the benefits of using nanofluids for battery cooling under both steady-state and transient conditions.

1. Introduction

Climate change is a complex challenge with different contributing factors, one of which is emissions from transportation [1,2]. High energy demand and dependency on fossil fuels have made transportation a primary source of CO2 and other greenhouse gas emissions [3,4]. The transportation sector currently represents 24% of the world’s total energy consumption, and it is projected to surge to 50% by 2035. Currently, transportation stands as the world’s second most significant contributor to CO2 emissions, with 94% of its energy consumption coming from fossil fuels [3,5]. Addressing the negative environmental impact of transportation is thus crucial for tackling climate change.
Electric and hybrid vehicles are expected to play an important role in decarbonization of the transport system. In electric vehicles (EVs), high-voltage batteries are the sole energy source, and they are critical in ensuring vehicle efficiency and functionality. Among different types of battery technology, lithium-ion batteries are currently the main option for EV applications. Despite various advantages of lithium-ion batteries, their functionality is restricted by the battery operating temperature and voltage [6]. The ideal operational temperature range for lithium-ion batteries falls within 20 to 40 °C [6]. Operation at lower or higher temperatures can negatively impact the battery performance and/or the battery lifetime. To manage the battery cell temperatures within this acceptable range, efficient and reliable battery thermal management systems (BTMS) are required [7,8,9,10]. In electric vehicles (EVs), thermal management must be meticulously designed to manage the dissipation of heat in diverse operating conditions and maintain an optimal temperature range within the battery pack [11,12,13]. Providing a homogenous temperature distribution is also an important factor, and the temperature difference between battery cells should not exceed 5 °C. A major difference in the temperature of the cells could potentially lead to electrical imbalance [8]. As such, an efficient BTMS should manage the heat transfer while being cost-effective and compatible with the vehicle’s size and mass [14].
Heat transfer and fluid flow principles need to be carefully considered in battery thermal management [15,16,17]. Two different BTMS are available: direct and indirect, which are categorized based on whether the cooling fluid encounters the battery surface or not [18]. On the other hand, the cooling systems can be classified into either active or passive depending on the use of any external system for cooling down the batteries [19]. The latter has low cooling efficiency and low temperature control, making it only suitable for low power demands. The utilization of air cooling is a prevalent and cost-effective cooling method in both vehicle and electronic industries. Its widespread implementation is attributed to its simplicity and affordability [20,21]. Nevertheless, utilization of air cooling may result in reduced heat dissipation from the batteries due to the comparatively lower heat transfer coefficient of the gas in contrast to liquid. Different simulation and experimental studies are available for air cooling. For example, Fan et al. [22] analyzed an air-cooling system for a 32-cell module of a lithium-ion capacitor. Their thermal management system was tested within a modular hardware casing, with outcomes indicating the BTMS cooling effectiveness was subject to flow behavior, fan positioning, hollow spaces, and airflow velocities.
With the advancement in battery technology and power demand for EVs, the interest in liquid cooling is increasing, and several automotive companies are adopting active liquid cooling systems [23]. Liquid cooling is a promising thermal management strategy for mitigating excessive heat in lithium-ion capacitors with low flow requirements. Though this approach requires additional components such as liquid coolant, a heat exchanger, piping, and a pump, it can often be configured compactly. However, liquid cooling systems may be heavier than their air-based counterparts. Some liquid coolants, such as oils and liquid metals, may also be more viscous and require higher power for recirculation. Furthermore, the implementation of liquid coolants in the vicinity of high-voltage components within lithium-ion capacitors may pose challenges, such as the necessity for protected insulation between the coolant and live connectors to avert potential damage during operation or wreck scenarios. Constant leakage sensing is also necessary during production, operation, and maintenance. When designing a liquid cooling system, it is crucial to consider several factors, including maintenance costs, reliability, and life cycle assessment [24,25,26].
The application of nanofluids can notably enhance the thermal efficiency of liquid cooling systems. However, enhancement of coolant thermal conductivity by nanoparticles may result in an accompanying rise in the required pumping power [27,28]. The nanofluid consists of a base fluid with different nanoparticles (such as metallic, oxides, metals, and carbon nanotubes) to enhance heat absorption [29]. Adding the nanoparticles into the fluid results in substantial improvements to both the thermal conductivity and diffusivity of the cooling medium [26,30,31]. Nanoparticles can further reduce the temperature compared to the base coolant, which is suitable for automotive applications [32,33,34,35]. The effect of adding Al2O3 into the base fluid was analyzed by Huo et al. [36]. Based on their findings, using a 4% volume concentration of nanofluid can achieve a temperature reduction of up to 7% in the cells. With an increase in battery applications and thermal runaway concerns, battery arrangement, cooling system design, and thermal management will become increasingly crucial, encouraging the manufacturers to redesign their systems [37]. Nanofluids can be a promising option for substantially improving the cooling performance of thermal management systems for batteries, but further studies are required to fully comprehend their performance compared to air and pure liquid cooled systems [38,39]. Furthermore, as the operation of the vehicle (and thus the discharge rate) is often unsteady, time-dependent thermal management is an essential issue for battery thermal management. Most of the available literature has been concentrated on steady-state applications, and there are limited studies with transient analysis [9,40]. The main existing transient studies were on forced-air cooling, [41], a hybrid cooling with PCM and forced-air cooling [42,43,44], and natural and forced-air cooling comparison [45], but the nanofluid in transient conditions has not been studied.
This research entails the redesign of an air-cooled thermal management system for batteries, utilizing two distinct nanofluids. A three-dimensional simulation model is employed to analyze the heat transfer properties of the proposed system under different concentrations and flow velocities. Furthermore, the research is complemented by dynamic analysis of the battery’s thermal behavior during a limited time based on the required mechanical power output and corresponding current. Also, pumping power was considered, and the proposed nanofluids are employed at low velocities to minimize the required power.

2. Model and Methodology

The simulation medium chosen for this study was the force convection heat transfer of nanofluids inside a battery pack, which is comprised of 32 commercial cylindrical lithium-ion batteries and is subject to a constant heat flux. Figure 1 illustrates the geometry and boundary conditions utilized in this research. Initially, this configuration was experimentally tested by Fan et al. [22] for an air-cooled system. Our model was validated against the experimental data collected in this study. The validation process is discussed in Section 3 of this paper. Then, the cooling air was replaced by the proposed liquid fluids for the purpose of this study.
This study examines the cooling performance and temperature variations for Al2O3 and CuO nanofluids, with varying volume concentrations at two distinct discharge rates. First, the battery cooling thermal performance was studied for a steady-state condition at a 2C discharge rate with a constant battery volumetric heat and different inlet velocities based on Table 1. According to the specifications of the battery cell in Table 2, the 2C discharge rate is assumed to be a moderate operation mode for a typical EV. At this discharge rate, the heat flux of the battery cell is 48,000 watts per cubic meter without cooling. Therefore, nanofluid is used to dissipate this heat and reduce the battery temperature until it reaches the safe range of below 40 °C. Also, the optimum nanofluid volume concentrations were found in moderate conditions (2C). Then, to evaluate the optimum nanofluid performance in a transient condition, the battery pack was analyzed for the high power withdraw in the transient condition, which is described in Section 2.3. The boundary conditions and nanofluid properties employed in the simulation are also presented in Table 1 and Table 2. In addition, it should be mentioned that in the chosen modeling approach, the nanofluid within the channel exhibits Newtonian behavior, being incompressible, and it is characterized by laminar flow dynamics. Throughout our analysis, the assumption was that the nanoparticles maintained thermal equilibrium with the surrounding base fluid. The thermophysical attributes of both pure water and the nanoparticles, recorded at a temperature of 25 °C, have been meticulously presented in Table 3. It is noteworthy that the thermophysical properties of the nanofluid were assumed to remain reasonably constant, apart from variations in density, which were effectively handled through the implementation of the Boussinesq model. To assess the effective viscosity and effective thermal conductivity, the Brinkman and Maxwell–Garnett models were employed, respectively.
Computational fluid dynamics [48,49,50] was employed for developing this work, and continuity, momentum, and energy equations were solved numerically. To obtain precise solutions and high-quality results, a second-order upwind discretization method was employed. The coupling of pressure and velocity fields was accomplished through the SIMPLEC method, known for its superior performance with Newtonian and incompressible flow. Additionally, all analyses were carried out using the Green–Gauss node-based method. The convergence criteria were satisfied once the residual values of all equations were less than 10 × 10−6.

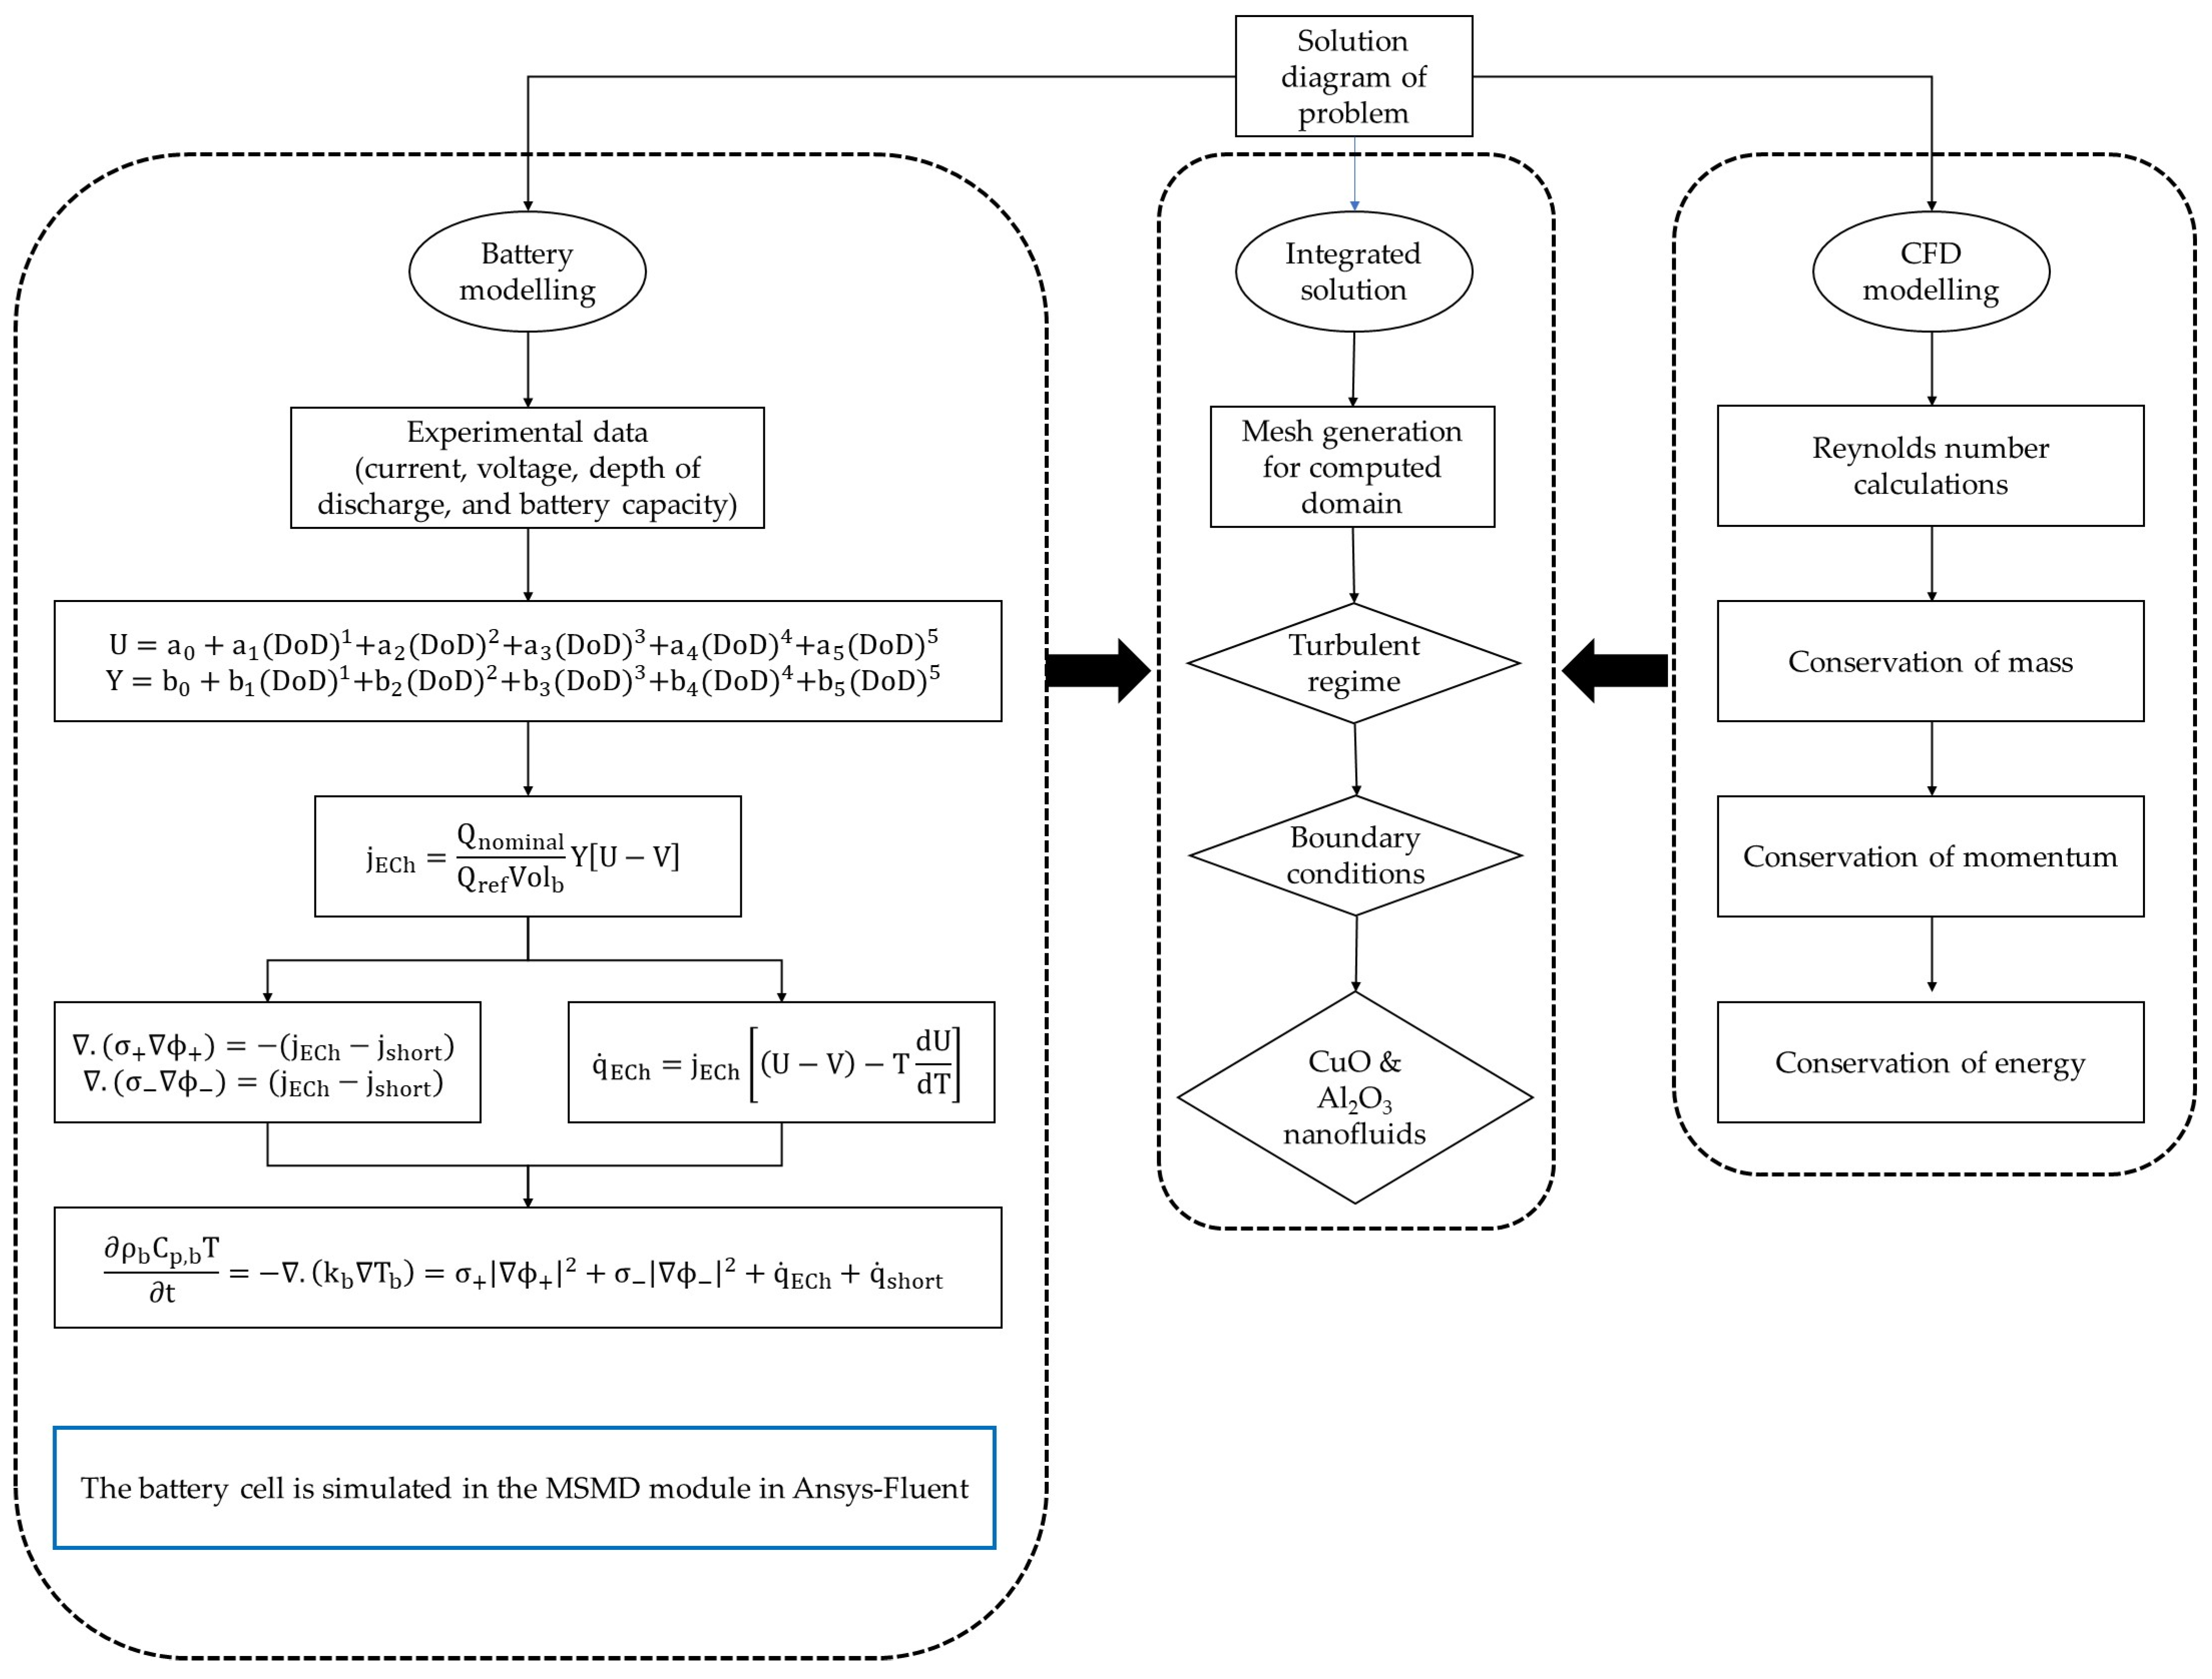
2.1. Battery Thermal Model Analysis

The battery’s thermal behavior in different operating conditions was assessed using numerical simulations. Accordingly, the battery cell was simulated in Ansys-Fluent 2020R2 by the Multi-Scale Multi-Domain (MSMD) module. Therefore, the battery heat flux at different C-rates for different depths of discharge was obtained. The Multi-Scale Multi-Domain (MSMD) approach is an appropriate solution at particle, electrode, and cell levels [51,52]. The Newman, Tiedemann, Gu, and Kim (NTGK) models were utilized to study the heat generation in batteries resulting from the number of discharges and the impact of discharge intensity on heat production. This model has been proposed in many articles due to its high accuracy in the thermal and electrochemical simulation of batteries. Figure 2 depicts the methodology of this study for developing our CFD simulation model. The battery parameters U and Y, presented in Equations (7) and (8), were obtained from the experimental results [53,54].

2.2. Battery Thermal and Electrical Field Models

Thermal diffusion fields were computed for a battery cell through the discretization of energy equations [55]. The conservation of thermal and electrical equations for BTMS is shown in Equation (1):
ρ b C p , b T t = . k b T b = σ + ϕ + 2 + σ ϕ 2 + q ˙ ECh + q ˙ short
Equations (2) and (3) were utilized to determine the current flux at the positive and negative electrodes, respectively [56]:
. ( σ + ϕ + ) = j ECh j short
. ( σ ϕ ) = j ECh j short
It should be noted that without an internal short circuit, j short and q ˙ short values were zero. The current density and the depth of the discharge (DoD) were achieved by the Equations (4) and (5), where V denotes cell voltage, and Y and U reveal the depth of discharge processes. Also, Q nominal and Q ref were obtained through experimental investigation regarding the battery specifications [56].
j ECh = Q nominal Q ref Vol b Y U V
DoD = Vol b 3600 Q nominal 0 t jdt
Equation (6) designates an electrochemical heat response in which the differences between U and V show heat generations concerning overpotential. Furthermore, the second term in the brocket in this Equation was evaluated to reach the heat generated by entropic heating. Also, the parameters of U and Y are demonstrated in Equations (7) and (8):
q ˙ ECh = j ECh U V T dU dT
U = a 0 + a 1 DoD 1 + a 2 DoD 2 + a 3 DoD 3 + a 4 DoD 4 + a 5 DoD 5
Y = b 0 + b 1 DoD 1 + b 2 DoD 2 + b 3 DoD 3 + b 4 DoD 4 + b 5 DoD 5

2.3. High Performance of the EV Model

To calculate the battery temperatures, many approaches have been used by different researchers [57]. In this study, the battery’s thermal behavior is studied for transient conditions as well. We are looking at the battery’s thermal performance during a restricted time based on the power demand and corresponding current. Therefore, we need to obtain an estimation of the current passing through the batteries for a selected vehicle, and it was assumed that the vehicle specifications are similar to a Tesla S series [58]. According to Equation (9), it is possible to obtain the amount of power demand of the battery pack based on the weight and acceleration of the vehicle:
F = ma × υ F . υ P = ma . υ P = m a . υ P = I × V
For our selected vehicle with a battery pack of 100 kWh, it takes about 4.1 s to reach 60 miles per hour in a fast-driving mode [58]. Hence, by converting the total power demand for reaching the highest performance and knowing the voltage value of each cell, it is possible to calculate the current at each time step. The amount of instantaneous heat flux is obtained from the current, which can be expressed according to Equation (10). To define the vehicle’s performance under maximal conditions (accelerating from 0 to 60 miles per hour in 4.1 s), Equation (10) was developed. The objective was to ensure that the maximum heat flux per second would swiftly approach its peak value within an approximate 4.1 s interval and subsequently remain consistent. The value of the heat flux in the maximum performance state was about 160,000 W/m3, and 445 kW battery power was needed for high performance based on the calculations that were conducted for the selected vehicle and the battery pack.
Q ˙ gen = 160,000 + ( 5.196673 e 13 160,000 ) ( 1 + ( t 0.00006044212 ) 1.389359 )

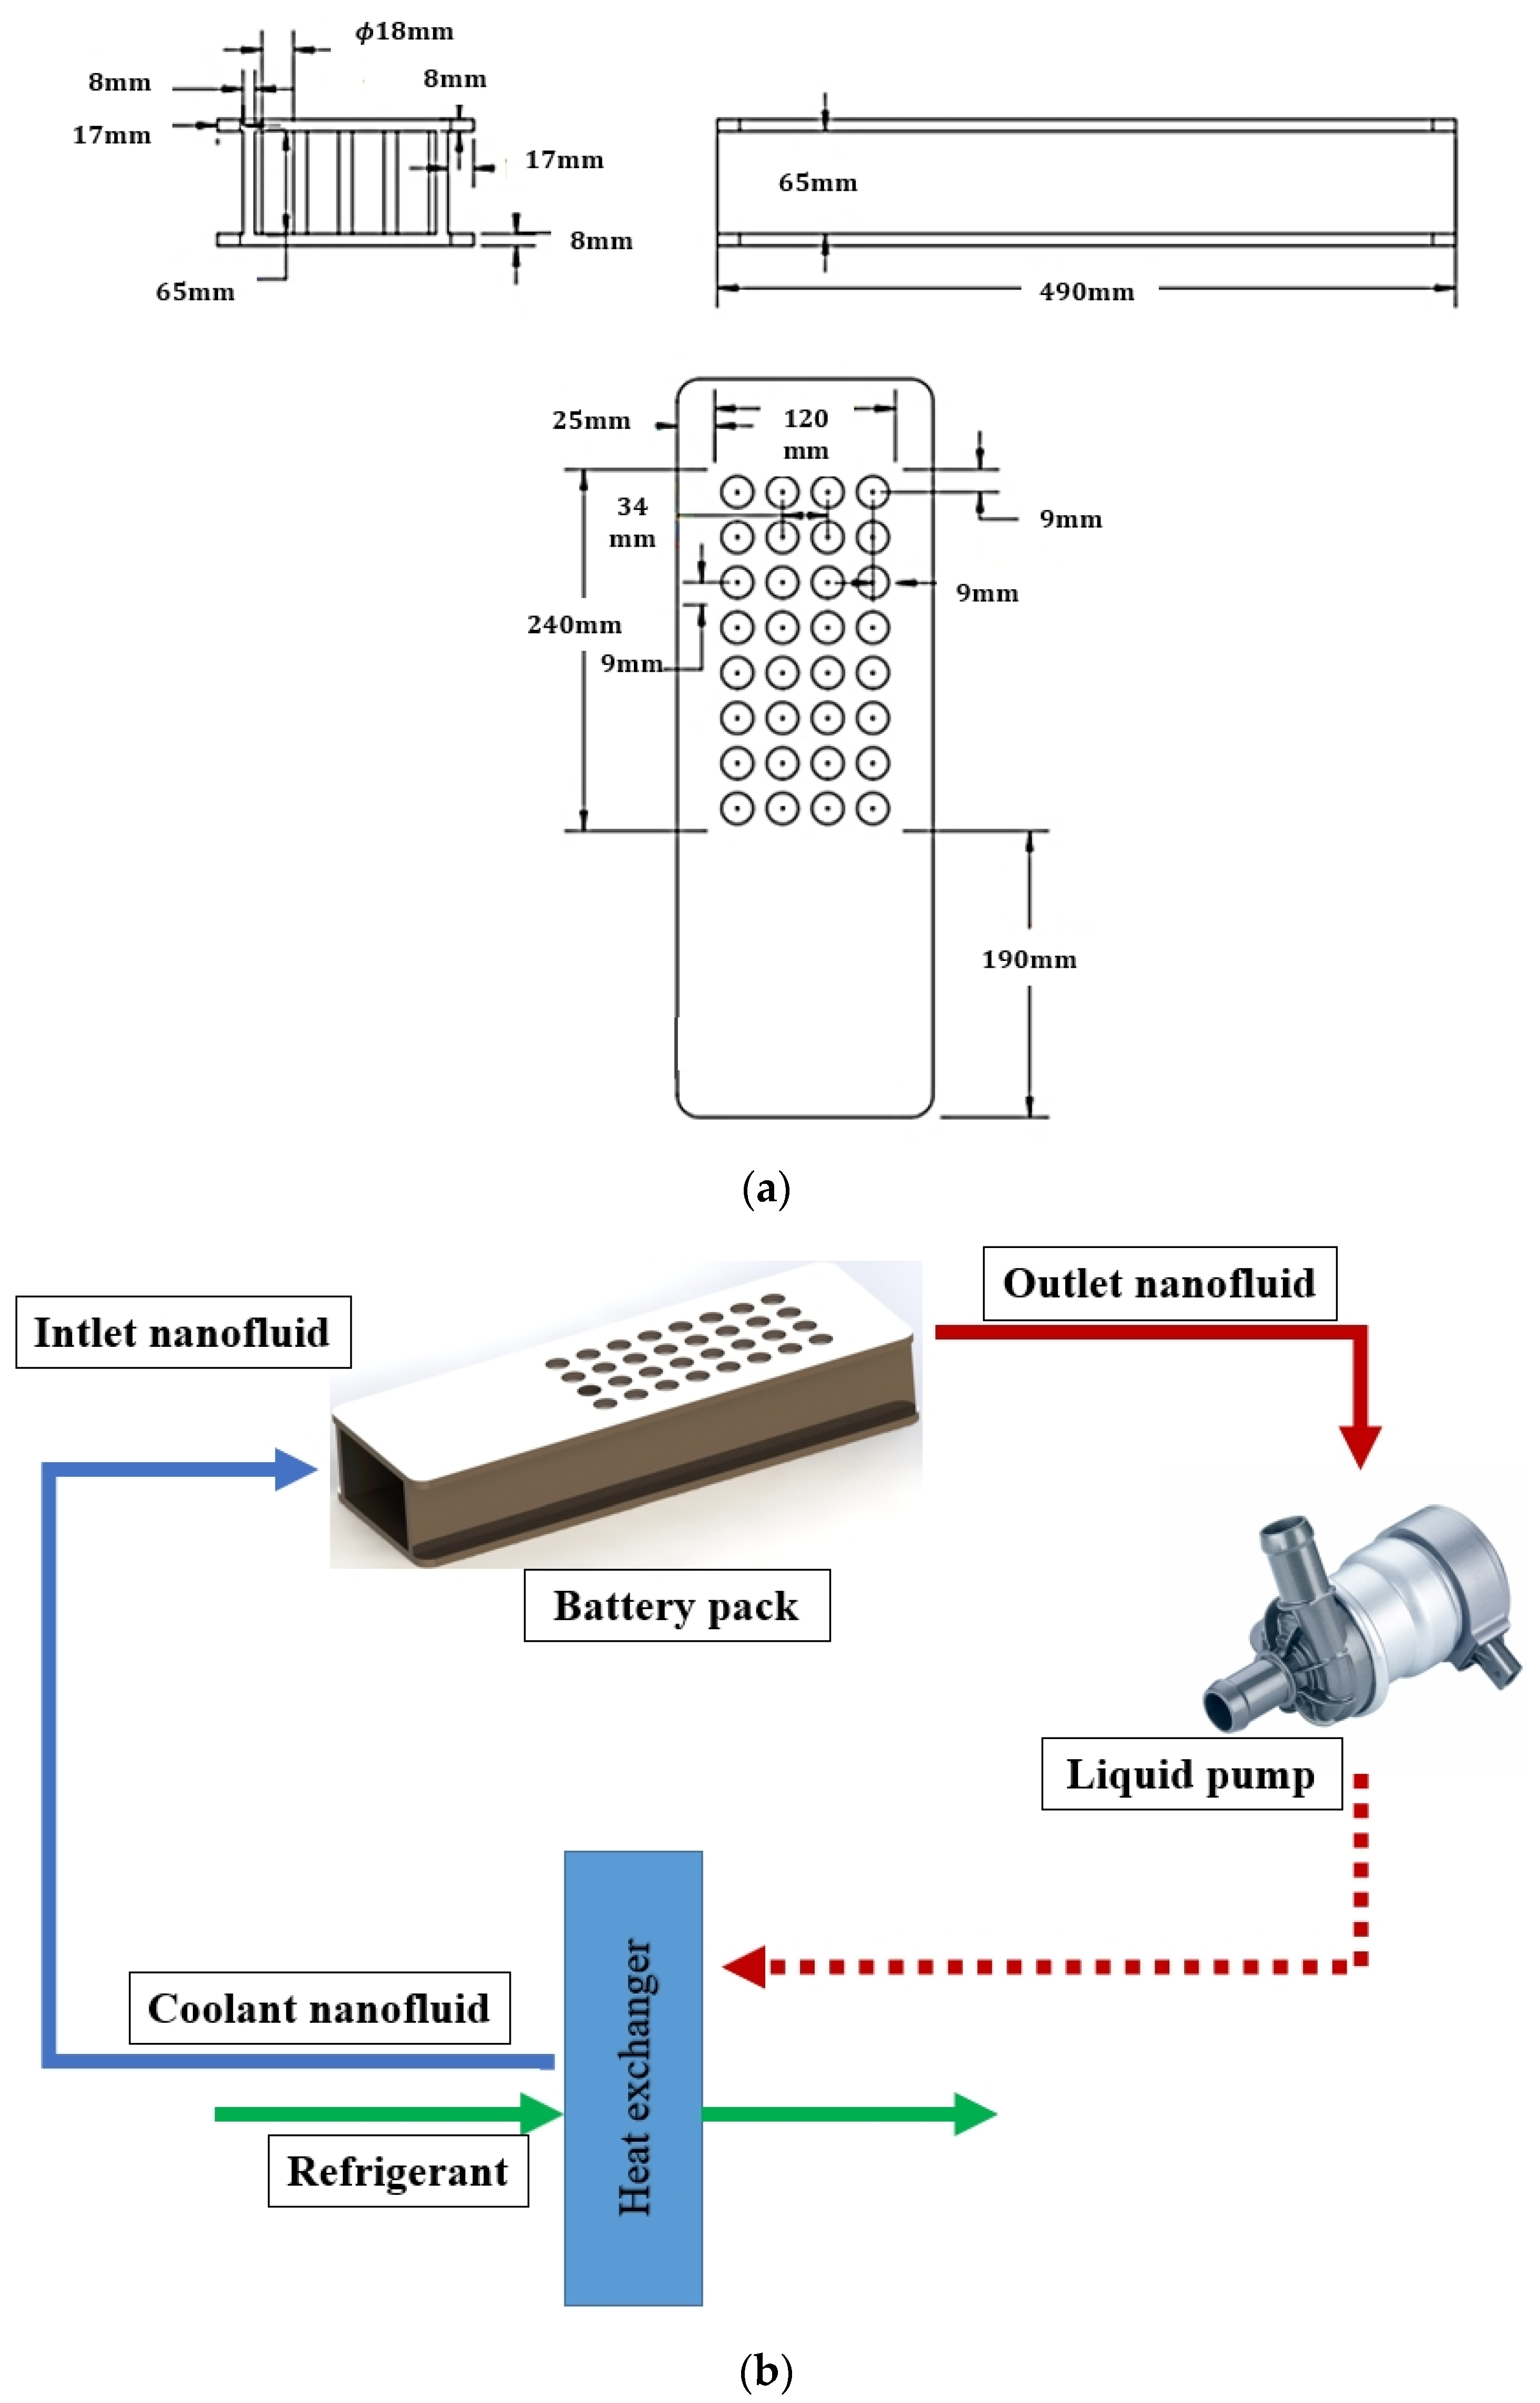
2.4. Liquid Cooled Model

The governing partial differential equations of fluid flow describe the conservation of mass, momentum, and energy, which are presented as follows:
  • Continuity equation [59,60]:
ρ t + x i ρ u i = 0
  • Momentum equation [59,60]:
t ρ u i + x i ρ u i u j = p x i + τ ij x i  
  • Energy equation:
t ρ h + 1 2 u i 2 + x i ρ u j h + 1 2 u i 2 = p t + x i u i τ ij + λ τ x j  
where enthalpy and stress tensor τij are expressed as follows:
τ ij =   µ u i x j + u j x i 2 3 µ u i x i δ ij
h   =   C p T
These governing equations are non-linear coupled systems of PDE with five equations and six fluid flow variables (P, ρ , u, v, w, and T). In addition, an extra equation is provided from the relationship between T, P, and ρ defined by the gas or liquid state equation. The standard k-ε model was selected for this study because of the good convergence as well as lower calculation time compared to other turbulence models. The selection of a turbulent flow regime in our study was grounded in a comprehensive evaluation of the system’s characteristics. Notably, the Reynolds number consistently exceeds the threshold indicative of turbulent flow throughout the entirety of the domain. Furthermore, an assessment of velocity fluctuations and energy spectra at various locations within the domain consistently exhibited attributes characteristic of turbulent flow behavior. It should be noted that established empirical findings from analogous systems operating under similar conditions corroborated the expectation of a turbulent flow regime. In consideration of these factors, this assumption was chosen for the prevalence of turbulence across the entire domain. This model showed a robust performance during the validation against the experimental data for the current simulation, as demonstrated in Figure 3 and Figure 4. Furthermore, the standard k-ε turbulence model is commonly utilized and provides valid results for a broad range of flows with high accuracy in heat transfer and flow analysis. It was also used by other researchers who were presenting similar studies [61,62,63,64,65,66,67]. Below are the equations utilized for turbulent kinetic energy and eddy viscosity:
t ρ k + x i ρ ku i = x j μ + μ t σ k k x j + G k + G b ρ ε + Y M + S k
t ρ ε + x j ρ ε u j = x i μ + μ t σ ε ε x j + ρ C 1 S ε ρ C 2 ε 2 k + v ε + C 1 ε ε k C 3 ε G b + S ε
The constant quantities are listed in Table 4, and the turbulent viscosity (µt) is calculated by integrating k and ε as follows:
μ t =   ρ C μ k 2 ε
where Cμ is constant. The constants used in the turbulent model on the equations are as follows.

2.5. Thermophysical Properties of Nanofluid

The thermophysical properties of nanofluids, such as effective density, specific heat capacity, thermal conductivity, and viscosity, were determined using empirical correlations sourced from the literature, as presented in Table 5 below.
Effective properties of the nanofluid were calculated at four different concentrations (φ), namely, 0.5%, 2%, 3%, and 5%. Here, the subscript “bf” indicates the base fluid (water), “np” represents the nanoparticle, and “nf” denotes the nanofluid.

2.6. Data Reduction

The hydraulic diameter and the wall and bulk temperature were defined by:
D h = 4 A c P
T w = 1 A TdA
T b z = T ρ nf V dA ρ nf V dA
The Nusselt Number was computed for forced-air convection using Equation (22):
Nu = hD k
In the aforementioned equation, h represents the convective heat transfer coefficient (in W/m2K), D denotes the diameter of the battery (in meters), and k signifies the thermal conductivity of the fluid (in W/mK). The convective heat transfer coefficient was determined using the following equation:
h = q T w T b
where q , Tw, and Tb represent the uniform heat flux, wall temperature, and mean temperature of the inlet and outlet of the channel.

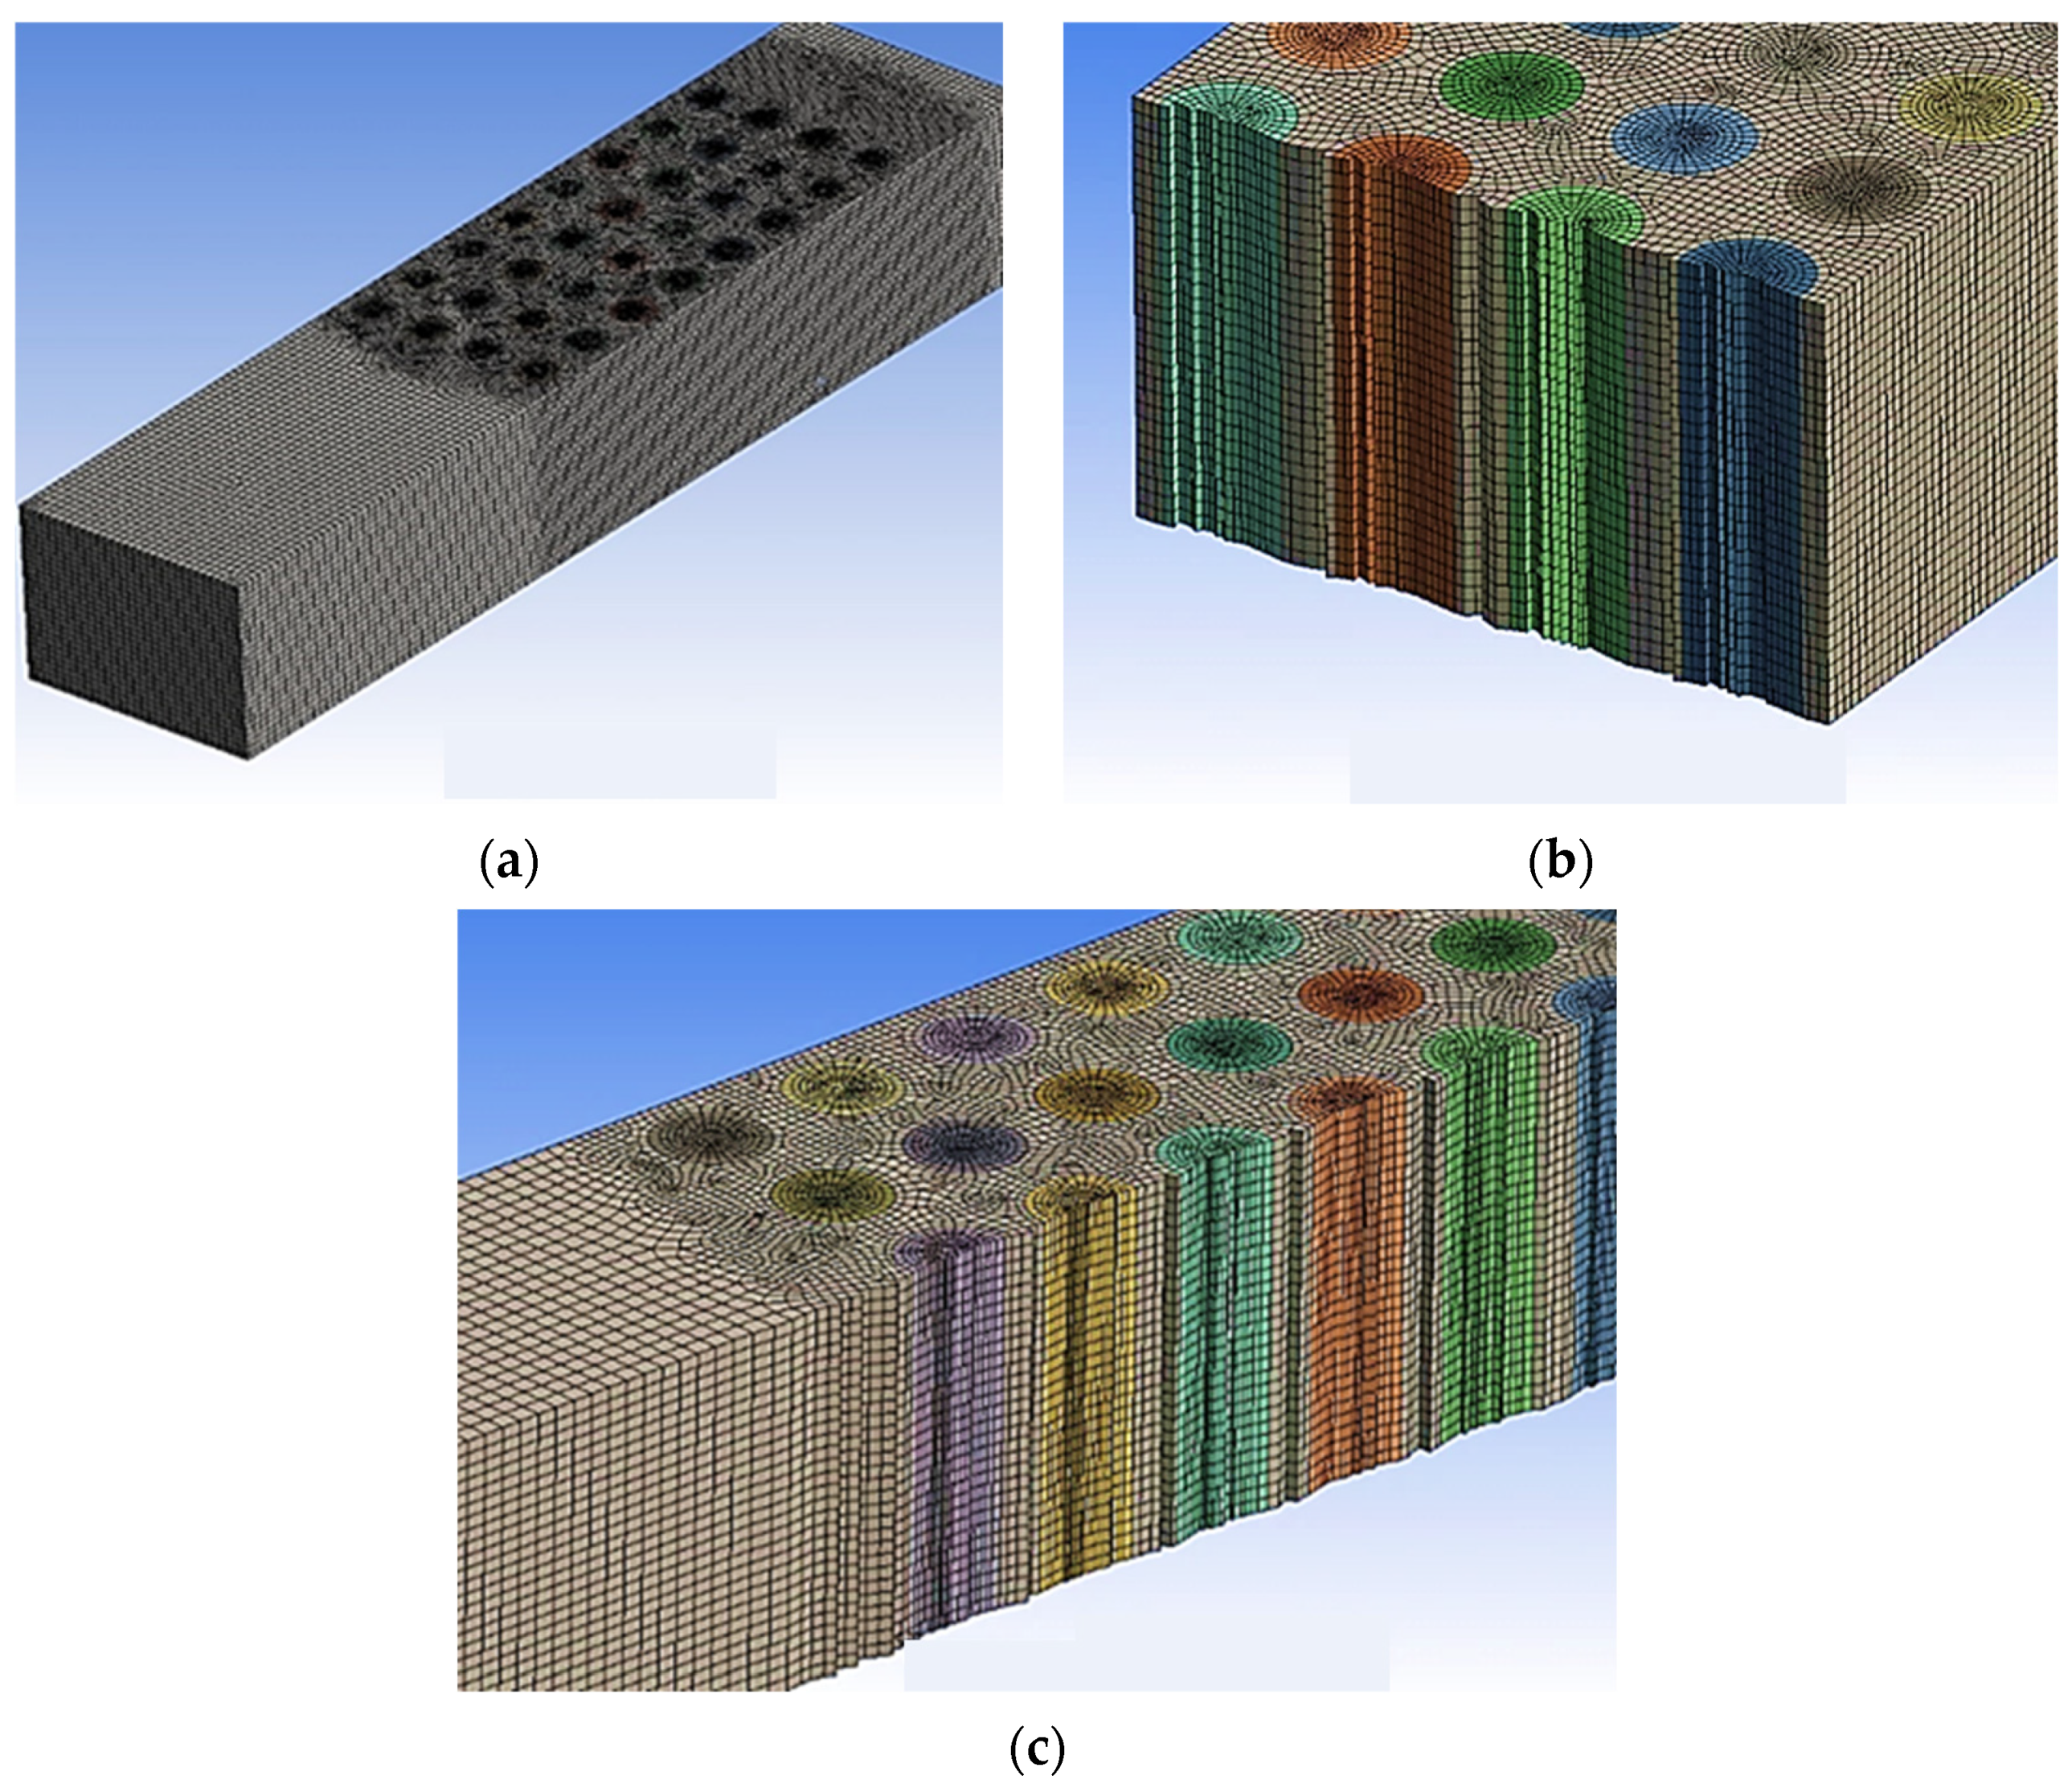
3. Numerical Analysis

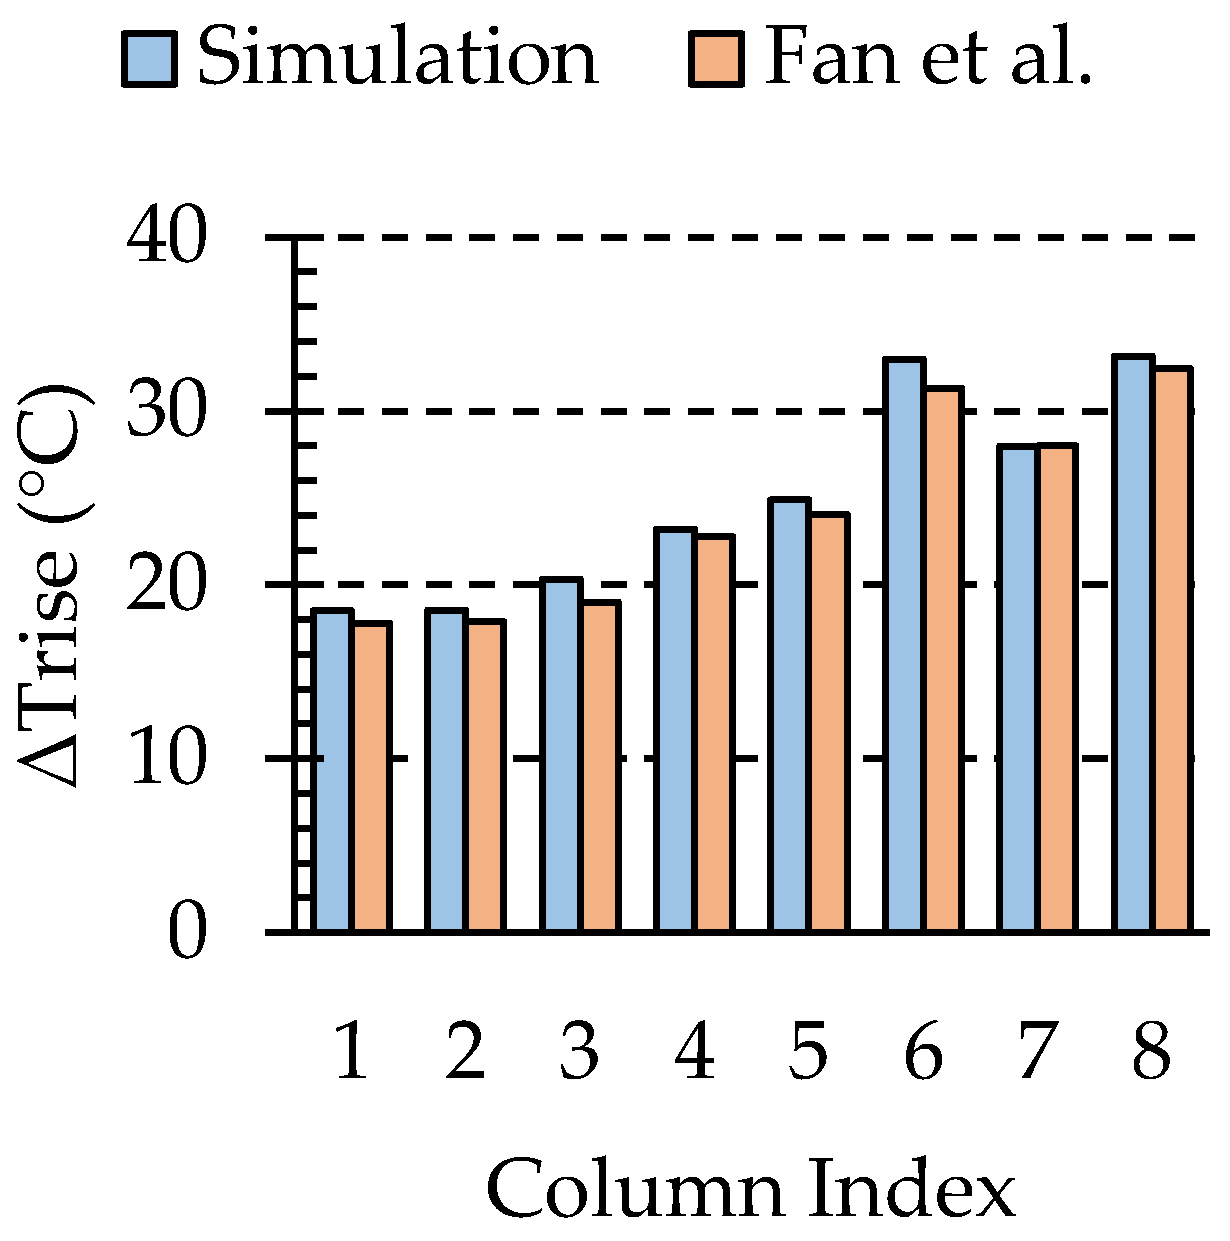
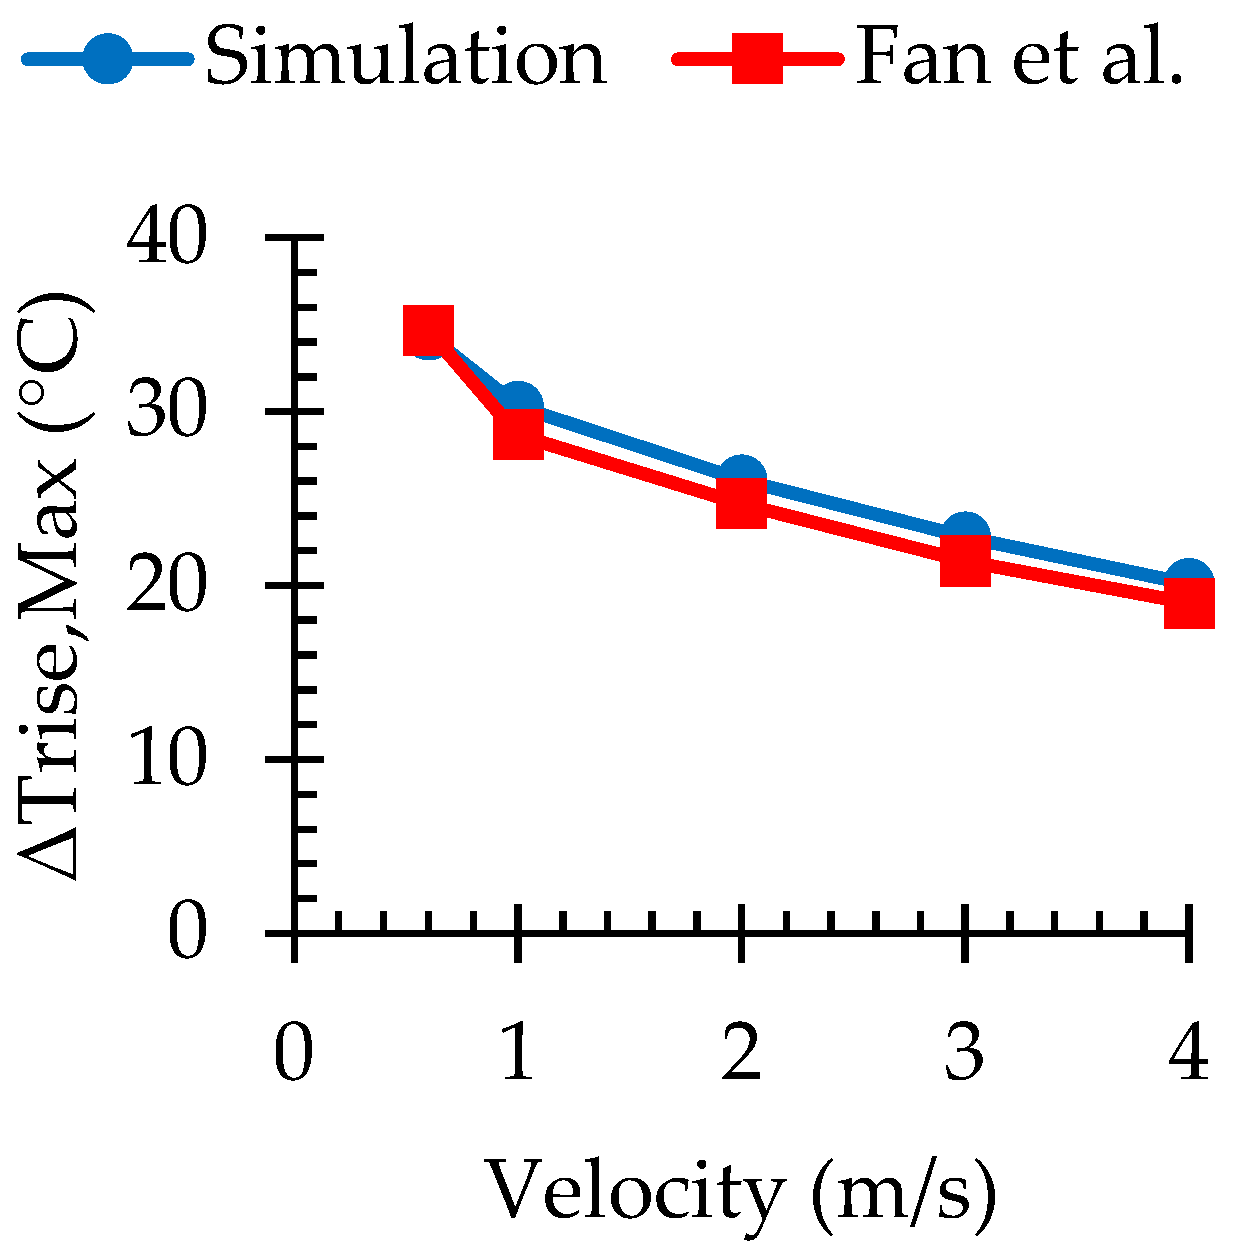
3.1. Numerical Validation

To validate the model, the change in surface temperature in each column, Δ T rise , i = T max , i T initial , where T max , i is the maximum temperature in each column, and T initial is the initial temperature of battery cells (25 °C), was obtained from the simulation, and this were compared with experimental data from Fan et al. [22]. That study was for an air-cooling system with various inlet air velocities (ranging from 0.6 to 4 m/s) for a battery module consisting of 32 lithium-ion batteries in eight columns. The results for different battery configurations (such as aligned, staggered, and cross) were presented, and the aligned configuration was selected for validation purposes in this paper. In addition, the current study was validated through an experimental approach via air, showcasing the concurrence between numerical simulations and experimental data, thus establishing the credibility of our computational framework. Following this, the focus was shifted to water and nanofluids in the ongoing investigation, with an acknowledgment of the fluid-specific distinctions in flow behavior.
The maximum temperature rises for batteries in each column at a discharge rate of 2C, and an air inlet velocity of 0.6 m/s was compared between the simulation and experiment, as shown in Figure 3. Furthermore, Figure 4 compares the maximum temperature rise among all battery cells within the module between the simulation and experimental data at different air inlet velocities. The maximum error was found to be 5.35%, indicating excellent agreement between the simulation and experimental results, as shown in these figures. Hence, it can be concluded that the simulated model using the standard k-ε turbulence model for the air-cooling system can produce reasonably accurate results.

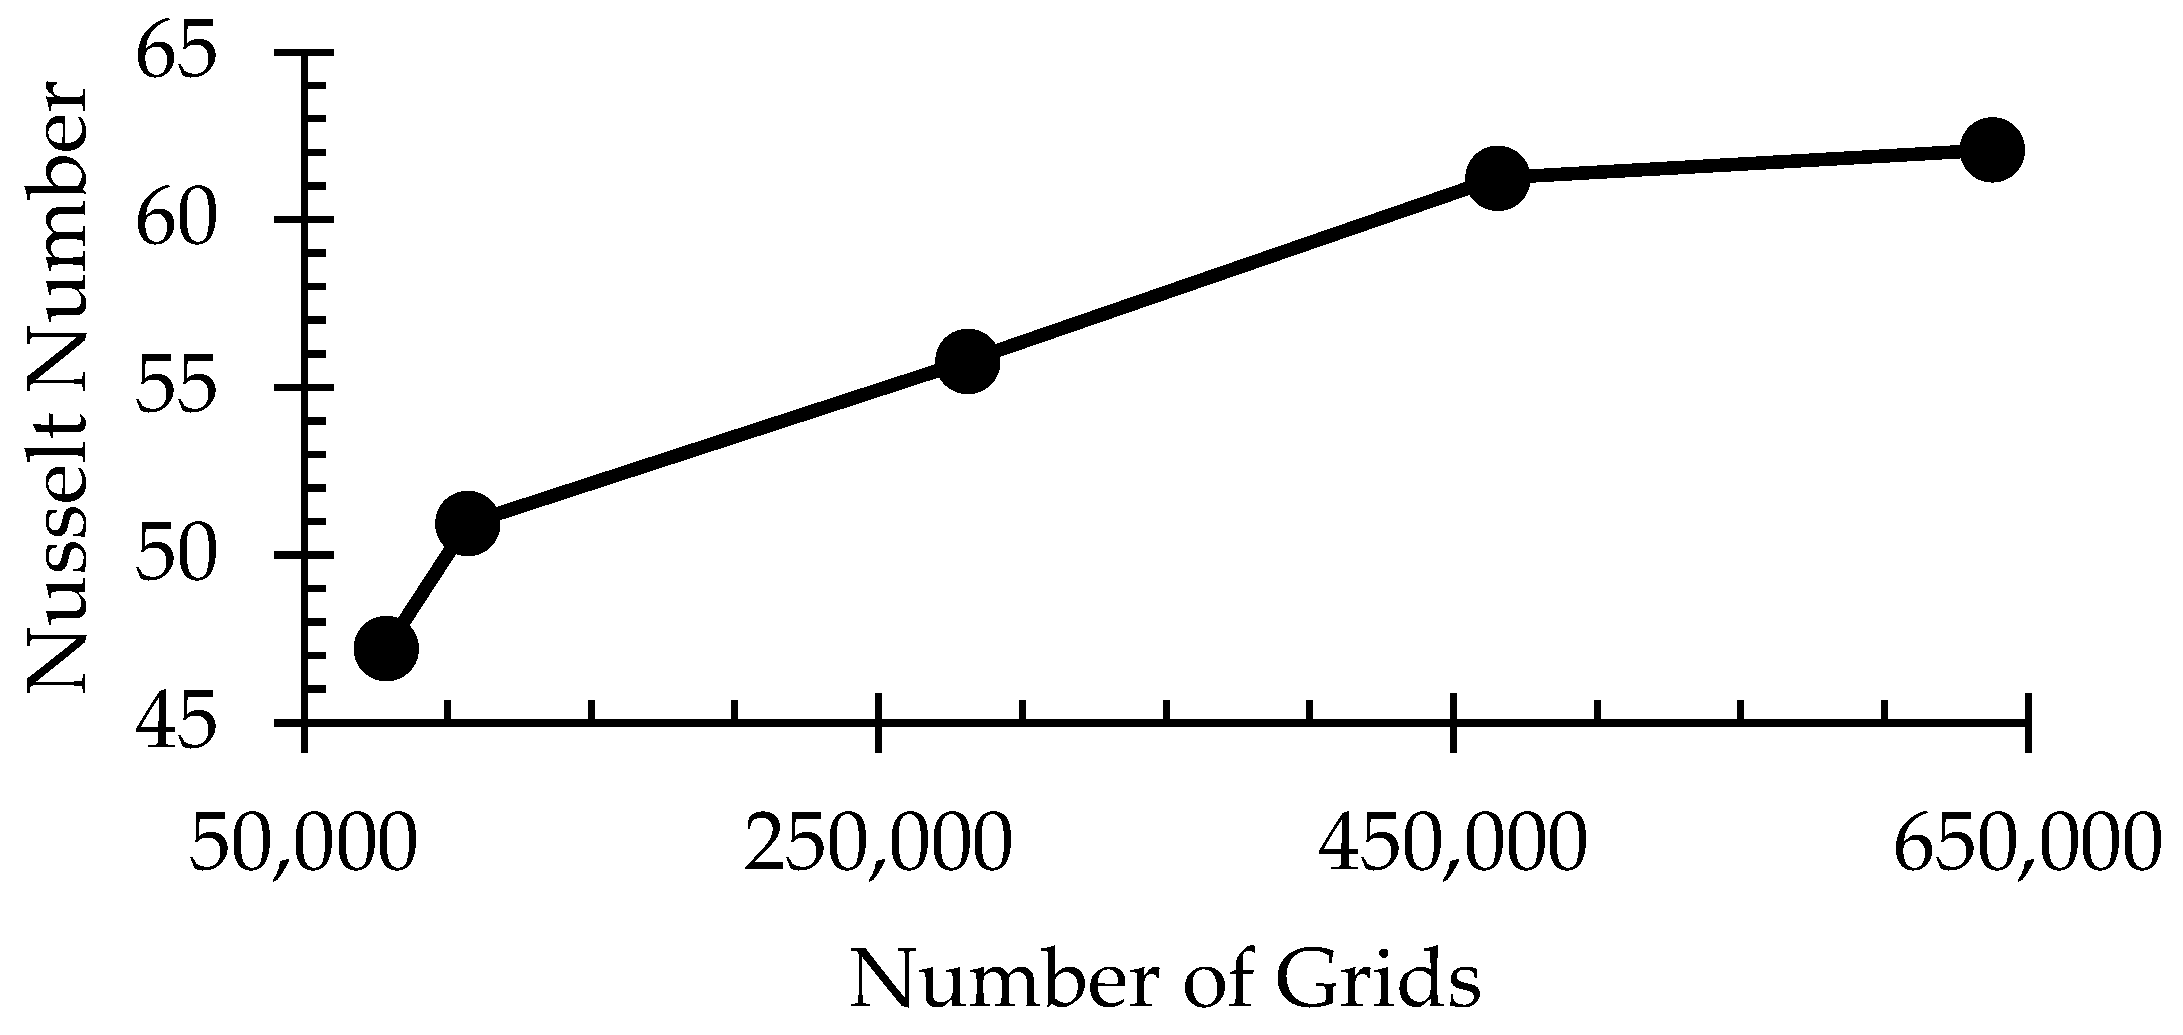
3.2. Grid Independence

To ensure grid independence, a study was conducted wherein the wall function and independent assessment requirements for grid size were selected. Thereafter, structured grids were produced using ANSYS Meshing for both the battery and fluid domains, as illustrated in the following Figure 5.
The numerical results can be deemed reliable since the average orthogonality number falls within the range of 0.8 to 0.9. Additionally, Figure 5 demonstrates how the mesh was refined around crucial regions, such as the inlet and batteries, highlighting the attention given to the refinement of these areas. Different grid sizes were then selected to discretize the model, and the result is plotted in Figure 6.
The maximum temperature of each column using air tends to be stable for a grid with a mesh count of 500,000. Based on the plot data, it is evident that the Nusselt number remains constant at 60.5 for the final two meshes. Hence, to enhance the computational performance and diminish the time taken for iterative calculations, the study employed a mesh count of 500,000.

4. Results and Discussion

To assess the battery heat generation, a single cell is simulated at various C-rates. Figure 7 presents the results of the battery thermal simulation for a single battery cell without any cooling. As shown, at the discharge value of 2C 48,000 W/m3, heat was generated, which agreed with the experimental work conducted by Fan et al. [22]. Transient battery heat generation for higher C-rates (3C, 4C, 5C, and 6C) was obtained and is presented in this figure.

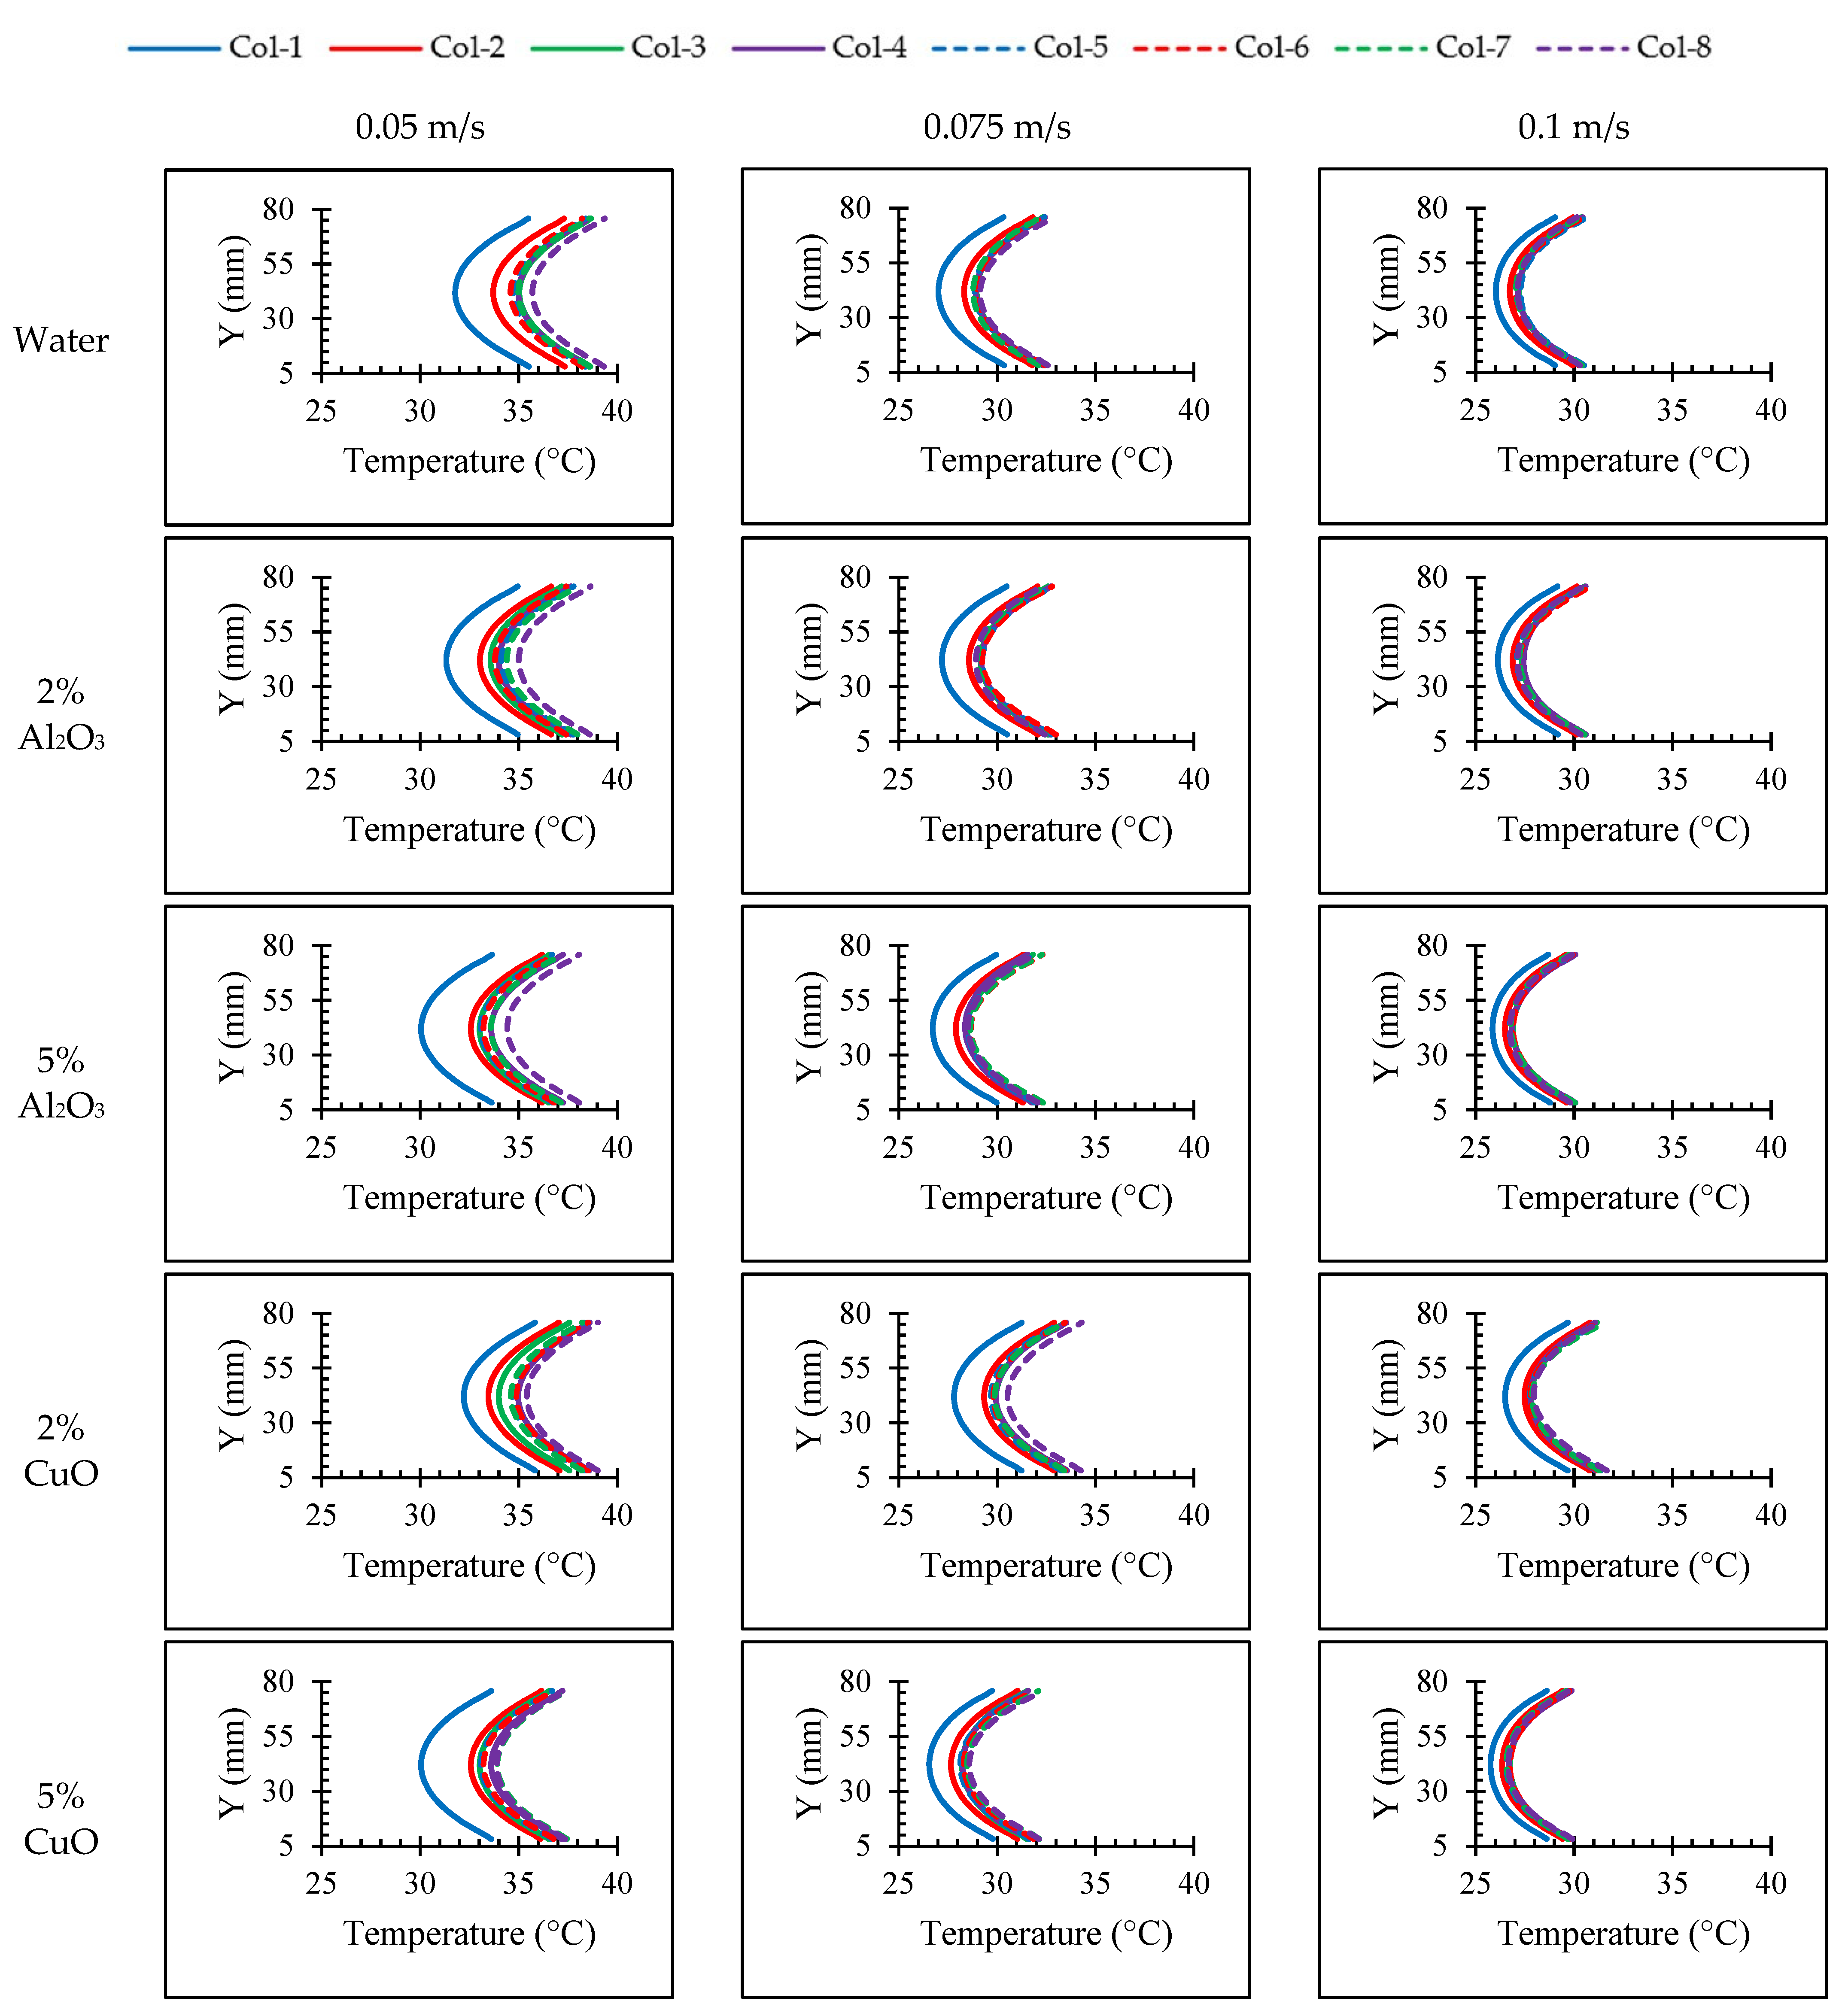
4.1. Effects of Nanoparticle Concentration on Thermal Characteristics of the Batteries

Figure 8 demonstrates the maximum temperature difference rise ( Δ T rise , Max ) against the velocity for different concentrations of Al2O3 and CuO nanofluids within the battery pack velocities at a 2C discharge rate. According to this figure, by increasing the concentration of Al2O3 and CuO and the velocity magnitude, Δ T rise , Max decreases. For example, with a 0.5% solid volume fraction and 0.05 m/s velocity, Δ T rise , Max is found to be 12.4 °C and 12.5 °C for Al2O3 and CuO nanofluids, respectively. This means about a 35% reduction in Δ T rise , Max compared to the best air-cooling option at 4 m/s in Figure 4. For 5% concentration and 0.1 m/s, the reductions will be 85% and 75% for Al2O3 and CuO nanofluids, respectively. This confirms the significant potential in cooling by replacing the air-cooled system with nanofluid.
As indicated in Figure 8, by using Al2O3, Δ T rise , Max decreases significantly by increasing the velocity from 0.05 m/s to 0.1 m/s. Table 6 demonstrates the influence of various volume concentrations (φ) of the nanofluids and inlet velocities on Δ T rise , Max compared to water. According to data presented in this Table, Al2O3 nanofluid led to a substantial increment in the rate of heat transfer when compared to both CuO and water, primarily due to the superior thermal conductivity exhibited by Al2O3.
Figure 9 demonstrates the average temperature distribution along the battery cell length for different battery columns at different velocities at a 2C discharge rate. When the simulation was completed, surface integrals were used to calculate the maximum temperature on a surface in Ansys Fluent software. In the CFD-Post processing, a line along the battery surfaces was drawn, the temperature variation along the line for each cell is obtained, and the variations were averaged for every column. Then, the average temperature for batteries in every column was plotted in this figure, where the average temperature was always the minimum for column 1 and the maximum for column 8. It is also found from this figure that by increasing the velocities and nanofluid concentrations, the average temperature was always reduced. The maximum temperature reduction belongs to the batteries located in the center of the channel, especially for the first column, and this happens due to the coolant contact at high-velocity flow with the first column of the batteries.
Through steady-state numerical simulations and Equation (22), a correlation was established to determine the average Nusselt numbers corresponding to different inlet rates of the nanofluid. The temperature differences between the first and second columns were utilized in calculating the average Nusselt number, which was then compared to that of the rear batteries. The study also involved an investigation of the average Nusselt numbers for various weight percentages of nanoparticles, and a comparison of results was carried out between Al2O3 and CuO nanofluids. Figure 10 presents the Nusselt variations for different volume fractions of nanofluids relative to water as the base fluid at a 2C discharge rate. Based on the results from this figure, an increase in the percentage of nanoparticles led to a corresponding increase in the average Nusselt number, primarily attributed to the rise in the convective heat transfer coefficient. The convective heat transfer was observed to be higher for both Al2O3 and CuO nanoparticles compared to pure water, with Al2O3 exhibiting a superior performance over CuO. This is due to the possession of specific properties that inherently enhance its convective heat transfer [72].
The uniform increment in the inlet velocities increases the Reynolds number and leads to a rise in the average Nusselt number. These results revealed that liquid cooling nanofluid, and therefore the Reynolds numbers, play a critical role in efficient heat transfer from the battery pack. Thus, suitable nanofluid cooling and the Reynolds number are essential for controlling the temperature within the battery pack. For Al2O3 and CuO nanofluid at 0.05 m/s, the difference in average Nusselt numbers for various volume concentrations was not very significant. In contrast, with increasing the velocities to 0.075 m/s and 0.1 m/s, the quantities of the average Nusselt number gradually increased, and this increase was far more significant for Al2O3 than for CuO.

4.2. Effects of Nanoparticle Concentration on Pressure Drop

The drop in water and nanofluid pressure was calculated at various velocities, and the outcomes are presented in Figure 11, which illustrates the pressure drop variation by increasing the velocities for different Al2O3 and CuO volume concentrations compared to the base fluid. Pressure drop could be a critical parameter that influences the axillary power consumptions in studying the performance of batteries. The amount of power consumed by the pump is directly proportional to the pressure drop within the channels. In situations in which high pressure drops occur, the required pump size is typically large, leading to an increment in pumping power consumption. This also results in higher cost, which is not ideal.
As shown in Figure 11, the nanofluid flow in the cooling system did not add much to the pressure drop, especially at low concentrations. However, there was a small increment in the pressure drop for higher concentrations of the nanoparticles at higher velocities. At 0.05 m/s, an extra-low velocity of the nanofluid, the pressure drop difference between different nanofluid volume concentrations of Al2O3 and CuO with the water was not noticeable, whereas the pressure drop started to differentiate with increasing velocities. At 0.075 m/s, for the 0.5% and 2% concentration of Al2O3, the pressure drop in the cooling systems was 62.82 Pa and 66.88 Pa, respectively, which is 1.26% and 7.81% greater than the pressure drops of pure water. In addition, for Al2O3 at concentrations of 3% and 5%, the pressure drop increased by 8.16% and 12.3%; nevertheless, at 0.1 m/s, the pressure drop was increased more compared to the other two velocities (0.05 and 0.075 m/s).
In Figure 11, at 0.1 m/s, the pressure drop increased by 1.40%, 6.28%, 8.84%, and 14.53% for the different Al2O3 concentrations of 0.5%, 2%, 3%, and 5%, respectively, compared to the base fluid. Furthermore, at 0.1 m/s, the values of the pressure drop increased by 2.96%, 12.64%, 17.71%, and 26.90% for CuO concentrations of 0.5%, 2%, 3%, and 5%, respectively. The maximum pressure drop was for a 5% concentration of Al2O3 and CuO, in which the drop was 184.216 Pa and 204.168 Pa, respectively. Due to the density differences, the CuO pressure drop values were considerably higher compared to Al2O3 with the same volume fraction. For situations with low inlet fluid velocities, despite the relatively high pressure drop across the batteries compared to the channel flow, the advantages associated with enhanced heat transfer outweigh the minor negative effects resulting from an increase in pumping power.
Based on the observations from Figure 12, the velocity vectors displayed the formation of vortex structures upon contact with the battery’s domain. Additionally, the velocity profile revealed that as the nanofluid passes through the batteries, there is an increase in fluid velocity among the rows of batteries, and a pressure drop is experienced behind the batteries, primarily those located in the final column.
Temperature contours are demonstrated in Figure 13 for 2% and 5% of both nanoparticles at the minimum velocity of 0.05 m/s. The temperature contours revealed that the minimum temperature happened at the inlet. The batteries positioned at the end of the battery pack had the highest temperatures, although the temperature differences between the inlet and outlet of the nanofluid were negligible.
Moreover, the temperature reduction in the center of each battery cell was observed to be higher compared to the upper and lower sections. This phenomenon can be attributed to the higher velocity of the nanofluids at the center of the pack relative to the velocity near the wall. Notably, the boundary conditions of the pack walls were defined based on the standard wall function.

4.3. Effect of Nanoparticle Material

In the current investigation, two types of nanofluids, i.e., alumina and copper oxide, were compared with the base water fluid for the heat transfer properties. Moreover, a comparative analysis was performed to identify the optimal cooling approach. To obtain the maximum temperature of each of the eight columns at various concentrations for all selected velocities, the mean temperature of the battery pack was then calculated by averaging all values. These results are illustrated in Figure 14, in which it is evident that Al2O3 nanofluid performed better than water and CuO nanofluid, as temperature reductions were more accentuated for alumina.
This means that overall, Al2O3 achieved better results with various velocities. Furthermore, Al2O3 nanoparticles are considered to be one of the most cost-effective nanoparticle options available on the market. They can provide exceptional performance and stability [73].
As previously stated, an enhancement in the velocity and volume concentration of the nanofluid caused a gradual reduction in the temperature of the batteries. From the alumina results in Figure 14, it can clearly be understood that the average temperature decreased by the velocity increment. For the minimum velocity of 0.05 m/s, the average temperature was 36.07 °C for Al2O3 and 37.59 °C for CuO nanofluids. Compared to the base fluid, the average temperature decreased by 6.9% for the Al2O3 and by 5.9% for CuO nanofluid at the 0.05 m/s velocity. Furthermore, the maximum velocity of 0.1 m/s provides an average temperature of 29.32 °C. In general, the effect of velocity is more prominent for Al2O3 than CuO. The lowest velocity for CuO resulted in a higher temperature, because at a lower velocity, the number of clustered particles increases, which leads to poor heat transfer. When the velocity increases, these particles are less likely to cluster around the surface, and the heat transfer improves.

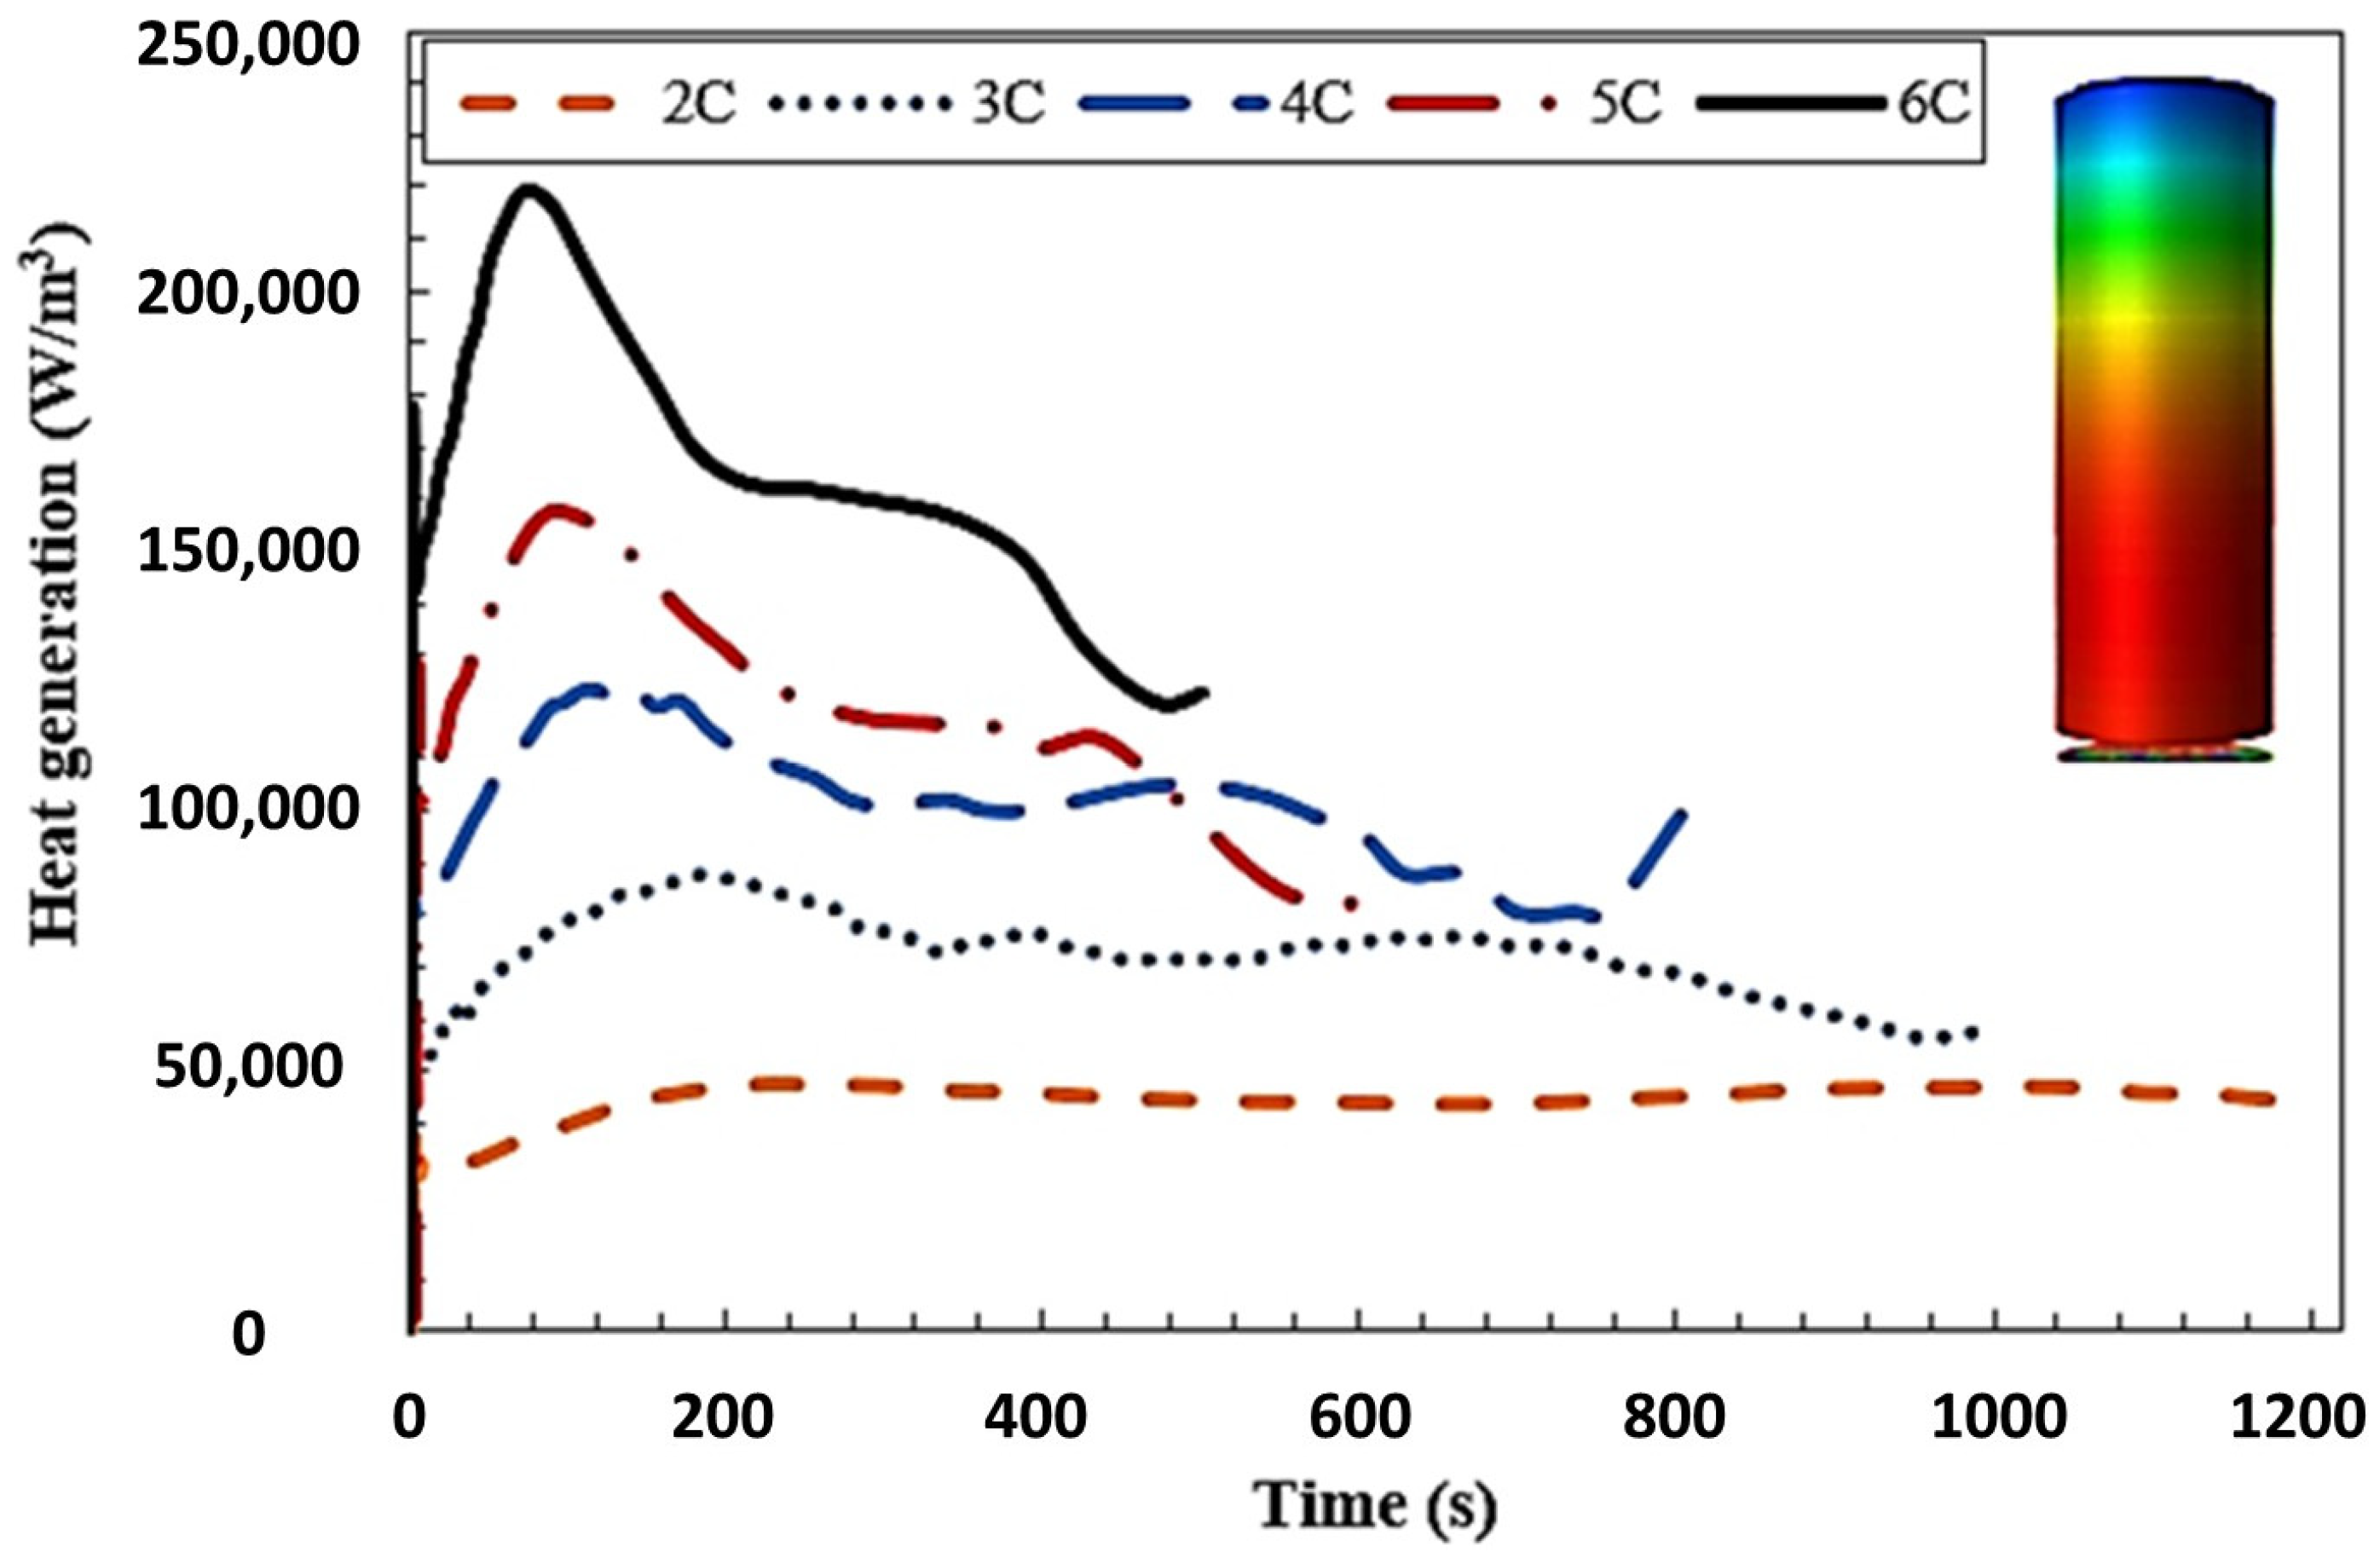
4.4. Transient Analysis

As discussed in Section 2.3, by ignoring the conversion losses, the mechanical power is assumed to be equivalent to electrical power, which can facilitate the calculation of the battery heat flux corresponding to the battery discharge rate based on maximum power extraction from the batteries. To evaluate the thermal management in the worst-case scenario, a transient simulation was conducted to evaluate the battery’s thermal behavior for real performance at the maximum discharge rate corresponding to the velocity increase from 0–60 miles per hour in 4.1 s, and the transient battery’s thermal performance is evaluated for the 5% volume concentrations of Al2O3 and CuO nanofluids’ cooling. According to Figure 8, the best thermal performance of the nanofluid was achieved for 5% Al2O3 and CuO nanofluids. Therefore, a 5% volume concentration of nanofluids is employed to evaluate the thermal performance of actual and high-performance EVs in time-dependent situations during real-world operation. It could be estimated that for this high-performance scenario for our selected vehicle [58], 445 kW of power is required according to the calculations in Section 2.3. This is equal to a 5C discharge rate. Figure 15 presents the temperature and heat flux changes during the high-performance mode. As shown in this figure, 445 kW power extraction for the first 4.1 s results in a heat flux of 160,000 W/m3 in the battery pack during this duration for a 5C discharge rate, as indicated in Figure 7. Moreover, to evaluate the cooling performance and ensure the safety of the battery pack, the heat flux is assumed to remain constant for approximately 1000 s, as shown in this figure. This time was assumed due to the delay in temperature response. The conduction heat transfer from the interior of the batteries to the surface needs time, and this was considered during the evaluation of the cooling performance.
Figure 16 demonstrates the average of the temperature distribution along the batteries in different columns during the first 100 s for the high-performance operation at a 5C discharge rate (see Figure 15) and the influence of two selected nanofluids at different velocities in comparison with the base fluid. During the high-performance mode, the vehicle’s battery pack will be under stressed heat, during which the high-power requirements will cause elevated heat flux and temperature. As such, the thermal management system should ideally preserve the batteries’ temperature below 40 °C. According to this figure, 5% of the Al2O3 and the CuO nanofluid caused a temperature reduction of up to 7.89% and 4.73% compared to pure water. It is noteworthy that when it comes to cooling purposes, the differences in performance between the Al2O3 and CuO nanofluids may not be readily apparent. However, in terms of achieving uniform temperature reduction across battery cells in various columns, CuO exhibited excellent performance, as illustrated in Figure 16.
Figure 17 indicates the temperature changes for different time steps with a comparison of the pure water and Al2O3 nanofluids’ effects. According to this figure, the influence of Al2O3 is quite sensible, and the liquid cooling can prevent a steep increase in the batteries’ temperature after the time step of 600 s. As shown, using liquid cooling ensured that the batteries remained in a safe temperature range. Also, after 600 s of operation under high power demand, the temperature of the batteries continued to remain within the ideal operating range.

5. Conclusions

Developing enhanced cooling methods that will elongate battery life is in the interest of research and the automotive industry. Nanofluids can improve the cooling performance of the battery thermal management system (BTMS). Therefore, this research studied the improvement in an air-cooled thermal management system by utilizing two distinct nanofluids while looking at the transient operation. Fluid flow behavior and heat transfer characteristics were investigated using a CFD simulation for liquid cooling with and without nanofluids. First, validation was performed with a minimum error along with a mesh independence study to confirm the reliability of the model for this case study. Then, the application of liquid cooling was investigated, and the liquid cooling specifically with alumina nanofluid was proven to be more effective for both lowering temperatures and for uniformity. The main conclusions that arose from the results of this study are:
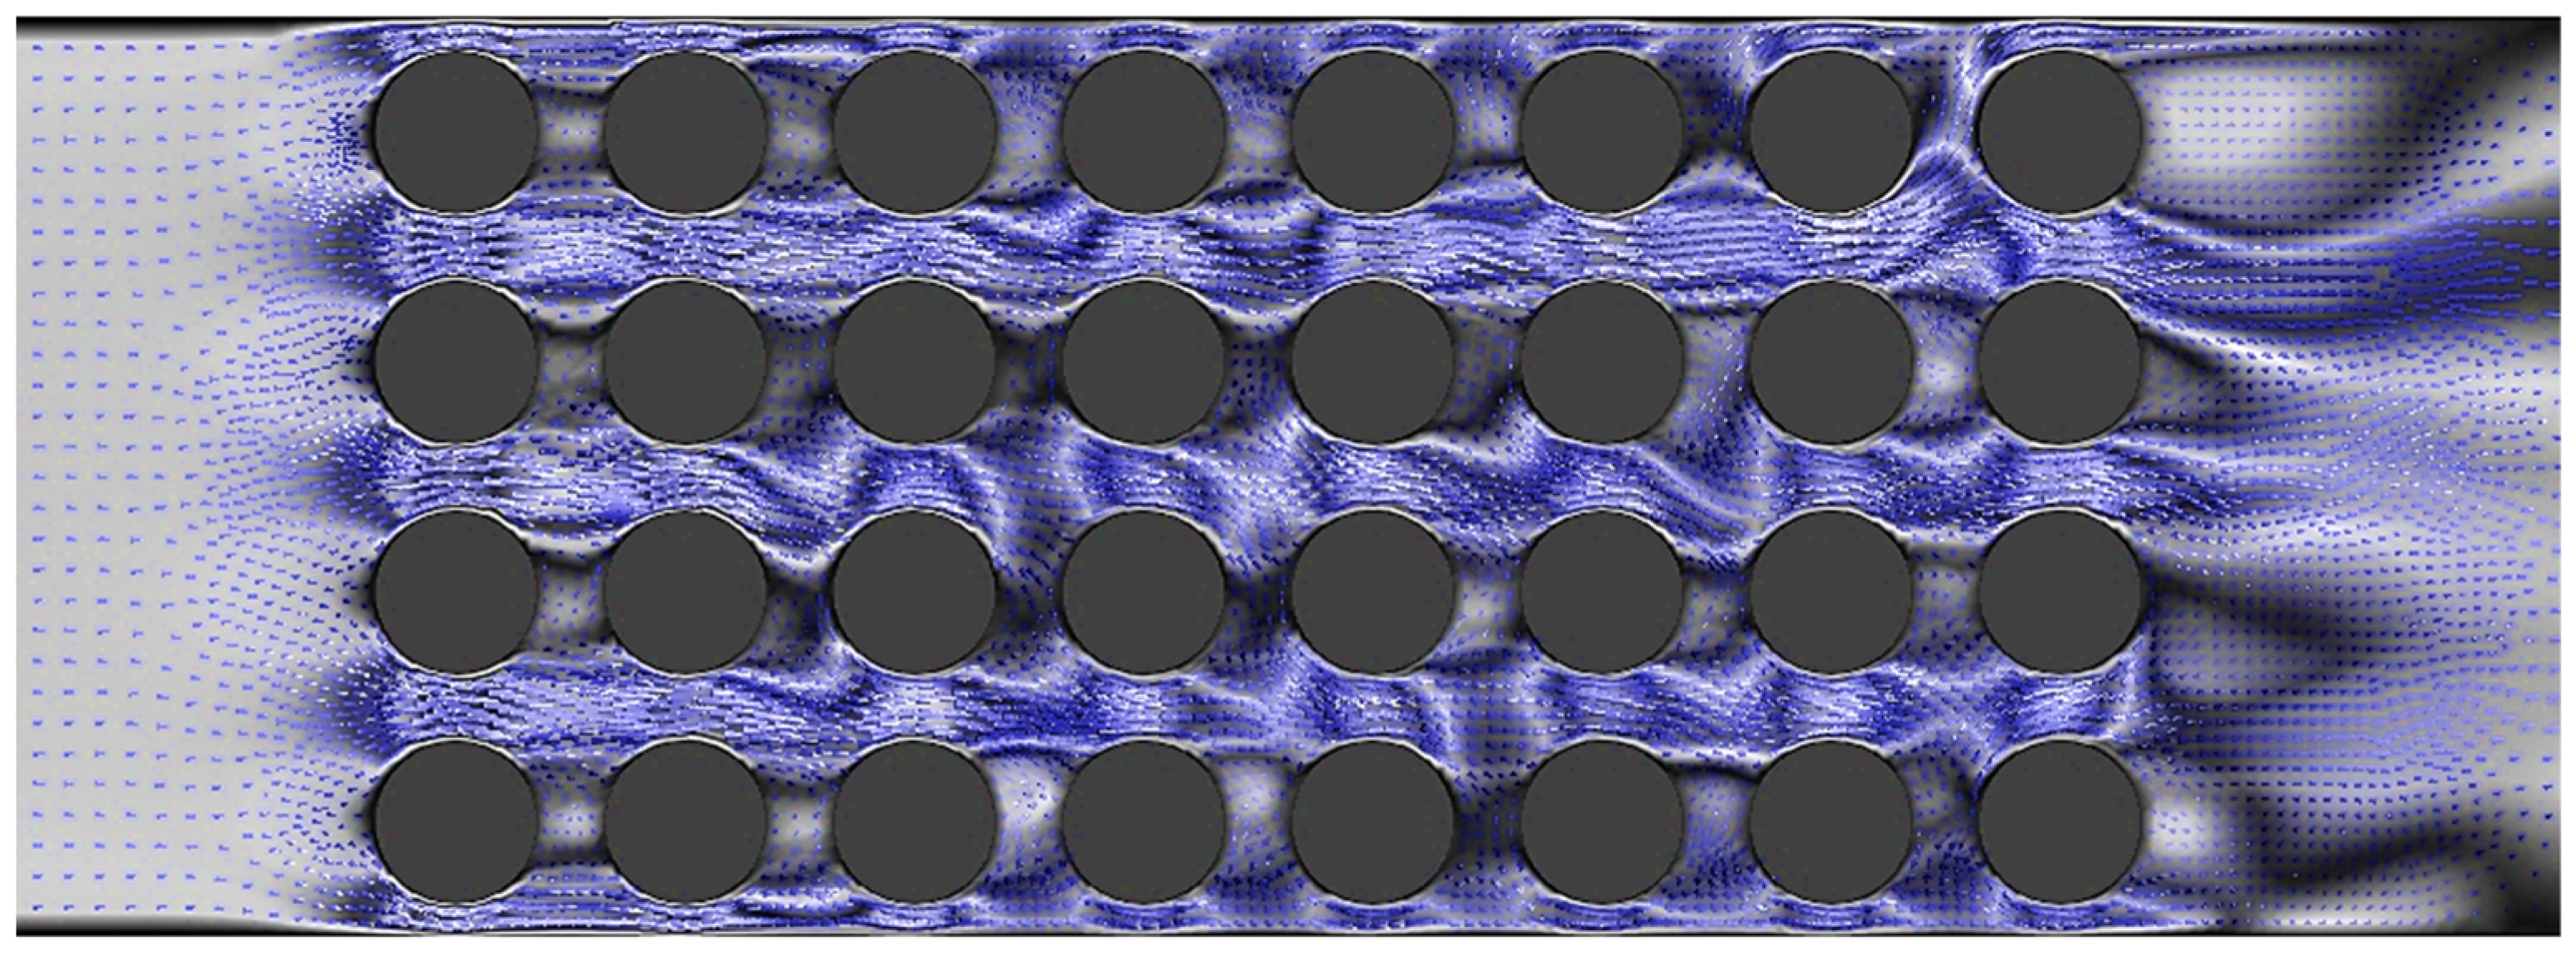
  • Our results revealed that the utilization of nanofluids results in higher vortex development and enhances heat transfer capabilities of the fluid. Through a comprehensive analysis, we found that Al2O3 exhibited superior heat transfer performance compared to CuO.
  • In the case of alumina, we observed that increasing the volume fraction led to improved performance. Similarly, for copper oxide, the performance showed an improvement compared to the base fluid. However, it is worth noting that alumina outperformed CuO, with an average enhancement of 4.37%.
  • Due to the possibility of nanoparticle clustering, we found that the optimum performance was achieved at a volume fraction of 5% for Al2O3. This indicates that lower volume fractions can exhibit the opposite effect, reducing the impact on the heat transfer.
  • Increasing the velocity of the fluid led to enhanced turbulence, which in turn improved the heat transfer performance. However, this improvement came at the expense of a higher pressure drop.
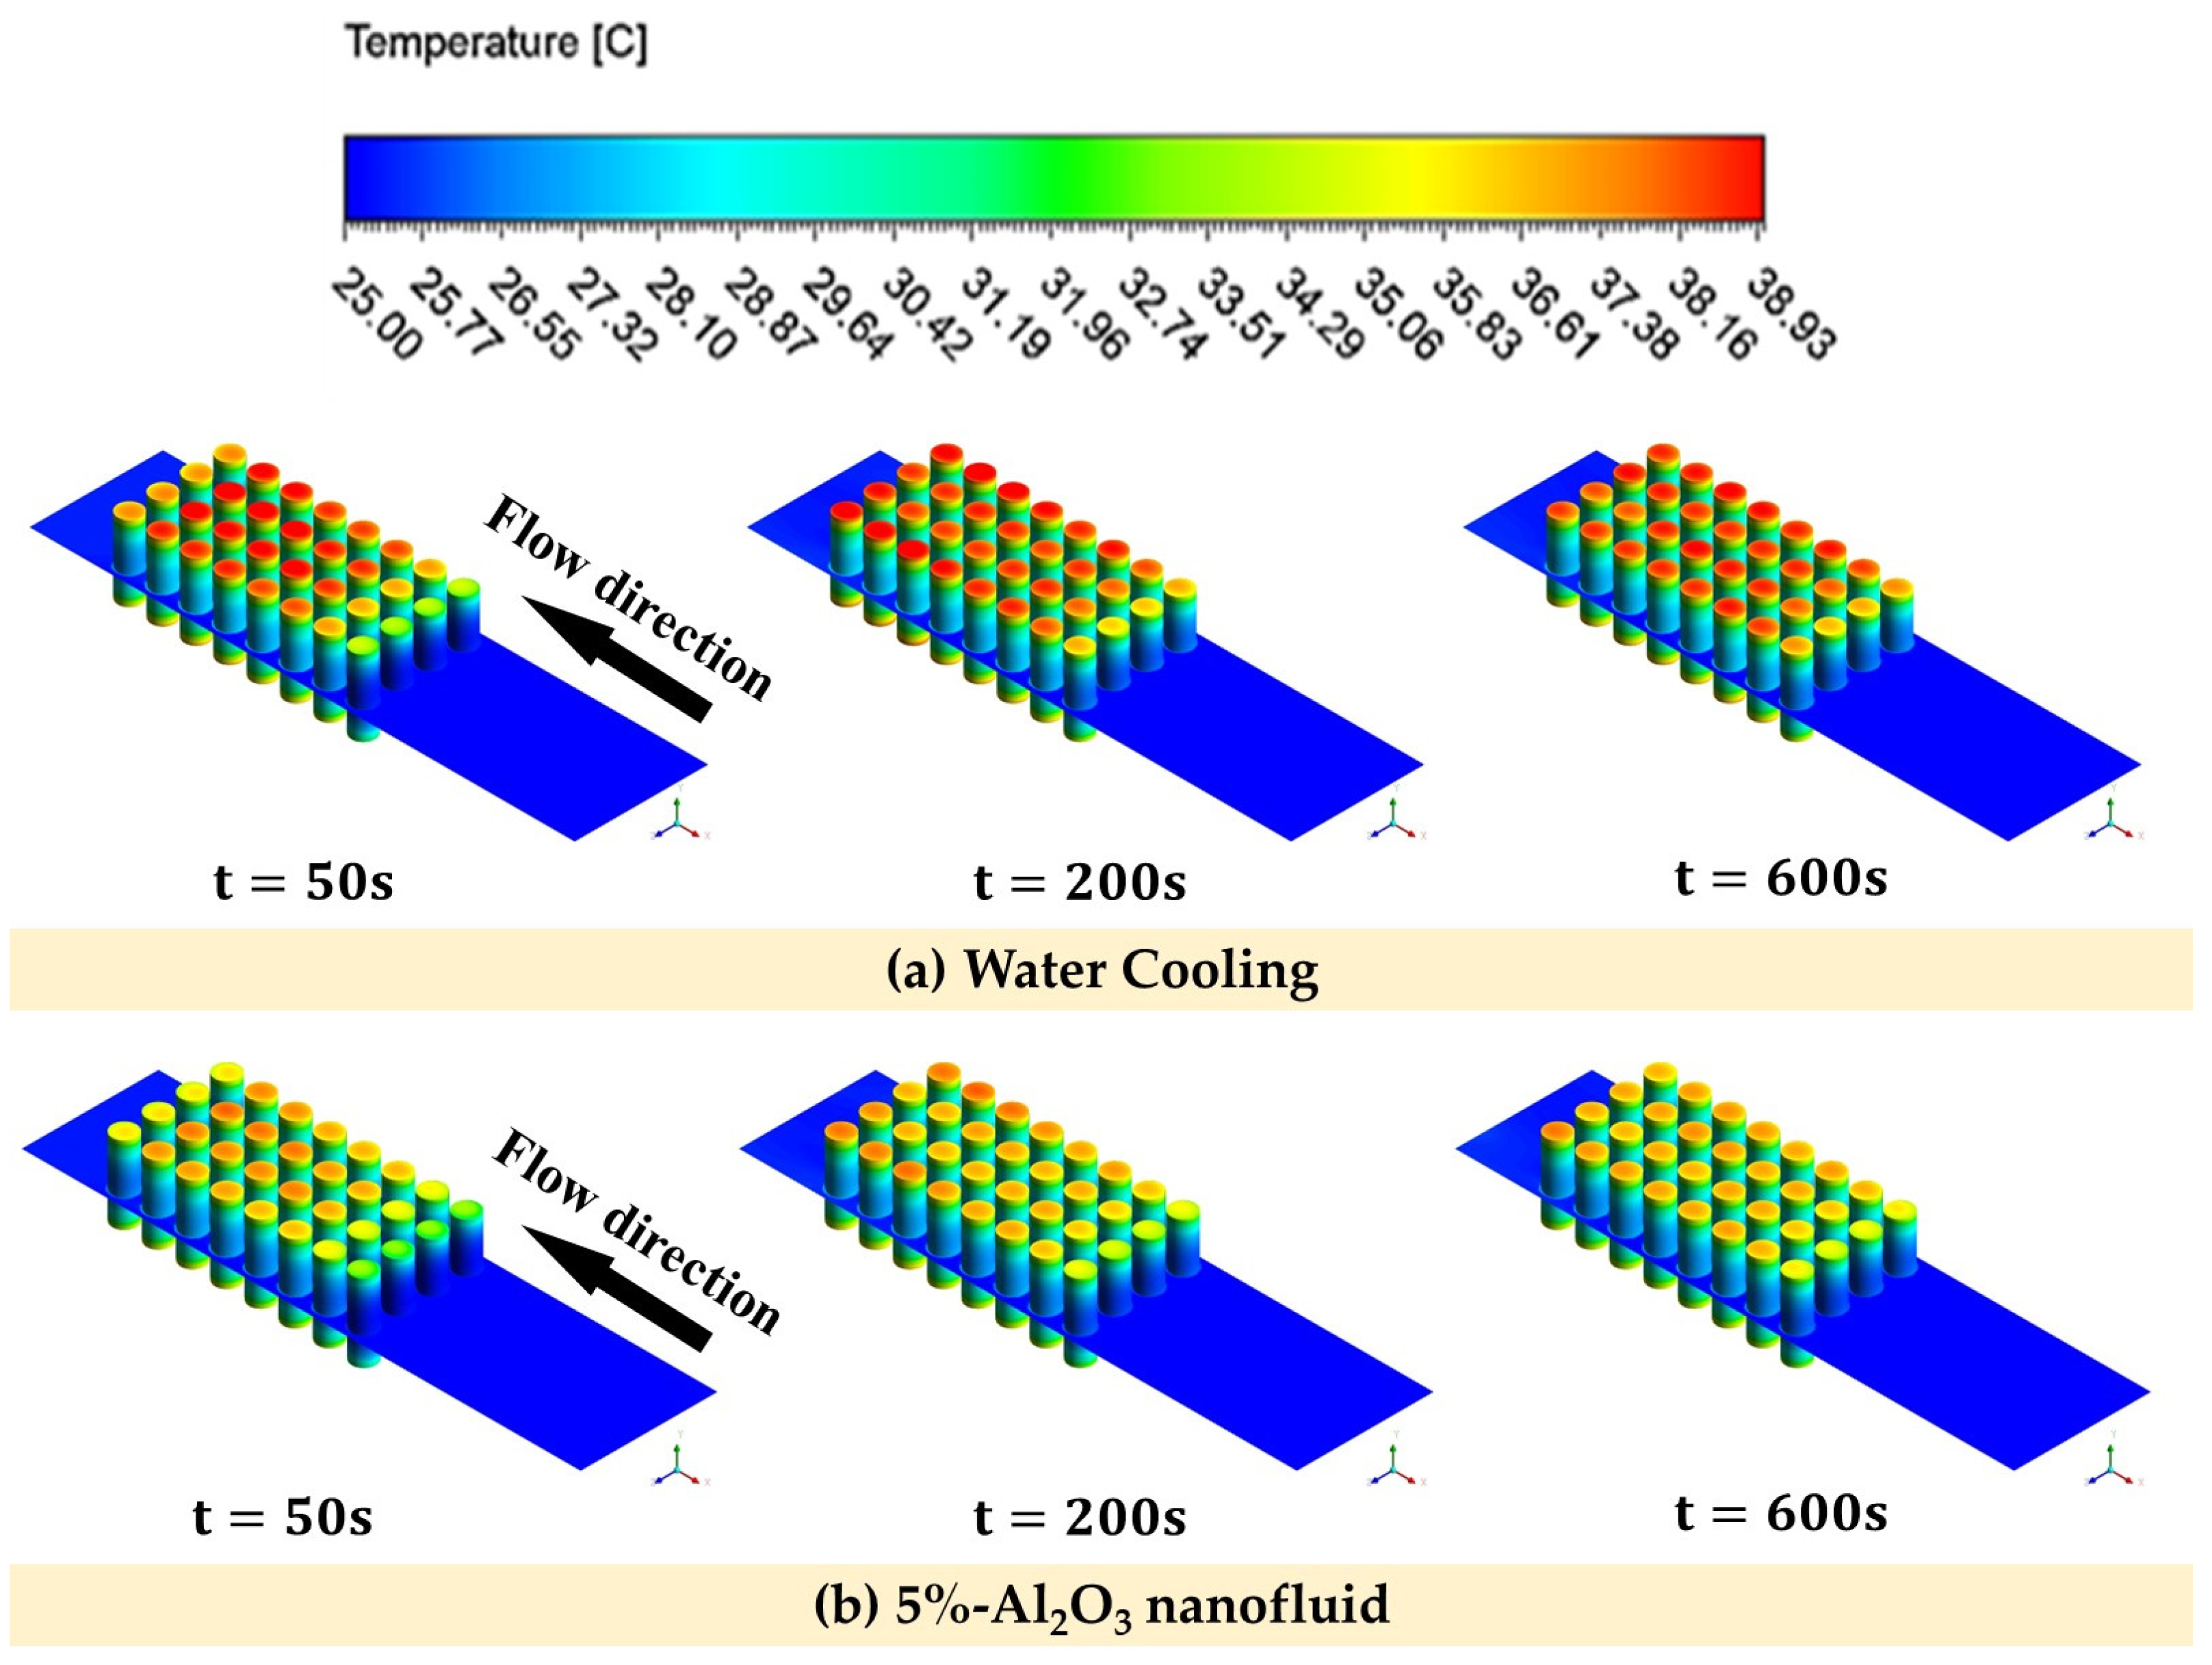
  • During the transient analysis, it was observed that the utilization of 5% Al2O3 and CuO nanofluids resulted in a reduction in the temperature of the batteries. Specifically, the Al2O3 nanofluid exhibited a temperature reduction of 7.89% compared to the base fluid, and the CuO nanofluid showed a reduction of 4.73%.
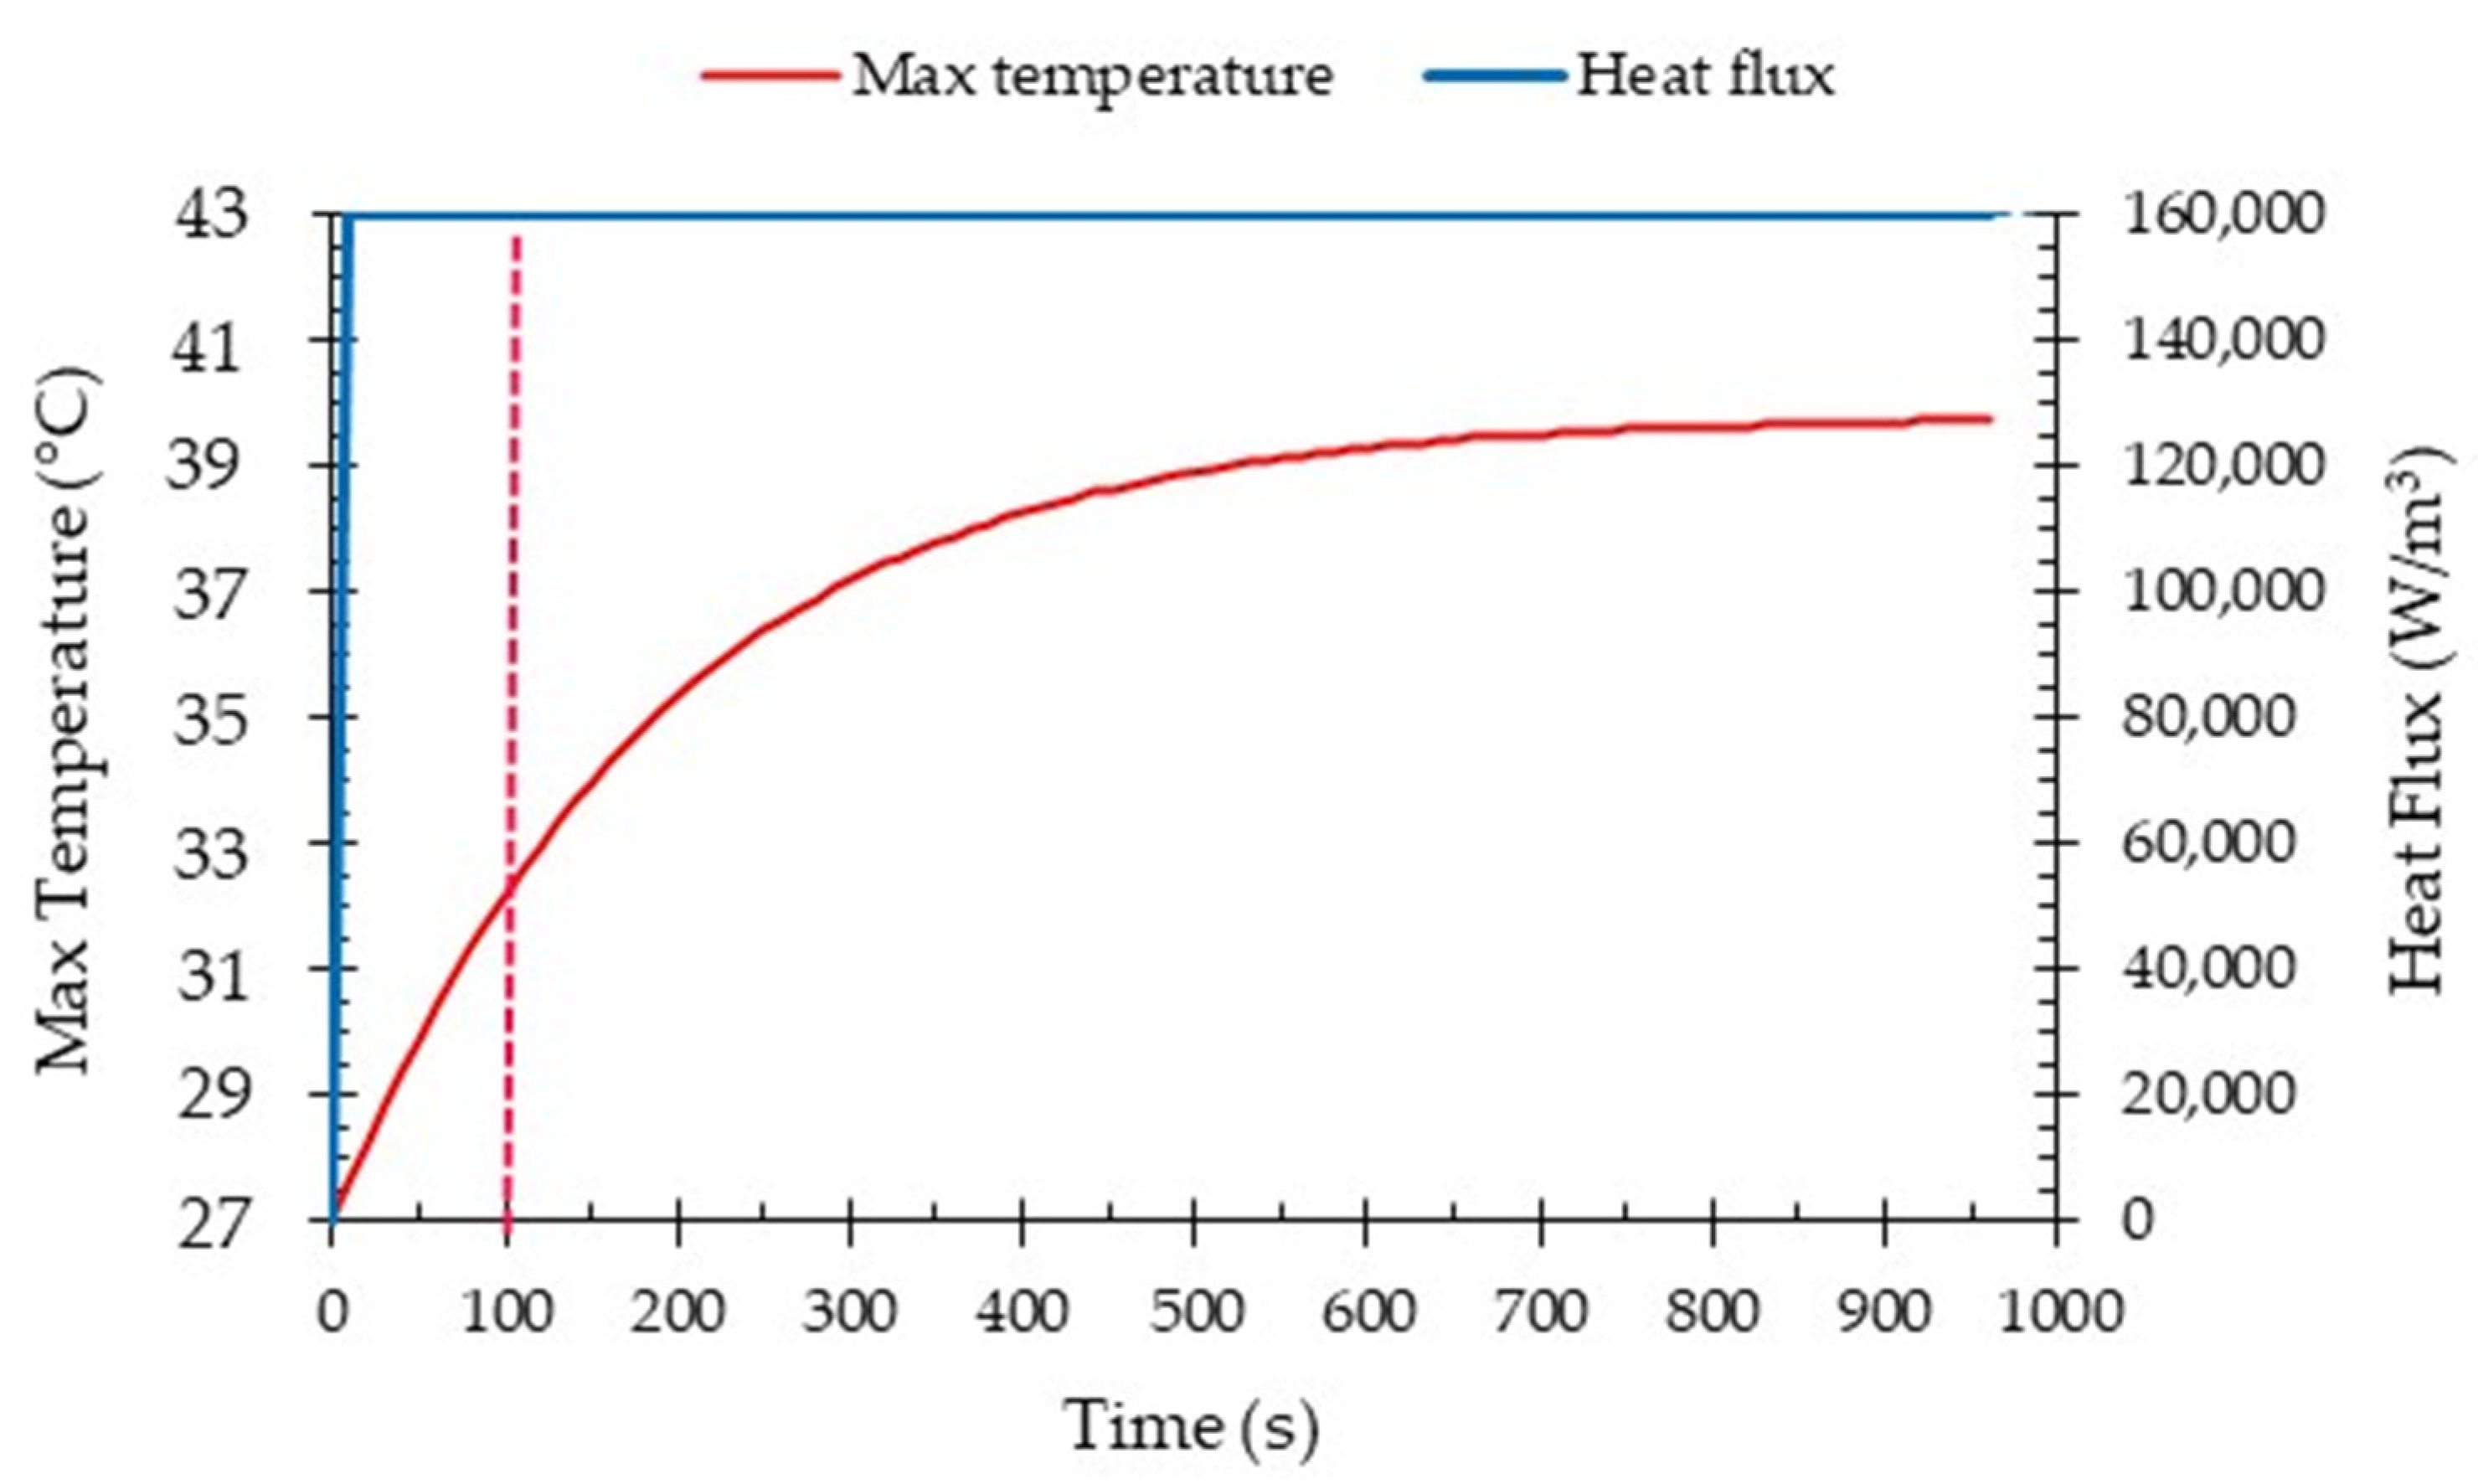
  • In the high-performance mode, the temperature of the batteries was effectively maintained within a safe range through the utilization of liquid cooling. Furthermore, even after operating under the highest power requirement for 600 s, the temperature of the batteries remained within the designated safe range. This demonstrates the effectiveness of the liquid cooling system in managing and controlling the temperature of the batteries even during high demand operations.
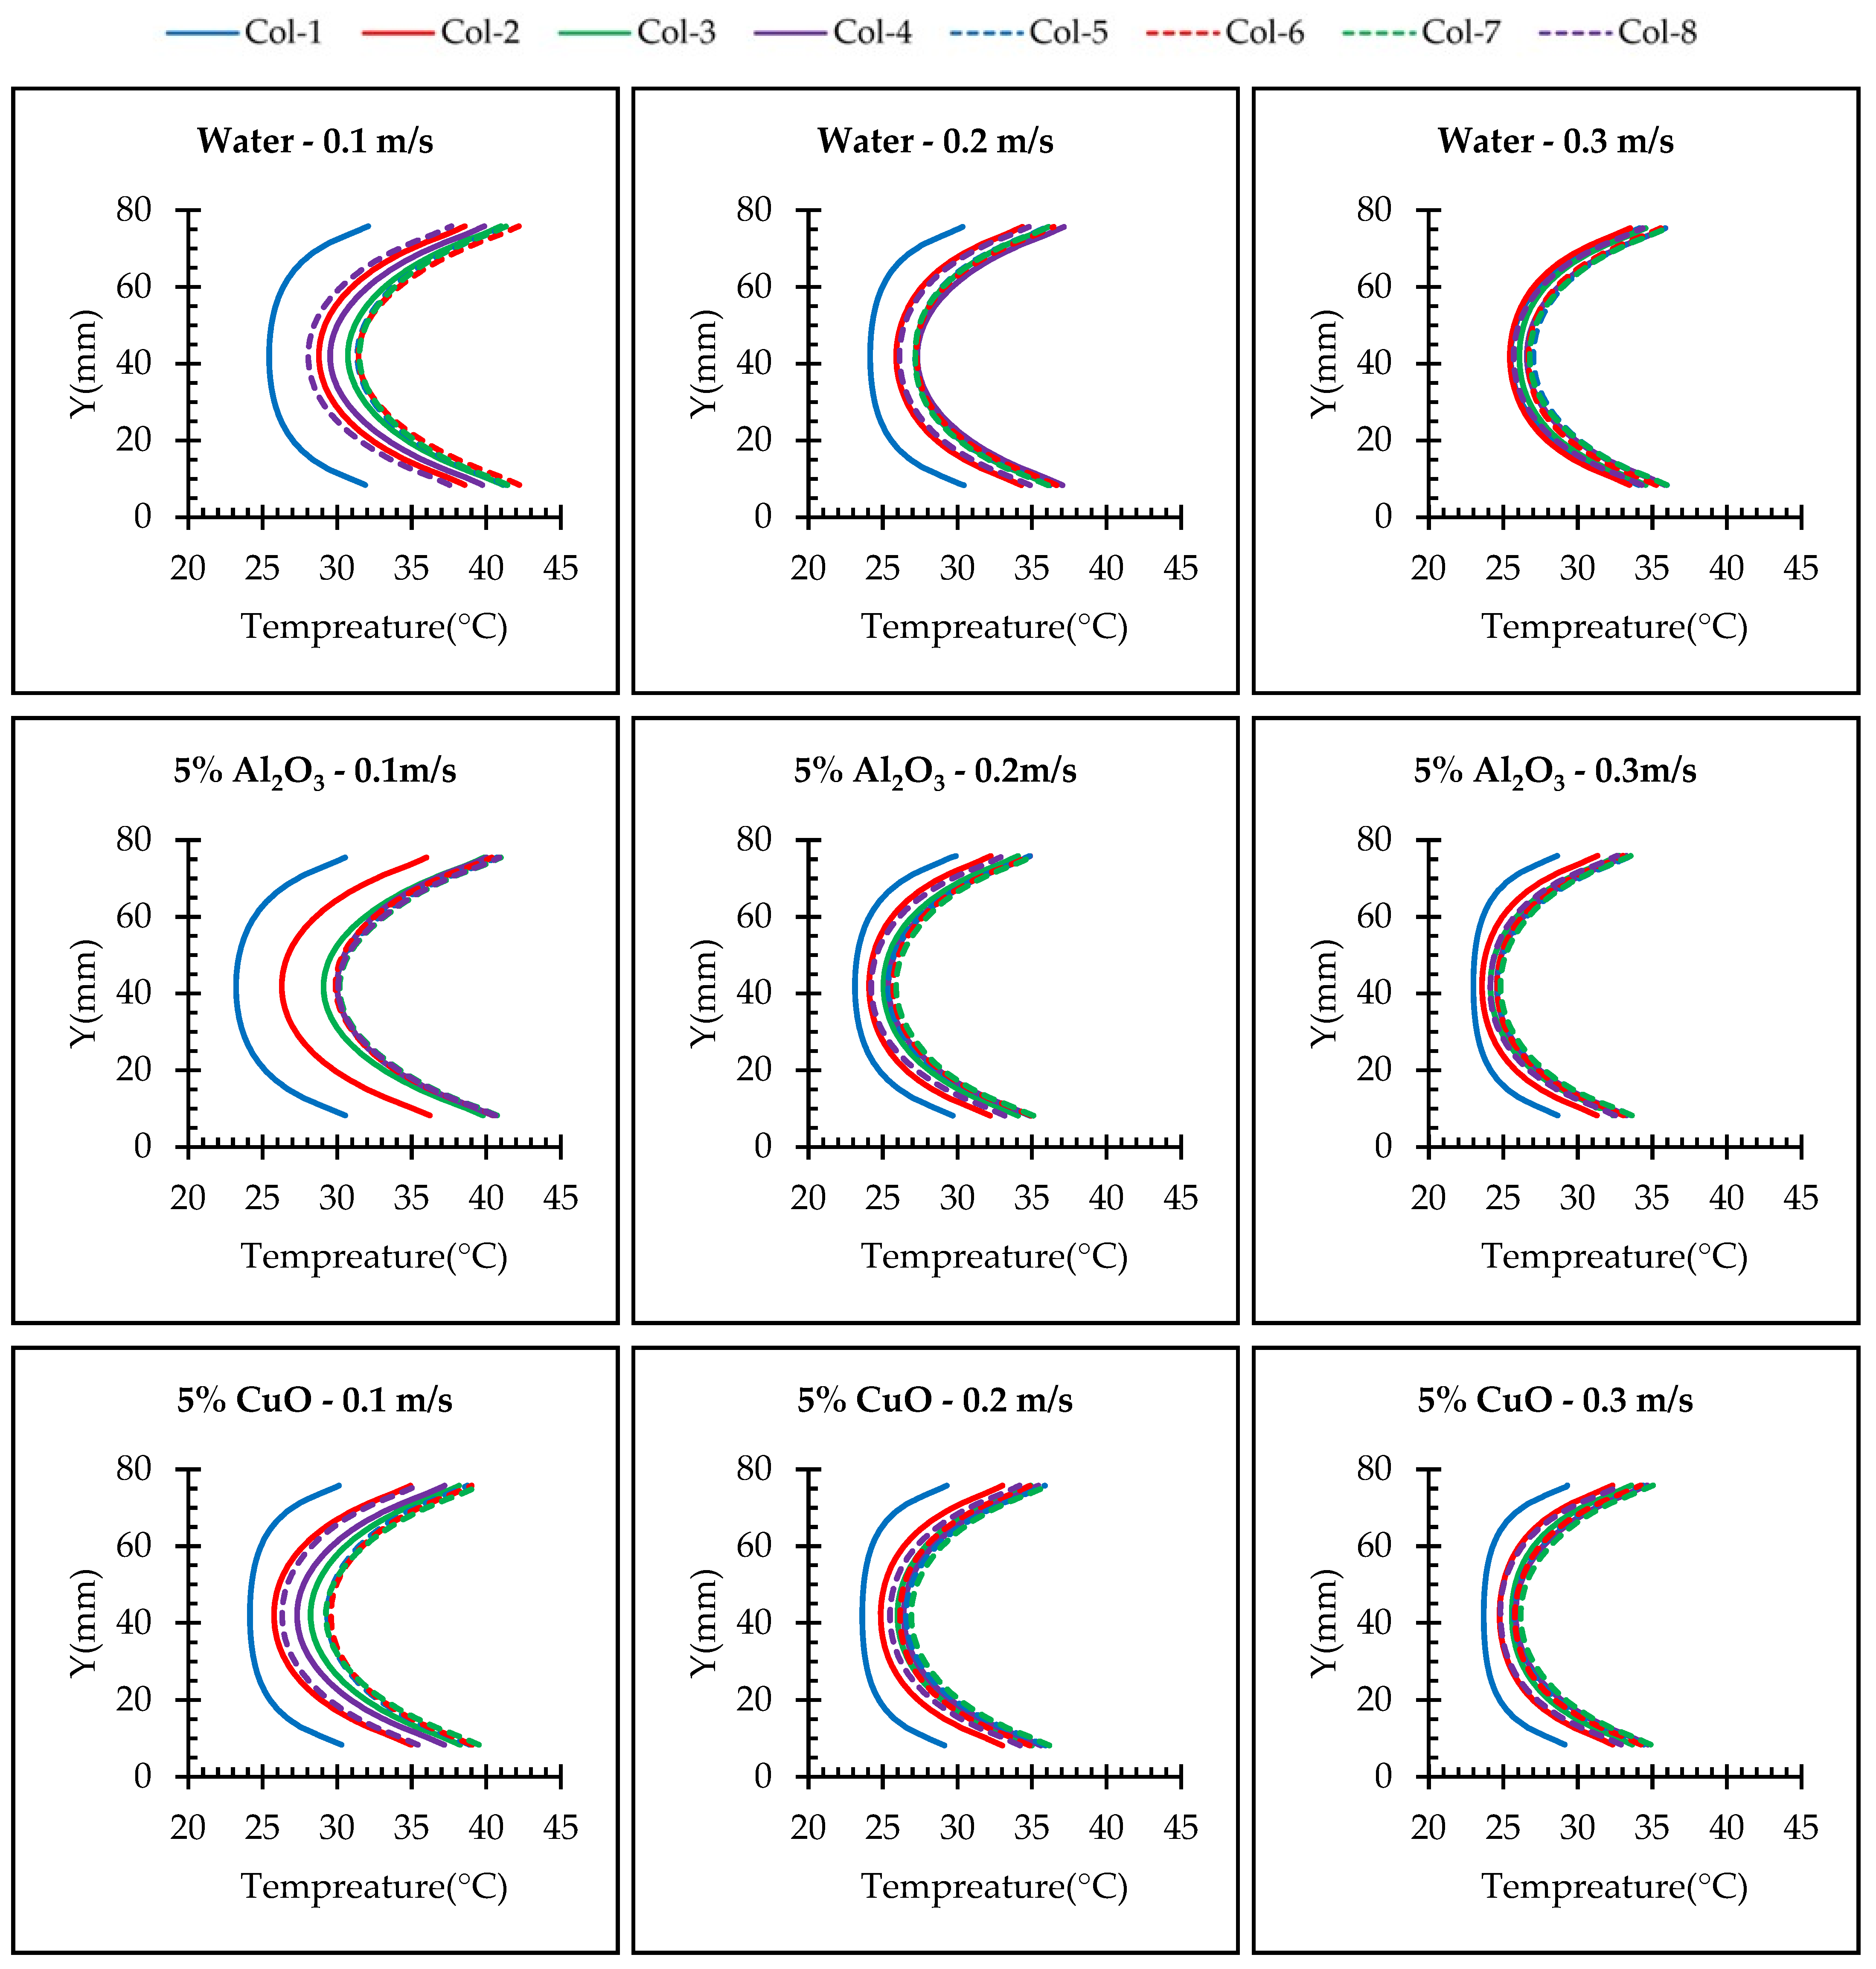
  • To ensure the batteries’ temperature remained within a safe range during moderate operation mode (2C discharge rate), the maximum inlet coolant velocity considered was set at 0.1 m/s. However, for the high-performance operation mode (5C discharge rate), which depends on the specific conditions, it is necessary to increase the inlet coolant velocity to 0.3 m/s. This adjustment is aimed at achieving improved temperature uniformity and ensuring a safe temperature range.

Author Contributions

P.S.: Writing (Original Draft, Review and Editing), Methodology, Investigation, Data Curation, Visualization; E.S.: Writing (Original Draft), Methodology, Investigation, Data Curation, Visualization; J.J.: Writing (Original Draft), Investigation, Data Curation, Visualization; M.B.: Writing (Original Draft, Review and Editing), Data Curation, Supervision, Methodology, Conceptualization; A.N.: Writing (Review and Editing), Supervision, Conceptualization; R.M.: Writing (Review and Editing), Supervision, Conceptualization; Z.A.: Writing (Original Draft), Methodology; Y.M.: Writing (Original Draft), Visualization. All authors have read and agreed to the published version of the manuscript.

Funding

This research received no external funding.

Data Availability Statement

Not applicable.

Conflicts of Interest

The authors declare no conflict of interest.

References

  1. Abdallah, S.R.; Elsemary, I.M.; Altohamy, A.A.; Abdelrahman, M.; Attia, A.A.; Abdellatif, O.E. Experimental investigation on the effect of using nano fluid (Al2O3-Water) on the performance of PV/T system. Therm. Sci. Eng. Prog. 2018, 7, 1–7. [Google Scholar] [CrossRef]
  2. Soleymani, P.; Saedodin, S.; Rostamian, S.H.; Karimi, N. Experimental investigation of a hybridized flat-plate solar collector/gas burner for low-carbon production of hot water–Analysis of energy, exergy, and GHG emissions. Sustain. Energy Technol. Assess. 2023, 55, 102918. [Google Scholar] [CrossRef]
  3. International Energy Agency (IEA). World Energy Outlook. Available online: https://www.iea.org/reports/world-energy-outlook-2010 (accessed on 5 May 2022).
  4. Panchal, S.; Dincer, I.; Agelin-Chaab, M.; Fowler, M.; Fraser, R. Uneven temperature and voltage distributions due to rapid discharge rates and different boundary conditions for series-connected LiFePO4 batteries. Int. Commun. Heat Mass Transf. 2017, 81, 210–217. [Google Scholar] [CrossRef]
  5. Tran, M.; Banister, D.; Bishop, J.D.; McCulloch, M.D. Realizing the electric-vehicle revolution. Nat. Clim. Change 2012, 2, 328–333. [Google Scholar] [CrossRef]
  6. Ouyang, D.; He, Y.; Chen, M.; Liu, J.; Wang, J. Experimental study on the thermal behaviors of lithium-ion batteries under discharge and overcharge conditions. J. Therm. Anal. Calorim. 2018, 132, 65–75. [Google Scholar] [CrossRef]
  7. Wang, Q.; Ping, P.; Zhao, X.; Chu, G.; Sun, J.; Chen, C. Thermal runaway caused fire and explosion of lithium ion battery. J. Power Sources 2012, 208, 210–224. [Google Scholar] [CrossRef]
  8. Pesaran, A.; Vlahinos, A.; Stuart, T. Cooling and Preheating of Batteries in Hybrid Electric Vehicles. In Proceedings of the 6th ASME-JSME Thermal Engineering Joint Conference, Kohala Coast, HI, USA, 16–20 March 2003; Citeseer: State College, PA, USA, 2003; pp. 1–7. [Google Scholar]
  9. Saeed, A.; Karimi, N.; Paul, M.C. Analysis of the unsteady thermal response of a Li-ion battery pack to dynamic loads. Energy 2021, 231, 120947. [Google Scholar] [CrossRef]
  10. Wu, X.; Wang, K.; Chang, Z.; Chen, Y.; Cao, S.; Lv, C.; Liu, H.; Wang, Y. Experimental and numerical study on hybrid battery thermal management system combining liquid cooling with phase change materials. Int. Commun. Heat Mass Transf. 2022, 139, 106480. [Google Scholar] [CrossRef]
  11. Verma, A.; Shashidhara, S.; Rakshit, D. A comparative study on battery thermal management using phase change material (PCM). Therm. Sci. Eng. Prog. 2019, 11, 74–83. [Google Scholar] [CrossRef]
  12. He, S.; Xiong, B.; Lei, H.; Dong, K.; Khan, S.A.; Zhao, J. Optimization of low-temperature preheating strategy for Li-ion batteries with supercooling phase change materials using response surface method. Int. Commun. Heat Mass Transf. 2023, 142, 106635. [Google Scholar] [CrossRef]
  13. Panchal, S.; Dincer, I.; Agelin-Chaab, M.; Fraser, R.; Fowler, M. Experimental temperature distributions in a prismatic lithium-ion battery at varying conditions. Int. Commun. Heat Mass Transf. 2016, 71, 35–43. [Google Scholar] [CrossRef]
  14. Pesaran, A.A. Battery thermal management in EV and HEVs: Issues and solutions. Battery Man 2001, 43, 34–49. [Google Scholar]
  15. Pesaran, A.A.; Vlahinos, A.; Burch, S.D. Thermal Performance of EV and HEV Battery Modules and Packs; National Renewable Energy Laboratory: Golden, CO, USA, 1997. Available online: https://www.nrel.gov/docs/legosti/old/23527.pdf (accessed on 5 May 2022).
  16. Pesaran, A.; Keyser, M.; Burch, S. An Approach for Designing Thermal Management Systems for Electric and Hybrid Vehicle Battery Packs; National Renewable Energy Laboratory: Golden, CO, USA, 1999. Available online: https://www.nrel.gov/docs/fy99osti/25992.pdf (accessed on 5 May 2022).
  17. Keyser, M.; Pesaran, A.; Oweis, S.; Chagnon, G.; Ashtiani, C. Thermal Evaluation and Performance of High-Power Lithium-Ion Cells; National Renewable Energy Lab. (NREL): Golden, CO, USA, 2000. Available online: https://www.nrel.gov/docs/fy99osti/26616.pdf (accessed on 5 May 2022).
  18. Wu, W.; Wang, S.; Wu, W.; Chen, K.; Hong, S.; Lai, Y. A critical review of battery thermal performance and liquid based battery thermal management. Energy Convers. Manag. 2019, 182, 262–281. [Google Scholar] [CrossRef]
  19. Zhang, Q.; White, R.E. Capacity fade analysis of a lithium ion cell. J. Power Sources 2008, 179, 793–798. [Google Scholar] [CrossRef]
  20. Chen, H.-Q.; Wang, X.; He, L.; Chen, P.; Wan, Y.; Yang, L.; Jiang, S. Chinese energy and fuels research priorities and trend: A bibliometric analysis. Renew. Sustain. Energy Rev. 2016, 58, 966–975. [Google Scholar] [CrossRef]
  21. Shahid, S.; Agelin-Chaab, M. Development and analysis of a technique to improve air-cooling and temperature uniformity in a battery pack for cylindrical batteries. Therm. Sci. Eng. Prog. 2018, 5, 351–363. [Google Scholar] [CrossRef]
  22. Fan, Y.; Bao, Y.; Ling, C.; Chu, Y.; Tan, X.; Yang, S. Experimental study on the thermal management performance of air cooling for high energy density cylindrical lithium-ion batteries. Appl. Therm. Eng. 2019, 155, 96–109. [Google Scholar] [CrossRef]
  23. Liang, J.; Gan, Y.; Li, Y.; Tan, M.; Wang, J. Thermal and electrochemical performance of a serially connected battery module using a heat pipe-based thermal management system under different coolant temperatures. Energy 2019, 189, 116233. [Google Scholar] [CrossRef]
  24. Deng, Y.; Feng, C.; E, J.; Zhu, H.; Chen, J.; Wen, M.; Yin, H. Effects of different coolants and cooling strategies on the cooling performance of the power lithium ion battery system: A review. Appl. Therm. Eng. 2018, 142, 10–29. [Google Scholar] [CrossRef]
  25. Kalbasi, R. Introducing a novel heat sink comprising PCM and air-Adapted to electronic device thermal management. Int. J. Heat Mass Transf. 2021, 169, 120914. [Google Scholar] [CrossRef]
  26. Shahsavani, E.; Afrand, M.; Kalbasi, R. Using experimental data to estimate the heat transfer and pressure drop of non-Newtonian nanofluid flow through a circular tube: Applicable for use in heat exchangers. Appl. Therm. Eng. 2018, 129, 1573–1581. [Google Scholar] [CrossRef]
  27. Choi, S.U.; Eastman, J.A. Enhancing Thermal Conductivity of Fluids with Nanoparticles; Argonne National Lab. (ANL): Argonne, IL, USA, 1995. Available online: https://www.osti.gov/servlets/purl/196525 (accessed on 5 May 2022).
  28. Islam, M.R.; Shabani, B.; Rosengarten, G.; Andrews, J. The potential of using nanofluids in PEM fuel cell cooling systems: A review. Renew. Sustain. Energy Rev. 2015, 48, 523–539. [Google Scholar] [CrossRef]
  29. Moghadasi, R.; Rostami, A.; Hemmati-Sarapardeh, A. Application of nanofluids for treating fines migration during hydraulic fracturing: Experimental study and mechanistic understanding. Adv. Geo-Energy Res. 2019, 3, 198–206. [Google Scholar] [CrossRef]
  30. Guthrie, D.G.; Torabi, M.; Karimi, N. Combined heat and mass transfer analyses in catalytic microreactors partially filled with porous material-The influences of nanofluid and different porous-fluid interface models. Int. J. Therm. Sci. 2019, 140, 96–113. [Google Scholar] [CrossRef]
  31. Alizadeh, R.; Abad, J.M.N.; Fattahi, A.; Mohebbi, M.R.; Doranehgard, M.H.; Li, L.K.B.; Alhajri, E.; Karimi, N. A machine learning approach to predicting the heat convection and thermodynamics of an external flow of hybrid nanofluid. J. Energy Resour. Technol. 2021, 143, 070908. [Google Scholar] [CrossRef]
  32. Singh, D.; Toutbort, J.; Chen, G. Heavy Vehicle Systems Optimization Merit Review and Peer Evaluation; Annual Report; Argonne National Laboratory: Lemont, IL, USA, 2006; Volume 23, pp. 405–411. [Google Scholar]
  33. Rashidi, S.; Karimi, N.; Sunden, B.; Kim, K.C.; Olabi, A.G.; Mahian, O. Progress and challenges on the thermal management of electrochemical energy conversion and storage technologies: Fuel cells, electrolysers, and supercapacitors. Prog. Energy Combust. Sci. 2022, 88, 100966. [Google Scholar] [CrossRef]
  34. Nguyen, Q.; Bahrami, D.; Kalbasi, R.; Bach, Q.V. Nanofluid flow through microchannel with a triangular corrugated wall: Heat transfer enhancement against entropy generation intensification. Math. Methods Appl. Sci. 2020. [Google Scholar] [CrossRef]
  35. Nadooshan, A.A.; Kalbasi, R.; Afrand, M. Perforated fins effect on the heat transfer rate from a circular tube by using wind tunnel: An experimental view. Heat Mass Transf. 2018, 54, 3047–3057. [Google Scholar] [CrossRef]
  36. Huo, Y.; Rao, Z. The numerical investigation of nanofluid based cylinder battery thermal management using lattice Boltzmann method. Int. J. Heat Mass Transf. 2015, 91, 374–384. [Google Scholar] [CrossRef]
  37. Sharma, D.K.; Prabhakar, A. A review on air cooled and air centric hybrid thermal management techniques for Li-ion battery packs in electric vehicles. J. Energy Storage 2021, 41, 102885. [Google Scholar] [CrossRef]
  38. Rahmati, A.R.; Akbari, O.A.; Marzban, A.; Toghraie, D.; Karimi, R.; Pourfattah, F. Simultaneous investigations the effects of non-Newtonian nanofluid flow in different volume fractions of solid nanoparticles with slip and no-slip boundary conditions. Therm. Sci. Eng. Prog. 2018, 5, 263–277. [Google Scholar] [CrossRef]
  39. Khan, S.A.; Eze, C.; Dong, K.; Shahid, A.R.; Patil, M.S.; Ahmad, S.; Hussain, I.; Zhao, J. Design of a new optimized U-shaped lightweight liquid-cooled battery thermal management system for electric vehicles: A machine learning approach. Int. Commun. Heat Mass Transf. 2022, 136, 106209. [Google Scholar] [CrossRef]
  40. Saeed, A.; Karimi, N.; Paul, M.C. Computational assessment of the thermal response of a Li-ion battery module to transient loads. J. Power Sources 2022, 552, 232217. [Google Scholar] [CrossRef]
  41. Wang, H.; He, F.; Ma, L. Experimental and modeling study of controller-based thermal management of battery modules under dynamic loads. Int. J. Heat Mass Transf. 2016, 103, 154–164. [Google Scholar] [CrossRef]
  42. Ling, Z.; Wang, F.; Fang, X.; Gao, X.; Zhang, Z. A hybrid thermal management system for lithium ion batteries combining phase change materials with forced-air cooling. Appl. Energy 2015, 148, 403–409. [Google Scholar] [CrossRef]
  43. Li, B.; Mao, Z.; Song, B.; Chen, P.; Wang, H.; Sunden, B.; Wang, Y.-F. Enhancement of phase change materials by nanoparticles to improve battery thermal management for autonomous underwater vehicles. Int. Commun. Heat Mass Transf. 2022, 137, 106301. [Google Scholar] [CrossRef]
  44. Chen, R.; Ge, X.; Zhong, Y.; Jiang, L.; Zhang, G.; Zhang, J.; Ke, X. Experimental study of phase change microcapsule-based liquid cooling for battery thermal management. Int. Commun. Heat Mass Transf. 2023, 146, 106912. [Google Scholar] [CrossRef]
  45. Yu, X.; Lu, Z.; Zhang, L.; Wei, L.; Cui, X.; Jin, L. Experimental study on transient thermal characteristics of stagger-arranged lithium-ion battery pack with air cooling strategy. Int. J. Heat Mass Transf. 2019, 143, 118576. [Google Scholar] [CrossRef]
  46. Sarah, M.; Jacob, T.; Jacopo, T. Tracking Report-November 2021; International Energy Agency (IEA): Paris, France, 2021; Available online: https://www.iea.org/reports/tracking-transport-2021 (accessed on 5 May 2022).
  47. Hssain, M.A.; Mir, R.; El Hammami, Y. Numerical Simulation of the cooling of heated electronic blocks in horizontal channel by mixed convection of nanofluids. J. Nanomater. 2020, 2020, 4187074. [Google Scholar] [CrossRef]
  48. Zhao, J.; Rao, Z.; Li, Y. Thermal performance of mini-channel liquid cooled cylinder based battery thermal management for cylindrical lithium-ion power battery. Energy Convers. Manag. 2015, 103, 157–165. [Google Scholar] [CrossRef]
  49. Zhou, H.; Zhou, F.; Xu, L.; Kong, J. Thermal performance of cylindrical Lithium-ion battery thermal management system based on air distribution pipe. Int. J. Heat Mass Transf. 2019, 131, 984–998. [Google Scholar] [CrossRef]
  50. Zhang, F.; Lin, A.; Wang, P.; Liu, P. Optimization design of a parallel air-cooled battery thermal management system with spoilers. Appl. Therm. Eng. 2021, 182, 116062. [Google Scholar] [CrossRef]
  51. Zhang, H.; Li, C.; Zhang, R.; Lin, Y.; Fang, H. Thermal analysis of a 6s4p Lithium-ion battery pack cooled by cold plates based on a multi-domain modeling framework. Appl. Therm. Eng. 2020, 173, 115216. [Google Scholar] [CrossRef]
  52. Tran, M.-K.; Mevawala, A.; Panchal, S.; Raahemifar, K.; Fowler, M.; Fraser, R. Effect of integrating the hysteresis component to the equivalent circuit model of Lithium-ion battery for dynamic and non-dynamic applications. J. Energy Storage 2020, 32, 101785. [Google Scholar] [CrossRef]
  53. Heenan, T.M.M.; Jnawali, A.; Kok, M.D.R.; Tranter, T.G.; Tan, C.; Dimitrijevic, A.; Jervis, R.; Brett, D.J.I.; Shearing, P.R. An advanced microstructural and electrochemical datasheet on 18650 Li-ion batteries with nickel-rich NMC811 cathodes and graphite-silicon anodes. J. Electrochem. Soc. 2020, 167, 140530. [Google Scholar] [CrossRef]
  54. Reis, G.D.; Strange, C.; Yadav, M.; Li, S. Lithium-ion battery data and where to find it. Energy AI 2021, 5, 100081. [Google Scholar] [CrossRef]
  55. Patil, M.S.; Seo, J.-H.; Lee, M.-Y. A novel dielectric fluid immersion cooling technology for Li-ion battery thermal management. Energy Convers. Manag. 2021, 229, 113715. [Google Scholar] [CrossRef]
  56. Kim, G.-H.; Smith, K.; Lee, K.-J.; Santhanagopalan, S.; Pesaran, A. Multi-domain modeling of lithium-ion batteries encompassing multi-physics in varied length scales. J. Electrochem. Soc. 2011, 158, A955. [Google Scholar] [CrossRef]
  57. Kim, J.; Oh, J.; Lee, H. Review on battery thermal management system for electric vehicles. Appl. Therm. Eng. 2019, 149, 192–212. [Google Scholar] [CrossRef]
  58. EVcompare. Available online: https://evcompare.io/cars/tesla/tesla_model_s_100d/ (accessed on 5 May 2022).
  59. Fluent, A. Ansys Fluent Theory Guide; Ansys Inc.: Canonsburg, PA, USA, 2011; Volume 15317, pp. 724–746. [Google Scholar]
  60. Bejan, A. Convection Heat Transfer; John Wiley & Sons: Hoboken, NJ, USA, 2013. [Google Scholar]
  61. Xu, Y.; Zhang, H.; Xu, X.; Wang, X. Numerical analysis and surrogate model optimization of air-cooled battery modules using double-layer heat spreading plates. Int. J. Heat Mass Transf. 2021, 176, 121380. [Google Scholar] [CrossRef]
  62. Panchal, S.; Khasow, R.; Dincer, I.; Agelin-Chaab, M.; Fraser, R.; Fowler, M. Numerical modeling and experimental investigation of a prismatic battery subjected to water cooling. Numer. Heat Transf. Part A Appl. 2017, 71, 626–637. [Google Scholar] [CrossRef]
  63. Panchal, S.; Khasow, R.; Dincer, I.; Agelin-Chaab, M.; Fraser, R.; Fowler, M. Thermal design and simulation of mini-channel cold plate for water cooled large sized prismatic lithium-ion battery. Appl. Therm. Eng. 2017, 122, 80–90. [Google Scholar] [CrossRef]
  64. Kalkan, O.; Celen, A.; Bakirci, K. Multi-objective optimization of a mini channeled cold plate for using thermal management of a Li-Ion battery. Energy 2022, 251, 123949. [Google Scholar] [CrossRef]
  65. Lu, Y.; Wang, J.; Liu, F.; Liu, Y.; Wang, F.; Yang, N.; Lu, D.; Jia, Y. Performance optimisation of Tesla valve-type channel for cooling lithium-ion batteries. Appl. Therm. Eng. 2022, 212, 118583. [Google Scholar] [CrossRef]
  66. Wan, C. Battery space optimization to limit heat transfer in a lithium-ion battery using adaptive elephant herding optimization. Ionics 2020, 26, 4993–5009. [Google Scholar] [CrossRef]
  67. Soleymani, P.; Ma, Y.; Saffarifard, E.; Mohebbi, R.; Babaie; Karimi, N.; Saedodin, S. Numerical investigation on turbulent flow, heat transfer, and entropy generation of water-based magnetic nanofluid flow in a tube with hemisphere porous under a uniform magnetic field. Int. Commun. Heat Mass Transf. 2022, 137, 106308. [Google Scholar] [CrossRef]
  68. Pak, B.C.; Cho, Y.I. Hydrodynamic and heat transfer study of dispersed fluids with submicron metallic oxide particles. Exp. Heat Transf. Int. J. 1998, 11, 151–170. [Google Scholar] [CrossRef]
  69. Mehta, S.; Chauhan, K.P.; Kanagaraj, S. Modeling of thermal conductivity of nanofluids by modifying Maxwell’s equation using cell model approach. J. Nanopart. Res. 2011, 13, 2791–2798. [Google Scholar] [CrossRef]
  70. Brinkman, H.C. The viscosity of concentrated suspensions and solutions. J. Chem. Phys. 1952, 20, 571. [Google Scholar] [CrossRef]
  71. Xuan, Y.; Roetzel, W. Conceptions for heat transfer correlation of nanofluids. Int. J. Heat Mass Transf. 2000, 43, 3701–3707. [Google Scholar] [CrossRef]
  72. Kiani, M.; Omiddezyani, S.; Houshfar, E.; Miremadi, S.R.; Ashjaee, M.; Nejad, A.M. Lithium-ion battery thermal management system with Al2O3/AgO/CuO nanofluids and phase change material. Appl. Therm. Eng. 2020, 180, 115840. [Google Scholar] [CrossRef]
  73. Colangelo, G.; Favale, E.; Milanese, M.; De Risi, A.; Laforgia, D. Cooling of electronic devices: Nanofluids contribution. Appl. Therm. Eng. 2017, 127, 421–435. [Google Scholar] [CrossRef]
Figure 1. (a) The schematic of the battery pack. (b) The general schematic diagram of the battery pack cooling loop.
Fluids 08 00261 g001aFluids 08 00261 g001b
Figure 2. Methodology for CFD modeling of this study.
Fluids 08 00261 g002
Figure 3. Comparison of the maximum temperature rise with an air inlet velocity of 0.6 m/s at a 2C discharge rate between simulation and Fan et al. [22].
Fluids 08 00261 g003
Figure 4. Thermal performance of air cooling for the battery packs at different velocities in simulation at a 2C discharge rate compared to Fan et al. [22].
Fluids 08 00261 g004
Figure 5. The structural meshing of the model: (a) isometric system, (b) lateral view, (c) side view.
Fluids 08 00261 g005
Figure 6. Mesh independence study for various number of grids.
Fluids 08 00261 g006
Figure 7. Comparison of transient battery heat generation for different discharge rates of a battery cell.
Fluids 08 00261 g007
Figure 8. The profile of the temperature rises for different concentrations of nanoparticles at different velocities at a 2C discharge rate.
Fluids 08 00261 g008
Figure 9. Temperature distribution along the batteries in different columns for two different nanoparticles’ concentrations and three velocities at a 2C discharge rate.
Fluids 08 00261 g009
Figure 10. Comparison of average Nusselt number for different concentrations of nanoparticles at various velocities at a 2C discharge rate.
Fluids 08 00261 g010
Figure 11. Comparison of pressure drop with increasing velocity for different concentrations of nanoparticles.
Fluids 08 00261 g011
Figure 12. A schematic diagram of makeup fluid flows around the battery.
Fluids 08 00261 g012
Figure 13. Temperature contours of water at two different concentrations of Al2O3 and CuO at 0.05 m/s velocity: (a) 2% CuO, (b) 5% CuO, (c) 2% Al2O3, (d) 5% Al2O3. (e) Water at a 2C discharge rate.
Fluids 08 00261 g013
Figure 14. The maximum average temperature of the battery pack at a 2C discharge rate.
Fluids 08 00261 g014
Figure 15. The heat flux and temperature changes during the high-performance mode of 100 kW of the selected vehicle battery pack’s energy storage at a 5C discharge rate.
Fluids 08 00261 g015
Figure 16. The temperature differences along the batteries in a different row during the time step of 100 s in Figure 15 at a 5C discharge rate.
Fluids 08 00261 g016
Figure 17. Temperature contours of water and Al2O3 nanofluids during the 600 s time steps at 0.2 m/s at a 5C discharge rate.
Fluids 08 00261 g017
Table 1. Boundary conditions of the current investigation.
Boundary ConditionsValue
The velocity of the liquid at the inlet in a 2C (corresponds to vehicle moderate operation)0.05, 0.075, 0.1 m/s
The velocity of the liquid at the inlet in high-performance mode0.1, 0.2, 0.3 m/s
Outlet conditionPressure outlet
The initial temperature of nanofluid25 °C
Volumetric heat on batteries in 2C moderate operation48 kW/m3
Volumetric heat on batteries in high-performance model160 kW/m3
Other wallsNo-slip condition
Table 2. Specifications of the lithium-ion 18,650 battery.
Battery SpecificationsType and Values
ModelLG INR 18,650 MJ1
ChemicalLiCoMnO2
Nominal voltage (V)3.635
Nominal capacity (Ah)3.50
Minimum capacity (Ah)3.40
The nominal energy density (Wh/kg)260
Maximum charge voltage (V)4.2
Cut-off voltage (V)2.5
Operating temperature during charge (°C)0–45
Table 3. Thermophysical and mechanical properties of nanofluids and materials.
ParametersSI UnitWater
25 °C
[46]
Al2O3
[47]
CuO
Density (ρ)kg/m3997.139706450
Dynamic viscosity (µ)kg/ms0.0008905--
Specific heat (Cp)J/kgK3970765561
Thermal conductivity (K)W/mK0.59484020
Nanofluid volume concentration--0.5, 2, 3, 5%0.5, 2, 3, 5%
Table 4. Constants used in the standard k-ε turbulent model.
ConstantsCμCCσkσεσt
Values0.091.441.921.001.301.00
Table 5. Thermophysical properties of nanofluids.
Properties of
Nanofluid
CorrelationsModel
Effective density ρ nf = 1 φ ρ bf   +     φ ρ np Pak [68]
Effective
Thermal
Conductivity
k nf =   k bf k np   +   2 k bf   +   2 k np     k bf φ   k np   +   2 k bf     k np     k bf φ Maxwell [69]
Effective
Viscosity
µ nf = µ bf 1     φ 2.5 Brinkman [70]
Specific
Heat
Capacity
C p , nf = 1     φ ρ C p bf   +   φ ρ C p np ρ nf Xuan [71]
Table 6. The reduced temperature by utilizing nanofluids with different volume fractions at velocities compared to pure water at a 2C discharge rate.
Nanofluid
Concentrations
Al2O3CuO
0.05 m/s0.075 m/s0.1 m/s0.05 m/s0.075 m/s0.1 m/s
0.5%3.349.9310.502.104.6210.10
2%6.3213.6620.894.7211.8415.60
3%25.9337.4647.268.4418.1319.31
5%29.0746.0954.1812.6221.4321.99
Disclaimer/Publisher’s Note: The statements, opinions and data contained in all publications are solely those of the individual author(s) and contributor(s) and not of MDPI and/or the editor(s). MDPI and/or the editor(s) disclaim responsibility for any injury to people or property resulting from any ideas, methods, instructions or products referred to in the content.

